LAND DEGRADATION IN GIKONGORO, RWANDA: WORKING …Rwanda. Nevertheless it is hoped that the lessons...
36
Transcript of LAND DEGRADATION IN GIKONGORO, RWANDA: WORKING …Rwanda. Nevertheless it is hoped that the lessons...


LAND DEGRADATION IN GIKONGORO, RWANDA: PROBLEMS AND POSSIBILITIES IN THE INTEGRATION OF HOUSEHOLD SURVEY DATA AND ENVIRONMENTAL DATA RWANDA SOCIETY-ENVIRONMENT PROJECT WORKING PAPER 5 JUNE 1994 by Jennifer M. Olson Department of Geography and the Center for Advanced Study of International Development Michigan State University 315 Natural Science Building East Lansing, MI 48824-1115 tel: 517/355-4649 fax: 517/336-1671

© 1994, M.S.U. Board of Trustees All rights reserved. For information contact the Geography Department at the address given below. June 1994 Copies of this Working Paper as well as other papers in the series are available from: Geography Department Michigan State University 315 Natural Science Building East Lansing, Michigan 48824-1115 U.S.A. Telephone:517-355-4649 FAX:517-336-1671 MSU is an affirmative-action, equal-opportunity institution

CONTENTS Preface............................................................................................................................................... i I. Introduction .............................................................................................................................. 1 II. The Role of Household-Level Analysis ................................................................................... 1 III. Case Study: Gikongoro, Rwanda............................................................................................ 3 IV. Data Integration .................................................................................................................... 12 V. Discussion and Conclusions.................................................................................................. 17 VI. Bibliography ......................................................................................................................... 19 FIGURE AND TABLES Figure 1 Maps of Rwanda:............................................................................................................. 4 Table 1 Availability of Wood ..................................................................................................... 24 Table 2 Changes in Soil Fertility by Position on Hillside........................................................... 25 Table 3 Changes in Soil Fertility by Prefecture.......................................................................... 26 Table 4 Animal Fodder ............................................................................................................... 27 Table 5 Soil Additives and Land Use by Gender of Head of Household ................................... 28 Table 6 Possession of Animals by Gender of Head of Household ............................................. 29 Table 7 Field Management and Household Characteristics by Farm Size ................................. 30 Table 8 Field Characteristics by Slope ....................................................................................... 31

PREFACE The Rwanda Society-Environment Project has its origins in the work of the MSU Center for Advanced Study of International Development (CASID) Environment and Development Project. This project was begun in 1989 and was funded initially by the MSU Foundation. The Project has developed into a collaborative effort involving Michigan State University, the United Nations Environment Programme, Global Resources Information Database, and in Rwanda the Ministries of Agriculture and Environment and Tourism, and the National University. The objective of the Project is to assist in the improvement of analysis and policy making for natural resources management (NRM) in Africa through a pilot study in Rwanda to identify optimum and minimum data sets for NRM. The Working Papers are intended to serve as a forum for the research team to publish the initial research findings for discussion purposes. Working paper, 1 in this series presents an overview of the project's objectives and activities. Funding for the research project at Michigan State University (MSU) is provided by MSU, and the Consortium for International Earth Science Information Network (CIESIN), the SEDAC for NASA, under contract CSN #415-93. The International Development Research Centre (IDRC), Ottawa provided seed money for the Rwandan team. UNEP-GRID has donated the costs of its activities on the project. The support of these institutions is gratefully acknowledged. The individual authors remain responsible for the contents of the Working Papers which should not be interpreted as necessarily reflecting the views of the Government of Rwanda, UNEP, IDRC, CIESIN, NASA, or MSU. The field research for this study was conducted before the recent events in Rwanda beginning in April 1994. The events have completely altered the situation of farmers in Gikongoro and in Rwanda. Nevertheless it is hoped that the lessons learned from the research will still be of use to other countries of Africa, and that the lessons may help in the rebuilding of Rwanda in the future. This study is dedicated to the people of Rwanda, with deepest sympathy.

I. INTRODUCTION1
AGRICULTURE IS BY ITS NATURE THE RESULT OF THE INTERACTION BETWEEN SOCIAL AND environmental processes, and in Rwanda the impacts of one upon the other are particularly striking. The Highland prefecture of Gikongoro is experiencing gradual but serious declines in food production which have led to severe food shortages in recent years. The immediate cause of this diminished productivity is seen by farmers, policy makers and researchers to be soil degradation. Farmers are in the process of readapting their agricultural system to this degradation of the physical environment, forming a loop of people/environment interaction. Land degradation in Gikongoro is thus an interesting example to explore the possibilities and difficulties of integration of household survey data with environmental data. This discussion of the integration of data types is based on analyses conducted for the Rwanda Society-Environment Project (Campbell et al 1993) and field research in Gikongoro for the author's dissertation. A brief historical synopsis of land use changes and land degradation in Rwanda will first be presented to set the context for the subsequent discussion of the limitations and possibilities of integrating household-level survey and environmental data for understanding land use and environmental changes. II. THE ROLE OF HOUSEHOLD-LEVEL ANALYSIS HOUSEHOLD-LEVEL ANALYSIS IS VITAL TO UNDERSTANDING THE REASONS BEHIND LAND USE change in agricultural areas. Land use change, the visible manifestation of social and environmental interaction through time, occurs at the level of the field or farm as the result of individual farmers' behavior. Using the farm, usually managed by the household, as the "unit of account" thus ties the scale of analysis closely to the decision-making process (Blaikie and Brookfield 1987; Lambin 1992). Decisions to convert pasture land to cropped land, to clear or plant trees, or to drain a valley are local decisions based on perceptions the farmer has of perceived opportunities and constraints. These individual decisions in aggregate form much of the human-induced land cover changes occurring today that are of interest to global change researchers. Without an understanding of the processes occurring at the local level, success in modeling future land use/land cover changes at the regional and global level will necessarily be limited. And, although individual farmers may be acting within a restricted geographic area, their actions are influenced by the social, economic, political and environmental context from the household to the international scale. For this reason, analyses of household-level data must be integrated with information from other scales to more fully understand changing land use decisions. Most available household-level data are gathered by household surveys, and therefore this paper focusses on the integration of household- or field-level survey data with environmental information. Another method of gathering social agricultural data is the agricultural census in
1 A draft of this paper was presented at the Annual Meetings of the Association of American Geographers, San
Francisco, March 30, 1994.
1

which every farm in an area is interviewed. This method is usually employed in circumscribed regions, for example in a watershed or a village, and little attempt is made to extrapolate the findings to other areas. The term agricultural census can also refer to estimates of agricultural production and other data often published by governments by administrative unit (e.g., MINAGRI 1989). These data are useful within spatial models since they cover an entire county, but their accuracy is frequently low and, of course, they cannot provide information on individual decision making regarding land use and land use change. The population census is a particular type of social data in which limited variables are gathered for every individual across an entire country. Since population censuses are usually the sole and/or the most reliable social data available covering an entire country, they are the most common social data integrated with environmental data (particularly within GIS analyses) (Deichmann 1994). The availability of population data, combined with dramatic population growth rates in developing countries and the existence of models of the effect of population growth on agriculture (Boserup, Malthus, etc.), has led to population growth continuing to be considered a driving force of land use/land cover change (e.g., the Social Process Wiring Diagram designed to structure human dimensions of global change research [CIESIN 1992, pp. 32-33]). In regional studies of land use/land cover change, however, population growth is often found to be a secondary variable, dependent on other factors. Recent in-migration along the western edge of Nyungwe forest in Rwanda is, for example, linked to shrinking economic opportunities in the origin area of the in-migrants and a change in governmental and project presence in the forest. Similarly, the rapid conversion of land cover from grassland to crops in the East of Rwanda was due to a reversal of the political power structure which opened up the East to in-migration by farmers (Olson 1990). Studies have also found that very different land use/land cover changes occur in areas of comparable population growth as the demographic changes interact with other societal, political, economic and environmental phenomena. A broader approach is needed to understand the reasons behind demographic changes, and how people respond to these changes. Information to understand this context, to understand the reasons behind demographic or land use changes, often requires questioning the actors themselves, the farmers. This paper explores the problems and possibilities of integration of household survey data with environmental variables for land use/land cover research. The paper will first present a case study of Gikongoro, Rwanda in order to illustrate the interaction of societal and environmental processes over time that have led to dramatic land use/land cover changes by farmers in a situation of high population densities and environmental stresses that may be a precursor to elsewhere in Africa. A discussion of household-level data follows considering the possibilities of integration of household survey and environmental data both within and outside of a Geographic Information System (GIS).
2

III. CASE STUDY: GIKONGORO, RWANDA2
THIS SECTION OF THE PAPER PRESENTS A HISTORICAL OVERVIEW OF CHANGING LAND USE IN Gikongoro, a Highland prefecture of Southwest Rwanda (Figure 1). It considers the governmental policies, the demographic pressures and the economic transformations that have influenced the agricultural system, caused major land use changes, and eventually led to land degradation. The findings refute the common assumption that population pressure inevitably leads to environmental degradation. Instead it was found that in a situation of low population densities, the land was kept relatively unproductive as pasture for hundreds of years. A reversal of the political power structure and increased population densities resulted in pasture giving way to crops and adoption of labor-intensive land management techniques that significantly raised soil productivity. Only recently have demographic forces in combination with other societal factors resulted in changes in land use and in reduced availability of manure which have led to soil degradation, particularly in fields of the poorest households and in regions of vulnerable soils. The paper is based on research in Rwanda in 1992. Two formal surveys were conducted, one at the household level in Gikongoro and Butare (256 households) and the other at the farm field level in Gikongoro (551 fields). Informal interviews and group interviews of men and women farmers complemented the surveys. Interpretation of air photos permitted examination of changing land use/land cover in Gikongoro. Statistical analysis of previously-gathered Ministry of Agriculture household survey statistics provided additional agricultural production, agroforestry and other information. Environmental variables from maps, field measurements and remote sensing were integrated into the household and field survey analyses. Preliminary analysis within a GIS of environmental, demographic and infrastructure variables have allowed the Gikongoro situation to be placed within its national context. Examination of secondary sources and historical documents, and interviews with government and project staff helped to provide a historical and political context for the other findings.3 A. Historical Land Use: Before Independence When the Europeans arrived in the 1890's, they found the western region of Rwanda a highly anthropogenic landscape of grass-covered hills developed over a period of 2000 years (Johanssen 1915; Maquet 1954). Recent evidence shows that the soil of Rwanda has been farmed since at least A.D. 300. The first farmers probably found an old-growth forest. They went through a period of slash and burn agriculture that changed the land cover to a younger, less dense forest. This eventually was converted to and maintained as grassland through controlled burning to support an agricultural system in which livestock were prominent (Schoenbrun 1993). The new emphasis probably occurred as groups of pastoralists immigrated into the area and set up a feudal relationship with the farmers. Eventually a highly-structured monarchy evolved covering most of the area of present-day Rwanda.
2 The material for this section is based on Olson, 1992a and Olson, 1993.
3 The field research in Rwanda was assisted by a grant from the Joint Committee on African Studies of the Social Science Research Council and the American Council of Learned Societies with funds provided by the Rockefeller Foundation. It was also supported by the National Science Foundation, the Association of American Geographers and Michigan State University. The author gratefully acknowledges their support.
3

4

Gikongoro was an administrative unit within the kingdom and thus subject to this higher authority. In this hierarchical structure, one group of people, the Tutsi, had the privilege of owning cows and held most of the political and economic power. The second group of people, the Hutu, rarely owned cows but often raised the Tutsi's cows in return for the male offspring, milk, and manure. They also cultivated crops around their homesteads, the urugo. This cultivated land nearest the urugo received manure and household and agricultural residues, as well as intense maintenance, so the soil grew fertile through this human-induced process, whereas the pasture land was eroded and relatively infertile (Schyns 1988). The owners of the cows, however, had power over access to land and most land was reserved for pasture. Only a small amount of land was cropped and trees were confined to forest residuals in marshy valleys (Loupias 1903; Johanssen 1915). When the Europeans arrived, therefore, they found a grass-covered landscape that was the result of continual land management. The German and then the Belgian colonialists maintained and solidified political power in the hands of the Tutsi who kept complete control over land use and access to land (Maquet 1954; Newbury 1988). Therefore the political and cultural system which placed such importance on cattle and cattle ownership was reinforced. As health programs for both people and cattle were implemented and new food crops adopted, the human and animal populations increased substantially beginning in the 1940's. The build-up of the farming population was, of course, confined to a restricted area by limited access to land. Intensification of the farming system therefore began in Western Rwanda at an earlier date than elsewhere in Africa. Population densities in Gikongoro were not initially as high as in neighboring regions, perhaps because it is a cool, mountainous area with relatively poor soils and people initially settled in the more productive foothills of the South and volcanic soils of the Northwest. Nevertheless, population densities began to increase rapidly in Gikongoro as in other regions. Belgians sounded warnings of over-grazing and over-cultivation threatening erosion and soil degradation (Harroy 1944, Gourou 1953). New land use policies reflecting the colonialists' understanding of tropical soils were put into effect throughout Western Rwanda (Harroy 1954; Uwizeyimana 1991): 1. Burning was outlawed by penalty of fines and imprisonment 2. Erosion ditches with grass strips and trees were installed with umaganda (forced
communal labor) 3. Research into fast-growing tree species indicated that eucalyptus (from Australia)
was promising. Eucalyptus and other exotics were planted on steep slopes and on the summits of hills to reduce erosion, as well as along roads and in governmental woodlots.4
4 Eucalyptus trees were an unfortunate choice for soil conservation due to the allelopathic effect of their roots and
leaves. Little vegetation grows underneath the trees so the ground remains bare, and crops growing near the trees do poorly.
5

B. Independence Long-held resentments of the Tutsi and the Belgians led to the eruption of the Social Revolution and independence in 1962. The Tutsi lost to the Hutu all political power and control over access to land and other resources (Lemarchand 1970). The pent-up demand for cropping land was released as land previously reserved for pasture became available to farmers. Two immediate impacts of the revolution were 1) reserved pasture land locally in the West and the entire East of Rwanda was opened up to farmers for settlement, and 2) colonial policies towards agriculture were reconsidered by the new independent government. These political events, as well as demographic and economic changes, led to a major shift in the relative proportion of land devoted to crops, trees and animals. The interactions between changes in policy, economic transformations and population growth and redistribution had important implications for the viability of the land use system in Gikongoro. 1. Government Policies Following independence, the government implemented policies profoundly affecting land use and land degradation: a. Land previously reserved for pasture became open for settlement and cropping.
The result was a reduction in the amount of land in pasture and the availability of grass to feed the animals (many animals had also been killed during the revolution). The policy was coincident with rapidly increasing human population densities that created a large demand for new farm land. The result was a process of rapid land conversion from grass to crops.
b. Burning fields and grasslands continued to be prohibited. c. Enforced tree planting continued with umaganda on farms and on government
communal woodlots. The government and expatriate agro-forestry projects also established tree nurseries and encouraged the planting of trees. The results include an increase in availability of seedlings and knowledge of tree planting, more trees in government woodlots, and more trees on private farms (Table 1) (note: tables begin on page 23). This has been coincident with an increase in the demand for tree products (fruit, fodder and wood) as forests have been converted to cropped land.
d. Colonial policies enforcing digging of erosion ditches and planting grass strips
were at first abandoned since they were seen as a colonial imposition. In the mid-1970's, the government reversed its policy and once again umaganda became the vehicle to force construction of ditches throughout the country. The result has been a tremendous increase in area under ditches and grass strips. A secondary result has been a build-up of farmer resentment over the ditches and led some farmers to deny the importance of erosion and to neglect ditch maintenance.
e. Drainage and clearance of valleys for cropping land. Although farmers have
drained valleys incrementally during their search for more and better land, the
6

government has also instituted large-scale drainage programs (Cambrezy 1981). This has contributed a large amount of land to cultivation that had been in communal pasture. It also eliminated almost all remnants of forest canopy outside of the national parks.
These governmental policies were very important in directly shaping the changing land use pattern, reinforcing the importance of explicitly examining the role of the State in any study of land use change. Other socioeconomic processes, as described below, were also occurring which had a similarly profound effect. 2. Demographic Processes Rural population densities have increased dramatically. The population size of the country grew from 1.9 million in 1948 to 7.2 million in 1991, the Gikongoro population from 162,259 in 1948 to 466,290 in 1991. The Gikongoro population density grew from 100 people/km2 in 1948, to 228 in 1978 and to 287 people/km2 in 1991 (Prioul and Sirven 1991, MINIPLAN 1978, MINIPLAN 1992). Since the inheritance system provides for equal division of the father's land among his sons, the population growth has resulted in increasingly smaller farms being inherited. The increase in population densities and commercialization of agriculture has led to 1) an expansion of cultivation to valleys, grasslands, marginal lands (steep slopes, poor soils), high altitude regions and to the East of the country (Olson 1990), and 2) an intensification of land use à la Boserup with reduced fallows, near-continuous cropping, labor-intensive management, etc. (Boserup 1965, Clay and Lewis 1990). Through these two processes, the Rwandan population was, until recently, successful in expanding its food production to maintain self-sufficiency (Ford 1993). However the changes in the agricultural system were also accompanied by a reduction in the nutritional quality of the food since fewer animal products, pulses, or cereals are produced and people rely increasingly on tubers. Today the country is no longer self-sufficient in food, as indicated by increasing food imports (Loveridge 1989) and, especially in Gikongoro, declining food availability in farm households. LAND USE CHANGES AND LAND DEGRADATION The intensification and extensification processes have meant major changes in land use in Gikongoro, some of which have increased land degradation (Table 2): • continuous cultivation. An effect of continuous cultivation is that the soil is hoed
and loosened at least twice a year, making it susceptible to erosion. The soil is also depleted of nutrients (Moeyerson 1989).
• reduced fallow. Fallow was once the major method of soil nutrient renewal. • reduced pasture, which has led to fewer animals and less manure, the most
important soil additive. The manure still available is spread over a larger cropped area. The result is a reduction in the amount of nutrients and organic material transferred from outside the farm onto the fields. This reduction in availability of manure is perceived by farmers to be the most important cause of land degradation, and one of their primary responses to the degradation has been to attempt to raise animals or buy manure (Tables 3, 4).
7

• reduced availability of grasses and other vegetative matter from off-field to add
to the soil. With the drainage of swamps and expansion of crops in the valleys, grasses and other plants which had been cut and incorporated into the soil are less easily found.
• changing crop choice reflecting the need for higher caloric production/ha (more
tubers to the detriment of cereals and pulses). Tubers require deep hoeing so the soil becomes more susceptible to erosion, and tubers also quickly deplete the soil of nutrients
• cultivation of marginal lands such as steep slopes, poor soils and high altitude
regions. These changes in the agricultural system have resulted in increased erosion and reduced organic matter and soil nutrients in the soil. Whereas previously the soil near the urugo received a net benefit from the soil additives and intense management and had gained fertility through this human-induced process, today many farmers are unable to provide sufficient amounts of the soil additives to compensate for the increased stress on the system. The soil is thus losing fertility. The soil of Gikongoro is particularly vulnerable to these changes in land use because it is derived from granite and schist/shale (CPR 1993). A reduction in organic matter in particular leads to a significant decline in the soil's agronomic capability due to worsening acidity and aluminum toxicity (Mutwewingabo and Rutunga 1987). The steep slopes and heavy, frequent rains of Gikongoro also lead to a high potential for damaging erosion. The combination of these physical characteristics with the recent land use changes has resulted in Gikongoro farmers experiencing particularly serious declines in soil fertility (Table 3). Declining soil fertility is severe in Gikongoro despite its low population densities relative to elsewhere in Western Rwanda. Butare and Gisenyi, for example, have experienced comparable political and economic transformations and have even higher population densities than Gikongoro, but their degree of soil degradation is lower than in Gikongoro. The difference may be their less vulnerable soils (the soils of Gisenyi are derived of volcanic material and Butare's of basic rock (CPR 1993)) plus the availability of more off-farm economic opportunities reducing pressure on the land. Gikongoro has fewer non-farm sources of employment since it is farther from urban centers and has received lower levels of government investment in infrastructure, agricultural or other development programs. These differences between prefectures illustrate the importance of regional comparisons to further the understanding of the factors behind changing land use— regional differences in soils, government investment, access to markets, off-farm income opportunities, etc.. RESPONSES TO LAND DEGRADATION New labor-intensive practices have been adopted and older agricultural practices have been intensified in response to the land degradation of Gikongoro. Some of these include: • a major effort to either own or take care of others' animals in an attempt to gain
manure (especially smaller animals). Often the animals are tethered or stabled and fed cut grasses and leaves which have been planted on the farm (Table 4).
8

• gathering grasses and weeds to incorporate into the soil and to feed animals • the digging and maintenance of erosion ditches and grass strips • deep hoeing to replace the top soil lost through erosion • the substitution of crops • expanding or diversifying the land cropped through renting, borrowing or buying
additional fields • tree planting and maintenance on the edge of fields to reduce erosion and add
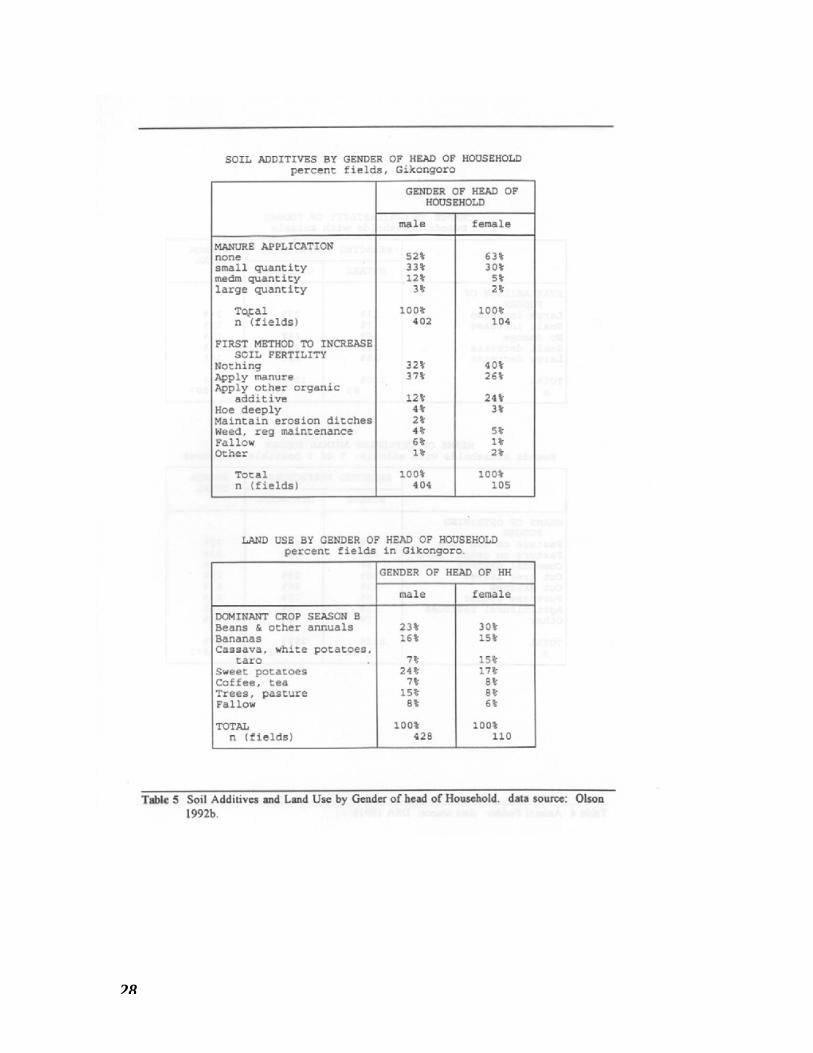
organic matter to the soil • conducting off-farm employment, especially agricultural labor • temporary or permanent out-migration in search of farm land or employment. The soil management techniques adopted in response to degradation require resources such as land, animals and trees that are not available in all families, especially in households headed by women and in families with very little land. The impact of land degradation is differentially felt, therefore, between households of different resource endowments and between households headed by men or women. Tables 2, 5, 6 and 7 reflect the impact on the soil of these societal variations. That Gikongoro households headed by women have fewer resources to maintain soil fertility is tied to the role of women in the society and cultural mores regarding rights of women to land, animals and trees. Only men inherit land and women do not have legal or cultural rights to inheriting or purchasing land (Bucyedusenge et al 1990). When women marry, they move to the land their husband has just inherited. The land then remains the husbands'. The most common method women become heads of households is the ending of the marriage due to separation or to the husband's death. Women are usually then granted temporary access to the land by the husband's family or by the courts to support themselves and, more importantly, their children (or they return to their parents' farm). The land they gain is typically the fields immediately surrounding the house and not the more fertile valley fields, the fallow or pasture land, or the woodlots (Tables 2, 5). Their fields tend to be very intensively cultivated, therefore, with women having less access to sites with leaves and grasses to use as green manure or to pasture land for feeding animals. Women are rarely given caretakership of their former husband's cattle (and cannot own or buy cattle themselves according to social mores) and have few resources to feed their smaller animals. The result is women-headed households have only a third of the manure of men-headed households to spread on their fields (Table 6). Trees are the third resource important in soil fertility maintenance because they aid in soil conservation, produce animal fodder so increase manure availability, and produce leaves to add organic matter to the soil. Rights to plant, and therefore to own, trees are usually reserved for men, however, except for certain trees used for medicine or food (den Biggelaar 1994). Households headed by women are rarely given control over existing woodlots. In sum, then, households headed by women have less manure and fewer other sources of organic matter to add to their fields, and the land is fallowed less often. Off- and non-farm economic opportunities are also much rarer for women so they must intensely cultivate the land they have. The soil of their fields is, therefore, experiencing rapid
9

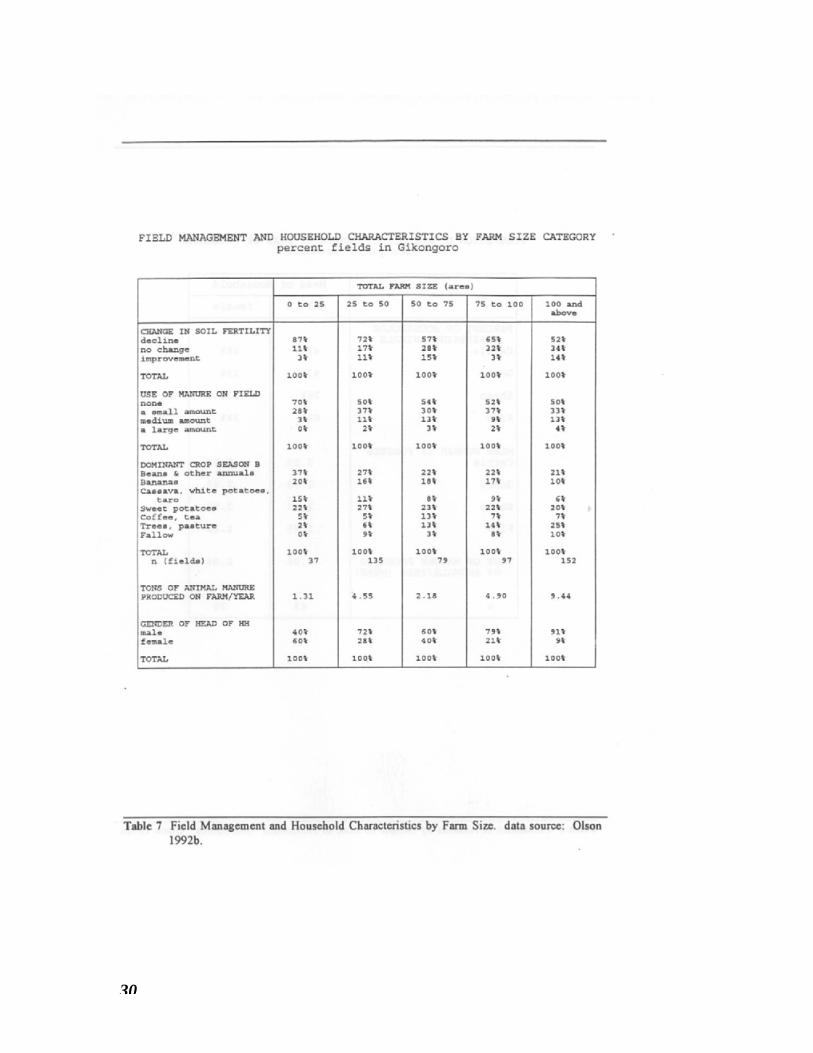
degradation. Households headed by men but with very small farms experience a similar lack of land, tree and animal resources which restricts their ability to maintain soil fertility (Table 7). They rarely have land in woodlots, fallow or pasture since they must cultivate most of their land to produce sufficient food to feed their families. Their land is therefore intensively cultivated and receives little organic matter from applications of leaves or grasses. These households also have fewer animals, especially cattle, to produce manure since they must often sell their animals in times of debt or to buy food, and their poverty does not permit them to buy replacements. The lack of pasture land and fodder production also restricts their ability to maintain the animals they possess, further diminishing their ability to apply manure. Households with small farms still reserve land for trees, usually land near the household and on the edge of fields (den Biggelaar 1994). The presence of the trees may be partially due to labor constraints since the husbands are usually working off-farm. Nevertheless, the households' general lack of resources restricts their ability to maintain the soil's fertility. This difference between families has led to "fertilité sociale," or "social fertility," a term describing the situation in Gikongoro in which a family's social standing reflects it's soil fertility and vice-versa (Gatera 1992). Richer families own cattle and other resources which help to maintain their soil fertility so that their good soil fertility reflects their high social status, whereas poorer families without the cattle and other resources experience poor soil fertility and soil degradation, a reflection of their low social standing. The difference in soil fertility between families also leads to a cycle of families with degraded soil harvesting little and earning a declining income from their fields and thus becoming poorer, whereas relatively richer families gain a higher income from their fields and are able to maintain their wealth. This section illustrates the influence of societal differentiation on land use. Variations in land, animals and other resource endowments, in off-farm employment, and in gender of the head of the household are examples described affecting land use and land degradation in Gikongoro, but elsewhere other factors may be similarly important. 3. Economic Processes A slow but significant increase in the commercialization of crops has occurred. High-value food crops are especially important cash earners. Bananas and banana beer, for example, are the biggest cash earners in the country. Lower-priced crops are also, however, frequently traded for necessary cash. Crops are now the most important source of agricultural wealth. Large animals (cattle) are sold infrequently since they act as a store of wealth, represent prestige, provide milk and manure, and are needed for social exchanges such as at a son's wedding. The cattles' economic value is therefore less immediate while their requirements for land, food and labor are high. Therefore the proportion of households with large animals is small and getting smaller. Smaller animals (goats, sheep and pigs) require less land, labor and food but their requirements are still such that households usually own a few (Table 6) (Rwamasirabo 1990). The impact of this is again an increase in the importance and value of crops over animals. Trees have become similar to other crops in terms of their economic importance. Trees are carefully managed and may provide a constant source of food, fodder, medicine and fuel, and
10

small to medium-sized poles which can be sold. Trees however play a different role in the household economy from that of crops since they are owned by men and usually provide an infrequent if larger sum reserved for major purchases or to repay debts. C. Lessons from the Gikongoro Study In sum, therefore, the land in Gikongoro under grass has declined, that under trees has somewhat increased, and the land under crops has enormously increased. The trend of expansion of cropped land is uncertain for the future since farmers find that there is no longer any uncleared land to be put under crops. Meanwhile, the value of animals remains high since they produce the precious manure for crops. Growing fodder (grass and tree leaves) on-farm is beginning to be a necessary part of the agricultural system. The necessity of planting trees and grasses on-farm has changed the landscape. Grasses had been found in communal or private pasture lands away from the intensely cropped fields surrounding the urugo, and the rare trees had been in valleys or hilltops on communal lands. Now grasses and trees are planted on the edges of fields as part of the cropping system. Another recently emerging trend is that farmers with extremely degraded cropped land are being forced to convert the land to pasture or woodlots, in a sense completing the cycle. This continuing process of agricultural intensification, coupled with the ecological process of land degradation, may lead in the future to somewhat less land under crops and more under grass and trees. The Boserupian intensification process appears to have been relatively successful in areas of better soils and in farm households with sufficient resources to invest in the soil. In ecologically marginal areas and in poorer households, however, the intensification process has not provided a sufficient increase in production to support the added number of people, and the process has also resulted in soil degradation. The factors which have led to the dramatic land use changes and soil degradation are political, socio-cultural, economic and environmental events and processes which have occurred and interacted from the household to the national scale. Some lessons from the case study useful to land use/global change research include: 1. Variations between households in terms of resource endowments, off-farm
activities, the gender of the head of household and other household characteristics have a direct impact on land use and changes in land use.
2. Regional variations (environmental, cultural, political and economic) are also
important for understanding land use change. 3. Qualitative information such as the distribution of power, the political structure,
governmental policies and social mores are often the "driving forces" affecting measurable behavior at the farm.
4. Consideration of the role of the State is necessary to understand land use changes
for both its direct effects (e.g., policies regarding the distribution of land, soil conservation techniques, tree planting) and less direct effects (e.g., programs to encourage certain crops, investment in infrastructure, siting of development projects, stability).
11
5. The scale of analysis needs to extend beyond the limits of the region being studied due to the importance of economic and other ties between the region and the wider system. Daily movements or short-term migration is perhaps the most visible of these ties. Off-farm employment by people living within the region, for example, profoundly affects household labor availability and income available for farm investments, and indirectly, therefore, affects land use.
6. Demographic change is a powerful force behind land use changes, but the factors
behind demographic processes must be understood to predict future demographic directions. For example, short-term and permanent migration movements are caused in part by regional differences in economic opportunity and labor availability. Fertility rates are related to the cultural and economic structure, the role of women and the availability of contraceptives.
Similarly, the impact of demographic processes on the society and the
environment is not simple but related to site-specific political, economic, social and environmental factors over time. Some of the factors influencing the effect of population growth on the environment in developing countries are mentioned in the conclusion of this paper. The variation between countries and between regions within countries shows that the assumption that population growth equals environmental degradation is often wrong.
7. A long time horizon is necessary to understand the forces behind changes in land
use/land cover although the environmental impacts of the changes may have been perceived only recently.
8. The agricultural system is very dynamic. IV. DATA INTEGRATION THE IMPLICATIONS OF THESE LESSONS FROM THE CASE STUDY WILL BE REFLECTED UPON IN terms of analysis of household-level data and integration of that data with environmental information. Many household-level studies are confined to static, descriptive statistics or multivariate analysis of survey variables. This has been the standard approach used in the office of the Ministry of Agriculture, for example, which conducts continual agricultural surveys throughout Rwanda (e.g., DSA 1991). Limitations of this include: 1) spatial differentiation is often not incorporated into analyses, and 2) variables from other sources or scales (e.g., access to markets, government projects, national policy), and qualitative information (e.g., long answers to survey questions, power distribution) are not considered in the analysis. Statistically significant findings are frequently accepted as explanations when they may be spurious or reflect a more complex association. To be fair, integration of household survey data with other information is not easy. Analysis and interpretation may require the researcher to step beyond the more comfortable straight interpretation of survey results. Challenges in the analysis includes the unpredictability of individual behavior and the dynamism of agricultural systems in time, as well as our incomplete
12

understanding of and ability to measure human/environment interaction. This implies a need for flexible models and analytical approaches that can handle uncertainty and incorporate changes in individual behavior within the wider socio-environmental context. A. Considerations in Incorporating Household-Level Survey Data Within a GIS 1. Environmental data are often assumed to be spatially contiguous and appropriate
for spatial interpolation with kriging or other methods. Social data, however, are usually not spatially contiguous and cannot be spatially interpolated (e.g., a random sample of households, locations of health facilities). Population density is perhaps one of the few societal variables that can be treated as spatially contiguous.
2. Sample household survey data present special problems within a GIS. The
sampling frameworks for surveys are often designed for the survey results to be statistically significant at the scale of a major administrative unit, and results from individual households or grouped households at smaller units cannot be assumed to be statistically valid. Findings from surveys will need to be presented and analyzed at the scale of their statistical validity, probably as large blocks, and not as point or continuous data.
A second complication arising from sampling frameworks based on large
administrative units is that these units are often not the most appropriate for studies of human/environment interaction (e.g., land use change, agriculture) where agroecological or farming system regions may be more meaningful.
3. Data from sample surveys must be carefully presented to maintain confidentiality
of the respondents, which precludes cartographic representation of households or groups of households as point data.
4. Household-level data are often heterogeneous and difficult to aggregate spatially
because variations within a spatial unit are often larger or more important than variations between spatial units. Household wealth, or the age, gender or educational level of the head of a household, for example, may be important factors affecting land use and soil degradation but vary widely between households within a single region (see Tables 2, 7). Similarly, an assumption of spatial autocorrelation cannot be made due to this heterogeneity. The variation within a region may be visually presented cartographically by, for example, a pie chart of the percentage distribution of age groups within the region (Deichmann 1992). Analytical capability of GIS to handle heterogeneous variables remains, however, limited.
5. By aggregating household-level variables to the level of a spatial unit, much
information concerning the relationship between variables at the household level (e.g., gender of head of household and farm size) is lost. For this reason, non-spatial analyses examining household differentiation by factors such as farm size are necessary to complement spatial analyses.
13
6. The dynamism of agriculture in Africa is as difficult to overstate as it is to explain or model. Often, a long-term time horizon is necessary to understand major environmental changes perceived only recently at the farm level.
Historical data are, however, often lacking for development of an evolving
model. This is as true for environmental data as it is for social data. A major lacunae of the Gikongoro degradation study, for example, is any time-series soil information which would have not only corroborated farmer observations of changing soil properties but permitted an analysis of the association between changes in land use with changes in particular soil characteristics over time.
Another element of including time in analyses is that environmental and social
processes occur at different rates. Soil formation processes occur over hundreds of years, whereas a farmer can move soil to create erosion ditches in one year after a political mandate has been issued. Understanding the interaction over time of the various social and environmental processes requires a flexible analytical approach which "unbraids" the different strands of time and searches for synergism between processes (Campbell and Olson 1991).
7. Frequently, determining factors affecting land use change are not differentiated
spatially or are qualitative and cannot be analyzed within a GIS. Political mandates for digging erosion ditches, for example, were implemented nation-wide in Rwanda. Cultural mores restricting women's ability to plant trees or own land may not be quantifiable but directly affect land use.
B. Methods of Data Integration Despite these important considerations, there are tremendous potential benefits to integrating household and environmental data in the effort to understand land use change. Following is an abbreviated list of approaches to integrating household survey data with environmental data. NON-SPATIAL ANALYSES: 1. Add environmental characteristics as new variables to a farm- or field-level
survey file. Although the environmental variables may greatly enhance the analysis of the survey data, care must be taken that an implicit environmental determinism does not guide interpretation of the results (e.g., a regression analysis indicating high elevation and rainfall causes small farm sizes).
The environmental variables may originate from spatial sources, for example
from a map of isohyets, and the value of the variable noted for each survey site. Environmental variables easily obtained with this method include rainfall, elevation, temperature and soil type. This method would be useful for agricultural studies, for example of crop choice or productivity. This is perhaps the most common form of integrating environmental data into farm-level data, but its usefulness depends upon the resolution and spatial variation of the environmental data. In a small country such as Rwanda, micro-environmental characteristics such as position on the hillside are as important as macro-
14

environmental characteristics obtainable from maps such as rainfall for understanding issues such as crop choice and soil degradation.
2. Other environmental information to analyze with social variables are physical
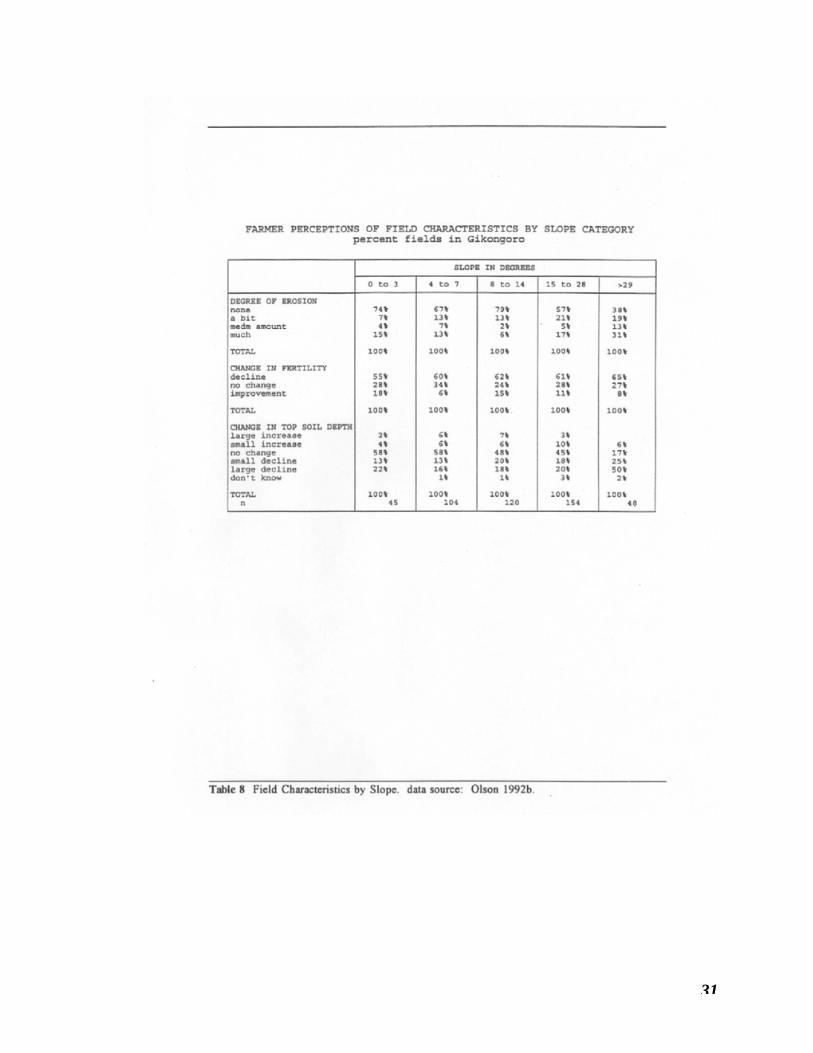
measurements of the field such as slope, position on hillside, field size and soil properties (soil type, acidity, organic matter content, texture, depth, etc.). These analyses are useful to examine decisions regarding, for example, land use, applications of soil additives and crop choice. They may also be compared with farmer perceptions of the soil and of changing soil characteristics (e.g., Table 8). Farmer, or indigenous, classifications of soil types have been compared with FAO classifications in indigenous knowledge studies and/or in attempts to use farmer classes where large-scale soil surveys are not possible. Texture, organic matter content and pH were found to be important characteristics differentiating farmer soil classes in southern Rwanda (ISAR 1991). The use of farmer soil classification systems in large statistical analyses is complicated, however, by regional variations in soil type names and classes.
The field research in Gikongoro found farmers to be very conversant and able to
provide detailed descriptions of soil properties and of changing soil characteristics. Whether this knowledge is considered "physical" or "social," it does provide invaluable information on changes in soil characteristics that are rarely available from physical measurements. More importantly for land use change studies, perceptions of the soil are an important facet of farmer decision making regarding crop choice, application of soil additives, use of soil conservation techniques and land use. These soil management techniques in turn affect soil properties, making studies based on assumptions of a unidirectional causal link between environmental factors and human actions incomplete. A more complex analysis is necessary to understand the reasons behind changing soil properties and changing land use over time, an analysis which would be greatly strengthened by interviews of farmers.
3. Regionalizations based on the physical environment, for example agroecological
zones, can be used to compare characteristics of regional groups of farms. Examination of the relative importance of environmental, economic and cultural factors on crop choice, for example, may provide insights into farmer decision making.
SPATIAL ANALYSES: Spatial analysis provides the researcher the ability to perceive the research problem and the interactions of the data over space; it is a powerful tool for the understanding of the problem. Patterns in space of one variable can be compared with patterns of others. Spatial outliers, or clusters, can also be detected and analyzed. GIS allows the integration of heterogeneous spatial data, from maps, remote sensing, published statistics, etc., widening the types of analyses possible and making GIS an important technique in the integration of social and environmental data. Household-level data can be seen in relation to societal variables such as infrastructure or demographics, and environmental variables such as climate, soils and elevation (Deichmann 1992).
15
1. Household-level survey data can be integrated with environmental data within a
GIS by aggregating the survey data within its statistically significant unit and mapping the results. On the other hand, household survey findings may be presented by regions other than the original unit if the requirements for statistical validity are met (e.g., a sufficiently large sample size within a contiguous area). This may be useful when agroecological or farming system regions are more appropriate for the study than the administrative unit commonly used as a base for sampling frameworks.
2. Indices could be determined from multivariate analyses of household-level data
and then comparable variables available at spatial units adopted as surrogates within a GIS analysis. For example, if household survey analysis found that households with small farms and few animals experience high rates of soil degradation, the aggregate variables of population density (from the population census) and numbers of animals (from the agricultural census) may be used as surrogates within a GIS analysis.
An assumption of equal distribution of land and animals between households is
behind the use of such surrogates, an assumption that may be wrong and significantly affect the accuracy of the results. A parallel analysis of household survey data on the distribution of land and animals between households and the resultant effect on degradation would strengthen the design of the analysis and the interpretation of the results of the GIS work.
A second danger is the surrogates may eventually be confused with the causal
factors themselves and applied elsewhere where the same factor/surrogate relationship does not hold. For example, land degradation may be associated with small farms in Gikongoro, but in Machakos district, Kenya, small farms may be associated with less erosion and less land degradation (Tiffen et al 1994).
3. Spatial analyses of environmental or of other social variables can create new
regionalizations relevant to household decisions (for example, regions most suited to a particular commercial crop, farming system regions, "carrying capacity" zones). These regions can then be used in non-spatial analyses of the survey data.
4. GIS analyses can be used to identify regional "hot spots" of land cover change,
environmental stress, population growth, etc., that could then be targeted for household surveying to identify the factors behind and impacts of those changes (a sort of societal ground truthing).
5. The usual methods of spatial data analysis can be used on the household survey
data: examination of outliers, clusters, continuous variation and other spatial patterns, spatial regression, overlay, mapping of residuals, etc.
6. More spatial analytical approaches to the integration of survey and environmental
data include converting incompatible spatial data to a common and regular spatial
16

scheme (e.g., raster data structure) (see Brown 1994, Deichmann 1992 and Deichman 1993 for further discussion of integrating survey data into a GIS).
In sum, household-level survey data and environmental data can be effectively integrated within a GIS and the study results are thereby greatly enriched. In studies such as land use change and evolutions of agricultural systems, integration of data sources is key to developing an understanding of the underlying processes. Nevertheless there are important methodological and analytical considerations in incorporating household survey data within a GIS. One is the mismatch between the high resolution and detail of field or farm-level survey data and the coarser resolution of much environmental data available from maps or remote sensing. Ironically much of the detail and resolution of the survey data are lost in the regional aggregation necessary to maintain statistical validity within the GIS. These and other considerations, such as the high degree of variation between households within regions and the significance of qualitative information, make the use of a hybrid of spatial and non-spatial methods vital. Examples mentioned above include using a GIS to define new regionalizations to better examine survey data outside the GIS, and use of survey data to identify factors affecting land use change whose surrogates could then be examined within the GIS. The process of designing the research methodology and interpretation of the research results requires a dialogue between social and physical scientists since, as the case study illustrates, social and environmental phenomena interact over time to create new formations, formations which may be unforeseen or misinterpreted with a partial view of the system. V. DISCUSSION AND CONCLUSIONS LINKING THE DESCRIPTIVE CASE STUDY OF GIKONGORO, WITH ITS COMPLEX SOCIAL AND environmental interactions, with the section on methods of data integration begs for a theory of land use change to guide data collection and analysis. Is it possible to develop a meta theory of land use change or of society/environment interaction to test against similar case studies and to inform global change research (Turner 1989)? Do we know enough of individual behavior at one level and societal processes at another to create predictive models of land use change? Or is a broad analytical framework such as political ecology as close as we can get? Two books on agricultural change have attempted to generalize the societal and environmental conditions associated with land use practices that can cause environmental degradation. The conditions identified by Turner et al (1993) are: • extremely high rural densities where economic diversification has not substituted for the
increasing population;
• physically or biologically vulnerable areas;
• where socioeconomic organization impedes the implementation of needed conservation strategies; and
• where current cultivation practices have reached their limit given soil and water resources.
17

Those identified by Blaikie and Brookfield (1987) include: • structural demands of the international economy placing strain on local natural
resource use (e.g., the foreign debt crisis, oil prices, IMF restructuring); • distribution of resources available to communities varying spatially and affecting
the demands placed on the environment; and • the local social and structural context influencing differential access to
environmental resources and adoption of conservation measures (e.g., distributional rights to land, laws of inheritance, and gender, ethnic, class and caste divisions).
These are presented as national or sub-national conditions, making some of them potentially usable as indices or predictors in global land use change models. The conditions vary in importance from site to site and in their land use change manifestation, however. They do not wholly "explain" regional land degradation or land use change but they could be used to design research questions for case studies. Indeed, Blaikie and Brookfield (1987) set out a wider political ecological framework which has spawned and guided many regional studies. As the Rwanda study and others elsewhere have shown, how the conditions listed above affect land use change and environmental degradation is determined by their interaction over time with other factors from the local to the international scale. These other factors cannot often be easily incorporated into a generic model because they are unpredictable, one-time events such as a political decision, or are qualitative in nature such as farmer resentment towards soil conservation techniques. In short, is developing a predictive model possible considering this site-specificity and when the "driving forces" are not well understood? Alternatively, inductive methods to examine land use change by, for example, pattern searching amongst secondary variables, followed by social and spatial stratification (Carter et al 1993), and finally identifying factors statistically associated with land use change, are certainly easier to execute with our capability for manipulations of data than developing a theory of land use change. In this method, the identified factors will, of course, differ from region to region and from researcher to researcher, and the results will depend upon data availability and analytical methods employed. We need to develop a conceptual approach to provide a common framework of research design and data interpretation, and to permit comparisons between regional studies.
18

VI. BIBLIOGRAPHY Bell, Morag and Neil Roberts. 1991. The Political Ecology of Dambo Soil and Water Resources
in Zimbabwe. Transactions of the Institute of British Geographers, 16:301-318. Bucyedusenge Germaine, Hyacinthe Fabiola, Anita Regmi and Laurence Uwamariya. 1990. Le
Rôle de la Femme dans l'Agriculture Rwandaise. Kigali, Rwanda: Division des Statistiques Agricoles, MINAGRI, Rép. Rwandaise.
Boserup, Ester. 1965. The Conditions of Agricultural Growth: The Economics of Agrarian
Change Under Population Pressure. London: George Allen & Unwin Ltd. Blaikie, Piers M. and Harold P. Brookfield. 1987. Land Degradation and Society. New York:
Methuen. Brown, Daniel G. 1994. Issues and Alternative Approaches for the Integration and Application
of Societal and Environmental Data Within a GIS. Rwanda Society-Environment Project Working Paper 3. East Lansing, MI: Department of Geography, Michigan State University.
Cambrezy, Luc. 1981. Conquête des Marais au Rwanda et Dynamique de la Population. Etudes
Rurales 83 (juillet-septembre):45-67. Campbell, David J., Jennifer M. Olson, and Len Berry. 1993. Population Pressure, Agricultural
Productivity and Land Degradation in Rwanda: An Agenda for Collaborative Training, Research and Analysis. Rwanda Society-Environment Project Working Paper 1. East Lansing, MI: Department of Geography, Michigan State University.
Campbell, David J. and Jennifer M. Olson. 1991. Framework for Environment and
Development: The Kite. CASID Occasional Paper, 10. East Lansing, MI: Center for Advanced Study of International Development, Michigan State University.
CPR (Carte Pedologique du Rwanda). 1992. Carte d'Aptitude des Sols du Rwanda. Kigali:
MINAGRI and Cooperation Technique Belge. Carter, Simon E., P.N. Bradley, S. Franzel, J.K. Lynam. 1993. Dealing With Spatial Variations
in Research for Natural Resource Management. Paper presented at the IDRC Workshop at ICRAF. Nairobi, Kenya, December 6-10.
Clay, Daniel C. and Lawrence A. Lewis. 1990. Land Use, Soil Loss and Sustainable Agriculture
in Rwanda. Human Ecology 18,2:147-161. CIESIN (Consortium for International Earth Science Information Network). 1992. Pathways of
Understanding: The Interactions of Humanity and Global Environmental Change. University Center, MI: CIESIN.
Deichmann, Uwe. 1992. GIS and Socioeconomic Surveys. Paper presented at the CGIAR
19

NORAGRIC/UNEP Meeting on Digital Data Requirement of GIS in the CGIAR, Arendal, Norway, September 21-24..
________. 1993. Issues in the Integrated Spatial Analysis of Socioeconomic and Environmental
Data. Paper presented at the UNEP & IUFRO Workshop: Developing Large Environmental Databases for Sustainable Development, Nairobi, Kenya, July 14-16.
________. 1994. A Medium Resolution Database for Africa. Database Documentation, the
National Center for Geographic Information and Analysis, Department of Geography, University of California, Santa Barbara, CA.
den Biggelaar, Christoffel J. 1994. Farmer Knowledge of and Experimentation with Trees and
Tree Cultivation in Agroforestry Systems in Rwanda. PhD dissertation, Michigan State University.
DSA (Division des Statistiques Agricoles). 1991a. Enquête Nationale Agricole 1989:
Production, Superficie, Rendement, Elevage et Leur Evolution 1984-1989. Kigali, Rwanda: MINAGRI, Rép. Rwandaise.
________. 1991b. Unpublished data from the Agroforestry Survey. Kigali, Rwanda:
MINAGRI Rép. Rwandaise. Ford, Robert E. 1993. Marginal Coping in Extreme Land Pressures: Ruhengeri, Rwanda. In
Population Growth and Agricultural Change in Africa, eds. B.L Turner., Goran Hyden and Robert Kates, pp. 145-186. Gainesville, FL: University Press of Florida.
Gatera, Frédéric. 1992. Personal communication. Gourou, Pierre. 1953. La Densité de la Population au Ruanda-Urundi: Esquisse d'une Etude
Géographique. (Mem. no. 8, XXI-6). Brussels: Institut Royal Colonial Belge. Harroy, Jean-Paul. 1944. Afrique, Terre Qui Meurt: La Degradation des Sols Africains sous
l'Influence de la Colonisation. Brussels: Academie Royale de Belgique. ________. 1958. Ruanda Urundi. Brussels: Infor Congo. ISAR (Institut des Sciences Agronomiques du Rwanda). 1991. Perception Paysanne de la
Variabilité des Sites et Gestion de leur Productivité. In Rapport Annuel 1991. Rubona, Rwanda: Département Etude du Milieu et Systèmes de Production, ISAR, Rép. Rwandaise.
Johanssen, P.F. 1915. Ruanda: Kleine Anfänge - Grosse Aufgaben. Bieleseld: Berlagshandlung
der Anstalt Bethel. Lambin, Eric F. 1992. Spatial Scales, Desertification and Environmental Perception in the
Bougouriba Region (Burkina Faso). Working Papers in African Studies 167. Boston: African Studies Center, Boston University.
20
Lemarchand, Rene. 1970. Rwanda and Burundi. London: Pall Mall Press. Loupias. 1903. Tradition et Légend des Batutsi. Anthropos III, 1: 1-16. Loveridge, Scott. 1988. Uses of Farm and Market Survey Data to Inform Food Security Policy
in Rwanda. Ph.D. diss., Michigan State University. Maquet, Jacques J. 1954. Le Système des Relations Sociales dans le Ruanda Ancien. Annales
série no. 8. Tervuren: Musée Royal du Congo Belge. MINAGRI. 1989. Production Agricole en 1987: Bilan d'Autosufficance Alimentaire par
Commune et par Habitant. Kigali, Rwanda: MINAGRI, Rép. Rwandaise. MINIPLAN. 1978. Recensement General de la Population et de l'Habitat, 1978. Kigali:
MINIPLAN, Rép. Rwandaise. ________. 1991. Rencensement de la Population et de l'Habitat au 15 aout 1991: Resultats
Provisoire. Kigali: MINIPLAN, Rép. Rwandaise. Moeyersons, J. 1989. La Nature de l'Erosion des Versants au Rwanda. Pub. no. 43. Butare:
Institut National de Recherche Scientifique. Mutwewingabo Bernard and Rutunga Venant. 1987. Etudes des Sols des Stations d'Essais du
Projet d'Intensification de l'Agriculture Gikongoro (PIA). Gikongoro, Rwanda: Projet d'Intensification de l'Agriculture Gikongoro .
Newbury, Catherine. 1988. The Cohesion of Oppression: Clientship and Ethnicity in Rwanda:
1860-1960. New York: Columbia University. Nsengimana Cyprien G. 1991. Resultats de l'Enquete sur les Exploitations les Plus Touchees par
la Disette en 1990. Gikongoro, Rwanda: Projet de Developpement Agricole de Gikongoro, Rép. Rwandaise.
Olson, Jennifer. 1990. The Impact of Changing Socioeconomic Factors on Migration Patterns in
Rwanda. Master's thesis, Michigan State University. ________. 1992a. Perceptions Paysannes sur la Dégradation des Sols. Paper presented at
the Conférence sur les Perceptions Paysannes sur la Degradation du Sol, U.S. Embassy, Kigali, Rwanda, December 11.
________. 1992b. Unpublished data from the Land Degradation Survey in Gikongoro, Rwanda. ________. 1992c. Unpublished data from the Perceptions of Land Degradation Survey in Butare
and Gikongoro, Rwanda. ________. 1993. Cows, Crops and Trees: How Their Relative Value has Transformed Land
Use and Induced Land Degradation in Gikongoro, Rwanda. Paper presented at the Annual Meetings of the African Studies Association, Boston, December 7.
21

Prioul, Christian and Pierre Sirven. 1981. Atlas du Rwanda. Kigali: Imprimerie Moderne
Nantasie Coueron. Rép. Rwandaise. 1985(?). Carte Administrative et Routiere. Kigali: MIRENAMICA. Rwamasirabo, Serge. 1990. Goat Production in Rwanda: Assessing the Potential for Future
Development. Master's thesis, Michigan State University. Sirven, Pierre. 1984. La Sous-Urbanisation et les Villes du Rwanda et du Burundi. Ph.D. diss.,
Université de Bordeaux III. Schoenburg, David. 1993. We Are What We Eat: Ancient Agriculture Between the Great
Lakes. Journal of African History 34: 1-31. Schyns, Ch. 1988. Présentation de la Dissertation de J. Nzisabira "Evolution de l'Agriculture et
Croissance de la Population au Rwanda". Bull. Séanc. Acad. r. Sci. Outre-Mer 33: 621-642.
Tiffen, M, M. Mortimore, and F.N. Gichuki. 1994. More People, Less Erosion: Environmental
Recovery in Kenya. Chichester: John Wiley & Sons. Turner, B.L., Goran Hyden, and Robert Kates (eds). 1993. Population Growth and Agricultural
Change in Africa. Gainesville, FL: University Press of Florida. Turner, B.L. 1989. The Specialist-Synthesis Approach to the Revival of Geography: The Case
of Cultural Ecology. Annales of the Association of American Geography 79 (1): 88-100. Uwizeyimana, Laurien. 1991. Croissance Démographique et Production Agricole au Rwanda:
Impossible Adéquation? Cahiers du Cidep no. 8. Louvain-la-Neuve: CIDEP.
22

TABLES
23

24

25

26

27
28

29
30
31