
Land capability Classification of Purba Medinipur district, … Case study Manojit Mondal1 and Md...
8
International Research Journal of Earth Sciences______________________________________ ISSN 2321–2527 Vol. 3(9), 13-20, September (2015) Int. Res. J. Earth Sci. International Science Congress Association 13 Land capability Classification of Purba Medinipur district, W.B.: A Geographical Case study Manojit Mondal 1 and Md Azfar Mondal 2 1 Department of Geography, Ranchi University, Ranchi, India and Assistant Teacher, Paramhansapur Barkatia High Madrasah, Purba Medinipur, W.B., INDIA 2 Department of Geography, Ranchi University, Ranchi, INDIA Available online at: www.isca.in, www.isca.me Received 26 th July 2015, revised 31 st August 2015, accepted 16 th Setpember 2015 Abstract Land capability classification is a process of grouping soils primarily on the basis of their capability to produce common cultivated crops and pasture plants without weakening over a long period of time. It is a scientific appraisal of physical characters of the land, inherent soil quality and management practices. This paper is an attempt to assess the land capability classification and relationship between agro-economic developments of Purba Medinipur district, West Bengal. Present study has been applying for measured the land capability classification of the Purba Medinipur district by method on the basis of V.R. Singh (1970). There are represent of positive factors as rainfall, soil fertility and irrigation facility and represent of negative factors as ruggedness number, soil erosion, water logging, forest density, drought, higher degree of slope and flood. With the help of Lorenz Curve, it has been found that Purba Medinipur district contains large area and low land capability in comparison with the coastal plains of West Bengal. The results of this research are going to provide reference for land capability region and management in this area. Keyword: Land capability, Agro-economic developments, Lorenz Curve, Ruggedness number, water logging. Introduction Land capability classification is an implement for interpretative grouping and grading of soils according to their potentialities and limitations. Land capability is the natural environmental ability of the land to preserve a range of land uses and management practices in the long term without degradation to soil, land, air and water resources 3 . Land capability not only depends upon the geomorphic parameters, soil fertility etc, but also upon technological inputs and management practices. Land capability is measurement basis on the biological characteristics of the land, the level to which this will limit a particular type of land use, and the present technology that is accessible for the management of the land. It provides in sequence on the broad agricultural land uses most physically appropriate to an area, that is, the uses with the best match between the physical rations of the use and the physical qualities of the land, and the potential hazards and limitations associated with specific uses over a site. It can provide guidance on the inputs and management necessities associated with different intensities of agricultural land use. Using land beyond its capability may have serious consequences for the land and soil resources of the State as well as broader environmental impacts on water, air and biodiversity. Impacts can include loss of valuable soils on agricultural land, soil acidification, structure decline, soil carbon decline and wind erosion leading to poor air quality. All these are general indications of land degradation. The risk of land degradation and the need to deal with land within its capability has been recognized at the federal level 4-6 and at the State level by the NSW Natural Resources Commission. Land management within capability is listed as one of 13 key natural resource management targets for NSW 7 , by 2015, there will be an increase in the area of land being managed within its capability. Land capability in one hand helps to find out efficiency of land for particular uses and on the other it helps to prevent improper use of land which leads erosion hazards and decline of land quality. Land capability classification enables the farmers to use the appropriately for sustainable production under required management measures. Study area: The district of Purba Medinipur is a typical representative of an area having various types of resource but suffering from underdevelopment. The following account of the resources of the district provides an ample evidence of backwardness in resource richness. The undivided Medinipur has been divided into paschim Mednipur and became a district under Purba Medinipur division on 2002. The funnel-shaped district, with its eastern part penetrating into Bay of Bengal lies between lat 21° 36' 35"N to 22° 02' 23"N and long 87° 22' 48"E to 88° 01' 12"E. The district is well connected by Kolkata, Bhuneshwar, Ranchi, Bankura, Burdwan by a network of roads and railway. It is also only about 75 km away from Hoogly estuary. Physiographically district lies in the plain area having slope towards east. The eastern part of district is bounded by Bay of Bengal, Howrah district in the North West Medinipur in the west, and south 24 Parganas in the east. Spreading over an area
Transcript of Land capability Classification of Purba Medinipur district, … Case study Manojit Mondal1 and Md...

International Research Journal of Earth Sciences______________________________________ ISSN 2321–2527 Vol. 3(9), 13-20, September (2015) Int. Res. J. Earth Sci.
International Science Congress Association 13
Land capability Classification of Purba Medinipur district, W.B.: A Geographical Case study
Manojit Mondal1 and Md Azfar Mondal2
1Department of Geography, Ranchi University, Ranchi, India and Assistant Teacher, Paramhansapur Barkatia High Madrasah, Purba Medinipur, W.B., INDIA
2Department of Geography, Ranchi University, Ranchi, INDIA
Available online at: www.isca.in, www.isca.me Received 26th July 2015, revised 31st August 2015, accepted 16th Setpember 2015
Abstract Land capability classification is a process of grouping soils primarily on the basis of their capability to produce common cultivated crops and pasture plants without weakening over a long period of time. It is a scientific appraisal of physical characters of the land, inherent soil quality and management practices. This paper is an attempt to assess the land capability classification and relationship between agro-economic developments of Purba Medinipur district, West Bengal. Present study has been applying for measured the land capability classification of the Purba Medinipur district by method on the basis of V.R. Singh (1970). There are represent of positive factors as rainfall, soil fertility and irrigation facility and represent of negative factors as ruggedness number, soil erosion, water logging, forest density, drought, higher degree of slope and flood. With the help of Lorenz Curve, it has been found that Purba Medinipur district contains large area and low land capability in comparison with the coastal plains of West Bengal. The results of this research are going to provide reference for land capability region and management in this area. Keyword: Land capability, Agro-economic developments, Lorenz Curve, Ruggedness number, water logging.
Introduction Land capability classification is an implement for interpretative grouping and grading of soils according to their potentialities and limitations. Land capability is the natural environmental ability of the land to preserve a range of land uses and management practices in the long term without degradation to soil, land, air and water resources3. Land capability not only depends upon the geomorphic parameters, soil fertility etc, but also upon technological inputs and management practices. Land capability is measurement basis on the biological characteristics of the land, the level to which this will limit a particular type of land use, and the present technology that is accessible for the management of the land. It provides in sequence on the broad agricultural land uses most physically appropriate to an area, that is, the uses with the best match between the physical rations of the use and the physical qualities of the land, and the potential hazards and limitations associated with specific uses over a site. It can provide guidance on the inputs and management necessities associated with different intensities of agricultural land use. Using land beyond its capability may have serious consequences for the land and soil resources of the State as well as broader environmental impacts on water, air and biodiversity. Impacts can include loss of valuable soils on agricultural land, soil acidification, structure decline, soil carbon decline and wind erosion leading to poor air quality. All these are general indications of land degradation. The risk of land degradation and the need to deal with land within its capability has been recognized at the federal level4-6 and at the State level by the
NSW Natural Resources Commission. Land management within capability is listed as one of 13 key natural resource management targets for NSW7, by 2015, there will be an increase in the area of land being managed within its capability. Land capability in one hand helps to find out efficiency of land for particular uses and on the other it helps to prevent improper use of land which leads erosion hazards and decline of land quality. Land capability classification enables the farmers to use the appropriately for sustainable production under required management measures. Study area: The district of Purba Medinipur is a typical representative of an area having various types of resource but suffering from underdevelopment. The following account of the resources of the district provides an ample evidence of backwardness in resource richness. The undivided Medinipur has been divided into paschim Mednipur and became a district under Purba Medinipur division on 2002. The funnel-shaped district, with its eastern part penetrating into Bay of Bengal lies between lat 21° 36' 35"N to 22° 02' 23"N and long 87° 22' 48"E to 88° 01' 12"E. The district is well connected by Kolkata, Bhuneshwar, Ranchi, Bankura, Burdwan by a network of roads and railway. It is also only about 75 km away from Hoogly estuary. Physiographically district lies in the plain area having slope towards east. The eastern part of district is bounded by Bay of Bengal, Howrah district in the North West Medinipur in the west, and south 24 Parganas in the east. Spreading over an area

International Research Journal of Earth Sciences____________________________________________________ ISSN 2321–2527 Vol. 3(9), 13-20, September (2015) Int. Res. J. Earth Sci.
International Science Congress Association 14
of 4093.94 km2, it consists of 3028 Mauza, 223 Gram panchayat, 25 CD Blocks, 4 Subdivision and inhabitated by 5095875, the district has density of 1186 person per km2 . Material and Methods Land Capability Classification necessary for the planning of agricultural development. Land use capability classification8 has been developed with an objective to discuss the site, soil and climate on farming. Sharma9 defined the land capability classification as “a field investigation of soil properties, slope, degree of soil erosion and changing land use patterns which form the basis for future planning of soil and water conservation”.
There are several methods commonly used for the rating the land capability classification such as Marbut’s10 method is based of statistical information on yield history of the particular piece of land, Morgan’s11 explain the degree of adaptation of land types of various crop, Bennett’s12 method establish on the site and physical land factors. V.R. Singh’s13 method the land capability classes should be determined with the help of physical and economic factors i.e., physiography, soil fertility. Other method are also land capability classification of the Bureau of Reclamation; L. D. Stamp’s land classification in Britain; land classification of U.S.S.R.; Land capability classification by A.I.S.L.S.O., I.C.A.R. etc.
Figure-1
Location map of Study area

International Research Journal of Earth Sciences____________________________________________________ ISSN 2321–2527 Vol. 3(9), 13-20, September (2015) Int. Res. J. Earth Sci.
International Science Congress Association 15
Present study has been applying for measured the land capability classification of the Purba Medinipur district by method on the basis of V.R. Singh13. In this method is below:
Land Capability Index (LCI)= ∑ ⋯……………..
∑ ×
∑ ⋯……………..∑ ×
Where, LIC = Land capability index, PFV = Positive factors values, NFV = Negative factors values, R, S, I = Rainfall, soil fertility and Irrigation facility represent as positive factors, Rn, Se, W, F, D, H and T = Ruggedness number, soil erosion, water logging, forest density, drought, higher degree of slope and flood represent as negative factors of land capability. Discussion and Results Land capability classifications are indicated by the some physical and socio-economic parameters. The Purba Medinipur district of West Bengal has the highly agricultural fertility soil on over the entire district. As with all interpretive groupings the capability classification begins with the individual soil-mapping units i.e. soil structure, soil texture, soil pH, soil organic matter
etc, which are building stones of the system (table-1). Present study the land capability classification are measurement by the micro level field study, there are data collection from the twenty five blocks on the basis of random sampling method. This survey data are tabulated on the basis of V.R. Singh method and calculate the gross Positive factors values, gross of Negative factors values and finally calculate the land capability index. There are represent the relationship between the Land Capability with Net Sown area by the scatter diagram. The preparation of Lorenz Curve the cumulative percentage of land capability on X axis and cumulative percentage of net area sown area on Y axis of different block has been used. There are analysis the help of Lorenz Curve, it has been found that Purba Medinipur district contains large area and low land capability in comparison with the coastal plains of West Bengal. There is land capability classification measurement by the some positive factors i.e. rainfall, soil fertility and irrigation facility and negative factors like ruggedness number, soil erosion, water logging, forest density, drought, higher degree of slope and flood.
Figure-2
Factors affecting of land capability
International Research Journal of Earth Sciences____________________________________________________ ISSN 2321–2527 Vol. 3(9), 13-20, September (2015) Int. Res. J. Earth Sci.
International Science Congress Association 16
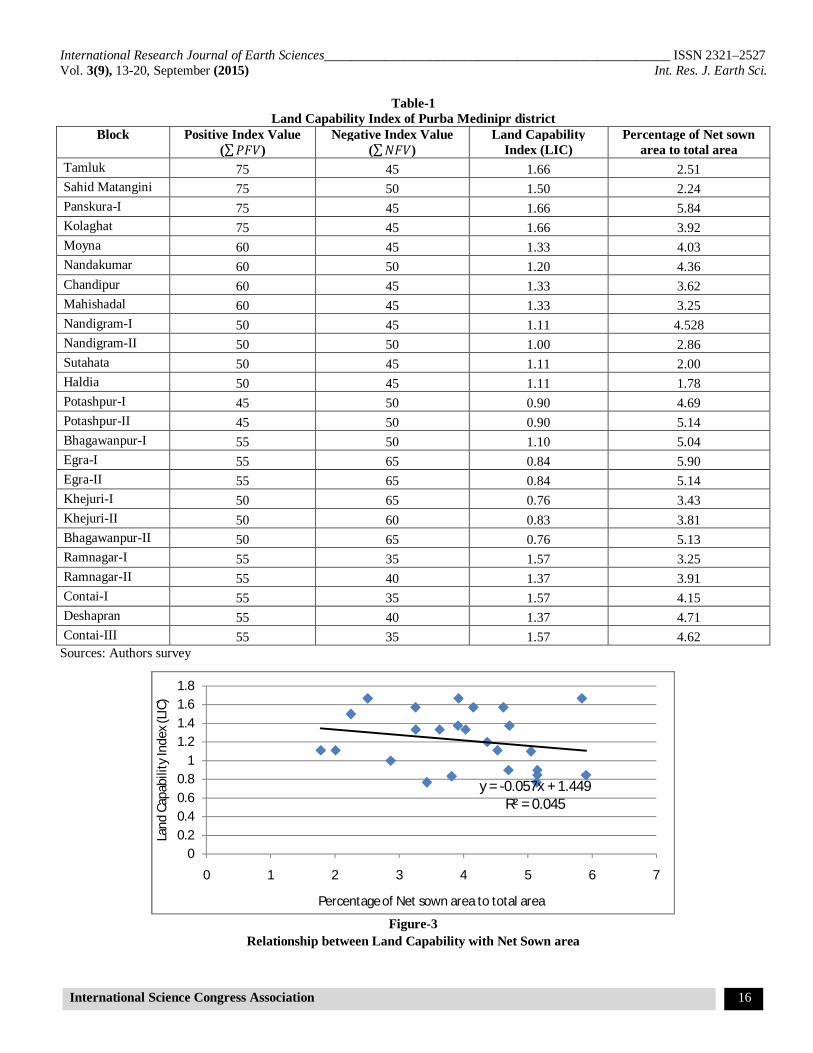
Table-1 Land Capability Index of Purba Medinipr district
Block Positive Index Value (∑푃퐹푉)
Negative Index Value (∑푁퐹푉)
Land Capability Index (LIC)
Percentage of Net sown area to total area
Tamluk 75 45 1.66 2.51 Sahid Matangini 75 50 1.50 2.24 Panskura-I 75 45 1.66 5.84 Kolaghat 75 45 1.66 3.92 Moyna 60 45 1.33 4.03 Nandakumar 60 50 1.20 4.36 Chandipur 60 45 1.33 3.62 Mahishadal 60 45 1.33 3.25 Nandigram-I 50 45 1.11 4.528 Nandigram-II 50 50 1.00 2.86 Sutahata 50 45 1.11 2.00 Haldia 50 45 1.11 1.78 Potashpur-I 45 50 0.90 4.69 Potashpur-II 45 50 0.90 5.14 Bhagawanpur-I 55 50 1.10 5.04 Egra-I 55 65 0.84 5.90 Egra-II 55 65 0.84 5.14 Khejuri-I 50 65 0.76 3.43 Khejuri-II 50 60 0.83 3.81 Bhagawanpur-II 50 65 0.76 5.13 Ramnagar-I 55 35 1.57 3.25 Ramnagar-II 55 40 1.37 3.91 Contai-I 55 35 1.57 4.15 Deshapran 55 40 1.37 4.71 Contai-III 55 35 1.57 4.62
Sources: Authors survey
Figure-3
Relationship between Land Capability with Net Sown area
y = -0.057x + 1.449R² = 0.045
00.20.40.60.8
11.21.41.61.8
0 1 2 3 4 5 6 7
Land
Cap
abili
ty In
dex (
LIC)
Percentage of Net sown area to total area

International Research Journal of Earth Sciences____________________________________________________ ISSN 2321–2527 Vol. 3(9), 13-20, September (2015) Int. Res. J. Earth Sci.
International Science Congress Association 17
In the evident from table-1 and figure-2 that relationship between land capabilities index in relation to net sown area. A product moment coefficient of correlation has been estimated which comes to r=0.045. This along significant the relationship of the capability index and the net sown area available in the region. For these two components of land use the regression value comes to y=0.057× + 1.449. In this way, it can be said that the intensity of net sown area is the real indicator of the potentialities of land capability in a region. Aft rewards Lorenz Curve has been used to measured the dispersion of land use capability index in different block of Purba Medinipur district, west Bengal. This graphical method has merit to illustrate the line of equal distribution of land capability in relation to the actual dispersion. For the preparation
of Lorenz Curve the cumulative percentage of land capability on x axis and cumulative percentage of net area sown area of different block has been used. With the help of Lorenz Curve, it has been found that Purba Medinipur district contains large area and low land capability in comparison with the coastal plains of West Bengal. Land capability region of Purba Medinipur district: In the evident from table-2 a map of land capability region in Purba Medinipur district has been prepared. The categories of coloring has been chosen on the basis of the ‘Semi Inter Quartile Range’ principle of statistics, which has been divided a set of data into four sub-group.in this way, the district of Purba Medinipur has been divided into four categories of land capability regions.
Table-2 Cumulative percentage of Land capability and net sown area in Purba Medinipur district
Block Cumulative Percentage (X)
Percentage of land Capability index
Cumulative percentage of land capability index
Tamluk 3.43 5.471349 2.525238 Sahid Matangini 8.56 4.924213 5.050476 Panskura-I 12.37 5.471349 7.786149 Kolaghat 18.27 5.471349 10.56391 Moyna 23.41 4.377077 13.34167 Nandakumar 28.1 3.93937 16.2962 Chandipur 33.24 4.377077 19.25073 Mahishadal 36.1 4.377077 22.53354 Nandigram-I 41.14 3.647565 26.14463 Nandigram-II 45.66 3.282809 29.79219 Sutahata 47.66 3.647565 33.43976 Haldia 49.44 3.647565 37.08732 Potashpur-I 53.8 2.954528 41.02669 Potashpur-II 57.83 2.954528 45.40377 Bhagawanpur-I 61.45 3.61109 49.78085 Egra-I 64.7 2.777762 54.15792 Egra-II 68.61 2.777762 58.67179 Khejuri-I 73.32 2.525238 63.18565 Khejuri-II 75.56 2.735673 68.10986 Bhagawanpur-II 78.81 2.525238 73.26856 Ramnagar-I 82.96 5.158701 78.42726 Ramnagar-II 87.58 4.513862 83.58596 Contai-I 90.09 5.158701 89.05731 Deshapran 96.08 4.513862 94.52866 Contai-III 100 5.158701 100 Source: Compiled by the Author

International Research Journal of Earth Sciences____________________________________________________ ISSN 2321–2527 Vol. 3(9), 13-20, September (2015) Int. Res. J. Earth Sci.
International Science Congress Association 18
Figure-4
Dispersion of land capability on Lorenz curve
Table-3 Block wise regional distribution of land capability in Purba Medinipur district,
Grades Value Extension of land capability
Categories of Blocks
High land capability area >1.44 Panskura-I, Kolaghat Sahid Matangini, Tamluk, Ramnagar-I Contai-I Contai-III
Medium land capability area: 1.22-1.44 Moyna, Chandipur Mahishadal Ramnagar-II Deshapran
Low land capability area 1.00-1.22 Nandakumar, Nandigram-II Nandigram-I Sutahata Haldia Bhagawanpur-I
Very low land capability area <1 Potashpur-I, Potashpur-II Khejuri-II Bhagawanpur-II Egra-I Egra-II Khejuri-I
Source: Compiled by the Author Region of highest land capability index: The blocks having more than 1.44 land capability index (LCI) come under this categories of region. It comprises the block of Panskura-I, Kolaghat Sahid Matangini, Tamluk, Ramnagar-I Contai-I and Contai-III. In these blocks factors like rainfall and soil fertility for raising better crops supported by artificial irrigation facility keep the capability of the land highest and the positive factors predominate in comparison with the negative factors. Region of medium land capability index: This categories land capability index range value is 1.22-1.44. It comprises the blocks of Moyna, Chandipur, Mahishadal, Ramnagar-II and Deshapran. Here the land capability is medium due to positive factors and negative factors have been equal effective to the measurement of land capability.
Region of moderate land capability index: All the blocks having partly rugged terrain and partly plain come under this group and land capability index value range from 1.00 to 1.22. this categories included the blocks are Nandakumar, Nandigram-II Nandigram-I Sutahata Haldia Bhagawanpur-I. In the above areas the limiting factors are rugged forested terrain, inferior qualitility of soil, etc. only hard labour and huge capital investment can raise their capability index, which requires fertilizer, and the protection from the hazarded of soil erosion. Region of low land capability index: Under this categories have land capability index value range less than 1.00 which includes the blocks of Potashpur-I, Potashpur-II Khejuri-II Bhagawanpur-II Egra-I Egra-II and Khejuri-I. In these areas the negative factors are high affected and positive factors are low affected for the land capability determination and for this reason

International Research Journal of Earth Sciences____________________________________________________ ISSN 2321–2527 Vol. 3(9), 13-20, September (2015) Int. Res. J. Earth Sci.
International Science Congress Association 19
these areas have lowest land capability index in Purba Medinipur district. Conclusion At the conclusion, it can be safely stated that the term ‘Land capability’ is contemplated here as the scientific evaluation of the physical factors in attractive the net sown area of Purba Medinipur district in West Bengal. The product moment coefficient of correlation is high for land capability and net sown area, which suggest that land should be properly managed
for booting up the production from the land. Such measurement is also necessary for the farm planning on regional level to credit the regional imbalance of agricultural growth. The result obtained for particular land use, land capability required and copping pattern sets out a very interesting picture. In this way, on Lorenz Curve the dispersion of land capability is also shown which represents the division from the line of equal distribution. This study has also a advantage to help in agricultural planning and guiding for the better land use, in a exacting capability class zone.
Figure-5
Land capability region of Purba Medinipur district

International Research Journal of Earth Sciences____________________________________________________ ISSN 2321–2527 Vol. 3(9), 13-20, September (2015) Int. Res. J. Earth Sci.
International Science Congress Association 20
References 1. Dent D. and Young A., Soil Survey and Land Evaluation,
George Allen and Unwin, (1981) 2. Emery K.A., Rural land capability mapping. Soil
Conservation Service of NSW, Sydney, (1986) 3. Sonter R.O. and Lawrie. J.W., Soils and rural land
capability, in Soils: Their properties and management, 3rd edition, PEV Charman and BW Murphy (eds). Oxford University Press, Melbourne (2007)
4. McKenzie N.J., Henderson B. and McDonald W.S., Monitoring soil change: Principles and practices for Australian conditions, Land and Water Technical Report 18/02. CSIRO, Canberra, (2002)
5. Campbell A., Managing Australia’s Soils: A policy discussion paper, prepared for the National Committee on Soil and Terrain through the Natural Resource Management Ministerial Council (2008)
6. Dixon J., McKenzie N.J., Crawford D., Gazey C., Grose C., Hughes B., Merry R., Moody P. and Wilson B., Soil Acidification in Monitoring Soil Condition Across Australia— Recommendations from the Expert Panels to the National Committee on Soil and Terrain Information and the National Land and Water Resources Audit Advisory Council, Canberra (2007)
7. NRC, Recommendations: State-wide standards and targets, Document D05/4894. Natural Resources Commission of NSW, Sydney, (2005)
8. Klingebiel A.A. and Montgomery P.H., Land capability classification. USDA. Soil Conservation Service. Agricultural Handbook No. 210 (1961)
9. Sharma H.S., Land capability classification OF Lower Chambal valley. Sym. On Land use in developing countries, 21st IGC, Aligarh, 173-179 (1972)
10. Marbut C., Soil of United States, Atlas of American Agriculture, Part III, U.S.D. of agriculture, Bureau of Agriculture (1935)
11. Morgan M.F., Bulletin Connecticut Agriculture Experiment Station, 423, (1939)
12. Bennett H.H., Soil Conservation, McGraw Hill Book Company, INC, New York, (1939)
13. Singh R.V., Land Capability: A Method of Classification, The Professional Geographer, XXII(1), 40-41 (1970)
14. Mandal R.B., Land Utilization: Theory and Practice, Concept Publication Company, New Delhi, 196-213 (1982)
15. De. N.K. and Jana. N.C., The land: Multifaceted appraisal and management. The University of Burdwan, 168-211 (1996)


![Official Website of Marwari College,Ranchi, Ranchi (Jharkhand) · 2021. 1. 27. · 10 PG/2020-2022/70995 Ranchi Univers PRIYANKA MIN] ST Ranchi Univers ASHA TOPPO ST ST Outsider-](https://static.fdocuments.net/doc/165x107/612851400c77e12efd6b579d/official-website-of-marwari-collegeranchi-ranchi-jharkhand-2021-1-27-10.jpg)


