Lampiran 1. Penghitungan Dosis - repository.maranatha.edu · 3 Kelompok kontrol positif –...
15
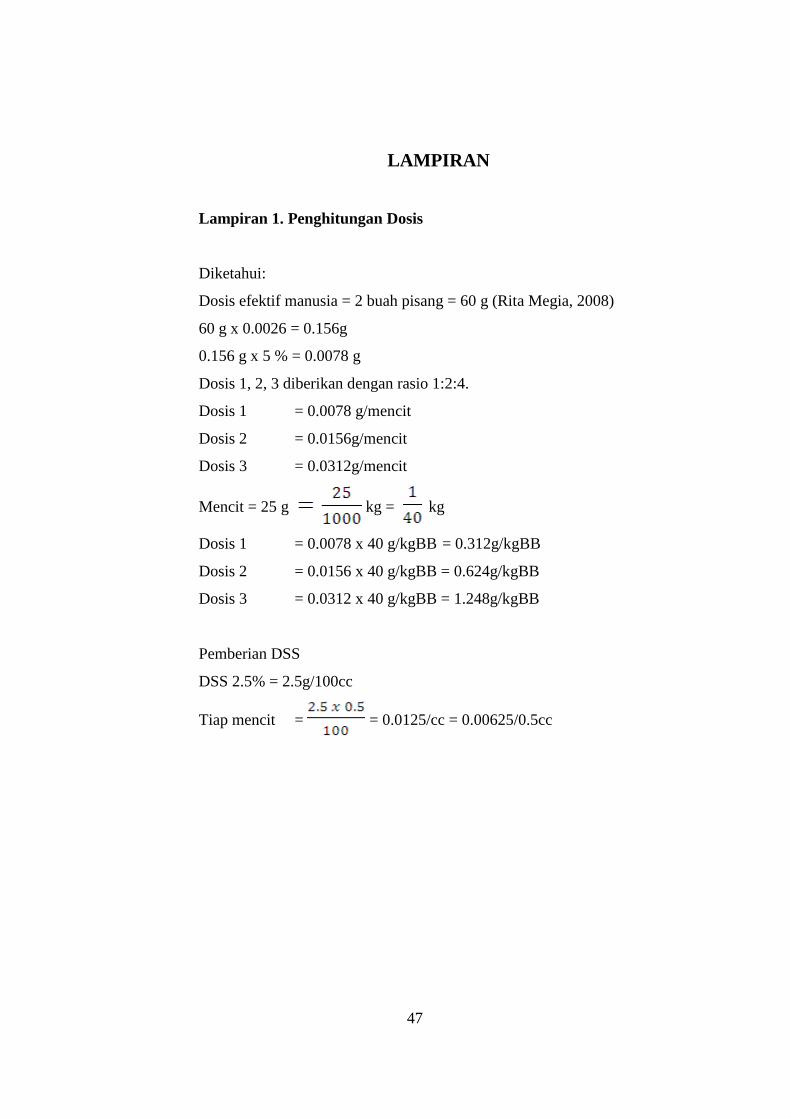
LAMPIRAN Lampiran 1. Penghitungan Dosis Diketahui: Dosis efektif manusia = 2 buah pisang = 60 g (Rita Megia, 2008) 60 g x 0.0026 = 0.156g 0.156 g x 5 % = 0.0078 g Dosis 1, 2, 3 diberikan dengan rasio 1:2:4. Dosis 1 = 0.0078 g/mencit Dosis 2 = 0.0156g/mencit Dosis 3 = 0.0312g/mencit Mencit = 25 g kg = kg Dosis 1 = 0.0078 x 40 g/kgBB = 0.312g/kgBB Dosis 2 = 0.0156 x 40 g/kgBB = 0.624g/kgBB Dosis 3 = 0.0312 x 40 g/kgBB = 1.248g/kgBB Pemberian DSS DSS 2.5% = 2.5g/100cc Tiap mencit = = 0.0125/cc = 0.00625/0.5cc 47
Transcript of Lampiran 1. Penghitungan Dosis - repository.maranatha.edu · 3 Kelompok kontrol positif –...
1
LAMPIRAN
Lampiran 1. Penghitungan Dosis
Diketahui:
Dosis efektif manusia = 2 buah pisang = 60 g (Rita Megia, 2008)
60 g x 0.0026 = 0.156g
0.156 g x 5 % = 0.0078 g
Dosis 1, 2, 3 diberikan dengan rasio 1:2:4.
Dosis 1 = 0.0078 g/mencit
Dosis 2 = 0.0156g/mencit
Dosis 3 = 0.0312g/mencit
Mencit = 25 g kg = kg
Dosis 1 = 0.0078 x 40 g/kgBB = 0.312g/kgBB
Dosis 2 = 0.0156 x 40 g/kgBB = 0.624g/kgBB
Dosis 3 = 0.0312 x 40 g/kgBB = 1.248g/kgBB
Pemberian DSS
DSS 2.5% = 2.5g/100cc
Tiap mencit = = 0.0125/cc = 0.00625/0.5cc
47
2
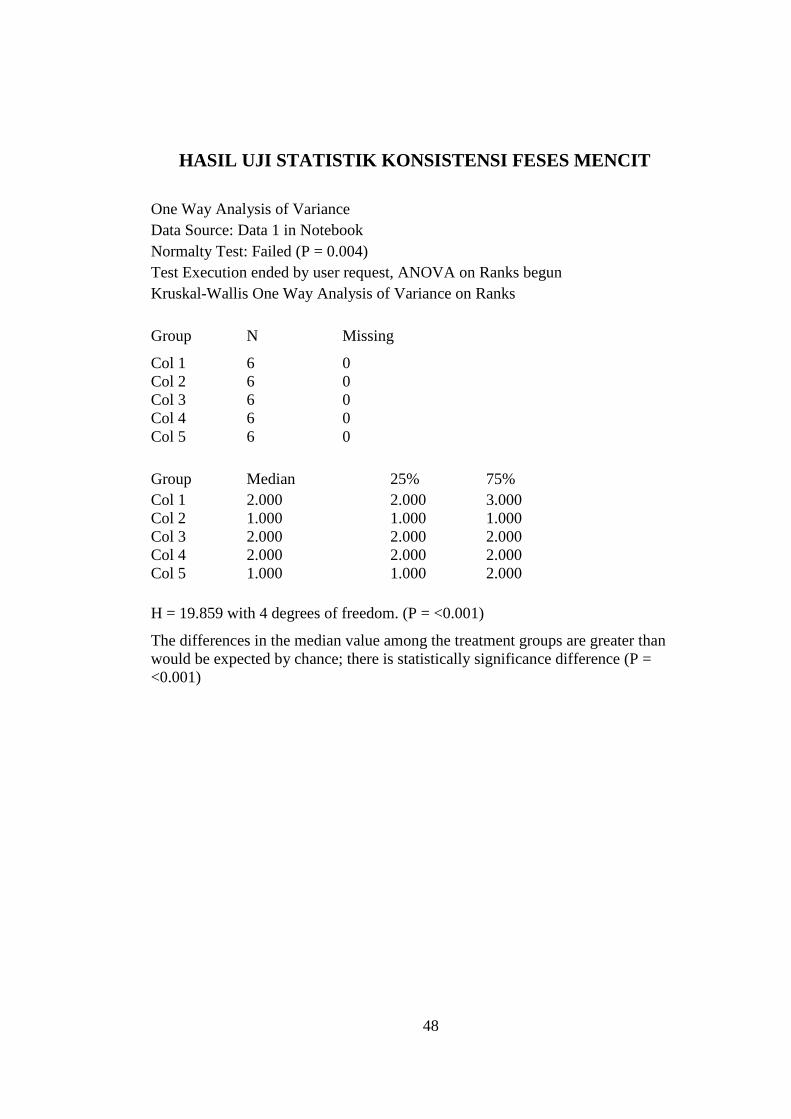
HASIL UJI STATISTIK KONSISTENSI FESES MENCIT
One Way Analysis of Variance
Data Source: Data 1 in Notebook
Normalty Test: Failed (P = 0.004)
Test Execution ended by user request, ANOVA on Ranks begun
Kruskal-Wallis One Way Analysis of Variance on Ranks
Group N Missing
Col 1 6 0
Col 2 6 0
Col 3 6 0
Col 4 6 0
Col 5 6 0
Group Median 25% 75%
Col 1 2.000 2.000 3.000
Col 2 1.000 1.000 1.000
Col 3 2.000 2.000 2.000
Col 4 2.000 2.000 2.000
Col 5 1.000 1.000 2.000
H = 19.859 with 4 degrees of freedom. (P = <0.001)
The differences in the median value among the treatment groups are greater than
would be expected by chance; there is statistically significance difference (P =
<0.001)
48
3
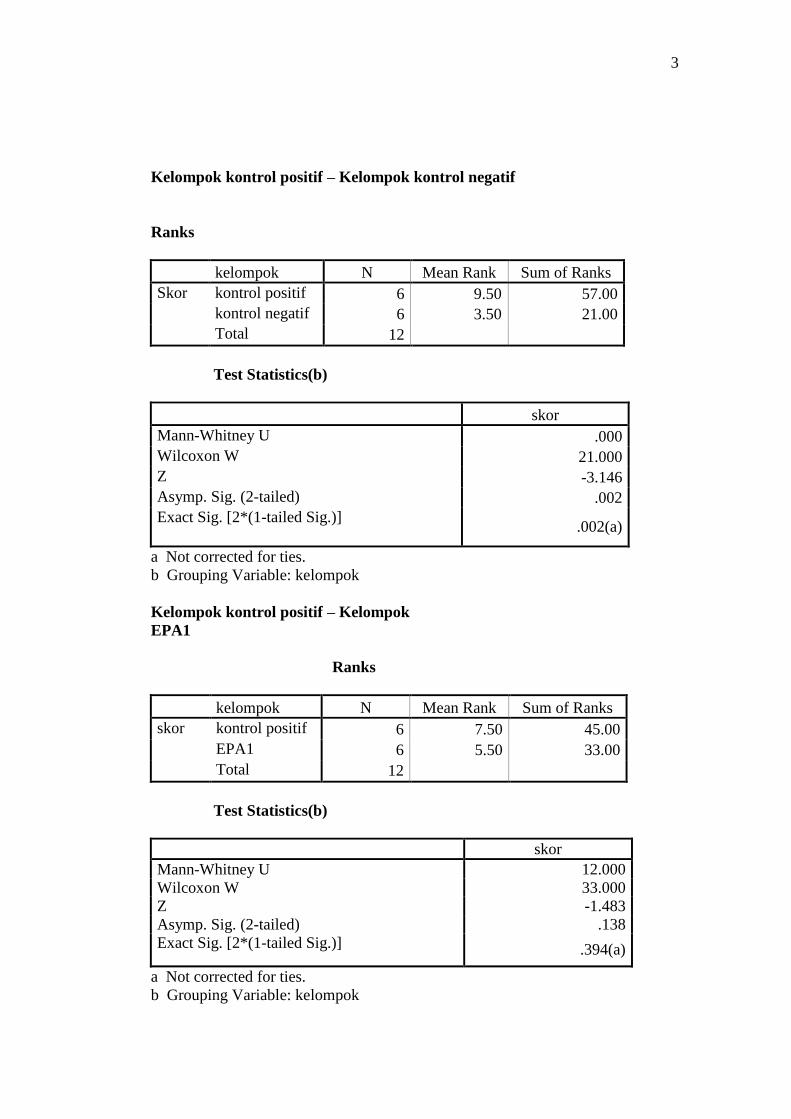
Kelompok kontrol positif – Kelompok kontrol negatif
Ranks
kelompok N Mean Rank Sum of Ranks
Skor kontrol positif 6 9.50 57.00
kontrol negatif 6 3.50 21.00
Total 12
Test Statistics(b)
skor
Mann-Whitney U .000
Wilcoxon W 21.000
Z -3.146
Asymp. Sig. (2-tailed) .002
Exact Sig. [2*(1-tailed Sig.)] .002(a)
a Not corrected for ties.
b Grouping Variable: kelompok
Kelompok kontrol positif – Kelompok
EPA1
Ranks
kelompok N Mean Rank Sum of Ranks
skor kontrol positif 6 7.50 45.00
EPA1 6 5.50 33.00
Total 12
Test Statistics(b)
skor
Mann-Whitney U 12.000
Wilcoxon W 33.000
Z -1.483
Asymp. Sig. (2-tailed) .138
Exact Sig. [2*(1-tailed Sig.)] .394(a)
a Not corrected for ties.
b Grouping Variable: kelompok
4
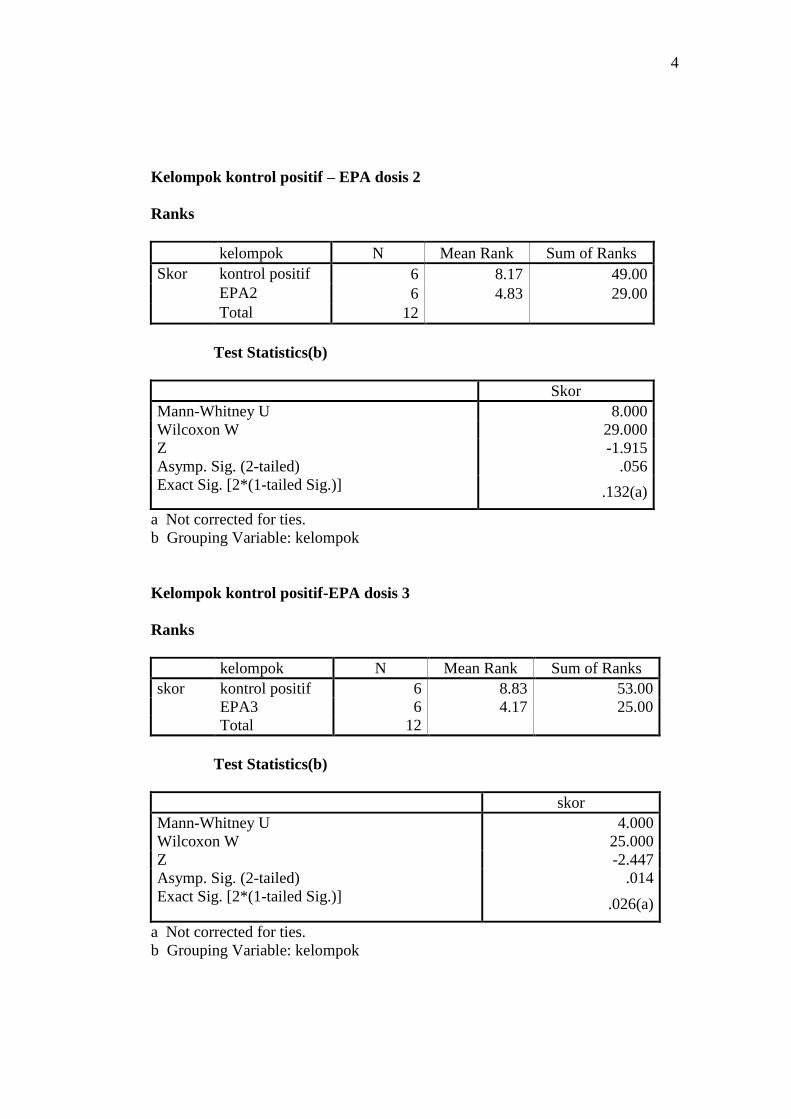
Kelompok kontrol positif – EPA dosis 2
Ranks
kelompok N Mean Rank Sum of Ranks
Skor kontrol positif 6 8.17 49.00
EPA2 6 4.83 29.00
Total 12
Test Statistics(b)
Skor
Mann-Whitney U 8.000
Wilcoxon W 29.000
Z -1.915
Asymp. Sig. (2-tailed) .056
Exact Sig. [2*(1-tailed Sig.)] .132(a)
a Not corrected for ties.
b Grouping Variable: kelompok
Kelompok kontrol positif-EPA dosis 3
Ranks
kelompok N Mean Rank Sum of Ranks
skor kontrol positif 6 8.83 53.00
EPA3 6 4.17 25.00
Total 12
Test Statistics(b)
skor
Mann-Whitney U 4.000
Wilcoxon W 25.000
Z -2.447
Asymp. Sig. (2-tailed) .014
Exact Sig. [2*(1-tailed Sig.)] .026(a)
a Not corrected for ties.
b Grouping Variable: kelompok
5
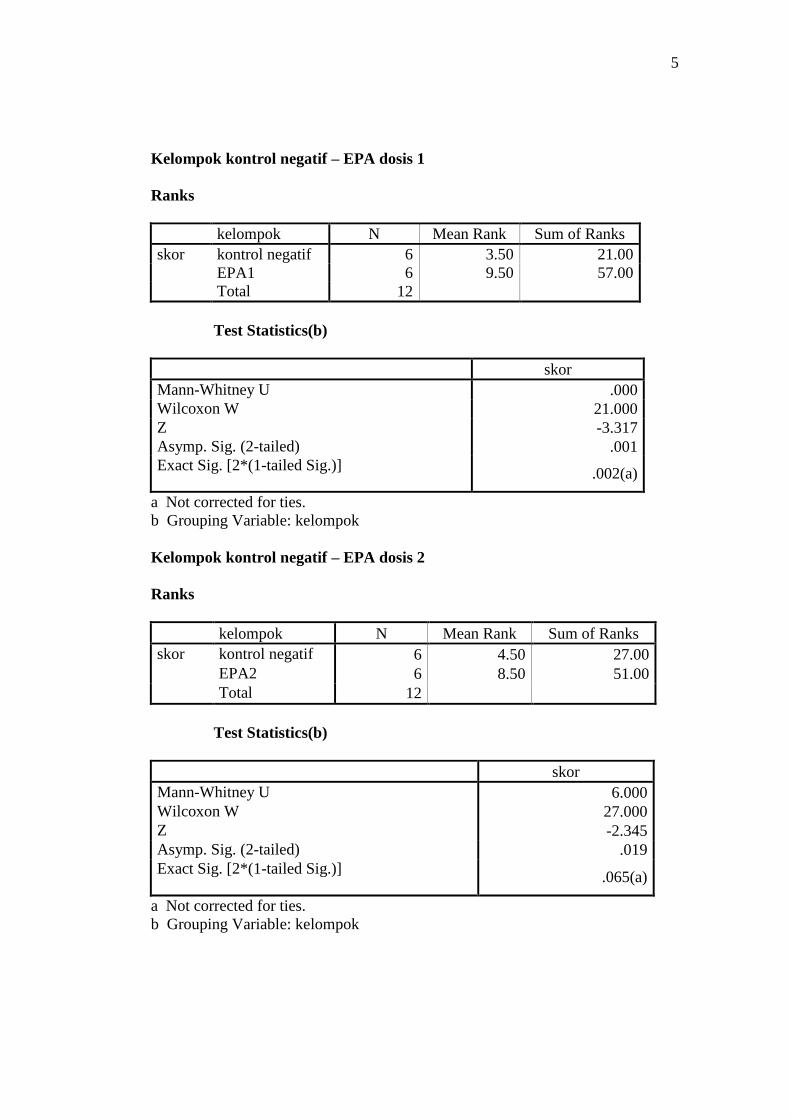
Kelompok kontrol negatif – EPA dosis 1
Ranks
kelompok N Mean Rank Sum of Ranks
skor kontrol negatif 6 3.50 21.00
EPA1 6 9.50 57.00
Total 12
Test Statistics(b)
skor
Mann-Whitney U .000
Wilcoxon W 21.000
Z -3.317
Asymp. Sig. (2-tailed) .001
Exact Sig. [2*(1-tailed Sig.)] .002(a)
a Not corrected for ties.
b Grouping Variable: kelompok
Kelompok kontrol negatif – EPA dosis 2
Ranks
kelompok N Mean Rank Sum of Ranks
skor kontrol negatif 6 4.50 27.00
EPA2 6 8.50 51.00
Total 12
Test Statistics(b)
skor
Mann-Whitney U 6.000
Wilcoxon W 27.000
Z -2.345
Asymp. Sig. (2-tailed) .019
Exact Sig. [2*(1-tailed Sig.)] .065(a)
a Not corrected for ties.
b Grouping Variable: kelompok
6
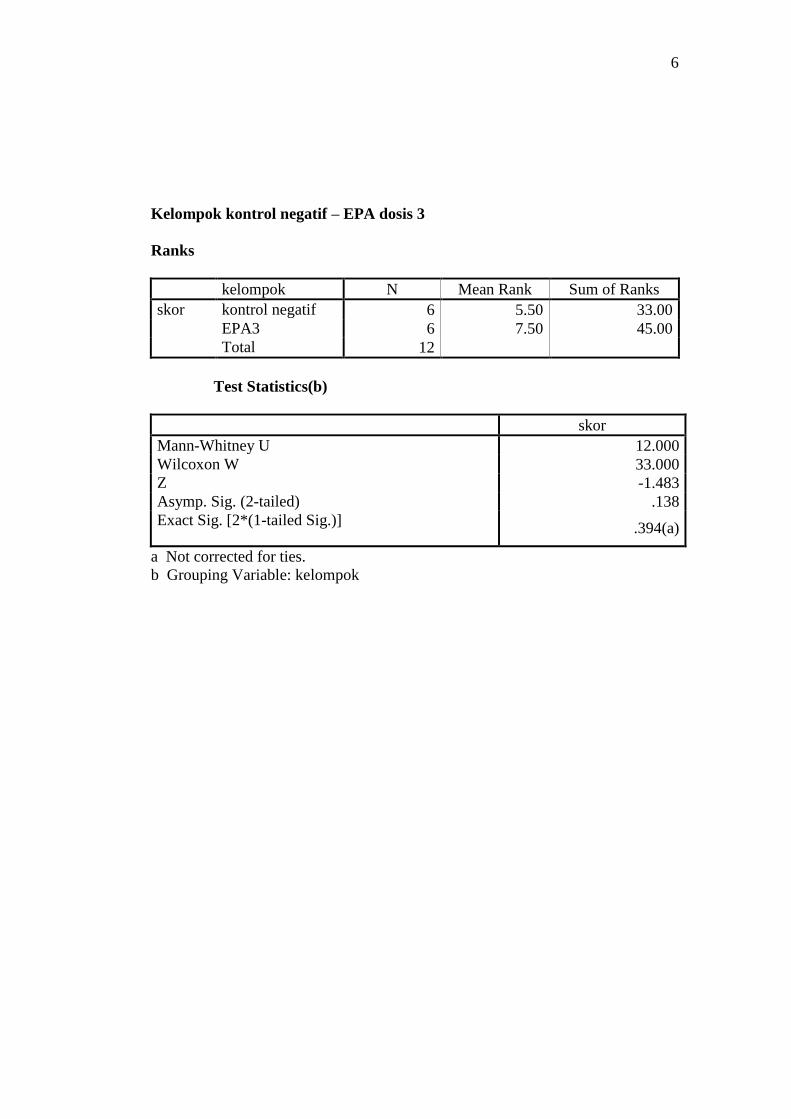
Kelompok kontrol negatif – EPA dosis 3
Ranks
kelompok N Mean Rank Sum of Ranks
skor kontrol negatif 6 5.50 33.00
EPA3 6 7.50 45.00
Total 12
Test Statistics(b)
skor
Mann-Whitney U 12.000
Wilcoxon W 33.000
Z -1.483
Asymp. Sig. (2-tailed) .138
Exact Sig. [2*(1-tailed Sig.)] .394(a)
a Not corrected for ties.
b Grouping Variable: kelompok
7
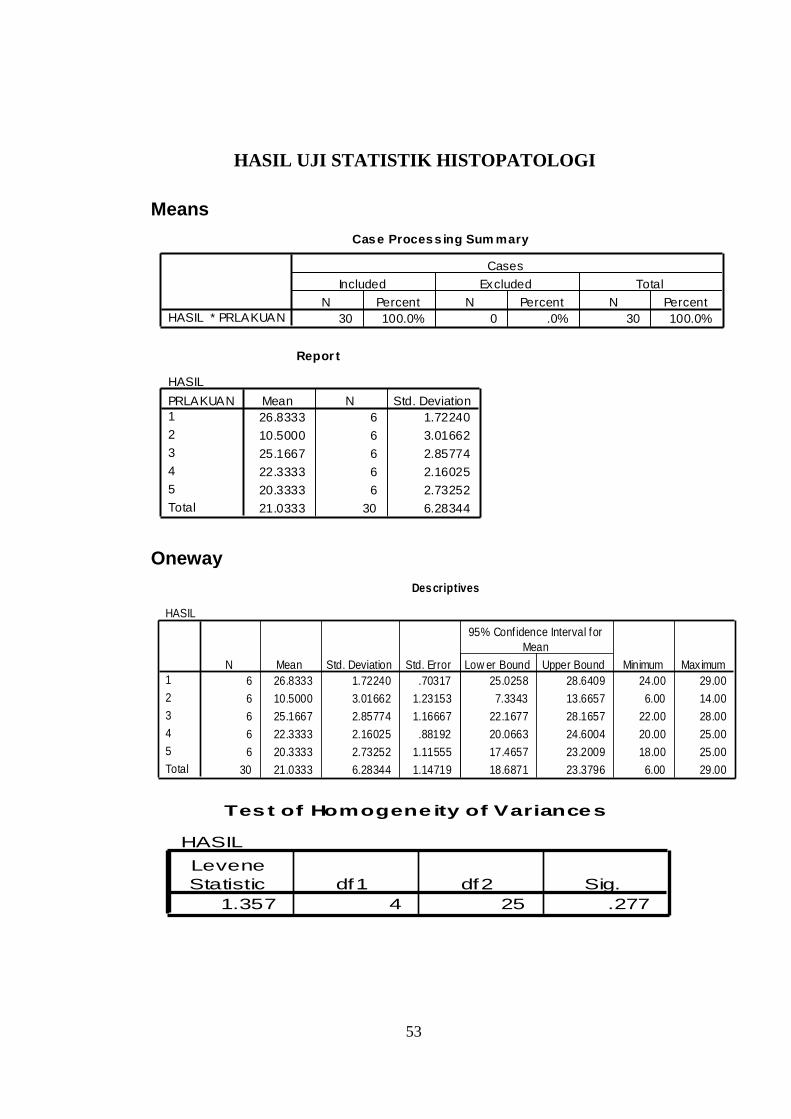
HASIL UJI STATISTIK HISTOPATOLOGI
Means
Case Process ing Sum mary
30 100.0% 0 .0% 30 100.0%HASIL * PRLAKUAN
N Percent N Percent N Percent
Included Excluded Total
Cases
Repor t
HASIL
26.8333 6 1.72240
10.5000 6 3.01662
25.1667 6 2.85774
22.3333 6 2.16025
20.3333 6 2.73252
21.0333 30 6.28344
PRLAKUAN
1
2
3
4
5
Total
Mean N Std. Deviation
Oneway
Descriptives
HASIL
6 26.8333 1.72240 .70317 25.0258 28.6409 24.00 29.00
6 10.5000 3.01662 1.23153 7.3343 13.6657 6.00 14.00
6 25.1667 2.85774 1.16667 22.1677 28.1657 22.00 28.00
6 22.3333 2.16025 .88192 20.0663 24.6004 20.00 25.00
6 20.3333 2.73252 1.11555 17.4657 23.2009 18.00 25.00
30 21.0333 6.28344 1.14719 18.6871 23.3796 6.00 29.00
1
2
3
4
5
Total
N Mean Std. Deviation Std. Error Low er Bound Upper Bound
95% Conf idence Interval for
Mean
Minimum Maximum
Test of Homogeneity of Variances
HASIL
1.357 4 25 .277
Levene
Statistic df1 df2 Sig.
53
8
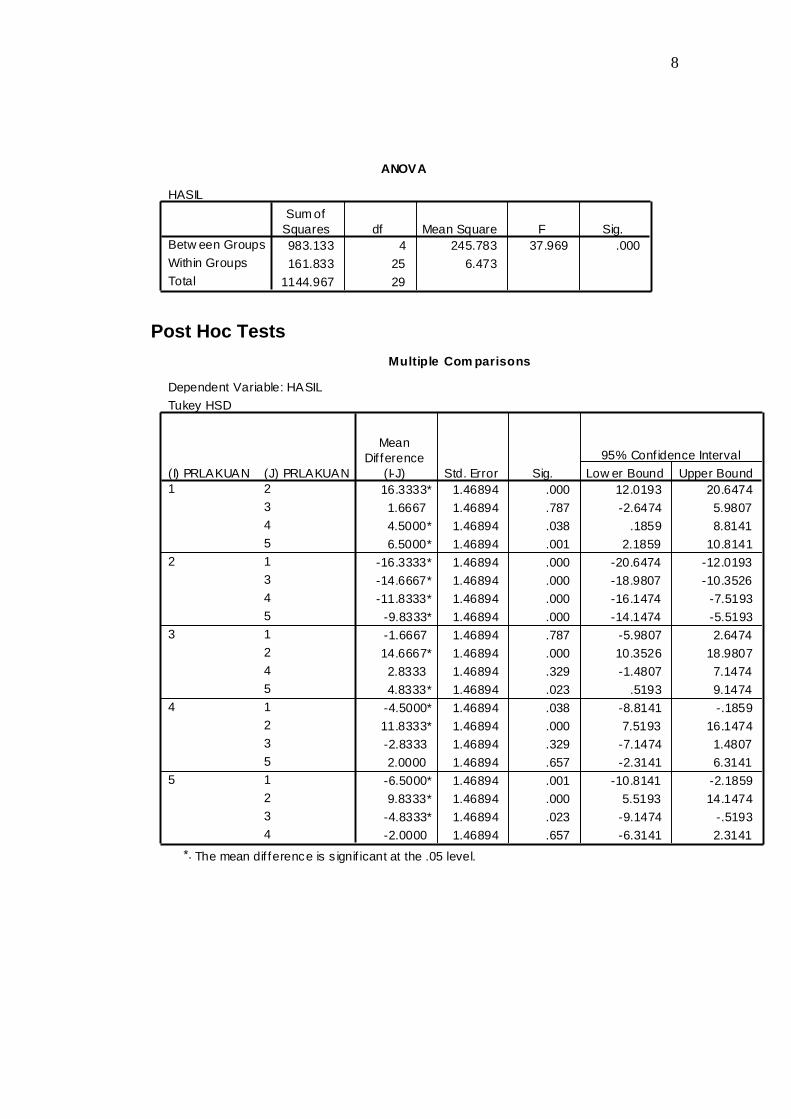
ANOVA
HASIL
983.133 4 245.783 37.969 .000
161.833 25 6.473
1144.967 29
Betw een Groups
Within Groups
Total
Sum of
Squares df Mean Square F Sig.
Post Hoc Tests
Multiple Com parisons
Dependent Variable: HASIL
Tukey HSD
16.3333* 1.46894 .000 12.0193 20.6474
1.6667 1.46894 .787 -2.6474 5.9807
4.5000* 1.46894 .038 .1859 8.8141
6.5000* 1.46894 .001 2.1859 10.8141
-16.3333* 1.46894 .000 -20.6474 -12.0193
-14.6667* 1.46894 .000 -18.9807 -10.3526
-11.8333* 1.46894 .000 -16.1474 -7.5193
-9.8333* 1.46894 .000 -14.1474 -5.5193
-1.6667 1.46894 .787 -5.9807 2.6474
14.6667* 1.46894 .000 10.3526 18.9807
2.8333 1.46894 .329 -1.4807 7.1474
4.8333* 1.46894 .023 .5193 9.1474
-4.5000* 1.46894 .038 -8.8141 -.1859
11.8333* 1.46894 .000 7.5193 16.1474
-2.8333 1.46894 .329 -7.1474 1.4807
2.0000 1.46894 .657 -2.3141 6.3141
-6.5000* 1.46894 .001 -10.8141 -2.1859
9.8333* 1.46894 .000 5.5193 14.1474
-4.8333* 1.46894 .023 -9.1474 -.5193
-2.0000 1.46894 .657 -6.3141 2.3141
(J) PRLAKUAN
2
3
4
5
1
3
4
5
1
2
4
5
1
2
3
5
1
2
3
4
(I) PRLAKUAN
1
2
3
4
5
Mean
Dif ference
(I-J) Std. Error Sig. Low er Bound Upper Bound
95% Conf idence Interval
The mean dif ference is s ignif icant at the .05 level.*.
9
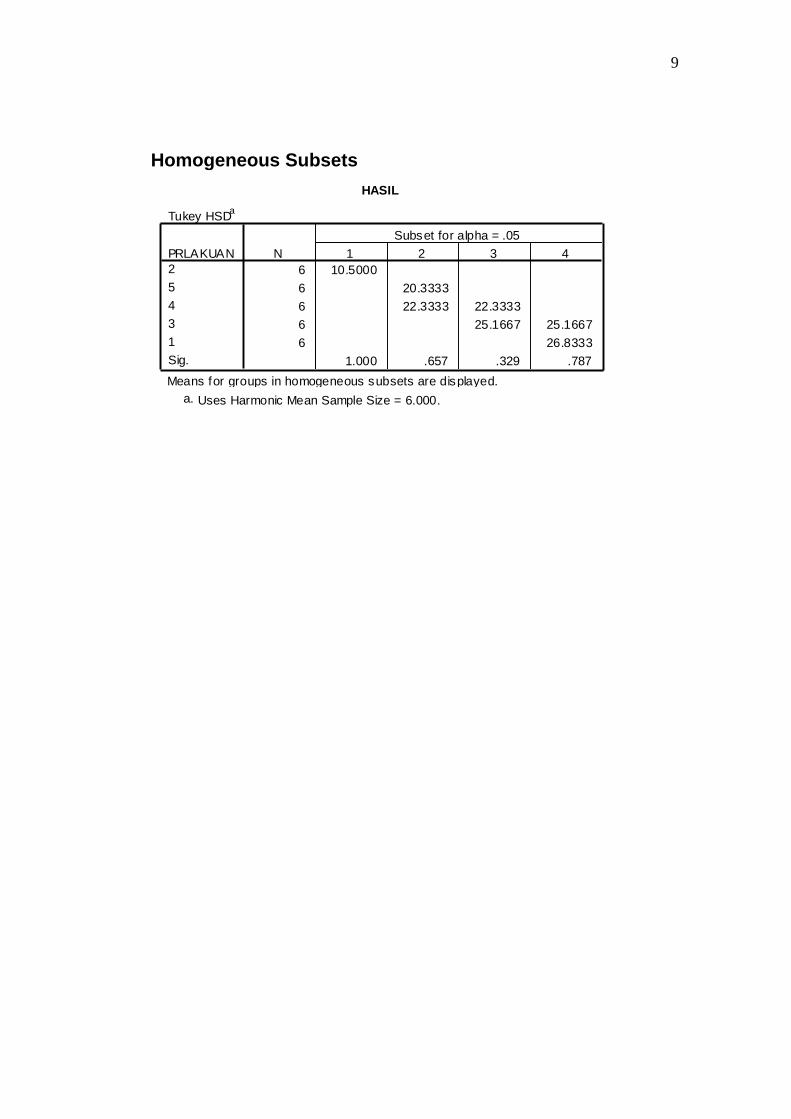
Homogeneous Subsets
HASIL
Tukey HSDa
6 10.5000
6 20.3333
6 22.3333 22.3333
6 25.1667 25.1667
6 26.8333
1.000 .657 .329 .787
PRLAKUAN
2
5
4
3
1
Sig.
N 1 2 3 4
Subset for alpha = .05
Means for groups in homogeneous subsets are displayed.
Uses Harmonic Mean Sample Size = 6.000.a.
10
CARA KERJA PEMBUATAN PREPARAT
Jaringan kolon diperoleh dengan laparotomi mencit yang telah di dekapitasi
dan difiksasi dalam larutan formalin 10%. Jaringan kolon kemudian didehidrasi
secara serial alkohol 70%, 80%, 90%, dan 96% masing-masing selama 30 menit
dalam inkubator dengan suhu 650 C. Selanjutnya preparat tersebut dimasukkan
dalam parafin cair 1, 2, dan 3 masing-masing 30 menit dalam inkubator dengan
suhu 650 C, lalu dibuat blok parafin dalam suhu kamar.
Blok parafin disayat dengan mikrotom setebal 5 µm, ditempelkan pada object
glass lalu dilakukan pewarnaan hematoksilin eosin. Cara melakukan pewarnaan
dengan hematoksilin eosin adalah:
deparafinisasi (menghilangkan parafin dari preparat) dengan xylol sebanyak
dua kali, alkohol 80%, alkohol 90%, dan 98% masing-masing selama 3 menit.
Lalu dibilas dengan air mengalir.
direndam dalam hematoksilin selama 5 menit, lalu dibilas dengan air
mengalir.
selanjutnya dicelupkan dalam litium sebanyak 4 celupan, lalu dibilas dengan
air mengalir.
dicelupkan dalam alkohol 80% sebanyak 20 celupan.
direndam dalam eosin selama 5 menit, dibilas dengan air mengalir.
dehidrasi dengan alkohol 80%, 90%, dan 96%.
alkohol dibersihkan dengan xylol sebanyak dua kali.
object glass dengan jaringan hepar yang sudah diwarnai ditutup dengan cover
glass menggunakan entellan.
11
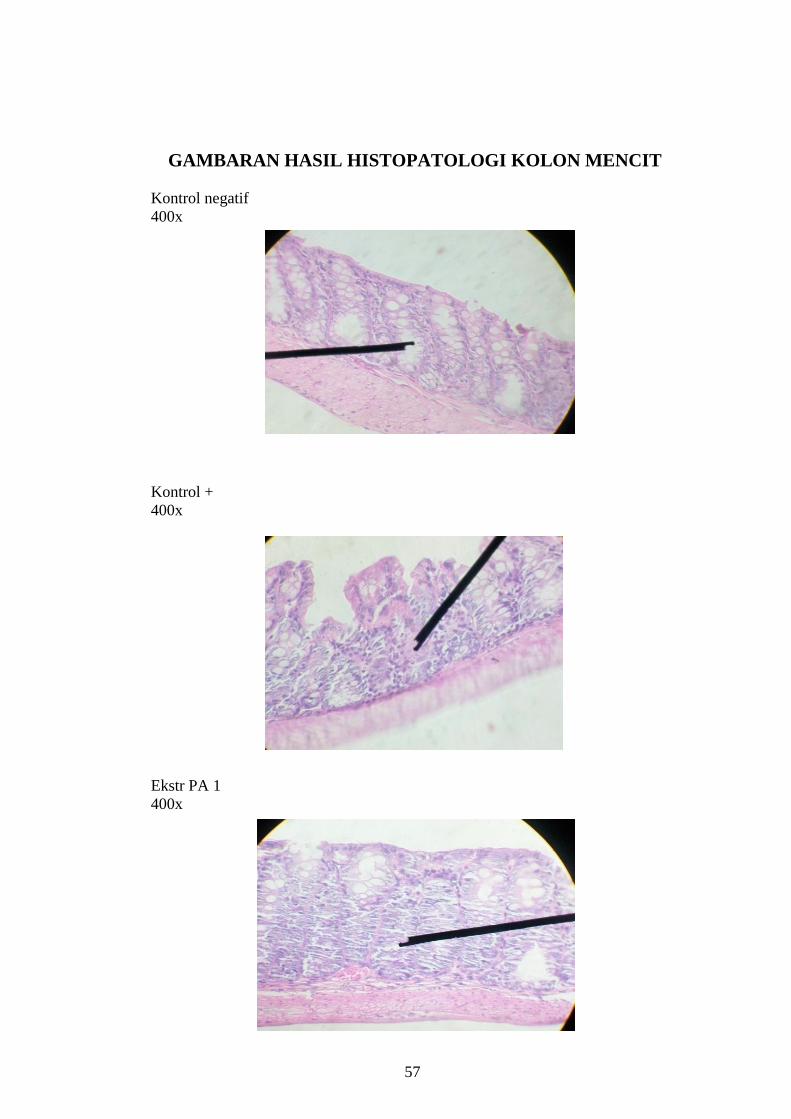
GAMBARAN HASIL HISTOPATOLOGI KOLON MENCIT
Kontrol negatif
400x
Kontrol +
400x
Ekstr PA 1
400x
57
12
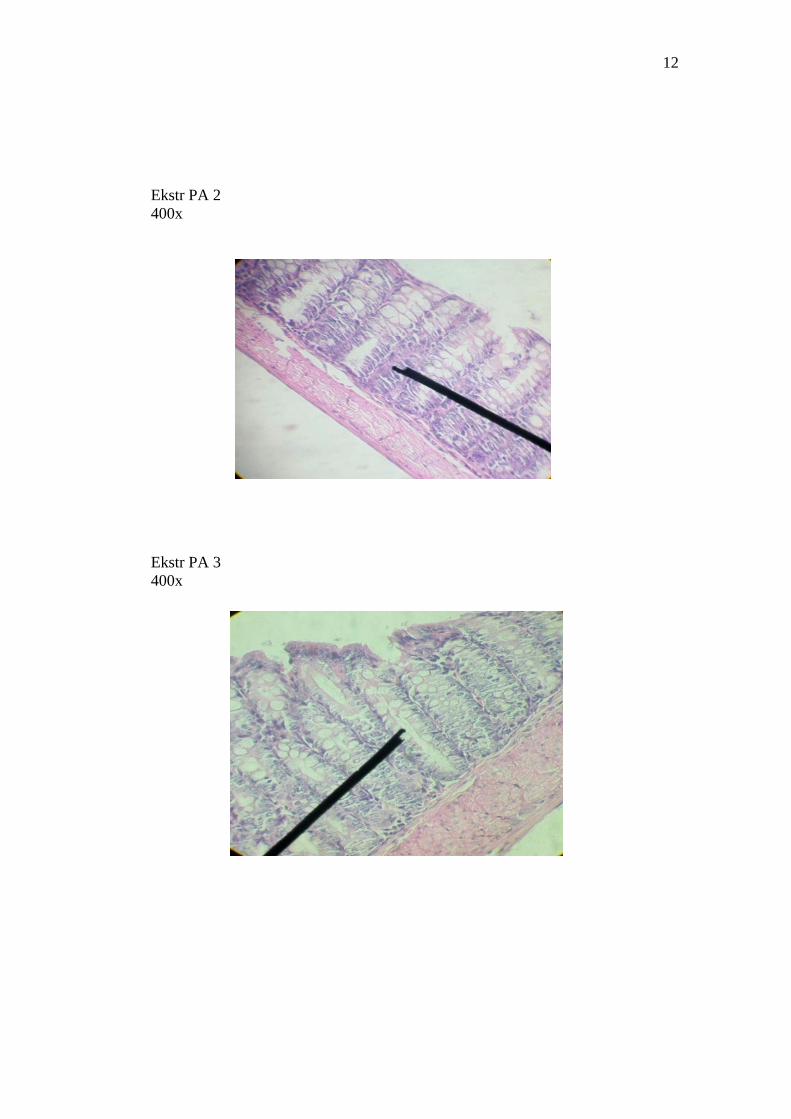
Ekstr PA 2
400x
Ekstr PA 3
400x
13
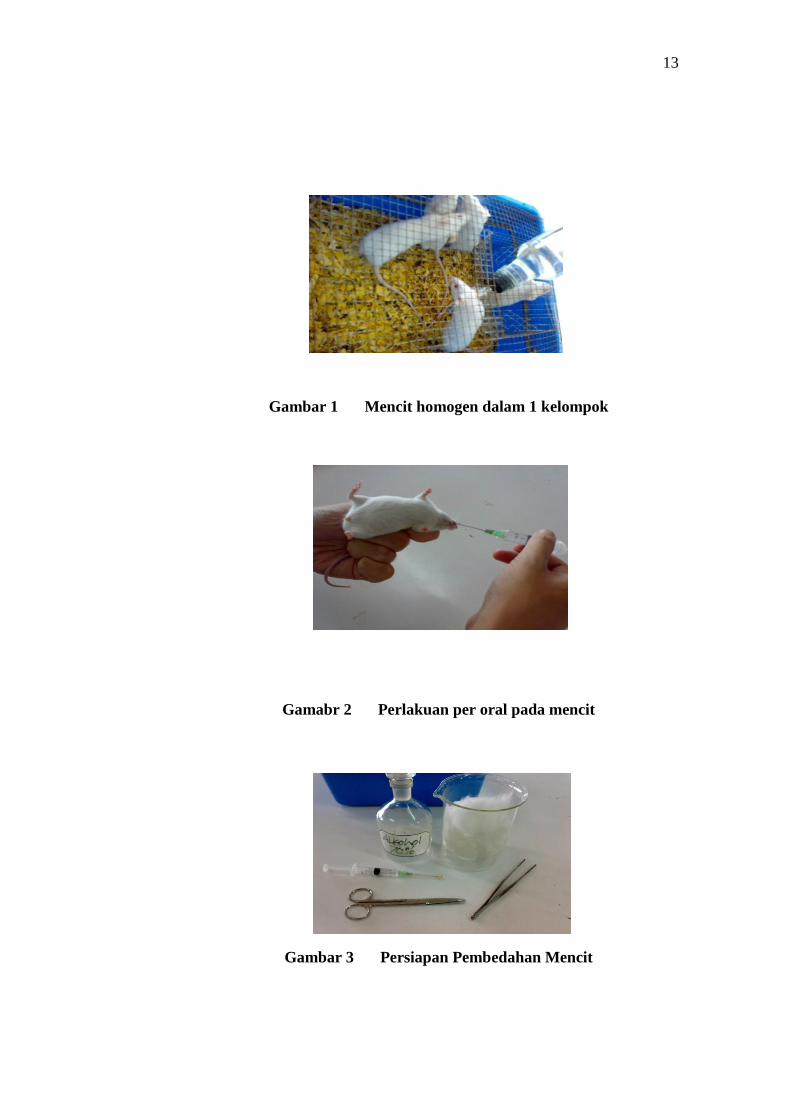
Gambar 1 Mencit homogen dalam 1 kelompok
Gamabr 2 Perlakuan per oral pada mencit
Gambar 3 Persiapan Pembedahan Mencit
14
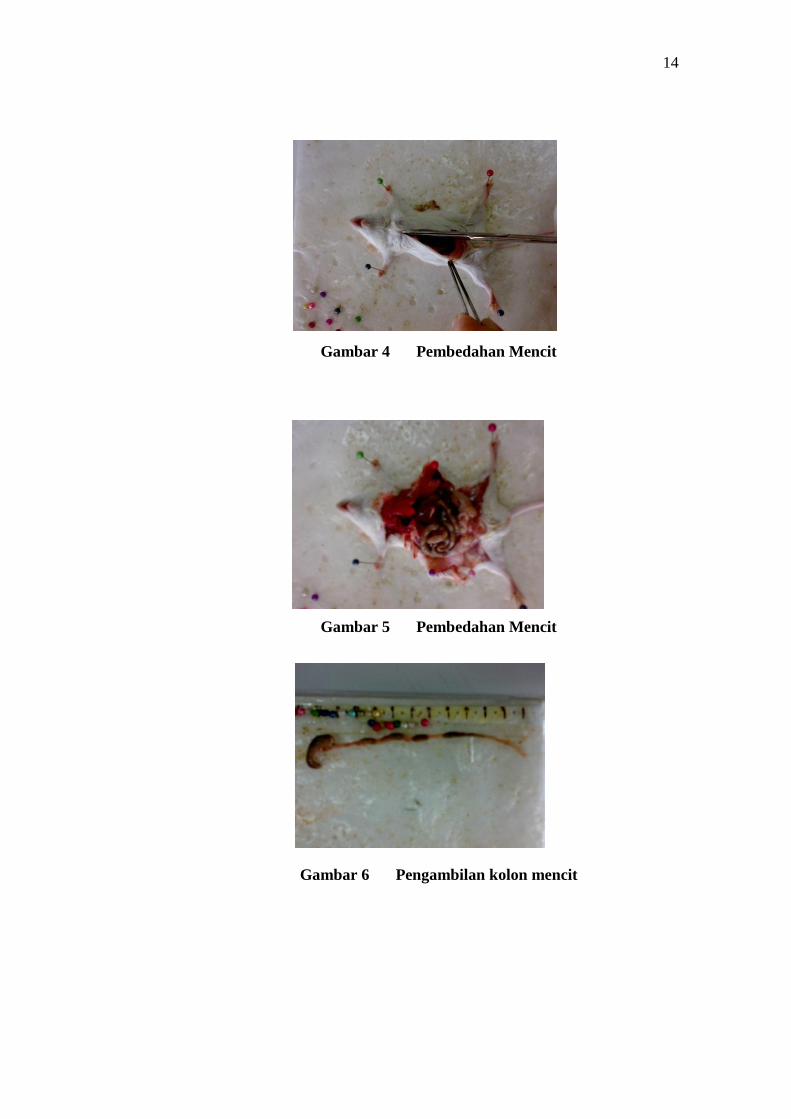
Gambar 4 Pembedahan Mencit
Gambar 5 Pembedahan Mencit
Gambar 6 Pengambilan kolon mencit
15
RIWAYAT HIDUP
Nama : Annisa Noor Arifin Putri
NRP : 0610128
Tempat dan tanggal lahir : Bandung, 10 Mei 1989
Alamat : Jl. Rancagoong Indah 1. No.3 , Bandung
Agama : Islam
Riwayat Pendidikan :
SD Aren Jaya VII, Bekasi, 2000
SMP Negeri 1, Bekasi, 2003
SMA Negeri 11, Bandung, 2006
2006-sekarang, Mahasiswa Fakultas Kedokteran Universitas Kristen
Maranatha Bandung.
62