Austin/Travis County FY2015 CoC Renewal & PSH Bonus SEPTEMBER 28, 2015.
LAKE TRAVIS DROUGHT 2005 - 2015
KATIE BORN CE 394K
DECEMBER 4, 2015

i
Table of Contents Goals ............................................................................................................................................................. 1
Introduction .................................................................................................................................................. 2
Lake Travis ................................................................................................................................................. 2
Texas Drought ........................................................................................................................................... 3
Droughts.................................................................................................................................................... 3
Methods ........................................................................................................................................................ 5
Conclusions ................................................................................................................................................. 10
References .................................................................................................................................................. 12

ii
Tables
Table 1: Lake Travis Historic Lows 5 .............................................................................................................. 3
Table 2: Average Monthly Lake Travis Water Elevation (msl) ...................................................................... 9
Figures
Figure 1: Austin-Lake Travis Lakes Subbasin in Texas ................................................................................... 1
Figure 2: Highland Lakes Chain ..................................................................................................................... 2
Figure 3: Lake Travis Drought in 1951 vs 2013 6 ........................................................................................... 3
Figure 4: Austin-Lake Travis Lakes Subbasin Watersheds and Waterbodies ................................................ 6
Figure 5: Drought Data Management Code .................................................................................................. 7
Figure 6: Drought Severity of Subbasin 17 May 2011................................................................................... 8
Figure 7: Drought Severity Levels Explained 3 ............................................................................................... 8
Figure 8: Drought Severity and Lake Travis Water Elevation from 2005 - 2015 ......................................... 10
Figure 9: Rain Gages in the Austin-Lake Travis Subbasin ............................................................................ 11
Lake Travis Drought 12/4/15
1
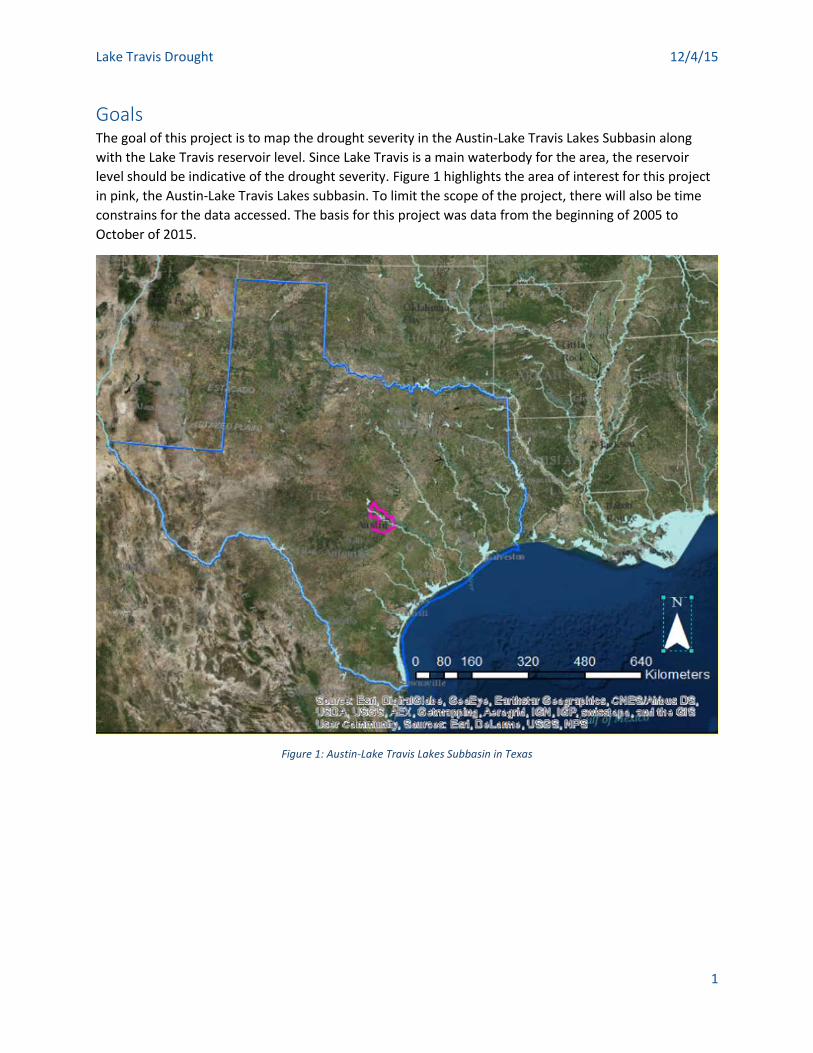
Goals The goal of this project is to map the drought severity in the Austin-Lake Travis Lakes Subbasin along
with the Lake Travis reservoir level. Since Lake Travis is a main waterbody for the area, the reservoir
level should be indicative of the drought severity. Figure 1 highlights the area of interest for this project
in pink, the Austin-Lake Travis Lakes subbasin. To limit the scope of the project, there will also be time
constrains for the data accessed. The basis for this project was data from the beginning of 2005 to
October of 2015.
Figure 1: Austin-Lake Travis Lakes Subbasin in Texas

Lake Travis Drought 12/4/15
2
Introduction
Lake Travis Lake Travis is a manmade reservoir located in central Texas. The Lower Colorado River Authority created
it in 1942 with the completion of Mansfield Dam, originally Marshall Ford Dam. The construction took 6
years to complete.
When the reservoir is full, with a water elevation of 681 msl, it can hold almost 4 billion gallons of water.
The lowest the water level of Lake Travis has fallen is 614.18 msl, which occurred during the drought of
record in the early 1950’s 5.
This reservoir serves as the main water supply for the nearby capital city of Austin and surrounding
areas, as well as the main flood control measure for the Highland Lakes Chain. The Highland Lake Chain
consists of 6 lakes separated by 6 dams, controlled by the Lower Colorado River Authority. Figure 2
shows the study area for drought severity aspect of this project, the Austin-Lake Travis Lakes Subbasin,
outlined in purple. All 6 of the Highland Lakes are noted as well as Lady Bird Lake, and all of their
associated dams. As can be seen in this figure, only Lake Marble Falls, Lake Travis, Lake Austin, and Lady
Bird Lake are within the scope of the project.
Figure 2: Highland Lakes Chain

Lake Travis Drought 12/4/15
3
Texas Drought Texas is known for its unpredictable weather, so of course its waterbodies see plenty of ups and downs;
and Lake Travis is certainly no exception to this. Table 1 gives information on Lake Travis water elevation
during the 7 most severe droughts since the completion of the dam.
Table 1: Lake Travis Historic Lows 5
The drought of record happened in the 1950’s, less than a decade after the reservoir was complete, and
the closest that it has ever come to that level since was just two years ago. In the fall of 2013, Lake
Travis dropped to within 4.5 ft of its record low water elevation. Figure 3 shows the same location along
Lake Travis during the drought of record and at its next lowest level, in 2013.
Figure 3: Lake Travis Drought in 1951 vs 2013 6
Droughts After several weekends of severe flooding for Central Texas in the last 6 months, drought may be an
unusual topic to focus on for this project, but adding up the years of drought in Table 1, about 60% of
my lifetime (since 1992) has been during drought conditions. It is a constant concern and has been
present with irregular frequency since the turn of the century.
The water retained by the reservoir slowly decreases throughout a drought as it is continuously emptied
to supply water to its contractual consumers without a consistent source coming in. This means drinking
water supply as well as irrigation water supply. Many farmers and ranchers rely on water from Lake
Travis. When supply is short, the price goes up. This can be devastating to those dependent on
agricultural means. As the drought drags on, choices have to be made as to who gets any water at all. In

Lake Travis Drought 12/4/15
4
2012, the LCRA began to cut off the water supply for Texas’ rice farms, which gained a lot of media
attention.
On a lake such as Lake Travis, this lowering water level is a concern not only for water supply, but for
electrical generation and recreational attraction as well. The LCRA cannot generate as much power from
a lower water level reservoir as when it is full. Businesses along the lake crumble as their demand
decreases when there are less consumers to buy their goods or services. If visitors can’t get their boats
in the water because none of the boat ramps reach the water, the population on the lake decreases
dramatically.
Along with lowering lake levels the land also dries up during a drought, making is ripe for fires. In
September 2011, a series of wildfires spread across Texas. The most remarkable of which was in Bastrop
County, which scorched 34,000 acres and consumed over 1,000 homes 1. The more recent fires in
Bastrop County this past summer were a fraction of what was seen in 2011.
Droughts do not just dry up the surface water and land, but also subsurface water. Many communities in
the area depend on groundwater wells for their water supply. The water level underground deceases
with droughts just as the surface water does. This first makes it more work for the pumps to draw
enough water up to meet demands. Eventually, the underground area around the well is pumped dry
and the water well will no longer reach deep enough to extract the groundwater. This happened in
Spicewood Beach and its residents became dependent on tanker trucks delivering water to the town’s
storage tank until a surface water treatment plant could supply water from the already constrained Lake
Travis.
For all these reasons, and many more, drought is important to the Lake Travis area.

Lake Travis Drought 12/4/15
5
Methods The first step to mapping anything was establishing a spatial reference. This was accomplished not only
by importing a base map in order to have a feel for the location, but also by specifically outlining Texas
to use as a frame of reference. The Texas shapefile, given as a file download for Exercise 1, was
imported as a layer to the map. Then a series of steps to focus the frame further into the area of interest
for the analysis. Catchment, flowline, stream gage, subwatershed, and waterbody data for the Texas-
Gulf Watershed was downloaded from the NFIE-Geo Regions map of UT Austin’s ArcGIS online maps 2
used in Exercise 2. Only the Subwatershed feature class was imported as a layer in the map initially.
The HUC 8 number for the Austin-Lake Travis Lakes subbasin was obtained from USGS online 7. The
value found for this, 12090205, was used to select all of the HUC 12 subwatersheds within the Austin-
Lake Travis subbasin. This data was extracted as a new feature class within a new Lake Travis
geodatabase, where all related local data was saved to. The Austin-Lake Travis subbasin that makes up
the area of interest for this project has 32 HUC 12 subwatersheds grouped into four HUC 10 watersheds.
These can be seen in Figure 4; the shapes of different shades of green make up the HUC 10 watersheds
and the smaller shaped within are the HUC 8 watersheds. Then the data management ‘dissolve’ tool was
used on the dataset to dissolve all of the HUC 10 and HUC 12 watersheds into one shapefile, shown with
a pink outline in Figure 4. This shapefile could then be used as a boundary outlining the Austin-Lake
Travis subbasin to use as a basis for extracting all further data to this area.
The Austin-Lake Travis Subbasin shape was first used to cut down the Waterbody feature class from the
previously downloaded Texas-Gulf Watershed data to the study subbasin. The visual representation of
the waterbodies on the map is used as a local frame of reference for the area of focus. This is important
for when any other data is represented on the map, the basemap is mostly concealed. These
waterbodies are shown as the top layer in the map of the Austin-Lake Travis Lakes subbasin with its
corresponding watersheds in Figure 4.

Lake Travis Drought 12/4/15
6
Figure 4: Austin-Lake Travis Lakes Subbasin Watersheds and Waterbodies
With the Austin-Lake Travis Subbasin, the drought data could be trimmed down to size from the
national scale in which it is available. The GIS data for drought severity is available from the United
States Drought Monitor’s website from the year 2000 to the present. There are 3 points of data for
every month. Even for just the years within the scope of this project, this amounts to over 1,000 data
sets.
Gonzalo Espinoza wrote a two part code to assist the project, shown in Figure 5. The code first took all
the files from one folder and cut them down to the size of the subbasin shape, then added a field to the
data for the date, taken from the file name. Once this ran for all of the data points, the code compiled all
of these data points over time into one single file, which could then be imported onto an ArcGIS map
and run as a time series layer. In order to run the code, the data for all the years within the scope of the
projected had to be downloaded, then all of the files had to be taken out of their many folders for each
time point of data and moved into a single folder that the code would access.

Lake Travis Drought 12/4/15
7
Figure 5: Drought Data Management Code
The single file of the time series of drought severity data imported into ArcGIS can only show one time
point of the data on the map at any given time. Figure 6 shows a still shot of that time series data for
May 17, 2011, which was during a rather severe drought. The time series data can be visually
represented two ways with the time slider on Arc GIS. The first is to run it as a movie through all the
time points, the second is to manually run through the time points of the data by moving the slider
through time.

Lake Travis Drought 12/4/15
8
Figure 6: Drought Severity of Subbasin 17 May 2011
The drought severity levels shown in the key of Figure 6 are outlined by the United States Drought
Monitor. These drought severity levels are explained in Figure 7.
Figure 7: Drought Severity Levels Explained 3

Lake Travis Drought 12/4/15
9
Initially, mapping the varying water elevation for Lake Travis over the same time frame in order to
visualize the correlation between the lake level and drought severity was a project goal, but after
attempting it and consulting with Dr. Maidment, it was decided to cancel this part of the project. The
data for the average monthly water level in the time period of interest was still considered and analyzed
graphically, but it could not be visually represented with ArcGIS. The monthly averages for the water
elevation of Lake Travis 4 are tabulated in Table 2.
Table 2: Average Monthly Lake Travis Water Elevation (msl)

Lake Travis Drought 12/4/15
10
Conclusions In order to show the relationship between the drought severity level and the water elevation of Lake
Travis, the data for both have been graphed together with independent axes. To eliminate confusion of
too many lines or too many separate graphs for readers to absorb, this graph represented the entire
time spread from 2005 to 2015. Additionally, a straight line shows the elevation of the lake when it is
considered full to better represent the lack of water when it is not full. This is shown in Figure 8.
Figure 8: Drought Severity and Lake Travis Water Elevation from 2005 - 2015
As seen in Figure 8, there is a great correlation between drops in the water elevation of Lake Travis and
the drought severity level for the area as predicted there would be. The only time that has questionable
results is around 2012 – 2014. In this time frame the drought severity level is not very high at all despite
a prolonged time of a dramatically low water elevation for Lake Travis. This seems unusual and I can
only guess as to why it is so. I would expect that there was small intermittent rain storms throughout
that time period. Enough water to moisten the earth, but not enough for a significant amount of water
to reach the lakes and rivers. The plants and soil were so dry that these would absorb the majority of the
rain fall, leaving little to no excess.
Investigating this time frame would be an interesting extension to this project. The USGS precipitation
gages are already cut down to the size of the subbasin and mapped on ArcGIS, shown in Figure 9 with
purple triangles.

Lake Travis Drought 12/4/15
11
Figure 9: Rain Gages in the Austin-Lake Travis Subbasin
With historical data for this time period it would be easy to find the amount of rain for whole subbasin
over time. Comparing the total monthly precipitation to the water elevation of the lake would give an
idea of their relationship. If this did not give a better idea of why the drought was not more severe, then
the analysis could go two ways. One would be to break down the precipitation data to a smaller time
scale in order to see if it has to do with the amount of water precipitated over what time frame. The
other would be to investigate the impact of soil moisture before a storm on the amount of water from
the storm turned into runoff.
While I can now say that the drought severity level is related to the water elevation of Lake Travis, it is
clearly not the sole factor. Further research into what dictates the Lake Travis water levels would be
interesting.

Lake Travis Drought 12/4/15
12
References 1 "Everything You Need to Know About the Texas Drought." State Impact. Web. 26 Nov. 2015.
<https://stateimpact.npr.org/texas/tag/drought/>.
2 Fagan, Cassandra. "NFIE_Geo Regions." UT Austin ArcGIS Maps. 9 Sept. 2015. Web. 23 Oct. 2015.
3 "GIS Data Archive." United States Drought Monitor. 2015. Web. 26 Nov. 2015.
<http://droughtmonitor.unl.edu/MapsAndData/GISData.aspx>.
4 "Historical Lake Levels." LCRA. 1 Oct. 2015. Web. 26 Nov. 2015. <http://www.lcra.org/water/river-and-
weather/pages/historical-lake-levels.aspx>.
5 "Mansfield Dam and Lake Travis." LCRA. Web. 24 Nov. 2015. <http://www.lcra.org/water/dams-and-
lakes/pages/mansfield-dam.aspx>.
6 Mashhood, Farzad. "Current Drought Pales in Comparison with 1950s 'drought of Record." Statesman.
Web. 24 Nov. 2015. <http://www.statesman.com/news/news/local/current-drought-pales-in-
comparison-with-1950s-d-1/nRdC5/>.
7 "USGS Water Resources Links For: 12090205 - Austin-Travis Lakes." USGS Science For a Changing
World. U.S. Geological Survey, 22 May 2015. Web. 23 Oct. 2015.