Overview Rainy-Lake of the Woods State of the Basin Report ...

1
Lake of the Woods Improvement Study and Management Plan
Marshall County, Indiana
Provided for: Lake of the Woods Property Owners Association (LOWPOA) Board
Prepared by: Restorative Lake Sciences Jennifer L. Jermalowicz-Jones, PhD
Water Resources Director 18406 West Spring Lake Road Spring Lake, Michigan 49456
www.restorativelakesciences.com
©Restorative Lake Sciences, 2019

2
TABLE OF CONTENTS
SECTION PAGE
LIST OF FIGURES ........................................................................................................................................... 3 LIST OF TABLES ............................................................................................................................................. 6 1.0 EXECUTIVE SUMMARY .................................................................................................................... 8 2.0 LAKE ECOLOGY BACKGROUND INFORMATION ............................................................................ 10
2.1 Introductory Concepts ....................................................................................................... 10 2.1.1 Lake Hydrology ........................................................................................................ 10 2.1.2 Biodiversity and Habitat Health .............................................................................. 11 2.1.3 Watersheds and Land Use....................................................................................... 11 3.0 LAKE OF THE WOODS PHYSICAL & WATERSHED CHARACTERISTICS ........................................... 12 3.1 The Lake of the Woods Basin ............................................................................................. 12 3.2 Lake of the Woods Extended and Immediate Watershed and Land Use ......................... 17 3.3 Lake of the Woods Shoreline Soils ..................................................................................... 20 4.0 LAKE OF THE WOODS WATER QUALITY ........................................................................................ 23 4.1 Water Quality Parameters ................................................................................................. 25 4.1.1 Dissolved Oxygen .................................................................................................... 27 4.1.2 Water Temperature ................................................................................................ 27 4.1.3 Conductivity and Oxidative Reduction Potential .................................................... 28 4.1.4 Turbidity, Total Dissolved Solids, and Total Suspended Solids ............................... 29 4.1.5 pH ............................................................................................................................. 30 4.1.6 Total Alkalinity ......................................................................................................... 30 4.1.7 Total Phosphorus and Ortho-Phosphorus .............................................................. 30 4.1.8 Total Kjeldahl Nitrogen and Total Inorganic Nitrogen ............................................ 31 4.1.9 Chlorophyll-a and Algae .......................................................................................... 32 4.1.10 Secchi Transparency .............................................................................................. 32 4.2 Lake of the Woods Aquatic Vegetation Communities ...................................................... 37 4.2.1 Lake of the Woods Exotic Aquatic Macrophytes .................................................... 41 4.2.2 Lake of the Woods Native Aquatic Macrophytes ................................................... 45 4.3 Lake of the Woods Zooplankton and Macroinvertebrates ............................................... 52 4.4 Lake of the Woods Fishery ................................................................................................. 58

3
5.0 LAKE OF THE WOODS MANAGEMENT IMPROVEMENT METHODS ............................................. 59 5.1 Lake of the Woods Aquatic Plant Management ................................................................ 59 5.1.1 Aquatic Invasive Species Prevention ....................................................................... 59 5.1.2 Aquatic Herbicides and Applications ...................................................................... 65 5.1.3 Mechanical Harvesting ............................................................................................ 68 5.1.4 Benthic Barriers and Nearshore Management Methods ....................................... 68 5.1.5 Diver Assisted Suction Harvesting ........................................................................... 69 5.2 Lake of the Woods Water Quality Improvement .............................................................. 70 5.2.1 Laminar Flow Aeration and Bioaugmentation ........................................................ 70 5.2.2 Benthic Aluminum Applications .............................................................................. 73 5.2.3 Dredging .................................................................................................................. 73 5.2.4 Fishery Habitat Enhancement ................................................................................. 74 5.3 Lake of the Woods Watershed Management ................................................................... 77 5.3.1 Lake of the Woods Erosion and Sediment Control ................................................. 77 5.3.2 Lake of the Woods Nutrient Source Control ........................................................... 78 6.0 LAKE OF THE WOODS PROJECT CONCLUSIONS AND RECOMMENDATIONS ............................... 88 6.1 Cost Estimates for Lake of the Woods Improvements ...................................................... 90 7.0 SCIENTIFIC REFERENCES ................................................................................................................ 92

4
LIST OF FIGURES
FIGURE PAGE
1. Aerial Photo of Lake of the Woods (RLS, 2018) ....................................................................... 14 2. Lake of the Woods Depth Contour Map (RLS, 2018) .............................................................. 15 3. Lake of the Woods Sediment Hardness Map (RLS, 2018) ....................................................... 16 4. Lake of the Woods Immediate Watershed Map (RLS, 2018) .................................................. 18 5. Lake of the Woods Wetlands Land Use (2018) ....................................................................... 19 6. Lake of the Woods Beachfront Lake Use (2018) ..................................................................... 19 7. Lake of the Woods Community Venue Land Use (2018)......................................................... 20 8. Lake of the Woods Soils Map (USDA-NRCS data) .................................................................... 22 9. The Lake Eutrophication Process ............................................................................................ 24 10. Lake of the Woods Deep Basin Water Quality Sampling Location Map (2018) ...................... 26 11. Lake Thermal Stratification Process Diagram .......................................................................... 28
12. Secchi Disk Measurement ....................................................................................................... 33
13. Lake of the Woods Abundant Lily pads (RLS, 2018) ................................................................ 37 14. Lake of the Woods Aquatic Vegetation Biovolume Map (July 31, 2018) ................................ 39 15. Lake of the Woods AVAS Map (August 8, 2018) ..................................................................... 40
16. Photo of Chara ......................................................................................................................... 43 17. Photo of Thin-leaf Pondweed .................................................................................................. 43
18. Photo of Flat-stem Pondweed ................................................................................................. 43 19. Photo of Floating-leaf Pondweed ............................................................................................ 43 20. Photo of Water Stargrass ........................................................................................................ 43

5
21. Photo of Coontail ..................................................................................................................... 43 22. Photo of Bladderwort .............................................................................................................. 44 23. Photo of Southern Naiad ......................................................................................................... 44 24. Photo of White Waterlily ......................................................................................................... 44 25. Photo of Yellow Waterlily ........................................................................................................ 44 26. Photo of Watermeal ................................................................................................................ 44 27. Photo of Duckweed ................................................................................................................. 44 28. Photo of Cattails ...................................................................................................................... 45 29. Photo of Bulrushes .................................................................................................................. 45 30. Photo of Arrowhead ................................................................................................................ 45 31. Photo of Hybrid Eurasian Watermilfoil ................................................................................... 46 32. Photo of Hybrid Eurasian Watermilfoil Canopy ...................................................................... 46 33. Map of Hybrid Eurasian Watermilfoil Locations in Lake of the Woods (2018) ....................... 47 34. Photo of a Curly-leaf Pondweed .............................................................................................. 48 35. Photo of a Starry Stonewort .................................................................................................... 49 36. Photo of Purple Loosestrife ..................................................................................................... 50 37. Map of Purple Loosestrife Locations around Lake of the Woods (2018) ................................ 51 38. Photo of a Zooplankton Tow Net ............................................................................................ 53 39. Photo of a Daphnia Zooplankton ............................................................................................ 54 40. Photo of a Copepod Zooplankton ........................................................................................... 54 41. Lake of the Woods Sediment Macroinvertebrate Sampling Location Map (2018) ................ 56 42. Photo of an Ekman Hand Dredge ............................................................................................ 57 43. Photo of an AIS Sign for Public Access Sites ............................................................................ 61

6
44. Photo of an AIS Sign for Public Access Sites ............................................................................ 61
45. Photo of a Boat Washing Station ............................................................................................ 62
46. Photo of Zebra Mussels ........................................................................................................... 63
47. Photo of Invasive Hydrilla ........................................................................................................ 64
48. Photo of Invasive Water Chestnut .......................................................................................... 65
49. Photo of an Aquatic Herbicide Application Boat ..................................................................... 66
50. Photo of a Mechanical Harvester ............................................................................................ 68
51. A Benthic Barrier ..................................................................................................................... 69
52. Photo of a Weed Roller ........................................................................................................... 69
53. Photo of a DASH Boat .............................................................................................................. 70
54. Diagram of LFA ........................................................................................................................ 72
55. Photo of a Mechanical Dredge ................................................................................................ 74
56. Areas of Inflow to Lake of the Woods (RLS, 2018) .................................................................. 81
57. Photo of The Private Drain ...................................................................................................... 82
58. Photo of The Stephey Drain .................................................................................................... 82
59. Photo of The Martin Drain ...................................................................................................... 83
60. Photo of The Seltenright Drain ................................................................................................ 83
61. Photo of The Bohmer Drain ..................................................................................................... 84
62. Photo of The Kuntz Drain ........................................................................................................ 84
63. Photo of the Lake of the Woods Outlet .................................................................................. 85
64. Photo of Excess Algae in a Lake of the Woods Canal (2018) ................................................... 87
65. Photo of Excess Algae and Sediment in a Lake of the Woods Canal (2018) ........................... 87

7
LIST OF TABLES
TABLE PAGE
1. Lake of the Woods Sediment Hardness Data (July 31, 2018) ................................................. 13 2. Lake of the Woods Soils........................................................................................................... 21 3. Lake Trophic Status Classification ........................................................................................... 24 4. Lake of the Woods Deep Basin #1 Physical Water Quality Data (September 22, 2018) ......... 34 5. Lake of the Woods Deep Basin #1 Chemical Water Quality Data (September 22, 2018) ....... 34 6. Lake of the Woods Deep Basin #2 Physical Water Quality Data (September 22, 2018) ......... 35 7. Lake of the Woods Deep Basin #2 Chemical Water Quality Data (September 22, 2018) ....... 35 8. Lake of the Woods Deep Basin #3 Physical Water Quality Data (September 22, 2018) ......... 36 9. Lake of the Woods Deep Basin #3 Chemical Water Quality Data (September 22, 2018) ....... 36 10. Lake of the Woods Native Aquatic Plants (August 8, 2018) .................................................... 42 11. Lake of the Woods Invasive Aquatic Plants (August 8, 2018) ................................................. 52 12. Lake of the Woods Zooplankton (September 22, 2018) ......................................................... 53 13. Lake of the Woods Benthic Macroinvertebrates (September 22, 2018) ................................ 58 14. Lake of the Woods Aquatic Herbicide Treatment History (2005-2018) .................................. 67
15. Lake of the Woods Physical Water Quality Data of Drains (September 22, 2018) ................. 85 16. Lake of the Woods Chemical Water Quality Data of Drains (September 22, 2018) ............... 86 17. Lake of the Woods Proposed Lake Improvement Methods and Objectives ........................... 89 18. Lake of the Woods Proposed Improvement Costs (Annual) ................................................... 90

8
Lake of the Woods Improvement Study and Management Plan
Marshall County, Indiana
February 2019
1.0 EXECUTIVE SUMMARY
Lake of the Woods is located in Sections 1 and 2 of North Township and Sections 6 and 7 of German Township in Marshall County, Indiana (T.34N, R.2-3E). The lake is comprised of 419 acres which includes the area of the canals (RLS, 2018). The lake is of glacial origin with a dam located at the south region and has 12 areas of water influx which includes 6 major tributaries or drains. The lake is sewered (since 1991) and has nearly 2.43 miles of 80% developed (low residential) shoreline. The average mean depth of the lake is approximately 12.8 feet and the maximum depth is approximately 45.0 feet (RLS, 2018 bathymetric scan data). The lake also has a fetch (longest distance across the lake) of around 1.5 miles (RLS, 2018). Lake of the Woods has an approximate water volume of 5,993 acre-feet (RLS, 2018 bathymetric data). The immediate watershed which is the area directly draining into the lake is approximately 7,043 acres which is about 16.8 times the size of the lake, which is large. An annual lake drawdown is conducted on the lake of one foot with the normal lake level around 803.85’. Lake of the Woods is on the EPA 303d list of impaired water bodies for PCB’s. Based on the current study, Lake of the Woods contains 18.3 acres of the exotic submersed hybridized Eurasian Watermilfoil (Myriophyllum sibiricum var. spicatum). Other exotics such as the submersed aquatic plants Curly-leaf Pondweed and a single fragment of Starry Stonewort were also found. In addition, the invasive emergent Purple Loosestrife was found in 5 locations around the lake shoreline. All invasives must be managed as they may impede navigation and recreational activities, reduce lakefront property values, and also reduce the biodiversity of favorable native aquatic vegetation throughout the lake. There are a total of 8 submersed, 4 floating-leaved, and 3 emergent native aquatic plant species in Lake of the Woods that were present during the lake survey on August 8, 2018. Hybrid watermilfoil is best treated in early spring with systemic granular herbicides such as triclopyr or 2,4-D whereas Curly-leaf Pondweed is best treated with a contact herbicide such as diquat or hydrothol. Purple Loosestrife can either be hand-pulled or treated with topical triclopyr formulations.
The overall water quality of Lake of the Woods was measured as fair with high nutrients such as phosphorus (TP) and nitrogen (TKN) and low water clarity. The pH and alkalinity of the lake

9
indicate that it is a neutral and slightly hardwater lake that is well-buffered to acidic atmospheric inputs. The mean TP concentration in the lake deep basins was 0.139 mg/L which is over 5 times the eutrophic threshold. Additionally, the bioavailable TP (SRP) mean concentration was 0.108 mg/L which means that most of the TP is usable by all aquatic biota including the algae. The mean TKN concentration in the lake deep basins was 3.0 mg/L which is also high. The lake N:P ratio is ≥ 19 which means that the lake is P-limited. Total suspended solids (TSS) in the lake were below lab detection which is favorable. The mean conductivity of the lake was 466 mS/cm which is moderately high and indicative of a large watershed. Dissolved oxygen depletion is prevalent in all three deep basins when the lake is thermally stratified. There are six major drains that flow into the lake including: 1)The Private Drain, 2) The Stephey Drain, 3) The Martin Drain, 4) The Seltenright Drain, 5) The Bohmer Drain, and 6) The Kuntz Drain. The mean TP in the drains was 0.611 mg/L and the mean SRP was 0.101 mg/L. These concentrations are high and a constant source to the lake. The mean TKN in the drains was 4.9 mg/L which is quite high and also a constant source of nitrogen to the lake. The only drains with elevated TSS were the Private and Martin drains with 990 mg/L and 270 mg/L, respectively. The drains were higher in mean dissolved oxygen (8.5 mg/L) but also had much higher conductivity than the lake with a mean of 660 mS/cm. Lake of the Woods has multiple land uses such as wetlands, beaches, community venues, and is a prized walleye fishery. Lake improvement strategies to reduce internal loading of P in the lake, increase dissolved oxygen with depth, reduce cyanobacteria blooms, and improve water clarity and quality are urgently needed. RLS therefore recommends that the lake consider a whole-lake laminar flow aeration system with added bioaugmentation (beneficial bacteria and enzymes). Additionally, reduction of nutrients and solids from the drains is needed. This can be accomplished with specialized bio-charcoal filters placed across the drains (specifically the most impaired drains which include the Private Drain, Martin Drain, Stephey Drain, and Seltenright Drain. The drain and lake basin improvements should significantly improve water quality and will further benefit the lake fishery. In addition, it is recommended that the Lake of the Woods community implement Best Management Practices (BMP’s) discussed in the report to reduce the nutrient and sediment loads being transported into the lake from areas with mucky and/or ponded soils that are prone to ponding during heavy rainfall events. Lastly, it would be beneficial to include the riparian community in the improvement program which could be initiated by holding a community-wide lake education and improvement workshop to introduce residents to the key lake impairments and garner support for continued lake protection. This is an event that could be conducted by RLS in the near future.

10
2.0 LAKE ECOLOGY BACKGROUND INFORMATION
2.1 Introductory Concepts
Limnology is a multi-disciplinary field which involves the study of the biological, chemical, and physical properties of freshwater ecosystems. A basic knowledge of these processes is necessary to understand the complexities involved and how management techniques are applicable to current lake issues. The following terms will provide the reader with a more thorough understanding of the forthcoming lake management recommendations for Lake of the Woods. 2.1.1 Lake Hydrology Aquatic ecosystems include rivers, streams, ponds, lakes, and the Laurentian Great Lakes. There are thousands of lakes in the state of Indiana and each possesses unique ecological functions and socio-economic contributions. In general, lakes are divided into four categories:
• Seepage Lakes,
• Drainage Lakes,
• Spring-Fed Lakes, and
• Drained Lakes.
Some lakes (seepage lakes) contain closed basins and lack inlets and outlets, relying solely on precipitation or groundwater for a water source. Seepage lakes generally have small watersheds with long hydraulic retention times which render them sensitive to pollutants. Drainage lakes receive significant water quantities from tributaries and rivers. Drainage lakes contain at least one inlet and an outlet and generally are confined within larger watersheds with shorter hydraulic retention times. As a result, they are less susceptible to pollution. Spring-fed lakes rarely contain an inlet but always have an outlet with considerable flow. The majority of water in this lake type originates from groundwater and is associated with a short hydraulic retention time. Drained lakes are similar to seepage lakes, yet rarely contain an inlet and have a low-flow outlet. The groundwater and seepage from surrounding wetlands supply the majority of water to this lake type and the hydraulic retention times are rather high, making these lakes relatively more vulnerable to pollutants. The water quality of a lake may thus be influenced by the quality of both groundwater and precipitation, along with other internal and external physical, chemical, and biological processes. Lake of the Woods may be categorized as a drainage lake since it has numerous drainage areas as well as an outlet at the south shore of the lake which enters the Yellow River that eventually drains to the Kankakee River which enters the Illinois River and then empties out to the Mississippi River which then exits at the Gulf of Mexico.

11
2.1.2 Biodiversity and Habitat Health
A healthy aquatic ecosystem possesses a variety and abundance of niches (environmental habitats) available for all of its inhabitants. The distribution and abundance of preferable habitat depends on limiting man’s influence from man and development, while preserving sensitive or rare habitats. As a result of this, undisturbed or protected areas generally contain a greater number of biological species and are considered more diverse. A highly diverse aquatic ecosystem is preferred over one with less diversity because it allows a particular ecosystem to possess a greater number of functions and contribute to both the intrinsic and socio-economic values of the lake. Healthy lakes have a greater biodiversity of aquatic macroinvertebrates, aquatic macrophytes (plants), fishes, phytoplankton, and may possess a plentiful yet beneficial benthic microbial community (Wetzel, 2001).
2.1.3 Watersheds and Land Use
A watershed is defined as an area of land that drains to a common point and is influenced by both surface water and groundwater resources that are often impacted by land use activities. In general, larger watersheds possess more opportunities for pollutants to enter the eco-system, altering the water quality and ecological communities. In addition, watersheds that contain abundant development and industrial sites are more vulnerable to water quality degradation since from pollution which may negatively affect both surface and ground water. Since many inland lakes in Indiana are relatively small in size (i.e. less than 300 acres), they are inherently vulnerable to nutrient and pollutant inputs, due to the reduced water volumes and small surface areas. As a result, the living (biotic) components of the smaller lakes (i.e. fishery, aquatic plants, macro-invertebrates, benthic organisms, etc.) are highly sensitive to changes in water quality from watershed influences. Land use activities have a dramatic impact on the quality of surface waters and groundwater. In addition, the topography of the land surrounding a lake may make it vulnerable to nutrient inputs and consequential loading over time. Topography and the morphometry of a lake dictate the ultimate fate and transport of pollutants and nutrients entering the lake. Surface runoff from the steep slopes surrounding a lake will enter a lake more readily than runoff from land surfaces at or near the same grade as the lake. In addition, lakes with steep drop-offs may act as collection basins for the substances that are transported to the lake from the land. Land use activities, such as residential land use, industrial land use, agricultural land use, water supply land use, wastewater treatment land use, and storm water management, can influence the watershed of a particular lake. All land uses contribute to the water quality of the lake through the influx of pollutants from non-point sources or from point sources. Non-point sources are often diffuse and arise when climatic events carry pollutants from the land into the lake. Point-source pollutants are discharged from a pipe or input device and empty directly into a lake or watercourse.
12
Residential land use activities involve the use of lawn fertilizers on lakefront lawns, the utilization of septic tank systems for treatment of residential sewage, the construction of impervious (impermeable, hard-surfaced) surfaces on lands within the watershed, the burning of leaves near the lakeshore, the dumping of leaves or other pollutants into storm drains, and removal of vegetation from the land and near the water. In addition to residential land use activities, agricultural practices by vegetable crop and cattle farmers may contribute nutrient loads to lakes and streams. Industrial land use activities may include possible contamination of groundwater through discharges of chemical pollutants.
3.0 LAKE OF THE WOODS PHYSICAL AND WATERSHED CHARACTERISTICS
3.1 The Lake of the Woods Basin
Lake of the Woods is located in Sections 1 and 2 of North Township and Sections 6 and 7 of German Township in Marshall County, Indiana (T.34N, R.2-3E; Figure 1). The lake is comprised of 419 acres which includes the area of the canals (RLS, 2018). The lake is of glacial origin with a dam located at the south region and has 12 areas of water influx which includes 6 major tributaries or drains. The lake is sewered (since 1991) and has nearly 2.43 miles of 80% developed (low residential) shoreline. The average mean depth of the lake is approximately 12.8 feet and the maximum depth is approximately 45.0 feet (RLS, 2018 bathymetric scan data; Figure 2). The lake also has a fetch (longest distance across the lake) of around 1.5 miles (RLS, 2018). Lake of the Woods has an approximate water volume of 5,993 acre-feet (RLS, 2018 bathymetric data). The immediate watershed which is the area directly draining into the lake is approximately 7,043 acres which is about 16.8 times the size of the lake, which is large. An annual lake drawdown is conducted on the lake of one foot with the normal lake level around 803.85’. Lake of the Woods is on the EPA 303d list of impaired water bodies for PCB’s. A bottom sediment hardness scan was conducted of the entire lake bottom on July 31, 2018. The bottom hardness map shows (Figure 3) that most of the lake bottom consists of fairly consolidated sediment throughout the lake with only a few small areas with soft organic bottom. This is not surprising given the amount of sandy loams in the region which contribute to lake geology. Table 1 below shows the categories of relative bottom hardness with 0.0-0.1 referring to the softest least consolidated bottom and >0.4 referring to the hardest, most consolidated bottom. This scale does not mean that any of the lake contains a truly “hard” bottom but rather a bottom that is more coherent and not flocculent.

13
Table 1. Lake of the Woods relative hardness of the lake bottom by category or hardness and percent over of each category (relative cover).
Lake Bottom Relative Hardness Category
# GPS Points in Each Category (Total = 12,372)
% Relative Cover of Bottom by Category
0.0-0.1 18 0.15
0.1-0.2 51 0.41
0.2-0.3 1773 14.33
0.3-0.4 7172 57.97
>0.4 3718 30.05

14
Figure 1. Lake of the Woods, Marshall County, Indiana.

15
Figure 2. Lake of the Woods Depth Contour Map, Marshall County, Indiana.

16
Figure 3. Lake of the Woods Sediment Hardness Map, Marshall County, Indiana.

17
3.2 Lake of the Woods Extended and Immediate Watershed and Land Use Summary
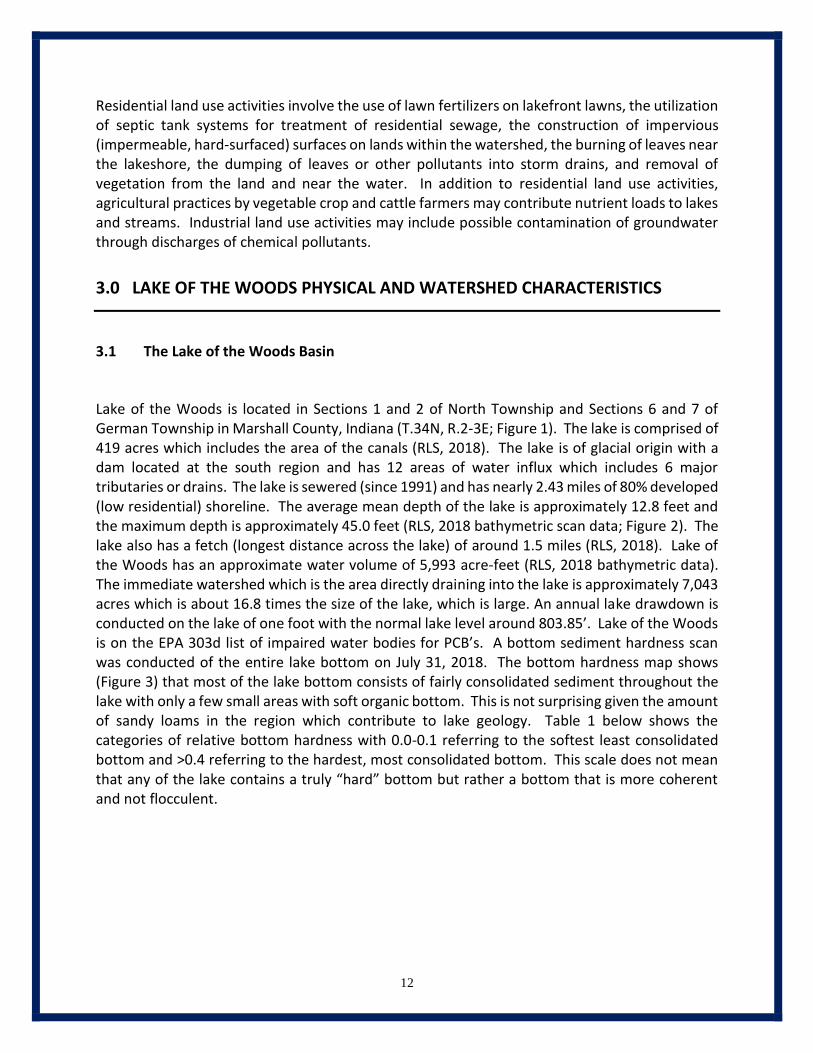
A watershed is defined as a region surrounding a lake that contributes water and nutrients to a waterbody through drainage sources. Watershed size differs greatly among lakes and also significantly impacts lake water quality. Large watersheds with much development, numerous impervious or paved surfaces, abundant storm water drain inputs, and surrounding agricultural lands, have the potential to contribute significant nutrient and pollution loads to aquatic ecosystems. Lake of the Woods is located within the Kankakee River extended watershed (HUC 07120001) which drains a total of 5,165 mi2 in Indiana, Illinois, and southern Michigan. The watershed is characterized predominately by agricultural land use (74.4%), followed by pasture (10.9%), water (7.9%), forest (4.6%), and residential and commercially developed areas (4.9%). This information is valuable on a regional scale; however, it is at the immediate watershed scale that significant improvements can be made by the local Lake of the Woods community. The immediate watershed of Lake of the Woods consists of the area around the lake that directly drains to the lake and measures approximately 7,043 acres (11.0 mi2) in size (Figure 4; RLS, 2018). The immediate watershed is about 16.8 times the size of the lake, which is considered a very large watershed. The lake shoreline is around 805 developed with low density residential land use. The lakefront itself has a diverse application of land uses such as wetlands (Figure 5), beachfront for swimming (Figure 6), and community venues (Figure 7). Thus, management options should also take into account all of these land uses and preserve their unique functions. There are many areas around the lake with poorly drain soils that are prone to ponding during heavy rainfall events (50%). Fortunately, most of the areas around the lake are of low slope and are not prone to erosion. Additionally, most of the wet areas have been drained for agricultural land use. Wetlands are present at the northwest region of the lake and scattered around the upper portion of the watershed. Wetlands can act as a source and sink for nutrients and thus should be preserved. Best Management Practices (BMP’s) for water quality protection are offered in the watershed improvement section of this report.

18
Figure 4. Immediate Watershed draining into Lake of the Woods, Marshall County, Indiana (Restorative Lake Sciences, 2019).
19
Figure 5. Wetlands around Lake of the Woods (©RLS, 2018).
Figure 6. Beachfront land use on Lake of the Woods (©RLS, 2018).

20
Figure 7. Community venue land use on Lake of the Woods (©RLS, 2018).
3.3 Lake of the Woods Shoreline Soils
There are 6 major soil types immediately surrounding Lake of the Woods which may impact the water quality of the lake and may dictate the particular land use activities within the area. Figure 8 (created with data from the United States Department of Agriculture and Natural Resources Conservation Service, 1999) demonstrates the precise soil types and locations around Lake of the Woods. Major characteristics of the dominant soil types directly surrounding the Lake of the Woods shoreline are discussed below. The locations of each soil type are listed in Table 2 below.

21
Table 2. Lake of the Woods Shoreline Soil Types (USDA-NRCS data).
USDA-NRCS
Soil Series
Lake of the Woods Soil Type
Location
Rensselaer loam (0-1% slopes) N, E, S, SW shores
Brady sandy loam (0-1% slopes) W shore
Bronson sandy loam (0-1% slopes)
Houghton Muck
Pinhook sandy loam (0-2% slopes)
Wunabuna silt loam (0-1% slopes)
W shore
NW shore
N shore
N shore

22
Figure 8. NRCS-USDA soils map for Lake of the Woods shoreline soils.

23
The majority of the soils around Lake of the Woods are deep and poorly drained solids such as Rensselaer loams present along most of the lake shoreline and the very deep, somewhat poorly drained Brady sandy loams present along the west shore. Both soils have rapid permeability. Also common were the Bronson sandy loams located along the west shore which are very deep, moderately well drained solids with low runoff potential and moderately rapid permeability. The Pinhook sandy loams were also present at the north shore with deep, poorly drained soils that have slow runoff potential are present on terraces. The majority of the soils around Lake of the Woods are present on low slopes, which reduced the probability of erosion. The only saturated soils present were the Houghton mucks found near the northwest shore that are very deep, poorly drained soils with the potential for ponding. Ponding occurs when water cannot permeate the soil and accumulates on the ground surface which then many runoff into nearby waterways such as the lake and carry nutrients and sediments into the water. Excessive ponding of such soils may lead to flooding of some low-lying shoreline areas, resulting in nutrients entering the lake via surface runoff since these soils do not promote adequate drainage or filtration of nutrients. The mucks located in the wetlands may become ponded during extended rainfall and the wetlands can serve as a source of nutrients to the lake. When the solids of the wetland are not saturate, the wetland can serve as a sink for nutrients and the nutrients are filtered by wetland plants.
4.0 LAKE OF THE WOODS WATER QUALITY
Water quality is highly variable among Indiana’s inland lakes, although some characteristics are common among particular lake classification types. The water quality of each lake is affected by both land use practices and climatic events. Climatic factors (i.e. spring runoff, heavy rainfall) may alter water quality in the short term; whereas, anthropogenic (man-induced) factors (i.e. shoreline development, lawn fertilizer use) alter water quality over longer time periods. Since many lakes have a fairly long hydraulic residence time, the water may remain in the lake for years and is therefore sensitive to nutrient loading and pollutants. Furthermore, lake water quality helps to determine the classification of particular lakes (Table 3). Lakes that are high in nutrients (such as phosphorus and nitrogen) and chlorophyll-a, and low in transparency are classified as eutrophic; whereas those that are low in nutrients and chlorophyll-a, and high in transparency are classified as oligotrophic. Lakes that fall in between these two categories are classified as mesotrophic. Lake of the Woods is classified as a hyper-eutrophic (very nutrient-enriched) lake due to the excessive algae growth and low Secchi transparency and marked dissolved oxygen depletion with depth, as well as having internal nutrient loading of phosphorus and elevated nitrogen concentrations (Figure 9).

24
Table 3. General Lake Trophic Status Classification Table.
Lake Trophic Status Total Phosphorus
(mg L-1)
Chlorophyll-a
(µg L-1)
Secchi Transparency
(feet)
Oligotrophic < 0.010 < 2.2 > 15.0
Mesotrophic 0.010-0.025 2.2 – 6.0 7.5 – 15.0
Eutrophic > 0.025 > 6.0 < 7.5
Figure 9. Diagram showing a eutrophic or nutrient-enriched lake ecosystem (photo adapted from Brooks/Cole Thomson learning online).

25
4.1 Water Quality Parameters
Parameters such as dissolved oxygen (in mg L-1), water temperature (in °C), oxidative reduction potential (mmhos/cm), conductivity (mV), turbidity (NTU’s), total dissolved solids (mg L-1), total dissolved solids (mg L-1), pH (S.U.), total alkalinity (mg CaCO3 L-1), total phosphorus and ortho-phosphorus (also known as soluble reactive phosphorus or SRP measured in mg L-1), total Kjeldahl nitrogen and total inorganic nitrogen (in mg L-1), chlorophyll-a (in µg L-1), and Secchi transparency (in feet). All of these parameters respond to changes in water quality and consequently serve as indicators of change. The deep basin results are discussed below and are presented in Tables 4-9. A map showing the sampling locations for all water quality samples is shown below in Figure 10. All water samples and readings were collected at the three deepest basins on September 22, 2018 with the use of a Van Dorn horizontal water sampler and calibrated Eureka Manta II® multi-meter probe with parameter electrodes, respectively. All samples were taken to a NELAC-certified laboratory for analysis.

26
Figure 10. Locations for water quality sampling of the deep basins in Lake of the Woods (September 22, 2018).

27
4.1.1 Dissolved Oxygen
Dissolved oxygen is a measure of the amount of oxygen that exists in the water column. In general, dissolved oxygen levels should be greater than 5 mg/L to sustain a healthy warm-water fishery. Dissolved oxygen concentrations may decline if there is a high biochemical oxygen demand (BOD) where organismal consumption of oxygen is high due to respiration. Dissolved oxygen is generally higher in colder waters. Dissolved oxygen was measured in milligrams per liter (mg/L) with the use of a calibrated Eureka Manta II® dissolved oxygen meter. Dissolved oxygen (DO) concentrations ranged from 0.0-8.8 mg/L, with the highest values measured at the surface and mid-depth and lowest values near the lake bottom. The bottom of the lake produces a biochemical oxygen demand (BOD) due to microbial activity attempting to break down high quantities of organic plant matter, which reduces dissolved oxygen in the water column at depth. Furthermore, the lake bottom is distant from the atmosphere where the exchange of oxygen occurs. Based on historical review of data, the lake deep basins have traditionally lost dissolved oxygen around mid-summer where they continue to be low until the lake stratifies in the cooler months. A decline in the dissolved oxygen concentrations to near zero may result in an increase in the release rates of phosphorus (P) from lake bottom sediments.
4.1.2 Water Temperature
A lake’s water temperature varies within and among seasons, and is nearly uniform with depth under the winter ice cover because lake mixing is reduced when waters are not exposed to the wind. When the upper layers of water begin to warm in the spring after ice-off, the colder, dense layers remain at the bottom. This process results in a “thermocline” that acts as a transition layer between warmer and colder water layers. During the fall season, the upper layers begin to cool and become denser than the warmer layers, causing an inversion known as “fall turnover” Figure 11). In general, shallow lakes will not stratify and deeper lakes may experience single or multiple turnover cycles. Water temperature was measured in degrees Celsius (ºC) with the use of a calibrated Eureka Manta II® submersible thermometer. The September 22, 2018 water temperatures of Lake of the Woods demonstrated strong thermoclines and is indicative of a seasonally mixed (dimictic) lake that mixes completely around twice per year (spring and fall). On the day of sampling, water temperatures ranged from 22.8°C at the surface to 12.1°C at the bottom of the three deep basins. Deep basin #3 exhibited the strongest stratification with the lowest bottom water temperature of 12.1°C.

28
Figure 11. The lake thermal stratification process. 4.1.3 Conductivity and Oxidative Reduction Potential
Conductivity is a measure of the amount of mineral ions present in the water, especially those of salts and other dissolved inorganic substances. Conductivity generally increases with water temperature and the amount of dissolved minerals and salts in a lake. Conductivity was measured in micro Siemens per centimeter (µS/cm) with the use of a calibrated Eureka Manta II® conductivity probe and meter. Conductivity values for Lake of the Woods were variable among depths at the deep basin and ranged from 374-621 mS/cm which are moderate to high values. The highest conductivity values were recorded in deep basin #3 which had a high conductivity at the lake bottom of 631 mS/cm. At all of the three deep basins, the conductivity increased with water depth. This is likely because salts tend to be heavier than water in the water column and thus usually fall to the bottom of the lake where the deepest areas are located. Since these values are moderately high for an inland lake, the lake water contains ample dissolved metals and ions such as calcium, potassium, sodium, chlorides, sulfates, and carbonates. Baseline parameter data such as conductivity are important to measure the possible influences of land use activities (i.e. road salt influences) on Lake of the Woods over a long period of time, or to trace the origin of a substance to the lake in an effort to reduce pollutant loading. Elevate conductivity values over 800 mS/cm can negatively impact aquatic life.
The oxidation-reduction potential (ORP or Eh) of lake water describes the effectiveness of certain atoms to serve as potential oxidizers and indicates the degree of reductants present within the water. In general, the Eh level (measured in millivolts) decreases in anoxic (low oxygen) waters. Low Eh values are therefore indicative of reducing environments where sulfates (if present in the lake water) may be reduced to hydrogen sulfide (H2S). Decomposition by microorganisms in the hypolimnion may also cause the Eh value to decline with depth during periods of thermal

29
stratification. The Eh values for the Lake of the Woods ranged from -23.6 mV at the bottom to +121.5 mV at the surface. The high variability could be due to numerous factors such as degree of microbial activity near the sediment-water interface, quantity of phytoplankton in the water, or mixing of the lake water.
4.1.4 Turbidity, Total Dissolved Solids, and Total Suspended Solids
Turbidity Turbidity is a measure of the loss of water transparency due to the presence of suspended particles. The turbidity of water increases as the number of total suspended particles increases. Turbidity may be caused by erosion inputs, phytoplankton blooms, storm water discharge, urban runoff, re-suspension of bottom sediments, and by large bottom-feeding fish such as carp. Particles suspended in the water column absorb heat from the sun and raise water temperatures. Since higher water temperatures generally hold less oxygen, shallow turbid waters are usually lower in dissolved oxygen. Turbidity was measured in Nephelometric Turbidity Units (NTU’s) with the use of a calibrated Lutron® turbidity meter. The World Health Organization (WHO) requires that drinking water be less than 5 NTU’s; however, recreational waters may be significantly higher than that. The turbidity of Lake of the Woods was high and ranged from 6.0-10.0 NTU’s during the September 22, 2018 sampling event. On the day of sampling, the winds were calm, and turbidity was not likely influenced by much re-suspension of sediments. Spring values would likely be higher due to increased watershed inputs from spring runoff and/or from increased algal blooms in the water column from resultant runoff contributions. These numbers also correlate with the measured low transparency and elevated chlorophyll-a concentrations. Total Dissolved Solids Total dissolved solids (TDS) are the measure of the amount of dissolved organic and inorganic particles in the water column. Particles dissolved in the water column absorb heat from the sun and raise the water temperature and increase conductivity. Total dissolved solids were measured with the use of a calibrated Eureka Manta II meter in mg/L. Spring values are usually higher due to increased watershed inputs from spring runoff and/or increased planktonic algal communities. The TDS in Lake of the Woods on September 22, 2018 ranged from 239-398 mg/L for the deep basins which is high for an inland lake and correlates with the measured moderate to high conductivity.
Total Suspended Solids (TSS) Total suspended solids are the measure of the number of suspended particles in the water column. Particles suspended in the water column absorb heat from the sun and raise the water temperature. Total suspended solids were measured in mg/L and analyzed in the laboratory with Method SM 2540 D-11. The lake bottom contains many fine sediment particles that are easily perturbed from winds and wave turbulence. Spring values would likely be higher due to increased watershed inputs from spring runoff and/or increased planktonic algal communities. The TSS concentrations in Lake of the Woods on September 22, 2018, were all < 10 mg/L which

30
is favorable and indicates clear water. The TSS values from the drains were much higher and indicate that most of the TSS that reaches the lake settles in the lake bottom. 4.1.5 pH
pH is the measure of acidity or basicity of water. pH was measured with a calibrated Eureka Manta II© pH electrode and pH-meter in Standard Units (S.U). The standard pH scale ranges from 0 (acidic) to 14 (alkaline), with neutral values around 7. Most Indiana lakes have pH values that range from 7.0 to 9.5 S.U. Acidic lakes (pH < 7) are rare in Indiana and are most sensitive to inputs of acidic substances due to a low acid neutralizing capacity (ANC). The pH of Lake of the Woods water ranged from 7.3-8.9 S.U. during the September 22, 2018 sampling event. This range of pH is neutral to alkaline on the pH scale and is ideal for an inland lake. pH tends to rise when abundant aquatic plants are actively growing through photosynthesis or when abundant marl deposits are present.
4.1.6 Total Alkalinity
Total alkalinity is the measure of the pH-buffering capacity of lake water. Lakes with high alkalinity (> 150 mg/L of CaCO3) are able to tolerate larger acid inputs with less change in water column pH. Many Indiana lakes contain high concentrations of CaCO3 and are categorized as having “hard” water. Total alkalinity was measured in milligrams per liter of CaCO3 through an acid titration Method SM 2320 B-11. Total alkalinity in the deep basins were around 160 mg/L of CaCO3 during the sampling event, which represents a moderate alkalinity and may be a characteristic of the lake sediments and geology. Total alkalinity may change on a daily basis due to the re-suspension of sedimentary deposits in the water and respond to seasonal changes due to the cyclic turnover of the lake water.
4.1.7 Total Phosphorus and Ortho-Phosphorus (SRP) Total Phosphorus Total phosphorus (TP) is a measure of the amount of phosphorus (P) present in the water column. Phosphorus is the primary nutrient necessary for abundant algae and aquatic plant growth. Lakes which contain greater than 0.020 mg/L of TP are defined as eutrophic or nutrient-enriched. TP concentrations are usually higher at increased depths due to the higher release rates of P from lake sediments under low oxygen (anoxic) conditions. Phosphorus may also be released from sediments as pH increases. Total phosphorus was measured in milligrams per liter (mg/L) with the use of Method EPA 200.7 (Rev. 4.4). The total phosphorus (TP) concentrations in the lake ranged from 0.024-0.460 mg/L during the September 22, 2018 sampling event. These values are quite low at the surface but quickly increase at mid-depth and at the lake bottom. The highest concentration was measured near the bottom of deep basin #3. These concentrations are quite high at the bottom depths and are indicative of internal loading of TP which means that the TP is accumulating in the lake bottom and is released when the dissolved oxygen level are low. This

31
in turn re-circulates the TP throughout the lake and makes it constantly available for algae and aquatic plants to use for growth. Ortho-Phosphorus Ortho-Phosphorus (also known as soluble reactive phosphorus or SRP) was measured with Method SM 4500-P (E-11). SRP refers to the most bioavailable from of P used by all aquatic life. The SRP concentrations ranged from <0.010-380 mg/L with the lowest concentrations near the surface and the highest near the lake bottom. The bottom SRP concentrations are very high and are problematic in encouraging algal blooms. If the SRP concentrations were all low, this could have meant that less of the TP was available for algal growth but in the observed case, the majority of TP is in the most usable form.
4.1.8 Total Kjeldahl Nitrogen and Total Inorganic Nitrogen
Total Kjeldahl Nitrogen (TKN) is the sum of nitrate (NO3-), nitrite (NO2
-), ammonia (NH4+), and
organic nitrogen forms in freshwater systems. TKN was measured with Method EPA 351.2 (Rev. 2.0) and Total Inorganic Nitrogen (TIN) was calculated based on the aforementioned three different forms of nitrogen. Much nitrogen (amino acids and proteins) also comprises the bulk of living organisms in an aquatic ecosystem. Nitrogen originates from atmospheric inputs (i.e. burning of fossil fuels), wastewater sources from developed areas (i.e. runoff from fertilized lawns), agricultural lands, septic systems, and from waterfowl droppings. It also enters lakes through groundwater or surface drainage, drainage from marshes and wetlands, or from precipitation (Wetzel, 2001). In lakes with an abundance of nitrogen (N: P > 15), phosphorus may be the limiting nutrient for phytoplankton and aquatic macrophyte growth. Alternatively, in lakes with low nitrogen concentrations (and relatively high phosphorus), the blue-green algae populations may increase due to the ability to fix nitrogen gas from atmospheric inputs. Lakes with a mean TKN value of 0.66 mg/L may be classified as oligotrophic, those with a mean TKN value of 0.75 mg /L may be classified as mesotrophic, and those with a mean TKN value greater than 1.88 mg/L may be classified as eutrophic. Lake of the Woods contained moderate to high concentrations of TKN at all depths (1.1-5.7 mg/L), which are elevated for an inland lake of similar size and demonstrates that the lake is high in both phosphorus and nitrogen. Thus, any additional inputs of either nutrient will further enhance algae growth. In the absence of dissolved oxygen, nitrogen is usually in the ammonia form and will contribute to rigorous submersed aquatic plant growth if adequate water transparency is present. The TIN consists of nitrate, nitrite, and ammonia forms of nitrogen without the organic forms of nitrogen. The TIN concentrations ranged from 0.019-5.0 mg/L with the highest concentrations present at the bottom of the deep basins. Two major reasons why submersed rooted aquatic plant growth is not more prevalent given these concentrations are due to depth limitations and the lack of water clarity which is critical for higher aquatic plant growth.

32
4.1.9 Chlorophyll-a and Algae
Chlorophyll-a is a measure of the amount of green plant pigment present in the water, often in the form of planktonic algae. High chlorophyll-a concentrations are indicative of nutrient-enriched lakes. Chlorophyll-a concentrations greater than 6 µg/L are found in eutrophic or nutrient-enriched aquatic systems, whereas chlorophyll-a concentrations less than 2.2 µg/L are found in nutrient-poor or oligotrophic lakes. Chlorophyll-a was measured in micrograms per liter (µg/L) with the use of Turner Designs® hand-held in situ fluorimeter. The chlorophyll-a concentrations in Lake of the Woods were determined by collecting a composite sample of the algae throughout the water column at the deep basin site from just above the lake bottom to the lake surface. The chlorophyll-a concentration in the deep basins ranged from 9.0-11.0 µg/L during the September 22, 2018 sampling event. These elevated concentrations are due to the presence of numerous cyanobacteria (blue-green algae) which have the distinct advantage of using nitrate and ammonia in the water (along with N2 gas from the atmosphere) as food and can out-compete the green algae due to their faster growth rates and ability to be buoyant at the lake surface which reduces light to underlying algae. Algal genera from a composite water sample collected from the deep basins of Lake of the Woods were analyzed under a compound brightfield microscope. The genera present included the Chlorophyta (green algae): Rhizoclonium sp., Closterium sp., Haematococcus sp., Ulothrix sp., Spirogyra sp., Chlorella sp., Mougeotia sp., Pandorina sp., Scenedesmus sp., Zygnema sp., and Chloromonas sp. the Cyanophyta (blue-green algae): Microcystis sp., and Gleocystis sp.; the Bascillariophyta (diatoms): Navicula sp., Fragilaria sp., and Synedra sp. The aforementioned species indicate a moderately diverse algal flora and represent a relatively balanced freshwater ecosystem, capable of supporting a strong zooplankton community in favorable water quality conditions. The blue-green algal general were the most abundant, followed by the green algae, and finally the diatoms.
4.1.10 Secchi Transparency
Secchi transparency is a measure of the clarity or transparency of lake water, and is measured with the use of an 8-inch diameter standardized Secchi disk. Secchi disk transparency is measured in feet (ft.) or meters (m) by lowering the disk over the shaded side of a boat around noon and taking the mean of the measurements of disappearance and reappearance of the disk (Figure 12). Elevated Secchi transparency readings allow for more aquatic plant and algae growth. Eutrophic systems generally have Secchi disk transparency measurements less than 7.5 feet due to turbidity caused by excessive planktonic algae growth. The Secchi transparency of Lake of the Woods was measured on September 22, 2018 and ranged from 3.7-3.9 feet over the deep basins during the spring sampling event which are low readings. Measurements were collected during calm conditions (winds out of the northwest at 5-10 mph). This transparency indicates that an abundance of solids such as suspended particles and algae are present throughout the water column which increases turbidity and reduces water clarity.

33
Secchi transparency is variable and depends on the amount of suspended particles in the water (often due to windy conditions of lake water mixing) and the amount of sunlight present at the time of measurement. Figure 12. Measurement of water transparency with a Secchi disk.

34
Table 4. Lake of the Woods physical water quality parameter data collected at deep basin #1 (September 22, 2018).
Depth (m)
Water Temp (°C)
DO (mg/L)
pH (S.U.)
Conduc. (mS/cm)
Turb. (NTU)
Secchi Depth
(ft)
ORP (mmhos/cm)
1.0 22.8 8.3 8.9 374 6.0 3.9 115.6
2.0 22.7 7.9 8.8 375 6.0 -- 113.9
3.0 22.4 7.1 8.7 379 6.0 -- 111.5
4.0 20.9 3.8 8.0 394 7.0 -- 111.2
5.0 18.6 3.2 7.6 443 7.0 -- 48.6
6.0 14.4 0.3 7.4 516 9.0 -- -32.8
7.0 13.5 0.2 7.4 524 9.0 -- -20.8
8.0 13.3 0.1 7.4 525 9.0 -- -20.4
9.0 13.1 0.1 7.4 526 9.0 -- -16.4
10.0 13.1 0.0 7.4 526 9.0 -- -12.6
13.0 13.1 0.0 7.4 529 10.0 -- -12.2
Table 5. Lake of the Woods chemical water quality parameter data collected at deep basin #1 (September 22, 2018).
Depth (m)
TKN (mg/L)
TIN (mg/L)
TSS (mg/L)
TP (mg/L)
Ortho-P (mg/L)
TDS (mg/L)
Chl-a (µg/L)
Talk (mg CaCO3/L)
1.0 1.2 0.020 <10 0.030 0.010 239 10.0 160
6.5 2.4 2.4 <10 0.068 0.036 327 -- --
13.0 5.4 4.1 <10 0.270 0.220 338 -- --

35
Table 6. Lake of the Woods physical water quality parameter data collected at deep basin #2 (September 22, 2018).
Depth (m)
Water Temp (°C)
DO (mg/L)
pH (S.U.)
Conduc. (mS/cm)
Turb. (NTU)
Secchi Depth
(ft)
ORP (mmhos/cm)
1.0 22.6 8.4 8.8 375 6.0 3.9 126.8
2.0 22.6 7.6 8.8 376 7.0 -- 106.4
3.0 21.8 5.7 8.3 387 7.0 -- 103.4
4.0 21.0 3.4 7.8 393 7.0 -- 97.5
5.0 19.2 0.7 7.7 431 8.0 -- 12.6
6.0 16.4 0.3 7.5 494 8.0 -- -20.3
7.0 14.3 0.2 7.4 514 8.0 -- -20.1
8.0 13.3 0.1 7.4 524 8.0 -- -18.4
9.0 13.1 0.1 7.4 528 8.0 -- -18.4
10.0 13.0 0.0 7.4 530 9.0 -- -18.4
13.0 13.0 0.0 7.4 530 9.0 -- -14.5
Table 7. Lake of the Woods chemical water quality parameter data collected at deep basin #2 (September 22, 2018).
Depth (m)
TKN (mg/L)
TIN (mg/L)
TSS (mg/L)
TP (mg/L)
Ortho-P (mg/L)
TDS (mg/L)
Chl-a (µg/L)
Talk (mg CaCO3/L)
1.0 1.1 0.015 <10 0.028 0.013 240 11.0 160
6.5 1.7 0.67 <10 0.035 0.011 320 -- --
13.0 5.3 4.3 <10 0.300 0.270 339 -- --

36
Table 8. Lake of the Woods physical water quality parameter data collected at deep basin #3 (September 22, 2018).
Depth (m)
Water Temp (°C)
DO (mg/L)
pH (S.U.)
Conduc. (mS/cm)
Turb. (NTU)
Secchi Depth
(ft)
ORP (mmhos/cm)
1.0 22.7 8.4 8.8 375 6.0 3.7 116.4
2.0 22.6 7.8 8.8 376 7.0 -- 111.7
3.0 22.0 7.3 8.6 380 7.0 -- 109.4
4.0 21.1 5.4 8.1 392 7.0 -- 100.5
5.0 19.2 2.9 7.8 433 8.0 -- 56.3
6.0 15.8 1.3 7.5 502 8.0 -- 42.1
7.0 14.4 0.5 7.4 510 8.0 -- 12.1
8.0 14.4 0.2 7.4 523 8.0 -- -10.4
9.0 13.3 0.1 7.4 542 8.0 -- -10.1
10.0 12.6 0.1 7.3 546 9.0 -- -10.0
13.0 12.1 0.0 7.3 621 9.0 -- -10.0
Table 9. Lake of the Woods chemical water quality parameter data collected at deep basin #3 (September 22, 2018).
Depth (m)
TKN (mg/L)
TIN (mg/L)
TSS (mg/L)
TP (mg/L)
Ortho-P (mg/L)
TDS (mg/L)
Chl-a (µg/L)
Talk (mg CaCO3/L)
1.0 1.3 0.019 <10 0.024 <0.010 240 9.0 160
6.5 3.2 2.2 <10 0.040 0.024 321 -- --
13.0 5.7 5.0 <10 0.460 0.380 398 -- --

37
4.2 Lake of the Woods Aquatic Vegetation Communities
Aquatic plants (macrophytes) are an essential component in the littoral zones of most lakes in that they serve as suitable habitat and food for macroinvertebrates, contribute oxygen to the surrounding waters through photosynthesis, stabilize bottom sediments (if in the rooted growth form), and contribute to the cycling of nutrients such as phosphorus and nitrogen upon decay. In addition, decaying aquatic plants contribute organic matter to lake sediments which further supports healthy growth of successive aquatic plant communities that are necessary for a balanced aquatic ecosystem. An overabundance of aquatic vegetation may cause organic matter to accumulate on the lake bottom faster than it can break down. Aquatic plants generally consist of rooted submersed, free-floating submersed, floating-leaved, and emergent growth forms. The emergent growth form (i.e. Cattails, Native Loosestrife) is critical for the diversity of insects onshore and for the health of nearby wetlands. Submersed aquatic plants can be rooted in the lake sediment (i.e. Milfoils, Pondweeds), or free-floating in the water column (i.e. Coontail). Nonetheless, there is evidence that the diversity of submersed aquatic macrophytes can greatly influence the diversity of macroinvertebrates associated with aquatic plants of different structural morphologies (Parsons and Matthews, 1995). Therefore, it is possible that declines in the biodiversity and abundance of submersed aquatic plant species and associated macroinvertebrates, could negatively impact the fisheries of inland lakes. Alternatively, the overabundance of aquatic vegetation can compromise recreational activities, aesthetics, and property values. Lake of the Woods has distinct patches of floating-leaved aquatic vegetation and this should be preserved for fish and wildlife habitat (Figure 13). Figure 13. Abundant lily pads in Lake of the Woods (©RLS, 2018).

38
A whole-lake scan of the aquatic vegetation in Lake of the Woods was conducted on July 31, 2018 with a WAAS-enabled Lowrance HDS 9 GPS with variable frequency transducer. This data was then uploaded into a cloud software program to reveal maps that displayed depth contours, sediment hardness, and aquatic vegetation biovolume (Figure 14). On this scan map, the color blue refers to areas that lack vegetation. The color green refers to low-lying vegetation. The colors red/orange refer to tall-growing vegetation. Since Lake of the Woods is deep overall, most of the lake does not contain aquatic vegetation. However, there are many areas around the littoral (shallow) zone of the lake that contain low-growing plants like Chara or Coontail. In addition, any milfoil canopies or lily pads will show as red color on the map. For this reason, the scans are conducted in conjunction with a whole lake GPS survey to account for individual species identification of all aquatic plants in the lake. The Aquatic Vegetation Assessment Site (AVAS) Survey method is used to assess the presence and percent cumulative cover of submersed, floating-leaved, and emergent aquatic vegetation within and around the littoral zones of inland lakes. With this survey method, the littoral zone areas of the lakes are divided into lakeshore sections approximately 100 - 300 feet in length. Each AVAS segment is sampled using visual observation, dependent on water clarity, and weighted rake tows to verify species identification. The species of aquatic macrophytes present and density of each macrophyte are recorded onto an MDEQ AVAS data sheet. Each separate plant species found in each AVAS segment is recorded along with an estimate of each plant density. Each macrophyte species corresponds to an assigned number. There are designated density codes for the aquatic vegetation surveys, where a = found (occupying < 2% of the surface area of the lake), b = sparse (occupying 2-20% of the surface area of the lake), c = common, (occupying 21-60% of the surface area of the lake), and d = dense (occupying > 60% of the surface area of the lake). In addition to the particular species observed (via assigned numbers), density information above was used to estimate the percent cumulative coverage of each species within the AVAS site. If shallow areas were present in the open waters of the lakes, then individual AVAS segments were sampled at those locations to assess the macrophyte communities in offshore locations. This is particularly important since exotics often expand in shallow island areas located offshore in many lakes.
The AVAS survey of Lake of the Woods was conducted on August 8, 2018 and data were placed in a table showing the relative abundance of each aquatic plant species found and a resultant calculation showing the frequency of each plan, and cumulative cover (Figure 15).

39
Figure 14. Aquatic plant biovolume of all aquatic plants in Lake of the Woods, Marshall County, Indiana (July 31, 2018). Note: Red color denotes high-growing aquatic plants, green color denoted low-growing aquatic plants, and blue color represents a lack of aquatic vegetation.

40
Figure 15. Map showing AVAS sampling sites for the aquatic vegetation survey in Lake of the Woods (August 8, 2018).

41
4.2.1 Lake of the Woods Native Aquatic Macrophytes
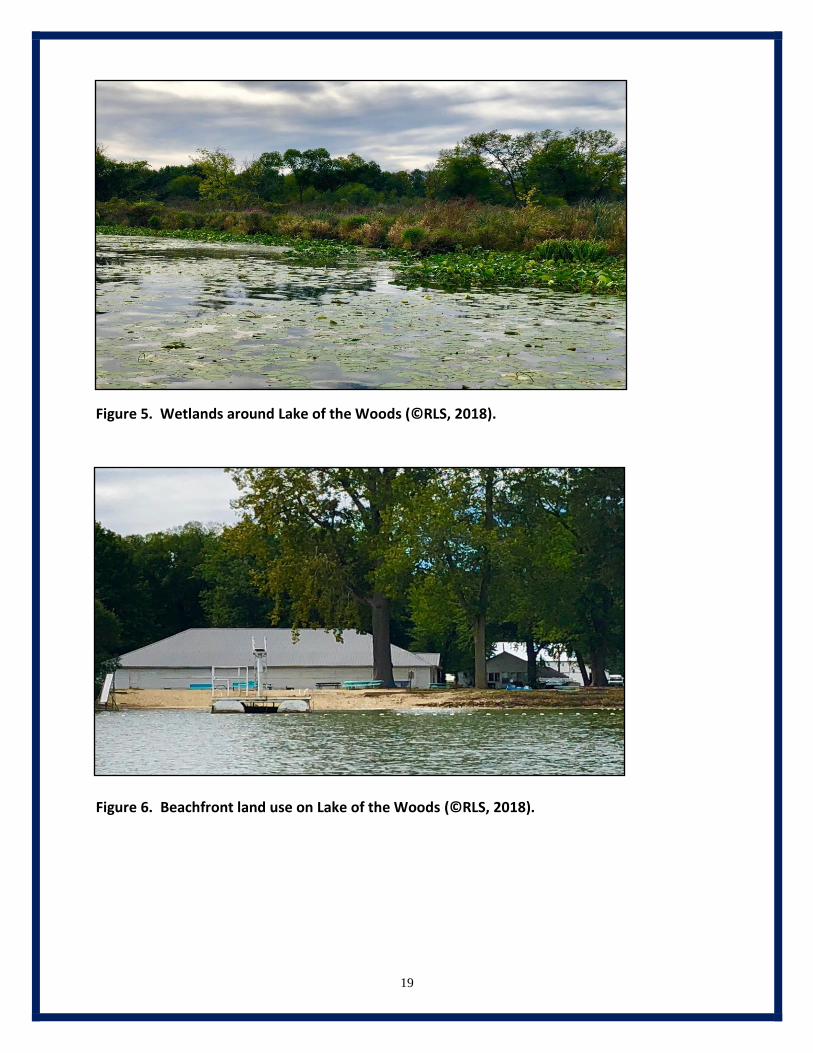
There are hundreds of native aquatic plant species in the waters of the United States. The most diverse native genera include the Potamogetonaceae (Pondweeds) and the Haloragaceae (Milfoils). Native aquatic plants may grow to nuisance levels in lakes with abundant nutrients (both water column and sediment) such as phosphorus, and in sites with high water transparency. The diversity of native aquatic plants is essential for the balance of aquatic ecosystems, because each plant harbors different macroinvertebrate communities and varies in fish habitat structure. Lake of the Woods contained 8 native submersed, 4 floating-leaved, and 3 emergent aquatic plant species, for a total of 15 native aquatic macrophyte species (Table 10). Photos of all native aquatic plants are shown below in Figures 16-30. The majority of the emergent macrophytes may be found along the shoreline of the lake. Additionally, the majority of the floating-leaved macrophyte species can be found near the shoreline and wetland areas. This is likely due to enriched sediments and shallower water depth with reduced wave energy, which facilitates the growth of aquatic plants with various morphological forms. The dominant aquatic plants in the main part of the lake included the rootless Coontail (8.9% of the littoral zone), Yellow Waterlily (4.5% of the littoral zone), and Floating-leaf Pondweed (4.2% of the littoral zone). The Pondweeds grow tall in the water column and serve as excellent fish cover. In dense quantities, they can be a nuisance for swimming and boating and can be controlled with selective herbicide management or with mechanical harvesting. The relative abundance of non-rooted aquatic plants (relative to rooted plants) in the lake suggests that the water column is the primary source of nutrients (relative to the sediments), since these plants obtain most of their nutrition from the water column. There was also the floating-leaved macrophytes such as, Nuphar variegata (Yellow-Waterlily), which are critical for housing macroinvertebrates and should be protected and preserved in non-recreational areas to serve as food sources for the fishery and wildlife around the lake. The emergent plants, such as (Cattails), and Schoenoplectus acutus (Bulrushes) are critical for shoreline stabilization as well as for wildlife and fish spawning habitat. The presence of Purple Loosestrife around the Lake of the Woods shoreline is an imminent threat to the emergent macrophyte populations, which could be displaced if left untreated or removed.

42
Table 10. Lake of the Woods native aquatic plants (August 8, 2018).
Native Aquatic Plant Species Name
Aquatic Plant Common Name
Abundance in/around Lake of the
Woods
Aquatic Plant Growth Habit
Chara vulgaris Muskgrass 0.1 Submersed, Rooted
Potamogeton pectinatus Thin-leaf Pondweed 3.7 Submersed, Rooted
Potamogeton zosteriformis Flat-stem Pondweed 0.1 Submersed, Rooted
Potamogeton natans Floating-leaf Pondweed 4.2 Submersed, Rooted
Zosterella dubia Water Stargrass 0.1 Submersed, Rooted
Ceratophyllum demersum Coontail 8.9 Submersed, Non-Rooted
Utricularia vulgaris Bladderwort 0.1 Submersed, Non-Rooted
Najas guadalupensis Southern Naiad 0.1 Submersed, Rooted
Nuphar variegata Yellow Waterlily 4.5 Floating-Leaved
Nymphaea odorata White Waterlily 4.0 Floating-Leaved
Azolla sp. Watermeal 0.1 Floating-Leaved
Lemna minor Duckweed 1.0 Floating-Leaved
Typha latifolia Cattails 0.1 Emergent
Schoenoplectus acutus Bulrushes 0.1 Emergent
Sagittaria sp. Arrowhead 0.1 Emergent
43
Figure 16. Chara (Muskgrass) ©RLS
Figure 17. Thin-leaf Pondweed ©RLS
Figure 18. Flat-stem Pondweed ©RLS
Figure 19. Floating-leaf Pondweed ©RLS
Figure 20. Water Stargrass ©RLS
Figure 21. Coontail ©RLS

44
Figure 22. Bladderwort ©RLS
Figure 23. Southern Naiad ©RLS
Figure 24. White Waterlily ©RLS
Figure 25. Yellow Waterlily ©RLS
Figure 26. Watermeal ©RLS
Figure 27. Duckweed ©RLS

45
4.2.2 Lake of the Woods Exotic Aquatic Macrophytes
Exotic aquatic plants (macrophytes) are not native to a particular site, but are introduced by some biotic (living) or abiotic (non-living) vector. Such vectors include the transfer of aquatic plant seeds and fragments by boats and trailers (especially if the lake has public access sites), waterfowl, or by wind dispersal. In addition, exotic species may be introduced into aquatic systems through the release of aquarium or water garden plants into a water body. An aquatic exotic species may have profound impacts on the aquatic ecosystem. Eurasian Watermilfoil (Myriophyllum spicatum; Figure 31) is an exotic aquatic macrophyte first documented in the United States in the 1880’s (Reed 1997), although other reports (Couch and Nelson 1985) suggest it was first found in the 1940’s. In recent years, this species has hybridized with native milfoil species to form hybrid species. Eurasian Watermilfoil has since spread to thousands of inland lakes in various states through the use of boats and trailers, waterfowl, seed dispersal, and intentional introduction for fish habitat. Eurasian Watermilfoil is a major threat to the ecological balance of an aquatic ecosystem through causation of significant declines in favorable native vegetation within lakes (Madsen et al. 1991), in that it forms dense canopies (Figure 32) and may limit light from reaching native aquatic plant species (Newroth 1985; Aiken et al. 1979). Additionally, Eurasian Watermilfoil can alter the macroinvertebrate populations associated with particular native plants of certain structural architecture (Newroth 1985). Approximately 18.3 acres of hybridized Eurasian Watermilfoil were found in the lake during the August 8, 2018 survey (Figure 33). Eurasian Watermilfoil growth in Lake of the Woods is capable of producing dense surface canopies. The species of invasive aquatic plants present and relative abundance of each plant are recorded and then the amount of cover in the littoral zone is calculated. Exotic aquatic plant species in Lake of the Woods are shown in Table 11 below.
Figure 28. Cattails ©RLS
Figure 29. Bulrushes ©RLS Figure 30. Arrowhead ©RLS

46
Figure 31. Hybrid Eurasian Watermilfoil plant with seed head and fragments (©RLS).
Figure 32. Hybrid Eurasian Watermilfoil Canopy on an inland lake (©RLS).

47
Figure 33. Hybrid Eurasian Watermilfoil locations in Lake of the Woods (August 8, 2018).

48
Curly-leaf Pondweed (Potamogeton crispus; Figure 34) is an exotic, submersed, rooted aquatic plant that was introduced into the United States in 1807 but was abundant by the early 1900’s. It is easily distinguished from other native pondweeds by its wavy leaf margins. It grows early in the spring and as a result may prevent other favorable native aquatic species from germinating. The plant reproduces by the formation of fruiting structures called turions. It does not reproduce by fragmentation as invasive watermilfoil does; however, the turions may be deposited in the lake sediment and germinate in following seasons. Curly-leaf Pondweed is a pioneering aquatic plant species and specializes in colonizing disturbed habitats. It is highly invasive in aquatic ecosystems with low biodiversity and unique sediment characteristics. Some dying stems of the plant were found during the August 8, 2018 survey but the plant was likely more abundant prior to lake treatments. Figure 34. Curly-leaf Pondweed (©RLS). Starry Stonewort (Nitellopsis obtusa; Figure 35) is an invasive macro alga that has invaded many inland lakes and was originally discovered in the St. Lawrence River. The “leaves” appear as long, smooth, angular branches of differing lengths. The alga has been observed in dense beds at depths beyond several meters in clear inland lakes and can grow to heights in excess of a few meters. It prefers clear alkaline waters and has been shown to cause significant declines in water quality and fishery spawning habitat. A single fragment of Starry Stonewort was confirmed in the southwestern region of Lake of the Woods and this area along with the rest of the lake should be monitored. Individual fragments can be transported to the lake via waterfowl or boats.

49
Figure 35. A fragment of Starry Stonewort found in Lake of the Woods (August 8, 2018). Purple Loosestrife (Lythrum salicaria; Figure 36) is an invasive (i.e. exotic) emergent aquatic plant that inhabits wetlands and shoreline areas and was found in one area on the east shoreline of Lake of the Woods. L. salicaria has showy magenta-colored flowers that bloom in mid-July and terminate in late September. The seeds are highly resistant to tough environmental conditions and may reside in the ground for extended periods of time. It exhibits rigorous growth and may out-compete other favorable native emergents such as Cattails (Typha latifolia) and thus reduce the biological diversity of localized ecosystems. The plant is spreading rapidly across the United States and is converting diverse wetland habitats to monocultures with substantially lower biological diversity. Lake residents should be educated about its invasiveness and threat to the health of the Lake of the Woods ecosystem. It should be removed promptly (i.e. by hand pulling or using a shovel to remove the roots and then discarding the plant into the garbage) if it is discovered to avoid further infestation. If the plant is not promptly removed by hand, it could dominate in wetland areas and require larger-scale systemic herbicide treatments. The plant was found in 5 locations along the Lake of the Woods shoreline (Figure 37).

50
Figure 36. The invasive emergent Purple Loosestrife (©RLS).

51
Figure 37. Purple Loosestrife locations around Lake of the Woods (August 8, 2018).

52
Table 11. Lake of the Woods exotic aquatic plant species (August 8, 2018).
Exotic Aquatic Plant
Species
Common Name Growth Habit Abundance in
or around
Lake of the
Woods
Myriophyllum spicatum Hybrid Watermilfoil Submersed; Rooted 18.3 acres
Nitellopsis obtusa Starry Stonewort Submersed; Rooted Fragment
Potamogeton crispus Curly-leaf Pondweed Submersed; Rooted Few stems
Lythrum salicaria Purple Loosestrife Emergent 5 locations
4.3 Lake of the Woods Zooplankton and Macroinvertebrates
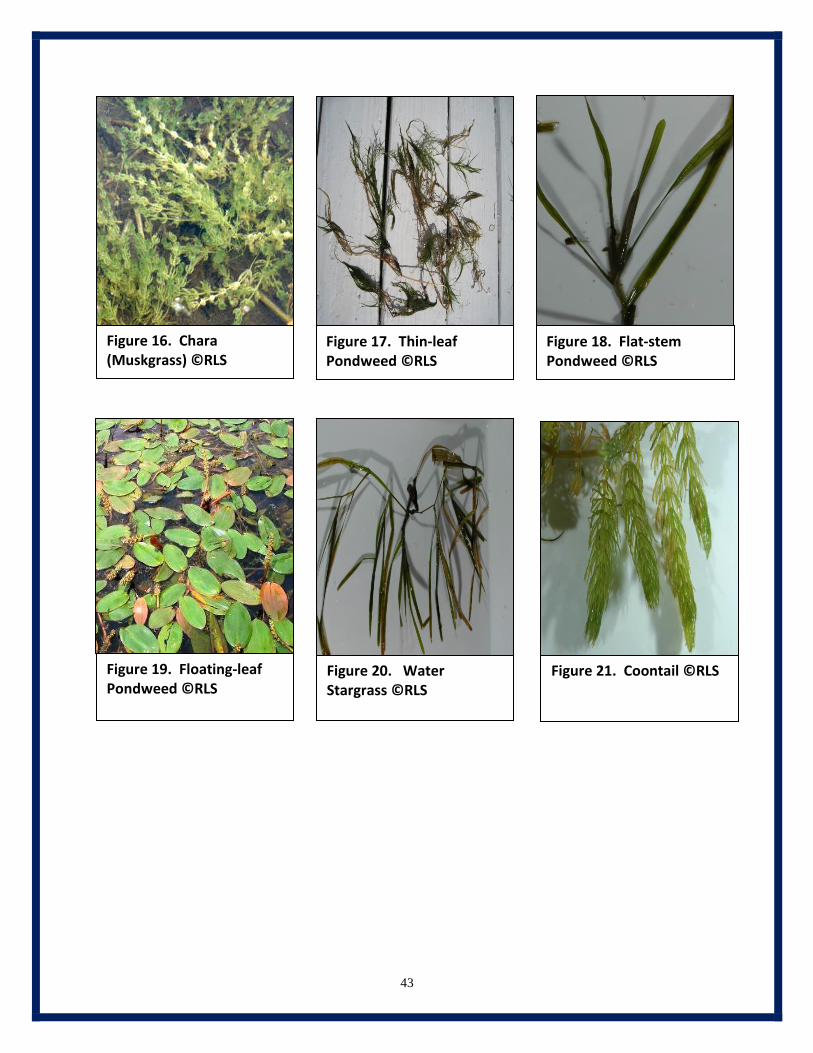
The zooplankton and macroinvertebrates make up the food chain base in an aquatic ecosystem and thus are integral components. Zooplankton are usually microscopic but some can be seen with the unaided eye. Macroinvertebrates can be readily seen and are also known as aquatic insects or bugs. The zooplankton migrate throughout the water column of the lake according to daylight/evening cycles and are prime food for the lake fishery. Macroinvertebrates can be found in a variety of locations including on aquatic vegetation, near the shoreline, and in the lake bottom sediments. The biodiversity and relative abundance of both food chain groups are indicative of water quality status and productivity. Lake Zooplankton A zooplankton tow using a Wildco® pelagic plankton net with collection jar (Figure 38) was conducted by RLS scientists on September 22, 2018 over the deep basins of Lake of the Woods. Plankton sub-samples (in 1 ml aliquots) were analyzed under a Zeiss® dissection scope with the use of a Bogorov counting chamber. The most abundant zooplankton genera included cladocerans such as Daphnia and the rotifers Keratella, Asplanchna, and Brachionus (Table 12). Figures 39 and 40 show two common zooplankton found in Lake of the Woods.
53
Table 12. Zooplankton taxa and count data from Lake of the Woods (September 22, 2018).
Cladocerans Count Copepods Count Rotifers Count Daphnia 12 Cyclops 4 Keratella 9
Diaptomus 9 Asplanchna 2
Brachionus 6
Figure 38. A zooplankton collection tow net (RLS, 2018).

54
Benthic Macroinvertebrates Freshwater macroinvertebrates are ubiquitous, as even the most impacted lake contains some representatives of this diverse and ecologically important group of organisms. Benthic macroinvertebrates are key components of lake food webs both in terms of total biomass and in the important ecological role that they play in the processing of energy. Others are important predators, graze alga on rocks and logs, and are important food sources (biomass) for fish. The removal of macroinvertebrates has been shown to impact fish populations and total species richness of an entire lake or stream food web (Lenat and Barbour 1994). In the food webs of lakes, benthic macroinvertebrates have an intermediate position between primary producers and higher trophic levels (fish) on the other side. Hence, they play an essential role in key ecosystem processes (food chain dynamics, productivity, nutrient cycling, and decomposition). Restorative Lake Sciences collected benthic (bottom) aquatic macroinvertebrate samples at five locations (Figure 41) using an Ekman hand dredge sampler (Figure 42) on September 22, 2018 (Table 13). Macroinvertebrate samples were placed in small plastic buckets and analyzed in the RLS wet laboratory within 24 hours after collection using a hard plastic sorting tray, tweezers, and a Zeiss® dissection microscope under 1X, 3X, and 10X magnification power. Macroinvertebrates were taxonomically identified using a key from: “The Introduction to the Aquatic Insects of North America”, by Merritt, Cummings, and Berg (2008) to at least the family level and genus level whenever possible. All macroinvertebrates were recorded including larval or nymph forms, mussels, snails, worms, or other “macro” life forms.
Figure 39. Daphnia-A Zooplankton (photo courtesy of the EPA).
Figure 40. A Copepod Zooplankton (photo courtesy of the USGS).

55
Genera found in the Lake of the Woods sediment samples included midges (Chironomindae), Jute snails (Pleuroceridae), Wheel snails (Planorbidae), and Zebra Mussels (Dreisseniidae). Of all the species found, all were native except for the Zebra Mussels. While the majority of the species were native, some are located universally in low quality and high quality water. The midge larvae family Chironomidae can be found in both high and low quality water (Lenat and Barbour 1994). A previous macroinvertebrate survey of the major drains entering Lake of the Woods by Skelton (1999) from St. Norbert College reported 21 different macroinvertebrate taxa which were dominated by chironomids, hirudinae, and mollusks. These genera were pollutant tolerant similar to the ones collected by RLS in 2018. The drains were more diverse though which is likely due to flowing water conditions which are usually higher in dissolved oxygen than the lake bottom and thus more favorable for macroinvertebrates.

56
Figure 41. Benthic macroinvertebrate sampling locations in Lake of the Woods (September 22, 2018).

57
Figure 42. An Ekman hand dredge for sampling lake sediments (RLS, 2018). Native lake macroinvertebrate communities can and have been impacted by exotic and invasive species. A study by Stewart and Haynes (1994) examined changes in benthic macroinvertebrate communities in southwestern Lake Ontario following the invasion of Zebra and Quagga mussels (Dreissena spp.). They found that Dreissena had replaced a species of freshwater shrimp as the dominant species. However, they also found that additional macroinvertebrates actually increased in the 10-year study, although some species were considered more pollution-tolerant than others. This increase was thought to have been due to an increase in Dreissena colonies increasing additional habitat for other macroinvertebrates. The moderate alkalinity of Lake of the Woods may allow for rigorous growth of Zebra Mussels since they need ample alkalinity (calcium carbonate) for their shells. In addition to exotic and invasive macroinvertebrate species, macroinvertebrate assemblages can be affected by land-use. Stewart et al. (2000) showed that macroinvertebrates were negatively affected by surrounding land-use. They also indicated that these land-use practices are important to the restoration and management and of lakes. Schreiber et al., (2003) stated that disturbance and anthropogenic land use changes are usually considered to be key factors facilitating biological invasions.

58
Table 13. Macroinvertebrates found in Lake of the Woods, Marshall County, IN (September 22, 2018).
Site S1 Family Genus Number Common name
Chironimidae Chironomus spp. 5 Midge
Pleuroceridae 2 Jute snails
Planorbidae 2 Wheel snails
Dreisseniidae 1 Zebra mussels
Total 10
Site S2 Family Genus Number Common name
Planorbidae 4 Wheel snails
Dreisseniidae 3 Zebra mussels
Chironomidae Chironomus spp. 1 Midge
Total 8
Site S3 Family Genus Number Common name
Pleuroceridae 3 Jute snails
Dreisseniidae 2 Zebra mussels
Total 5
Site S4 Family Genus Number Common name
Pleuroceridae 1 Jute snails
Dreisseniidae 2 Zebra mussels
Total 3
Site S5 Family Genus Number Common name
Chironomidae Chironomus spp. 4 Midge
Dreisseniidae 3 Zebra mussels
Total 7
4.4 Lake of the Woods Fishery
The Lake of the Woods walleye fishery is strong and the lake is a sought-after site for fishing activities. There have been a total of 23 fish species observed in Lake of the Woods during a June 6, 1996 fishery assessment by the Indiana Department of Natural Resources (IDNR), including the following: Bluegill, Carp, Spotted Gar, Gizzard Shad, Walleye, White Crappie, White Bass, White Sucker, Yellow Perch, Yellow Bullhead, Channel Catfish, Pumpkinseed, Largemouth Bass, Golden Shiner, Black Crappie, Black Bullhead, Redear Sunfish, Brown Bullhead, Hybrid Sunfish, Smallmouth Buffalo, Quillback, Warmouth, and Spotted Sucker. During that evaluation, Bluegills were the most abundant with Walleye as the second most abundant. The IDNR has stocked the lake with walleye fingerlings ranging in size from 1.18 inches to 7.0 inches. Currently, the lake has healthy populations of Walleye, Largemouth Bass, and White Bass. The IDNR Department of Fisheries and Wildlife has stocked walleye in the lake since 1990 with a minimum stocking size of 14.0 inches established in 1996. A recent fishery survey by the IDNR in 2007 demonstrated that the fishery of the lake was dominated by sport fish such as Walleye, White Bass, Bluegill, Channel Catfish, and Yellow Perch. In 2008, Walleye stocking was reduced due to the growing number of predatory fishes in the lake.

59
Too many predatory fish can lead to reduced prey populations of preferred panfish. The recommended stocking rate of Walleye by the INDR was established to be around 50 fingerlings per acre on an annual basis.
5.0 LAKE OF THE WOODS IMPROVEMENT METHODS
Lake improvement methods consist of strategies to reduce invasive aquatic plants, reduce the transport of invasive species, reduction of nuisance algae, improvements in water quality, reductions in lake sedimentation and nutrient transport, and proper immediate watershed management. The following sections offer useful and effective methods for improving the overall condition of Lake of the Woods.
5.1 Lake of the Woods Aquatic Plant Management
Improvement strategies, including the management of exotic aquatic plants, control of land and shoreline erosion, and further nutrient loading from external sources, are available for the various problematic issues facing Lake of the Woods. The lake management components involve both within-lake (basin) and around-lake (watershed) solutions to protect and restore complex aquatic ecosystems such as Lake of the Woods. The goals of a Lake Management Plan (LMP) such as this are to increase water quality, increase favorable wildlife habitat and aquatic plant and animal biodiversity, optimize recreational use, and protect property values. Regardless of the management goals, all management decisions must be site-specific and should consider the socio-economic, scientific, and environmental components of the LMP such as within this LMP. The management of submersed nuisance invasive aquatic plants is necessary in Lake of the Woods due to accelerated growth and distribution. Management options should be environmentally and ecologically-sound and financially feasible. Options for control of aquatic plants are limited yet are capable of achieving strong results when used properly. Implementation of more growth of favorable native aquatic plants (especially the low growing native plants) in Lake of the Woods to provide for a healthier lake is recommended though this may require significant increases in water clarity along with reductions in invasive plant cover. All aquatic vegetation should be managed with solutions that will yield the longest-term results.
5.1.1 Aquatic Invasive Species Prevention An exotic species is a non-native species that does not originate from a particular location. When international commerce and travel became prevalent, many of these species were transported to areas of the world where they did not originate. Due to their small size, insects, plants, animals, and aquatic organisms may escape detection and be unknowingly transferred to unintended habitats.

60
The first ingredient to successful prevention of unwanted transfers of exotic species to Lake of the Woods is awareness and education (Figures 43 and 44). The majority of the exotic species of concern have been listed in this report. Other exotic species on the move could be introduced to the riparians around Lake of the Woods through the use of a professionally developed educational newsletter. Public boat launches are a primary area of vector transport for all invasive species and thus boat washing stations have become more common. With over 13 million registered boaters in the U.S. alone, the need for reducing transfer of aquatic invasive species (AIS) has never been greater. The Minnesota Sea Grant program identifies five major boat wash scenarios which include: 1) Permanent washing stations at launch sites, 2) Portable drive-thru or transient systems, 3) Commercial car washes, 4) Home washing, and 5) Mandatory vs. volunteer washing. Boat washing stations promote the Clean Waters Clean Boats volunteer education program by educating boaters to wash boating equipment (including trailers and bait buckets) before entry into every lake. Critical elements of this education include: 1) How to approach boaters, 2) Demonstration of effective boat and trailer inspections and cleaning techniques, 3) The recording of important information, 4) Identification of high-priority invasive species, and 5) Sharing findings with others. Once a boat washing station is in place on Lake of the Woods, the LOWPOA and IDNR should work together to educate the public and lake users on proper cleaning techniques and other invasive species information. A “Landing Blitz” can be held once the station is in place and the public can be invited to a field demonstration of how to use the washing station. A typical boat washing station typically costs around $15,000-$20,000. Additional educational information regarding these stations and education can be found on the following websites:
1) IDNR Invasive Species List: https://www.in.gov/dnr/3123.htm 2) USDA: https://www.invasivespeciesinfo.gov/us/indiana 3) Indiana Wildlife Federation Invasive animals, plants list, and native plants/animals list:
https://www.indianawildlife.org/wildlife 4) Stop Aquatic Hitchhikers!: www.protectyourwaters.net

61
Figure 43. An aquatic invasive prevention sign for public access sites.
Figure 44. An aquatic invasive prevention sign for public access sites.

62
Figure 45. A public boat washing station for boat access sites. Zebra Mussels
Zebra Mussels (Dreissena polymorpha; Figure 46) were first discovered in Lake St. Clair in 1988 and likely arrived in ballast water or on shipping vessels from Europe (McMahon 1996). They are easily transferred to other lakes because they inherit a larval (nearly microscopic) stage where they can easily avoid detection. The mussels then grow into the adult (shelled) form and attach to substrates (i.e. boats, rafts, docks, pipes, aquatic plants, and lake bottom sediments) with the use of byssal threads. The fecundity (reproductive rate) of female Zebra Mussels is high, with as many as 40,000 eggs laid per reproductive cycle and up to 1,000,000 in a single spawning season (Mackie and Schlosser 1996). Although the mussels only live 2-3 years, they are capable of great harm to aquatic environments. In particular, they have shown selective grazing capabilities by feeding on the preferred zooplankton food source (green algae) and expulsion of the non-preferred blue green algae (cyanobacteria). Additionally, they may decrease the abundance of beneficial diatoms in aquatic ecosystems (Holland 1993). Such declines in favorable algae, can decrease zooplankton populations and ultimately the biomass of planktivorous fish populations. Zebra Mussels are viewed by some as beneficial to lakes due to their filtration capabilities and subsequent contributions to increased water clarity. However, such water clarity may allow other photosynthetic aquatic plants to grow to nuisance levels (Skubinna et al. 1995). The recommended prevention protocols for introduction of zebra mussels includes steam-washing all boats, boat trailers, jet-skis, and floaters prior to placing them into Lake of the Woods. Fishing poles, lures, and other equipment used in other lakes (and especially the Great Lakes) should also be thoroughly steam-washed before use in Lake of the Woods. Additionally, all solid construction materials (if recycled from other lakes) must also be steam-washed. Boat transom wells must always be steam-washed and emptied prior to entry into the lake.

63
Excessive waterfowl should also be discouraged from the lake since they are a natural transportation vector of the microscopic zebra mussel larvae or mature adults. Figure 46. Zebra Mussels (Photo courtesy of USGS). Invasive Aquatic Plants In addition to Eurasian Watermilfoil (M. spicatum), many other invasive aquatic plant species have been introduced into waters of the North Temperate Zone. The majority of exotic aquatic plants do not depend on high water column nutrients for growth, as they are well-adapted to using sunlight and minimal nutrients for successful growth but excess nutrients often result in exacerbated growth. These species have similar detrimental impacts to lakes in that they decrease the quantity and abundance of native aquatic plants and associated macroinvertebrates and consequently alter the lake fishery. Such species include Hydrilla verticillata (Figure 47) and Trapa natans (Water Chestnut; Figure 48). Hydrilla was introduced to waters of the United States from Asia in 1960 (Blackburn et al. 1969) and is a highly problematic submersed, rooted, aquatic plant in tropical waters. Many years ago, Hydrilla was found in Lake Manitou (Indiana, USA) and the lake public access sites were immediately quarantined in an effort to eradicate it. Hydrilla retains many physiologically distinct reproductive strategies which allow it to colonize vast areas of water and to considerable depths, including fragmentation, tuber and turion formation, and seed production. Currently, the methods of control for Hydrilla include the use of chemical herbicides, rigorous mechanical harvesting, and Grass Carp (Ctenopharyngodon idella Val.), with some biological controls currently being researched. Water Chestnut (Trapa natans) is a non-native, annual, submersed, rooted aquatic plant that was introduced into the United States in the 1870’s yet may be found primarily in the northeastern states. The stems of this aquatic plant can reach lengths of 12-15 feet, while the floating leaves form a rosette on the lake surface.

64
Seeds are produced in July and are extremely thick and hardy and may last for up to 12 years in the lake sediment. If stepped on, the seed pods may even cause deep puncture wounds to those who recreate on the lakes. Methods of control involve the use of mechanical removal and chemical herbicides. Biological controls are not yet available for the control of this aquatic plant.
Figure 47. Hydrilla from a Florida lake (RLS, 2012).

65
Figure 48. Water Chestnut from a northeastern lake (RLS, 2008).
5.1.2 Aquatic Herbicides and Applications The use of aquatic chemical herbicides is regulated by the Indiana Department of Natural Resources and requires a permit. Aquatic herbicides are generally applied via an airboat or skiff equipped with mixing tanks and drop hoses (Figure 49). The permit contains a list of approved herbicides for a particular body of water, as well as dosage rates, treatment areas, and water use restrictions. Contact and systemic aquatic herbicides are the two primary categories used in aquatic systems. Contact herbicides such as diquat, flumioxazin, and hydrothol cause damage to leaf and stem structures; whereas systemic herbicides are assimilated by the plant roots and are lethal to the entire plant. Wherever possible, it is preferred to use a systemic herbicide for longer-lasting aquatic plant control of invasives. In Lake of the Woods, the use of contact herbicides (such as diquat and flumioxazin) would be recommended only for nuisance submersed native aquatic plant growth. Systemic herbicides such as 2, 4-D and triclopyr are the two primary systemic herbicides used to treat milfoil that occurs in a scattered distribution such as that noted in Lake of the Woods. Fluridone (trade name, SONAR®) is a systemic whole-lake herbicide treatment that is applied to the entire lake volume in the spring and is used for extensive infestations. The objective of a fluridone treatment is to selectively control the growth of milfoil in order to allow other native aquatic plants to germinate and create a more diverse aquatic plant community. Due to the low amount of milfoil in Lake of the Woods relative to the lake size, the use of fluridone is not recommended at this time. Hybridized Eurasian Watermilfoil occupied many areas of the lake which are amenable to spot-treat with a localized systemic herbicide. Recommended herbicides for this distribution include liquid or granular triclopyr nearshore and possibly granular 2,4-D in offshore areas.

66
Figure 49. A boat used to apply aquatic herbicides in inland lakes (RLS, 2018).
A history of the aquatic plant herbicide management for Lake of the Woods can be seen below in Table 14. Not all data was available to RLS and thus some cells within the data table are incomplete.

67
Table 14. Aquatic herbicide treatment history for Lake of the Woods (2005-2018). Note: Not all data was available to RLS and thus some cells have incomplete data.
Herbicide Treatment Year Area Treated Treatment Cost
2005 Whole lake $30,000
2006 0 0
2007 18 acres $11,880
2008 36 acres $13,320
2009 24 acres $35,000
2010 N/A $10,800
2011 16 acres $10,339.92
2012 N/A $7,769
2013 Whole lake $40,000
2014 0 0
2015 N/A $15,500
2016 30 acres $29,790
2017 38.13 acres $12,400
2018 50 acres $23,900

68
5.1.3 Mechanical Harvesting Mechanical harvesting involves the physical removal of nuisance aquatic vegetation with the use of a mechanical harvesting machine (Figure 50). The mechanical harvester collects numerous loads of aquatic plants as they are cut near the lake bottom. The plants are off-loaded onto a conveyor and then into a dump truck. Harvested plants are then taken to an offsite landfill or farm where they can be used as fertilizer. Mechanical harvesting is preferred over chemical herbicides when primarily native aquatic plants exist, or when excessive amounts of plant biomass need to be removed. Mechanical harvesting is usually not recommended for the removal of Eurasian Watermilfoil since the plant may fragment when cut and re-grow on the lake bottom. Due to the threat of milfoil fragmentation, the use of mechanical harvesting for the removal of the milfoil in Lake of the Woods is not recommended. Once the milfoil has been successfully reduced with herbicides, then harvesting could be used to remove dense native aquatic vegetation if that should occur.
Figure 50. A mechanical harvester used to remove aquatic plants (RLS, 2018).
5.1.4 Benthic Barriers and Nearshore Management Methods
The use of benthic barrier mats (Figure 51) or Weed Rollers (Figure 52) have been used to reduce weed growth in small areas such as in beach areas and around docks. The benthic mats are placed on the lake bottom in early spring prior to the germination of aquatic vegetation. They act to reduce germination of all aquatic plants and lead to a local area free of most aquatic vegetation. Benthic barriers may come in various sizes between 100-400 feet in length.

69
They are anchored to the lake bottom to avoid becoming a navigation hazard. The cost of the barriers varies among vendors but can range from $100-$1,000 per mat. Benthic barrier mats can be purchased online at: www.lakemat.com or www.lakebottomblanket.com. The efficacy of benthic barrier mats has been studied by Laitala et al. (2012) who report a minimum of 75% reduction in invasive milfoil in the treatment areas. Lastly, benthic barrier mats should not be placed in areas where fishery spawning habitat is present and/or spawning activity is occurring.
Weed Rollers are electrical devices which utilize a rolling arm that rolls along the lake bottom in small areas (usually not more than 50 feet) and pulverizes the lake bottom to reduce germination of any aquatic vegetation in that area. They can be purchased online at: www.crary.com/marine or at: www.lakegroomer.net.
Both methods are useful in recreational lakes such as Lake of the Woods and work best in beach areas and near docks to reduce nuisance aquatic vegetation growth. These technologies could be used in beach areas on the main lake or in the canals if the bottom substrate is consolidated (firm).
5.1.5 Diver Assisted Suction Harvesting (DASH) Suction harvesting via a Diver Assisted Suction Harvesting (DASH) boat (Figure 53) involves hand removal of individual plants by a SCUBA diver in selected areas of lake bottom with the use of a hand-operated suction hose. Samples are dewatered on land or removed via fabric bags to an offsite location. This method is generally recommended for small (less than 1 acre) spot removal of vegetation since it is costly on a large scale. It may be used in the future to remove small remaining areas of milfoil after large-scale initial treatments have been successful or is useful on dense lily pad growth.
Figure 51. A Benthic Barrier. Photo courtesy of Cornell Cooperative Extension.
Figure 52. A Weed Roller.

70
Furthermore, this activity may cause re-suspension of sediments (Nayar et al., 2007) which may lead to increased turbidity and reduced clarity of the water. This method is a sustainable option for removal of plant beds in beach areas and areas where herbicide treatments may be restricted.
Figure 53. A DASH boat used for aquatic plant removal (RLS, 2018). 5.2 Lake of the Woods Water Quality Improvements
In addition to lake improvement methods that improve the aquatic plant communities (both invasive and nuisance native), there are methods to improve the water quality within the lake basin. These methods are often large in scale and costly but are highly effective at increasing water clarity, reducing algae, increasing dissolved oxygen, reducing muck, and allowing for enhanced recreational activities.
5.2.1 Laminar Flow Aeration and Bioaugmentation Laminar flow aeration systems (Figure 54) are retrofitted to a particular site and account for variables such as water depth and volume, contours, water flow rates, and thickness and composition of lake sediment. The systems are designed to completely mix the surrounding waters and evenly distribute dissolved oxygen throughout the lake sediments for efficient microbial utilization.

71
A laminar flow aeration (LFA) system utilizes diffusers which are powered by onshore air compressors. The diffusers are connected via extensive self-sinking airlines which help to purge the lake sediment pore water of gases such as benthic carbon dioxide (CO2) and hydrogen sulfide (H2S). In addition to the placement of the diffuser units, the concomitant use of bacteria and enzymatic treatments to facilitate the microbial breakdown of organic sedimentary constituents is also used as a component of the treatment. Beutel (2006) found that lake oxygenation eliminates release of NH3+ from sediments through oxygenation of the sediment-water interface. Allen (2009) demonstrated that NH3+ oxidation in aerated sediments was significantly higher than that of control mesocosms with a relative mean of 2.6 ± 0.80 mg N g dry wt day-1 for aerated mesocosms and 0.48 ± 0.20 mg N g dry wt day-1 in controls. Although this is a relatively new area of research, recent case studies have shown promise on the positive impacts of laminar flow aeration systems on aquatic ecosystem management with respect to organic matter degradation and resultant increase in water depth, and rooted aquatic plant management in eutrophic ecosystems (Jermalowicz-Jones, 2010; 2011). Toetz (1981) found evidence of a decline in Microcystis algae (a toxin-producing blue-green algae) in Arbuckle Lake in Oklahoma. Other studies (Weiss and Breedlove, 1973; Malueg et al., 1973) have also shown declines in overall algal biomass. Conversely, a study by Engstrom and Wright (2002) found no significant differences between aerated and non-aerated lakes with respect to reduction in organic sediments. This study was however limited to one sediment core per lake and given the high degree of heterogeneous sediments in inland lakes may not have accurately represented the conditions present throughout much of the lake bottom. The philosophy and science behind the laminar flow aeration system is to reduce the organic matter layer in the sediment so that a significant amount of nutrient is removed from the sediments and excessive sediments are reduced to yield a greater water depth.
Benefits and Limitations of Laminar Flow Aeration In addition to the reduction in toxic blue-green algae (such as Microcystis sp.) as described by Toetz (1981), aeration and bioaugmentation in combination have been shown to exhibit other benefits for the improvements of water bodies. Laing (1978) showed that a range of 49-82 cm of organic sediment was removed annually in a study of nine lakes which received aeration and bioaugmentation. It was further concluded that this sediment reduction was not due to re-distribution of sediments since samples were collected outside of the aeration “crater” that is usually formed. A study by Turcotte et al. (1988) analyzed the impacts of bioaugmentation on the growth of Eurasian Watermilfoil and found that during two four-month studies, the growth and re-generation of this plant was reduced significantly with little change in external nutrient loading. Currently, it is unknown whether the reduction of organic matter for rooting medium or the availability of nutrients for sustained growth is the critical growth limitation factor and these possibilities are being researched. A reduction of Eurasian Watermilfoil is desirable for protection of native plant biodiversity, recreation, water quality, and reduction of nutrients such as nitrogen and phosphorus upon decay (Ogwada et al., 1984).

72
Furthermore, bacteria are the major factor in the degradation of organic matter in sediments (Fenchel and Blackburn, 1979) so the concomitant addition of microbes to lake sediments will accelerate that process. A reduction in sediment organic matter would likely decrease Eurasian Watermilfoil growth as well as increase water depth and reduce the toxicity of ammonia nitrogen to overlying waters. A study by Verma and Dixit (2006) evaluated aeration systems in Lower Lake, Bhopal, India, and found that the aeration increased overall dissolved oxygen, and reduced biochemical oxygen demand (BOD), chemical oxygen demand (COD), and total coliform counts. The LFA system has some limitations including the inability to break down mineral sediments, the requirement of a constant Phase I electrical energy source to power the units, and possible unpredictable response by various species of rooted aquatic plants (currently being researched by RLS). Due to the high amount of sand and mineral sediments in Lake of the Woods, the reduction of sediment muck or organics is unlikely. However, the deep basins of Lake of the Woods lack adequate dissolved oxygen during stratified periods and this would be greatly improved with LFA. Aeration and bio augmentation have also been successfully used to reduce nuisance algal blooms, increase water clarity, and reduce water column nutrients and sedimentary ammonia nitrogen which is a primary growth medium for milfoil and other rooted aquatic plants (RLS, 2009-2018).
Figure 54. Diagram of laminar flow aeration.

73
5.2.2 Nutrient Inactivation There are a few products on the lake improvement market that aim to reduce phosphorus in the water column and the release of phosphorus from a lake bottom. Such products are usually applied as a slurry by a special dose-metered vessel to the water column or just above the lake bottom. Most of these formulas can be applied in aerobic (oxygenated) or anaerobic (oxygen-deficient) conditions. In lakes that lack ample dissolved oxygen at depth, this product may help prevent phosphorus release from the sediments. A few disadvantages include cost, inability to bind high concentrations of phosphorus especially in lakes that receive high external loads of phosphorus (i.e. lakes such as Lake of the Woods with a very large catchment of watershed), and the addition of an aluminum floc to the lake sediments which may impact benthic macroinvertebrate diversity and relative abundance (Pilgrim and Brezonik, 2005). Some formulas utilize a clay base with the P-inactivating lanthanum (Phoslock®) which may reduce sediment toxicity of alum. If this method is implemented, it is highly recommended that sampling the lake sediments for sediment pore water phosphorus concentrations be conducted to determine internal releases of phosphorus pre-alum and then monitoring post-alum implementation. Additionally, external phosphorus loads must be significantly reduced since these inputs would compromise phosphorus-inactivation formulas (Nürnberg, 2017). Some recent case studies (Brattebo et al., 2017) are demonstrating favorable results with alum application in hypereutrophic waters that are also experiencing high external nutrient loads. At this time, a lake mixing technology would be preferred over application of alum since a higher dissolved oxygen concentration is desired throughout the water column and on the lake bottom to reduce internal release of phosphorus and also decrease blue-green algal blooms and increase water clarity while improving the zooplankton and benthic macroinvertebrate biodiversity.
5.2.3 Dredging
Dredging is a lake management option used to remove accumulated lake sediments to increase accessibility for navigation and recreational activities. Dredging activities in the shallow canals of Lake of the Woods would be an option to remove sediments, but this would pose several challenges with disposal sites and not address sediment sources so that dredging activities would need to be implemented in future years as well. Dredging is subject to permitting by the U.S. Army Corps of Engineers (USACE), Indiana Department of Natural Resources, and possibly the Environmental Protection Agency if high metals or contaminants are found in required sediment samples prior to disposal. The two major types of dredging include hydraulic and mechanical. A mechanical dredge usually utilizes a backhoe and requires that the disposal site be adjacent to the lake (Figure 55).

74
In contrast, a hydraulic dredge removes sediments in an aqueous slurry and the wetted sediments are transported through a hose to a confined disposal facility (CDF). Selection of a particular dredging method and CDF should consider the environmental, economic, and technical aspects involved. The CDF must be chosen to maximize retention of solids and accommodate large quantities of water from the dewatering of sediments. It is imperative that hydraulic dredges have adequate pumping pressure which can be achieved by dredging in waters greater than 3 foot of depth. Dredge spoils cannot usually be emptied into wetland habitats; therefore, a large upland area is needed for lakes that are surrounded by wetland habitats. Furthermore, this activity may cause re-suspension of sediments (Nayar et al., 2007) which may lead to increased turbidity and reduced clarity of the water. In addition, proposed sediment for removal must be tested for metal contaminants before being stored in a CDF. Dredging is a very costly operation with an average dredging cost of $28-40 per cubic yard.
Figure 55. A mechanical dredge for sediment removal in inland waters.
5.2.4 Fishery Habitat Enhancement
Fish spawning habitat is very important for lakes. In addition to providing suitable habitat for spawning, lakes also benefit from the fish populations by controlling various types of phytoplankton (algae), zooplankton, and other fish species. Fish also add nutrients in the form of waste to the carbon, nitrogen, and phosphorus cycles for other plants and animals in the lake.

75
Habitat degradation around lakes has harmed fish populations. Pesticides, fertilizers, and soil from farm fields drain into lakes and rivers, killing aquatic insects, depleting dissolved oxygen, and smothering fish eggs. Leaves, grass, and fertilizer wash off urban and suburban lawns into sewers, then into lakes, where these excessive nutrients fuel massive algae blooms. The housing boom on fishing lakes is turning native lakeshore and shallow water vegetation into lawns, rocky riprap, and sand beaches. Native plants have been removed in many areas and helped sustain healthy fish populations. Within a few years, the water gets murkier from fertilizer runoff, and, lacking bulrushes and other emergent plants in shallows, fish have fewer places to hide and grow. It is important for landowners to realize how important aquatic and emergent lake vegetation can be to the lake ecology. To restore the natural features of lakeshores that provide fish habitat, a new approach replaces some or all lakeside lawns and beaches with native wildflowers, shrubs, grasses, and aquatic plants. A growing number of lakeshore owners are learning that restoring natural vegetation can cut maintenance costs, prevent unwanted pests such as Canada geese, attract butterflies and songbirds, and improve fish spawning habitat in shallow water. Preventing erosion and sedimentation around lakes is also important because excess sediment can smother fish eggs. Such a process as converting plowed land along the lake edge into grassy strips can filter runoff and stabilize banks. Vegetative plantings on steep banks can prevent erosion and excess nutrients from reaching the lake. Adding additional natural features such as boulders can also improve fish spawning habitat in a lake. In Minnesota’s Lake Winni, more than 4.5 miles of the lakeshore has been reinforced since 1989 and Walleye are now spawning in the improved habitat. In addition, altering water levels in marshy areas used by northern pike for spawning can create more favorable conditions for reproduction. Lake aeration can also improve fish populations. Every few winters, most or all fish in many shallow lakes die for lack of oxygen. When plants die, they decompose and use up dissolved oxygen needed by fish. Adding oxygen to the lake using an aeration system can help prevent winterkill. Fish spawning habitat in many shallow lakes has been destroyed by Carp and Black Bullhead. These fish root in the silty lake bottoms and stir up nutrient-laden sediment. The murky water blocks sunlight from reaching aquatic plants that stabilize the lake bottom and provide oxygen and habitat for game fish. Bluegill and Bass numbers have been shown to plummet while these fish species thrive. The sediment that carp and bullheads stir up is loaded with nutrients from surrounding farm fields. Nutrients and other contaminated runoff flow into lakes from distant farms, parking lots, streets, and lawns. The nutrients fuel blooms of algae, which, when they die, consume oxygen needed by fish and underwater insects.
A few specific fish species spawning habitat examples:
Numerous fish species utilize different types of habitat and substrate to spawn. Gosch et al. (2006) examined Bluegill spawning colonies in South Dakota. Habitat characteristics were measured at each nesting site and compared with those measured at 75 randomly selected sites. In Lake Cochrane, mean water depth of spawning colonies was 1.0 m.

76
Every Bluegill nest site contained gravel substrate, despite the availability of muck, sand and rock. Additionally, Bluegills selected nesting locations with relatively moderate dissolved oxygen levels. Lake Cochrane Bluegill nest sites consisted of shallow, gravel areas with short, low-density, live submergent Chara vegetation. Walleye generally spawn over rock, rubble, gravel and similar substrate in rivers or windswept shallows in water 1 to 6 feet deep, where current clears away fine sediment and will cleanse and aerate eggs. Male Walleye move into spawning areas in early spring when the water temperature may be only a few degrees above freezing while the larger females arrive later. Spawning culminates when water temperature ranges from 42 to 50 degrees. For Walleye, the success of spawning can vary greatly year to year depending on the weather. Rapidly warming water can cause eggs to hatch prematurely. Prolonged cool weather can delay and impair hatching. A cold snap after the hatch can suppress the production of micro crustaceans that Walleye fry eat. Largemouth Bass spawning activities begin when water temperatures reach 63° to 68°F. The male moves into shallow bays and flats and sweeps away debris from a circular area on a hard bottom. The male remains to guard the nest, the female heads for deeper water to recover. Northern Pike begin to spawn as soon as the ice begins to break up in the spring, in late March or early April. The fish migrate to their spawning areas late at night and the males will congregate there for a few days before spawning actually begins. Marshes with grasses, sedges, rushes or aquatic plants and flooded wetlands are prime spawning habitat for Northern Pike. Mature females move into flooded areas where the water is 12 or less inches deep. Due to predation by insects and other fish including the Northern Pike itself, the number of eggs and fry will be reduced over 99% in the months that follow spawning. The eggs hatch in 12 to 14 days, depending on water temperature, and the fry begin feeding on zooplankton when they are about 10 days old. Impacts to Fish Spawning from Invasive Species:
Lyons (1989) studied how the assemblage of small littoral-zone fishes that inhabits Lake Mendota, Wisconsin has changed since 1900. A diverse assemblage that included several environmentally sensitive species has been replaced by an assemblage dominated by a single species, the Brook Silverside, whose abundance fluctuates dramatically from year to year. Their decline was associated with the invasion and explosive increase in abundance of an exotic macrophyte, the Eurasian Watermilfoil (Myriophyllum spicatum), in the mid-1960's. Changes in the assemblage of small littoral-zone fishes in Lake Mendota indicate environmental degradation in the near shore area, and may have important implications for the entire fish community of the lake including fish spawning habitat availability. Lillie and Budd (1992) examined the distribution and architecture of Eurasian Watermilfoil in Fish Lake, Wisconsin. They showed that temporal changes in the architecture of milfoil during the growing season and differences in architecture within one macrophyte bed in Fish Lake were substantial and may have influenced spawning habitat use by fish and macroinvertebrates. Eiswerth et al. (2000) looked at the potential recreational impacts of increasing populations of Eurasian Watermilfoil. They determined that, unless the weed is controlled, significant

77
alterations of aquatic ecosystems including spawning habitat for native fish, with associated degradation of natural resources and economic damages to human uses of those resources, may occur. In contrast, Valley and Bremigan (2002) studied how changes in aquatic plant abundance or architecture, caused by invasion and/or removal of exotic plants, may affect age-0 Largemouth Bass growth and recruitment. They actually showed that selective removal of Eurasian Watermilfoil did not have a significant positive effect on age-0 Largemouth Bass growth. In this lake, factors influencing age-0 Bluegill availability to age-0 Largemouth Bass appear more related to size structure of Largemouth Bass and Bluegill populations than to plant cover, but plants still are needed to provide habitat and spawning cover. Impacts from Natural Shoreline Degradation:
Lakeshore development can also play an important role in how vegetation abundance can impact fish spawning habitat. Vegetation abundance along undeveloped and developed shorelines of Minnesota lakes was compared to test the hypothesis that development has not altered the abundance of emergent and floating-leaf vegetation (Radomski and Goeman 2001). They found that vegetative cover in littoral areas adjacent to developed shores was less abundant than along undeveloped shorelines. On average, there was a 66% reduction in vegetation coverage with development. Significant correlations were also detected between occurrence of emergent and floating-leaved plant species and relative biomass and mean size of Northern Pike, Bluegill, and Pumpkinseed. Margenau et al. (2008) showed that a loss of near shore habitat has continued at an increased rate as more lake homes are built and shorelines graded, and altered with riprap, sand blankets, or sea walls. Ultimately, suitability for fish spawning habitat had decreased.
5.3 Lake of the Woods Watershed Management
Protection of the lake watershed is imperative for long-term improvement of water quality in Lake of the Woods. There are many practices that individual riparians as well as the local municipalities can adopt to protect the land from erosion and flooding and reduce nutrient loading to the lake. Since the nutrient concentrations in Lake of the Woods are so high, any reduction in nutrients is beneficial. The following sections offer practical Best Management Practices (BMP’s) commonly followed to protect water quality.
5.3.1 Lake of the Woods Erosion and Sediment Control In addition to the proposed treatment of Eurasian Watermilfoil and other invasives in Lake of the Woods, it is recommended that BMP’s be implemented to improve the lake’s water quality. The guidebook, Lakescaping for Wildlife and Water Quality (Henderson et al. 1998) provides the following guidelines:
1) Maintenance of brush cover on lands with steep slopes (those > 6%; see above soil table) 2) Development of a vegetation buffer zone 25-30 feet from the land-water interface with
approximately 60-80% of the shoreline bordered with vegetation 3) Limiting boat traffic and boat size to reduce wave energy and thus erosion potential
78
4) Encouraging the growth of dense shrubs or emergent shoreline vegetation to control
erosion 5) Using only native genotype plants (those native to Lake of the Woods or the region)
around the lake since they are most likely to establish and thrive than those not acclimated to growing in the area soils. A local horticultural supply center would likely have a list of these species.
6) The construction of impervious surfaces (i.e. paved roads and walkways, houses) should be minimized and kept at least 100 feet from the lakefront shoreline to reduce surface runoff potential.
7) Any wetland areas around Lake of the Woods should be preserved to act as a filter of nutrients from the land and to provide valuable wildlife habitat.
8) The September 22, 2018 survey noted that many areas of the shoreline contained seawalls so placement of natural vegetation or tall emergent plants around the shoreline is encouraged. Erosion of soils into the water may lead to increased turbidity and nutrient loading to the lake. Seawalls should consist of rip-rap (stone, rock), rather than metal or concrete, due to the fact that rip-rap offers a more favorable habitat for lakeshore organisms, which are critical to the ecological balance of the lake ecosystem. Rip-rap should be installed in front of areas where metal seawalls are currently in use. The rip-rap should extend into the water to create a presence of microhabitats for enhanced biodiversity of the aquatic organisms within Lake of the Woods. The emergent aquatic plant, Scirpus sp. (Bulrushes) present around Lake of the Woods offers satisfactory stabilization of shoreline sediments and assists in the minimization of sediment release into the lake.
5.3.2 Lake of the Woods Nutrient Source Control Based on the high ratio of nitrogen to phosphorus (i.e. N: P ≥ 19), any additional inputs of phosphorus to the lake are likely to create additional algal and aquatic plant growth. Accordingly, RLS recommends the following procedures to protect the water quality of Lake of the Woods:
1) Avoid the use of lawn fertilizers that contain phosphorus (P). P is the main nutrient required for aquatic plant and algae growth, and plants grow in excess when P is abundant. When possible, water lawns with lake water that usually contains adequate P for successful lawn growth. If you must fertilize your lawn, assure that the middle number on the bag of fertilizer reads “0” to denote the absence of P. If possible, also use low N in the fertilizer or use lake water. Education of riparians on this issue is important as is understanding what they may use for fertilizers and where they are purchased.
2) Preserve riparian vegetation buffers around of the Woods (such as those that consist of
Cattails, Bulrushes), since they act as a filter to catch nutrients and pollutants that occur on land and may run off into the lake. As an additional bonus, Canadian geese (Branta canadensis) usually do not prefer lakefront lawns with dense riparian vegetation because they are concerned about the potential of hidden predators within the vegetation.
79
3) Do not burn leaves near the lake shoreline since the ash is a high source of P. The ash is
lightweight and may become airborne and land in the water eventually becoming dissolved and utilized by aquatic vegetation and algae.
4) Assure that all areas that drain into the lake from the surrounding land are vegetated and that no fertilizers are used in areas with saturated soils (see soil table above).
Lake of the Woods Drains/Tributaries There are 12 areas of water inflow that drain into Lake of the Woods with 6 major drains/tributaries that contribute the bulk of the water volume and nutrients to the lake. A map showing all areas of water influx to the lake is shown below in Figure 56. Each individual water source was assigned a separate color to show the distinct flowage of water to the lake from each drain series. The major drains include: 1.) A Private Drain, 2.) The Stephey Drain, 3.) The Martin Drain, 4.) The Seltenright Drain, 5.) The Bohmer Drain, and 6.) The Kuntz Drain. The major drains are displayed in Figures 57-62 and the outlet structure can be seen in Figure 63. Water quality data was collected at each of the 6 major drains and the outlet on September 22, 2018 by RLS and accompanied by individuals from the LOWPOA. The water quality parameters measured included physical parameters such as water temperature, dissolved oxygen, pH, conductivity, and total dissolved solids. In addition, chemical water quality parameters such as total and ortho-phosphorus (SRP), total kjeldahl and inorganic nitrogen, total suspended solids were also sampled and analyzed in a NELAC-certified laboratory. The methods of analysis and units recorded were the same as for the deep basin samples discussed earlier in this report. All of the drain water quality data can be seen in Tables 15-16 below. The outlet contained low concentrations of both nitrogen and phosphorus and thus is indicative that the nutrients entering the lake are staying in the lake (settling to the lake bottom). This has led to the occurrence of internal nutrient loading within the lake. The nitrogen and phosphorus concentrations in the Kuntz and Bohmer Drains were below the eutrophic threshold and favorable. The Private Drain had the highest nutrient concentrations followed by the Martin Drain, Stephey Drain, and Seltenright Drain. This should assist the LOWPOA with prioritizing drain improvements relative to nutrient reduction methods. Overall, the mean TP in all of the drains was 0.611 mg/L. This is high when compared to the mean TP in the lake deep basins which was 0.139 mg/L, which means that most of the TP is remaining in the lake. Of deeper concern is the amount of bioavailable TP (SRP) in the drains with a mean of 0.101 mg/L whereas the mean concentration in the lake was 0.108 mg/L. This means that nearly all of the bioavailable TP entering the lake is remaining in the lake for use by algae and biota. The mean TKN in the drains was 4.9 mg/L relative to a mean of 3.0 mg/L in the lake. This means that the drains are a constant stable source of nitrogen to the lake and will enrich the lake with TKN over time as the incoming concentration is higher than that in the lake. The mean TIN in the drains was 1.74 mg/L relative

80
to a mean TIN concentration of 2.1 mg/L in the lake which are similar values. The majority of this TIN was present in the ammonia form which exacerbates blue-green algae and milfoil growth. The mean TSS in the drains was 217 mg/L relative to the lake mean TSS concentration of <10 mg/L which is favorable. This means that the suspended solids are settling into the lake bottom since the TSS concentration at the outlet was also <10 mg/L. The Private Drain and Martin Drain had excessively high concentrations of TSS. The mean conductivity in the drains was 660 mS/cm relative to the mean conductivity in the lake at 466 mS/cm. It is not uncommon for drains to have higher conductivity values than the lake. The mean DO in the drains was 8.5 mg/L relative to the mean in the lake of 2.8 mg/L. This is expected since the drains are flowing and flowing waters are usually cooler and hold more oxygen. It does however highlight the issue of oxygen depletion in the mid to lower depths of the lake.

81
Figure 56. Areas of water inflow into Lake of the Woods (RLS, 2018).

82
Figure 57. Private Drain on Lake of the Woods (RLS, 2018). Figure 58. Stephey Drain on Lake of the Woods (RLS, 2018).

83
Figure 59. Martin Drain on Lake of the Woods (RLS, 2018). Figure 60. Seltenright Drain on Lake of the Woods (RLS, 2018).

84
Figure 61. Bohmer Drain on Lake of the Woods (RLS, 2018). Figure 62. Kuntz Drain on Lake of the Woods (RLS, 2018).

85
Figure 63. Lake of the Woods outlet (RLS, 2018). Table 15. Physical water quality parameters for the major drains flowing into Lake of the Woods (September 22, 2018).
Drain Water Temp (°C)
pH (S.U.)
Conduct (mS/cm)
DO (mg/L)
TDS (mg/L)
Private 19.5 8.2 555 10.0 354
Stephey 16.0 7.9 720 7.8 461
Martin 18.5 7.7 788 5.5 504
Seltenright 16.8 7.8 732 6.2 469
Bohmer 16.5 7.5 784 8.8 502
Kuntz 17.5 8.4 680 9.7 435
Outlet 20.9 9.1 358 11.6 229

86
Table 16. Chemical water quality parameters for the major drains flowing into Lake of the Woods (September 22, 2018).
Drain TP (mg/L)
SRP (mg/L)
TKN (mg/L)
TIN (mg/L)
TSS (mg/L)
Private 2.1 0.071 20 0.360 990
Stephey 0.370 0.250 1.5 0.510 10
Martin 1.0 0.150 4.9 0.170 270
Seltenright 0.160 0.110 1.4 1.8 <10
Bohmer 0.021 0.011 1.0 1.3 <10
Kuntz 0.019 0.015 0.6 6.3 <10
Outlet 0.022 <0.010 0.9 0.023 <10
Lake of the Woods Canals There are a total of 7 canals (including series) connected to Lake of the Woods. Canals generally are man-made, shallow, and prone to sediment/muck accumulation and excessive weed and algae growth (Figures 64 and 65). There were two canals near the southwest region of the lake that were impaired with excessive sedimentation and filamentous algae growth. In very shallow canals, sediment accumulation from the land can contribute to a variety of issues including reduced water depth, reduced dissolved oxygen and fish kills, excessive accumulation of filamentous algae on top of the sediment, and impaired or impossible navigation and recreation. As previously mentioned in the dredging section of this report, these canals could be spot-dredged with a mechanical dredge to remove excess sediment with a proper permit. Afterwards, an aeration system with bottom-placed diffusers along with bioaugmentation will help to reduce accumulation of incoming sediment loads through the microbial breakdown of the muck. A reduction in the stagnation of the water in the canals through aeration will also result in reduced accumulation of filamentous algae. Repeated algae treatments with copper sulfate

87
Figure 64. Excessive filamentous algae growth on a canal in Lake of the Woods (September 22, 2018). Figure 65. Excessive filamentous algae growth and sedimentation on a canal in Lake of the Woods (September 22, 2018).

88
6.0 LAKE OF THE WOODS PROJECT CONCLUSIONS & RECOMMENDATIONS
The urgent control of the invasive submersed Hybrid Eurasian Watermilfoil and the invasive emergent Purple Loosestrife in and around Lake of the Woods is essential for the long-term preservation of the favorable (non-nuisance) native aquatic plant communities in the lake. The use of systemic aquatic herbicides for species-specific control of these plants is preferred over other methods at this time for reasons described above with each method. Mechanical harvesting could be used in future years once the milfoil is controlled and not a threat to fragmentation and if nuisance native vegetation becomes dense and impedes navigation and recreation. Additional improvements would include the assurance that all areas around the lake are vegetated at all times so that runoff from ponded soils into the lake water is reduced. If the lake water becomes turbid during a rain event all efforts to determine the entry point of the turbidity should be executed to reduce sediment loading to the lake. Furthermore, a professional limnologist/aquatic botanist should perform regular GPS-guided whole-lake surveys each spring and late summer/early fall to monitor the growth and distribution of all invasives and nuisance aquatic vegetation growth prior to and after treatments to determine treatment efficacy. Furthermore, continuous monitoring of the lake for potential influxes of other exotic aquatic plant genera (i.e. Hydrilla) that could also significantly disrupt the ecological stability of Lake of the Woods is critical. The lake manager should oversee all management activities and would be responsible for the creation of aquatic plant management survey maps, direction of the harvester or herbicide applicator to target-specific areas of aquatic vegetation for removal, implementation of watershed best management practices, administrative duties such as the processing of contractor invoices, and lake management education. A complete list of recommended lake improvement options for this proposed lake management plan can be found in Table 17 below. It is important to coordinate these methods with objectives so that baseline conditions can be compared to post-treatment/management conditions once the methods have been implemented.

89
Table 17. List of Lake of the Woods proposed improvement methods with primary and secondary goals and locations for implementation.
Proposed Improvement Method
Primary Goal
Secondary Goal Where to Implement
Systemic herbicide spot-treatments for invasives
Reduce EWM and other invasive in lake
Reduce long-term use of herbicides in lake
Entire Lake where invasives present, including canals
Whole-lake laminar flow aeration system
Increase DO, reduce blue-green algae, increase water clarity
Reduce nutrients in the water column and internal loading of TP
Entire lake basin (include canals)
Drain Filters for Private, Martin, Stephey, and Seltenright Drains
To reduce nutrients and solids to lake
To catch nutrients from watershed without cost-ineffective drain diversions
The four impaired listed drains
Bi-annual water quality monitoring of lake and drains
Monitor efficacy of BMP’s implemented, including the LFA system and drain filters
Compare baseline water quality and drain data to modern data to view trends for data-driven management
Both the lake and all drains
Annual lake surveys pre and post-treatment
To determine efficacy of herbicide treatments on invasives
To determine ability of native aquatic vegetation biodiversity to recover post-management implementation
Entire lake, including canals
Riparian/Community Education
To raise awareness of lake/drain issues and empower all to participate in lake protection
Long-term sustainability requires ongoing awareness and action
Entire lake community and those who frequent the lake; may also include relevant IDNR and other stakeholders

90
6.1 Cost Estimates for Lake of the Woods Improvements
The proposed lake improvement and management program for Lake of the Woods is recommended to begin as soon as possible. A breakdown of estimated costs associated with the various proposed treatments in Lake of the Woods is presented in Table 18. It should be noted that proposed costs are estimates and may change in response to changes in environmental conditions (i.e. increases in aquatic plant growth or distribution, or changes in herbicide costs).
Table 18. Lake of the Woods proposed lake improvement program costs.
Proposed Lake of the Woods
Improvement Item
Year 1 Costs Years 2-5 (Annual)
Costs4
Systemic herbicides for Hybrid
Watermilfoil1 and invasives
Whole-lake LFA System2 (includes
installation for first year; annual lease
cost and electrical for each year as
well as bioaugmentation and
maintenance)
Drain filters3 for Private, Martin,
Stephey, and Seltenright Drains;
Note: maintenance for future years
$22,500
$175,000
$30,000
$20,000
$145,000
$8,000
Professional services (limnologist
management of lake, oversight,
processing, education)4
$28,000
$28,500
Contingency5 $25,550 $20,150
Total Annual Estimated Cost $281,050 $221,650

91
1 Herbicide treatment scope may change annually due to changes in the distribution and/or abundance of aquatic plants. 2 Whole lake LFA system is an estimate and will likely change with vendor proposals/costs. This is a rough number based on experiences with similar lakes. 3Drain filters include individual, retrofitted biologically-activated filters for nutrient and solid reductions. In future years, maintenance of the filters will be required. 4 Professional services includes comprehensive management of the lake with two annual GPS-guided, aquatic vegetation surveys, pre and post-treatment surveys for aquatic plant control methods, oversight and management of the aquatic plant control program and all management activities, all water quality monitoring and evaluation of all improvement methods, processing of all invoices from contractors and others billing for services related to the improvement program, education of local riparians through the development of a high-quality, scientific newsletter (can be coordinated with existing lake newsletter), and attendance at up to three regularly scheduled annual board meetings. 5 Contingency is 10% of the total project cost, to assure that extra funds are available for unexpected expenses. Note: Contingency may be advised and/or needed for future treatment years. Contingency funds may also be used for other water quality improvements and watershed management.
92
7.0 SCIENTIFIC REFERENCES
Aiken, S.G., P.R. Newroth, and I. Wile. 1979. The biology of Canadian weeds. 34. Myriophyllum spicatum L. Canadian Journal of Aquatic Plant Science 59: 201-215.
Allen, J. 2009. Ammonia oxidation potential and microbial diversity in sediments from experimental bench-scale oxygen-activated nitrification wetlands. MS thesis, Washington State University, Department of civil and Environmental Engineering.
Barbiero, R., R.E. Carlson, G.D. Cooke, and A.W. Beals. 1988. The effects of a continuous application of aluminum sulfate on lotic benthic macroinvertebrates. Lake and Reservoir Management 4(2):63-72.
Blackburn, R.D., L.W. Weldon, R.R. Yeo, and T.M. Taylor. 1969. Identification and distribution of certain similar-appearing submersed aquatic weeds in Florida. Hyacinth Control Journal 8:17-23.
Beutel, M.W. 2006. Inhibition of ammonia release from anoxic profundel sediments in lakes using hypolimnetic oxygenation. Ecological Engineering 28(3): 271-279.
Couch, R., and E. Nelson 1985. Myriophyllum spicatum in North America. Pp. 8-18. In: Proc. First Int. Symp. On Watermilfoil (M. spicatum) and related Haloragaceae species. July 23-24, 1985. Vancouver, BC, Canada. Aquatic Plant Management Society, Inc.
DJ Case and Associates. 2005. Lake of the Woods, Marshall County, Indiana Watershed Management Plan. 132 pp.
Eiswerth, M.E., S.G. Donaldson, and W.S. Johnson. 2000. Potential environmental impacts and economic damages of Eurasian Watermilfoil (M. spicatum) in Western Nevada and Northeastern California. Weed Technology 14(3):511-518.
Engstrom, D.R., and D.I. Wright. 2002. Sedimentological effects of aeration-induced lake circulation. Lake and Reservoir Management 18(3):201-214.
Fenchel, T., and T.H. Blackburn. 1979. Bacteria and mineral cycling. Academic. Gosch, N. J. C., Phelps, Q. E. and D.W. Willis. 2006. Habitat characteristics at bluegill spawning
colonies in a South Dakota glacial lake. Ecology of Freshwater Fish, 15: 464–469. doi: 10.1111/j.1600-0633.2006.00178.x.
Halstead, J.M., J. Michaud, and S, Hallas-Burt. 2003. Hedonic analysis of effects of a non-native invader (Myriophyllum heterophyllum) on New Hampshire (USA) lakefront properties. Environmental Management 30 (3): 391-398.
Henderson, C.L., C. Dindorf, and F. Rozumalski. 1998. Lakescaping for Wildlife and Water Quality. Minnesota Department of Natural Resources, 176 pgs.
Herrick, B.M., and Wolf, A.T. 2005. Invasive plant species in diked vs. undiked Great Lakes wetlands. Journal of Great Lakes Research., Internat. Assoc. Great. Lakes. Res. 31(3): 277-287.
Holland, R.E. 1993. Changes in planktonic diatoms and water transparency in Hatchery Bay, Bass Island Area, Western Lake Erie since the establishment of the zebra mussel, Journal of Great Lakes Research 19:617-624.
Jermalowicz-Jones, J.L. 2009-2018. Evaluation studies of laminar flow aeration efficacy on various water quality parameters in Michigan inland lakes. Unpublished data.
93
Laing, R.L. 1978. Pond/Lake Management organic waste removal through multiple inversion. In house report. Clean-Flo Lab, Inc.
Laitala, K.L., T.S. Prather, D. Thill, and B. Kennedy. 2012. Efficacy of benthic barriers as a control measure for Eurasian Watermilfoil (Myriophyllum spicatum). Invasive Plant Science 5(2):170-177.
Lenat, D.R. and M.T. Barbour. Using benthic macroinvertebrate community structure for rapid, cost-effective, water quality monitoring: rapid bioassessment. Biological monitoring of aquatic systems. Lewis Publishers, Boca Raton, Florida (1994): 187-215.
Lillie, R.A., and J. Budd. 1992. Habitat architecture of Myriophyllum spicatum L. as an Index to habitat quality for fish and macroinvertebrates. Journal of Freshwater Ecology 7(2): 113-125.
Lyons, J. 1989. Changes in the abundance of small littoral-zone fishes in Lake Mendota, Wisconsin. Canadian Journal of Zoology 67:2910-2916, 10.1139/z89-412
Mackie, G.L., and D.W. Schloesser. 1996. Comparative biology of Zebra Mussels in Europe and North America: An Integrative and Comparative Biology 36(3):244-258.
Madsen, J.D., J.W. Sutherland, J.A. Bloomfield, L.W. Eichler, and C.W. Boylen. 1991. The decline of native vegetation under dense Eurasian watermilfoil canopies, Journal of Aquatic Plant Management 29, 94-99.
Malueg, K., J. Tilstra, D. Schults, and C. Powers. 1973. Effect of induced aeration upon stratification and eutrophication processes in an Oregon farm pond. Geophysical Monograph Series 17: 578-587. American Geophysical Union. Washington DC.
Margenau, T.L., AveLallemant, S.P., Giehtbrock, D., and S. Schram. 2008. Ecology and management of northern pike in Wisconsin. Hydrobiologia 601(1):111-123.
McMahon, R.F., and C.J. Williams. 1986. A reassessment of growth rate, life span, life cycles, and population dynamics in a natural population dynamics in a natural population and field caged individuals of Corbicula fluminea (Müller) (Bivalvia: Corbicula). Am. Malacol. Bull. Spec. ed. No. 2:151-166.
Merritt, R., W. Cummins, and M.B. Berg. 2008. An introduction to the aquatic insects of North America. Kendall/Hunt Publishing Co. 1158 pgs.
Nayar, S., DJ Miller, A. Hunt, BP Goh, and LM Chou. 2007. Environmental effects of dredging on sediment nutrients, carbon, and granulometry in a tropical estuary. Environmental Monitoring and Assessment 127(1-3):1-13.
Newroth, P.R. 1985. A review of Eurasian watermilfoil impacts and management in British Columbia. Pp. 139-153. In: Proc. First Int. Symp. On watermilfoil (M. spicatum) and related Haloragaceae species. July 23-24, 1985. Vancouver, BC, Canada. Aquatic Plant Management Society, Inc.
Nürnberg, G. 2017. Attempted management of cyanobacteria by Phoslock (lanthanum-modified) clay in Canadian Lakes: Water quality results and predictions. Lake and Reservoir Management 33:163-170.
Ogwada, R.A., K.R. Reddy, and D.A. Graetz. 1984. Effects of aeration and temperature on nutrient regeneration from selected aquatic macrophytes. Journal of Environmental Quality 13(2):239-243.

94
Parsons, J.K., and R.A. Matthews. 1995. Analysis of the camps between macroinvertebrates and macrophytes in a freshwater pond. Northwest Science 69: 265-275.
Pilgrim, K.M., and P.L. Brezonik, 2005. Evaluation of the potential adverse effects of lake inflow treatment with alum. Lake and Reservoir Management 21(1):77-87.
Price, J.D., and C.C. Long. 2010. Lake of the Woods, Marshall County, Indiana 2008-2009 walleye evaluations. Indiana Department of Fish and Wildlife.
Radomski, P. and T. J. Goeman. 2001. Consequences of human lakeshore development on emergent and floating-leaf vegetation abundance. North American Journal of Fisheries Management 21(1):46-61.
Reed, C.G. 1977. History and disturbance of Eurasian milfoil in the United States and Canada. Phytologia 36: 417-436.
Rinehart, K.L., M. Namikoshi, and B. W. Choi. 1994. Structure and biosynthesis of toxins from blue-green algae (cyanobacteria). Journal of Applied Phycology 6: 159-176.
Skelton, 1997. Lake of the Woods tributary macroinvertebrate study. Biology and Environmental Science Department. St. Norbert College. 19 pp.
Skubinna, J.P., T.G. Coon, and T.R. Batterson. 1995. Increased abundance and depth of submersed macrophytes in response to decreased turbidity in Saginaw Bay, Michigan. Journal of Great Lakes Research 21(4): 476-488.
Stewart, T.W. and J.M. Haynes. 1994. Benthic macroinvertebrate communities of southwestern Lake Ontario following invasion of Dreissena. Journal of Great Lakes Research 20(2): 479-493.
Stewart, P.M., Butcher, J.T. and T.O. Swinford. 2000. Land use, habitat, and water quality effects on macroinvertebrate communities in three watersheds of a Lake Michigan associated marsh system. Aquatic Ecosystem Health & Management: 3(1):179-189.
Toetz, D.W., 1981. Effects of whole lake mixing on water quality and phytoplankton. Water Research 15: 1205-1210.
Turcotte, A.C., C.V. Déry, and K.F. Ehrlich. 1988. Manipulation of microbial ecosystems to control the aquatic plant Eurasian Watermilfoil. Preprint paper. Département de Biologie, Université de Sherbrooke, Sherbrooke, Québec, CANADA J1K 2R1.
Valley, R., and M. T. Bremigan. 2002. Effects of selective removal of Eurasian watermilfoil on age-0 largemouth bass piscivory and growth in southern Michigan lakes. Journal of Aquatic Plant Management 40: 79-87.
Verma, N. and S. Dixit. 2006. Effectiveness of aeration units in improving water quality of Lower Lake, Bhopal, India. Asian Journal of Experimental Science 20(1): 87-95.
Weiss, C., and B. Breedlove. 1973. Water quality changes in an impoundment as a consequence of artificial destratification. 216 pp. Water Resources Research Institute. University of North Carolina. Raleigh.
Wetzel, R. G. 2001. Limnology: Lake and River Ecosystems. Third Edition. Academic Press, 1006 pgs.