Lajamanu remote towns jobs profile - nt.gov.au · Web viewThe 2017 jobs profile was developed...
68
Remote Towns Jobs Profiles LAJAMANU JOBS PROFILE LAJAMANU 1
Transcript of Lajamanu remote towns jobs profile - nt.gov.au · Web viewThe 2017 jobs profile was developed...
Remote Towns Jobs Profiles
LAJAMANU
JOBS PROFILE LAJAMANU1
© Northern Territory of Australia 2018
Preferred Reference: Department of Trade, Business and Innovation, 2017 Remote Towns Jobs Profiles, Northern Territory Government, June 2018, Darwin.
Disclaimer
The data in this publication were predominantly collected by conducting a face-to-face survey of businesses within town boundaries during mid-2017. The collection methodology was created in accordance with Australian Bureau of Statistics data quality framework principles. Data in this publication are only reflective of those businesses reported on as operating in the town at the time of data collection (see table at the end of publication for list of businesses reported on).
To comply with privacy legislation or where appropriate, some data in this publication may have been adjusted and will not reflect the actual data reported by businesses. As a result of this, combined with certain data not being reported by some businesses, some components may not add to totals. Changes over time may also reflect business' change in propensity to report on certain data items rather than actual changes over time. Total figures have generally not been adjusted.
Caution is advised when interpreting the comparisons made to the earlier 2011 and 2014 publications as the businesses identified and reported on and the corresponding jobs may differ between publications.
Notes for each table and chart are alphabetically ordered and listed at the end of the publication.
Any use of this report for commercial purposes is not endorsed by the Department of Trade, Business and Innovation.
JOBS PROFILE LAJAMANU2

Contents
Lajamanu........................................................................................................................ 4Introduction.................................................................................................................... 5Summary........................................................................................................................ 6Jobs Overview................................................................................................................. 7Jobs by Aboriginal Status................................................................................................8Jobs by Sector: Private and Public................................................................................10Job Status: Permanent and Temporary.........................................................................16Job Vacancies............................................................................................................... 19Jobs by Industry............................................................................................................21Jobs by Occupation.......................................................................................................27Jobs by Industry by Occupation....................................................................................30Jobs by Gender.............................................................................................................32Jobs by Age...................................................................................................................37Vocational Education and Training...............................................................................42Population..................................................................................................................... 45Community Development Programme.........................................................................47Businesses....................................................................................................................48Notes............................................................................................................................ 49Abbreviations and Acronyms........................................................................................50
JOBS PROFILE LAJAMANU3

LajamanuLajamanu is located 640 kilometres south west of Katherine on the northern edge of the Tanami Desert and eastern side of Hooker Creek. Access to Lajamanu is via the Victoria Highway from Katherine, Buntine Highway and the Lajamanu/Tanami Road. Lajamanu is about a six hour drive from Katherine, with a population of 682 residents.
Source: Department of Trade, Business and Innovation
JOBS PROFILE LAJAMANU4

IntroductionThis jobs profile provides a snapshot of jobs and the characteristics of job holders in Lajamanu as at July 2017. It also outlines trends from the 2014 and 2011 surveys.This job profile is one of 28 profiles developed for remote towns in the Northern Territory. It is anticipated these and subsequent profiles will contribute to a robust evidence base to inform decision making in and relating to these remote Territory towns. This profile contains information collected by the Northern Territory Department of Trade, Business and Innovation from businesses operating within the town and is supplemented by other administrative data sets and information.Each profile provides up-to-date information that is intended to inform the planning and design of current and future government programs and as an evidence base to inform decision making relating to workforce development, enterprise and job opportunities.The data collection methodology and corresponding questionnaire were created in partnership with the Australian Bureau of Statistics (ABS) and in accordance with ABS data quality framework and survey principles.The surveys were predominantly conducted by the Department’s Small Business Champions and Workforce Training Coordinators, on a face-to-face basis with business representatives.The information collected and reported on represents a significant goodwill investment by those businesses and organisations that participated. Each business is listed at the end of this publication.
JOBS PROFILE LAJAMANU5

SummaryThe 2017 jobs profile was developed based on responses from 19 businesses operating within the Lajamanu town boundary, 2 less than in the 2014 survey. Of these, there were: 13 businesses from the private sector, accounting for 57 filled jobs or 55% of total
filled jobs 6 businesses from the public sector, accounting for 46 filled jobs or 45% of total
filled jobs 8 businesses participated in all three surveys (completed in 2011, 2014 and 2017).A total of 127 filled and vacant jobs in Lajamanu were reported, a decrease of 39 jobs from 2014.1 The 2017 profile highlights: there were 103 filled jobs of which:
o 66 jobs (64%) were filled by Aboriginal persons, a decrease of 58 jobs from 2014
o 37 jobs (36%) were filled by non-Aboriginal persons, a decrease of 4 jobs from 2014
o 40% of employed Aboriginal people are working in the private sectoro Aboriginal persons accounted for 64% of job holders in the town compared to
61% in 2014o Aboriginal females made up 58% of total Aboriginal filled jobs in the town
compared to 49% in 2014 there were 24 vacant jobs, of which:
o job vacancies as a percentage of jobs increased to 19% in 2017 from 7% in 2014
o job vacancies equate to 1 in 5 jobs.o 10 of the vacancies were in Clerical and Administrative Worker area
Education and Training was the largest industry employer in 2017 Public Administration and Safety had a decrease of 43 jobs between 2017 and
2014 training had an overall decrease in student numbers between 2016 and 2013, with
the largest decrease of 22 in Community Services, Health and Education General Education and Training had the largest increase in student numbers of 26 new training activity in 2016, Sales and Personal Service, was delivered for 7
students which was not delivered in 2013 and 2010.The overall population in Lajamanu decreased by 65 persons (9%) between 2006 and 2016 to 682 persons.In 2016, the working age population (15 years and over) in Lajamanu was an estimated 437 persons compared to 499 in 2006, a decrease of 12%.1 The number of filled jobs does not represent numbers of persons as a person may have several jobs or one job may
be shared by more than one person.JOBS PROFILE LAJAMANU
6

There were 0.3 jobs in Lajamanu per working age person compared to 0.4 jobs per working age person across the 28 remote towns in the Northern Territory.
JOBS PROFILE LAJAMANU7

Jobs OverviewTable 1: Count of filled jobs and vacancies, 2011, 2014 and 2017 (a)(b)
2011 2014 2017Change2011-2014
Change2014-2017
Total All Jobs 134 166 127 32 -39Vacancies 9 12 24 3 12Vacancies as % of Total All Jobs 6.7% 7.2% 18.9% 0.5 ppt 11.7 pptFilled Jobs 125 154 103 29 -51Full-time 84 88 60 4 -28Part-time 41 66 43 25 -23
Source: Department of Trade, Business and Innovation
Chart 1: Count of vacant jobs and filled jobs by full-time/part-time status, 2011, 2014 and 2017 (a)(b)
Source: Department of Trade, Business and Innovation
In 2017 in Lajamanu: there were a total of 103 filled jobs, a decrease of 51 jobs from 2014 and a
decrease of 22 jobs from 2011 of the 103 filled jobs in 2017:
o 60 were full-time jobs, a decrease of 28 jobs from 2014 and a decrease of 24 jobs from 2011
o 43 were part-time jobs, a decrease of 23 jobs from 2014 and an increase of 2 jobs from 2011
there were 24 total job vacancies in 2017, an increase of 12 vacancies from 2014 and an increase of 15 vacancies from 2011.
JOBS PROFILE LAJAMANU8

Jobs by Aboriginal StatusChart 2: Count of filled jobs by Aboriginal status, 2011, 2014 and 2017 (a)(c)
Source: Department of Trade, Business and Innovation
In 2017 in Lajamanu: of the 103 filled jobs:
o 66 jobs were filled by Aboriginal persons, a decrease of 28 jobs from 2014 and a decrease of 4 jobs from 2011
o 37 jobs were filled by non-Aboriginal persons, a decrease of 23 jobs from 2014 and a decrease of 18 jobs from 2011
Aboriginal persons accounted for 64% of job holders compared to 61% in 2014 and 56% in 2011.
Table 2: Count of filled jobs by full-time/part-time status and Aboriginal status of person in job, 2011, 2014 and 2017 (a)(b)(c)
Indicator
2011 2014 2017Change
2011-2014Change
2014-2017
Ab
orig
inal
Non
-Ab
orig
inal
Tot
al
Ab
orig
inal
Non
-Ab
orig
inal
Tot
al
Ab
orig
inal
Non
-Ab
orig
inal
Tot
al
Ab
orig
inal
Non
-Ab
orig
inal
Tot
al
Ab
orig
inal
Non
-Ab
orig
inal
Tot
al
Full-time 33 51 84 31 57 88 23 37 60 -2 6 4 -8 -20 -28
Part-time 37 4 41 63 3 66 43 0 43 26 -1 25 -20 -3 -23
Total 70 55 125 94 60 15
4 66 37
103 24 5 29 -
28 -23 -51Source: Department of Trade, Business and Innovation
JOBS PROFILE LAJAMANU9

Chart 3: Count of filled jobs by full-time/part-time status and Aboriginal status of person in job, 2011, 2014 and 2017 (a)(b)(c)
Source: Department of Trade, Business and Innovation
In 2017 in Lajamanu: of the 103 filled jobs:
o 23 were full-time jobs filled by Aboriginal persons, a decrease of 8 jobs from 2014 and a decrease of 10 jobs from 2011
o 43 were part-time jobs filled by Aboriginal persons, a decrease of 20 jobs from 2014 and an increase of 6 jobs from 2011
o 37 were full-time jobs filled by non-Aboriginal persons, a decrease of 20 jobs from 2014 and a decrease of 14 jobs from 2011
o none were part-time jobs filled by non-Aboriginal persons, a decrease of 3 jobs from 2014 and a decrease of 4 jobs from 2011.
JOBS PROFILE LAJAMANU10

Jobs by Sector: Private and PublicTable 3: Count of filled jobs by sector of business and by Aboriginal status of person employed in job, 2011, 2014 and 2017 (a)(b)(c)
Indicator
2011 2014 2017Change
2011-2014Change
2014-2017
Abor
igin
al
Non
-Abo
rigi
nal
Tot
al
Ab
orig
inal
Non
-Abo
rigi
nal
Tot
al
Ab
orig
inal
Non
-Abo
rigi
nal
Tot
al
Ab
orig
inal
Non
-Abo
rigi
nal
Tot
al
Ab
orig
inal
Non
-Abo
rigi
nal
Tot
al
Public Sector 37 28 65 53 23 76 25 21 46 16 -5 11 -
28 -2 -30
Australian Government 1 0 1 1 1 2 2 0 2 0 1 1 1 -1 0Territory Government 15 23 38 14 17 31 22 20 42 -1 -6 -7 8 3 11Local Government 21 5 26 38 5 43 1 1 2 17 0 17 -
37 -4 -41
Private Sector 33 27 60 41 37 78 41 16 57 8 10 18 0 -
21-
21Total 70 55 12
5 94 60 154 66 37 10
3 24 5 29 -28
-23
-51
Source: Department of Trade, Business and Innovation
Chart 4: Count of filled jobs by sector of business, 2011, 2014 and 2017 (a)(d)
Source: Department of Trade, Business and Innovation
JOBS PROFILE LAJAMANU11

Chart 5: Percentage of filled jobs by sector of business in 2017 (a)(d)
Source: Department of Trade, Business and Innovation
In 2017 in Lajamanu: there were 46 jobs in the public sector, a decrease of 30 jobs from 2014 and a
decrease of 19 jobs from 2011 of the 46 jobs in the public sector in 2017:
o 2 jobs were in the Australian Government, unchanged from 2014 and an increase of 1 job from 2011
o 42 jobs were in the Territory Government, an increase of 11 jobs from 2014 and an increase of 4 jobs from 2011
o 2 jobs were in the Local Government, a decrease of 41 jobs from 2014 and a decrease of 24 jobs from 2011
there were 57 jobs in the private sector, a decrease of 21 jobs from 2014 and a decrease of 3 jobs from 2011.
JOBS PROFILE LAJAMANU12

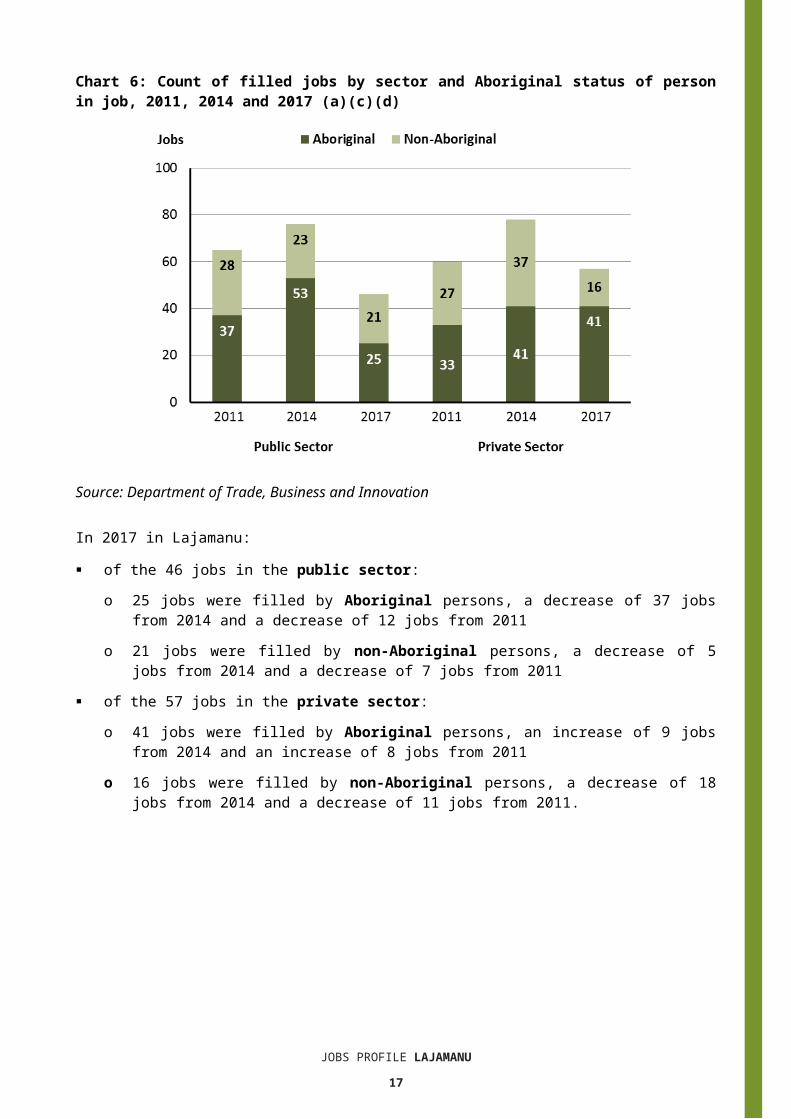
Chart 6: Count of filled jobs by sector and Aboriginal status of person in job, 2011, 2014 and 2017 (a)(c)(d)
Source: Department of Trade, Business and Innovation
In 2017 in Lajamanu: of the 46 jobs in the public sector:
o 25 jobs were filled by Aboriginal persons, a decrease of 37 jobs from 2014 and a decrease of 12 jobs from 2011
o 21 jobs were filled by non-Aboriginal persons, a decrease of 5 jobs from 2014 and a decrease of 7 jobs from 2011
of the 57 jobs in the private sector:o 41 jobs were filled by Aboriginal persons, an increase of 9 jobs from 2014 and
an increase of 8 jobs from 2011o 16 jobs were filled by non-Aboriginal persons, a decrease of 18 jobs from
2014 and a decrease of 11 jobs from 2011.
JOBS PROFILE LAJAMANU13

Chart 7: Count of filled jobs by sector and full-time/part-time status of person in job, 2011, 2014 and 2017 (a)(b)(d)
Source: Department of Trade, Business and Innovation
In 2017 in Lajamanu: of the 46 jobs in the public sector:
o 35 were full-time jobs, a decrease of 12 jobs from 2014 and a decrease of 12 jobs from 2011
o 11 were part-time jobs, a decrease of 30 jobs from 2014 and a decrease of 7 jobs from 2011
of the 57 jobs in the private sector:o 25 were full-time jobs, a decrease of 16 jobs from 2014 and a decrease of 12
jobs from 2011o 32 were part-time jobs, an increase of 7 jobs from 2014 and an increase of 9
jobs from 2011.
JOBS PROFILE LAJAMANU14
Table 4: Count of filled jobs by full-time/part-time status and Aboriginal status of person in job by sector, 2011, 2014, and 2017 (a)(b)(c)(d)
Indicator2011
Aboriginal Non-Aboriginal TotalFull-time
Part-time Total Full-
timePart-time Total Full-
timePart-time Total
Public Sector 21 16 37 26 2 28 47 18 65Private Sector 12 21 33 25 2 27 37 23 60Total 33 37 70 51 4 55 84 41 125
Indicator2014
Aboriginal Non-Aboriginal TotalFull-time
Part-time Total Full-
timePart-time Total Full-
timePart-time Total
Public Sector 21 41 62 26 0 26 47 41 88Private Sector 10 22 32 31 3 34 41 25 66Total 31 63 94 57 3 60 88 66 154
Indicator
2017Aboriginal Non-Aboriginal Total
Full-time
Part-time Total Full-
timePart-time Total Full-
timePart-time Total
Public Sector 14 11 25 21 0 21 35 11 46Private Sector 9 32 41 16 0 16 25 32 57Total 31 63 66 37 0 37 60 43 103
Source: Department of Trade, Business and Innovation
In 2017 in Lajamanu there were: 25 jobs in the public sector filled by Aboriginal persons, a decrease of 37 jobs
from 2014 and a decrease of 12 jobs from 2011, of which:o 14 were full-time jobs, a decrease of 7 jobs from 2014 and a decrease of 7
jobs from 2011o 11 were part-time jobs, a decrease of 30 jobs from 2014 and a decrease of 5
jobs from 2011 41 jobs in the private sector filled by Aboriginal persons, an increase of 9 jobs
from 2014 and an increase of 8 jobs from 2011, of which:o 9 were full-time jobs, a decrease of 1 job from 2014 and a decrease of 3 jobs
from 2011o 32 were part-time jobs, an increase of 10 jobs from 2014 and an increase of
11 jobs from 2011 21 jobs in the public sector filled by non-Aboriginal persons, a decrease of 5
jobs from 2014 and a decrease of 7 jobs from 2011, of which:o 21 were full-time jobs, a decrease of 5 jobs from 2014 and a decrease of 5
jobs from 2011o none were part-time jobs, unchanged from 2014 and a decrease of 2 jobs
JOBS PROFILE LAJAMANU15

from 2011
JOBS PROFILE LAJAMANU16
16 jobs in the private sector filled by non-Aboriginal persons, a decrease of 18 jobs from 2014 and a decrease of 11 jobs from 2011, of which:o 16 were full-time jobs, a decrease of 15 jobs from 2014 and a decrease of 9
jobs from 2011o none were part-time jobs, a decrease of 3 jobs from 2014 and a decrease of 2
jobs from 2011.
JOBS PROFILE LAJAMANU17

Job Status: Permanent and TemporaryTable 5: Count of filled jobs by employment status and Aboriginal status of person in job, 2011, 2014, and 2017 (a)(c)(e)
Indicator
2011 2014 2017Change
2011-2014Change
2014-2017
Abor
igin
al
Non
-Ab
orig
inal
Tot
al
Ab
orig
inal
Non
-Ab
orig
inal
Tot
al
Ab
orig
inal
Non
-Ab
orig
inal
Tot
al
Ab
orig
inal
Non
-Ab
orig
inal
Tot
al
Ab
orig
inal
Non
-Ab
orig
inal
Tot
al
Permanent 23 17 40 51 44 95 29 16 45 28 27 55 -22 -28 -50
Temporary 47 38 85 43 16 59 37 21 58 -4 -22 -26 -6 5 -1
Total 70 55 125 94 60 15
4 66 37 103 24 5 29 -
28-
23-
51Source: Department of Trade, Business and Innovation
Chart 8: Count of filled jobs by employment status and Aboriginal status of person in job, 2011, 2014 and 2017 (a)(c)(e)
Source: Department of Trade, Business and Innovation
In 2017 in Lajamanu: there were 45 permanent jobs, a decrease of 50 jobs from 2014, and an increase
of 5 jobs from 2011, of which:o 29 jobs were filled by Aboriginal persons, a decrease of 22 jobs from 2014
and an increase of 6 jobs from 2011o 16 jobs were filled by non-Aboriginal persons, a decrease of 28 jobs from
2014 and a decrease of 1 job from 2011
JOBS PROFILE LAJAMANU18

there were 58 temporary jobs, a decrease of 1 job from 2014 and a decrease of 27 jobs from 2011, of which:o 37 jobs were filled by Aboriginal persons, a decrease of 6 jobs from 2014 and
a decrease of 10 jobs from 2011o 21 jobs were filled by non-Aboriginal persons, an increase of 5 jobs from
2014 and a decrease of 17 jobs from 2011.
Table 6: Count of filled jobs by sector, Aboriginal status and employment status of person in job, 2011, 2014 and 2017 (a)(c)(d)(e)
Indicator2011
Aboriginal Non-Aboriginal TotalPerm Temp Total Perm Temp Total Perm Temp Total
Public Sector 12 25 37 14 14 28 26 39 65Private Sector 11 22 33 3 24 27 14 46 60Total 23 47 70 17 38 55 40 85 125
Indicator2014
Aboriginal Non-Aboriginal TotalPerm Temp Total Perm Temp Total Perm Temp Total
Public Sector 26 27 53 13 10 23 39 37 76Private Sector 25 16 41 31 6 37 56 22 78Total 51 43 94 44 16 60 95 59 154
Indicator2017
Aboriginal Non-Aboriginal TotalPerm Temp Total Perm Temp Total Perm Temp Total
Public Sector 8 17 25 6 15 21 14 32 46Private Sector 21 20 41 10 6 16 31 26 57Total 29 37 66 16 21 37 45 58 103
Source: Department of Trade, Business and Innovation
In 2017 in Lajamanu there were: 46 jobs in the public sector, a decrease of 30 jobs from 2014 and a decrease of
19 jobs from 2011, of which:o 14 jobs were permanent, a decrease of 25 jobs from 2014 and a decrease of
12 jobs from 2011, of which: 8 jobs were filled by Aboriginal persons, a decrease of 18 jobs from 2014
and a decrease of 4 jobs from 2011 6 jobs were filled by non-Aboriginal persons, a decrease of 7 jobs from
2014 and a decrease of 8 jobs from 2011o 32 jobs were temporary, a decrease of 5 jobs from 2014 and a decrease of 7
jobs from 2011, of which: 17 jobs were filled by Aboriginal persons, a decrease of 10 jobs from
2014 and a decrease of 8 jobs from 2011 15 jobs were filled by non-Aboriginal persons, an increase of 5 jobs from
2014 and an increase of 1 job from 2011JOBS PROFILE LAJAMANU
19

57 jobs in the private sector, a decrease of 21 jobs from 2014 and a decrease of 3 jobs from 2011, of which:o 31 jobs were permanent, a decrease of 25 jobs from 2014 and an increase of
17 jobs from 2011, of which: 21 jobs were filled by Aboriginal persons, a decrease of 4 jobs from 2014
and an increase of 10 jobs from 2011 10 jobs were filled by non-Aboriginal persons, a decrease of 21 jobs from
2014 and an increase of 7 jobs from 2011o 26 jobs were temporary, an increase of 4 jobs from 2014 and a decrease of
20 jobs from 2011, of which: 20 jobs were filled by Aboriginal persons, an increase of 4 jobs from 2014
and a decrease of 2 jobs from 2011 6 jobs were filled by non-Aboriginal persons, unchanged from 2014 and a
decrease of 18 jobs from 2011.
JOBS PROFILE LAJAMANU20

Job VacanciesTable 7: Job vacancies, 2011, 2014, and 2017
Indicator 2011 2014 2017Change2011-2014
Change2014-2017
Job vacancies 9 12 24 3 12Source: Department of Trade, Business and Innovation
Table 8: Job vacancies by occupation, 2011, 2014, and 2017 (f)(g)
Occupation (ANZSCO major group) 2011 2014 2017
Change2011-2014
Change2014-2017
Clerical and Administrative Workers 3 1 10 -2 9Community and Personal Service Workers 3 4 4 1 0Labourers 0 3 3 3 0Managers 0 0 1 0 1Professionals 3 4 5 1 1Technicians and Trades Workers 0 0 1 0 1Total 9 12 24 3 12
Source: Department of Trade, Business and Innovation
Table 9: Job vacancies by job title, July 2017 (f)Job Vacancy No.
Aged or Disabled Carer 1Building Associate 1Commercial Cleaner 1Community Worker 2Garden Labourer 1General Clerk 9Handyperson 1Health and Welfare Services Managers nec 1Primary School Teacher 1Program or Project Administrator 1Registered Nurses nec 4Sports Development Officer 1 Total 24
Source: Department of Trade, Business and Innovation
In 2017 in Lajamanu: there were 24 vacancies reported, an increase of 12 vacancies from 2014 and an
increase of 15 vacancies from 2011 of the 24 reported vacancies, the largest requirements were for:
o 10 Clerical and Administrative Workers, the majority of which is in the following job: General Clerk
JOBS PROFILE LAJAMANU21

o 5 Professionals, the majority of which is in the following job: Registered Nurse nec
o 4 Community and Personal Service Workers, the majority of which is in the following job: Community Worker.
JOBS PROFILE LAJAMANU22

Jobs by IndustryTable 10: Count of filled jobs by industry of business, 2011, 2014 and 2017 (a)(h)
Industry (ANZSIC Division) 2011 2014 2017
Chan
ge20
11-2
014
Chan
ge20
14-2
017
Total
% of Total
Total
% of Total
Total
% of Total
Total Total
Arts and Recreation Services 6 4.8% 11 7.1% 7 6.8% 5 -4Construction 2 1.6% 9 5.8% 8 7.8% 7 -1Education and Training 34 27.2% 28 18.2% 35 34.0% -6 7Financial and Insurance Services 0 0.0% 0 0.0% 2 1.9% 0 2Health Care and Social Assistance 18 14.4% 30 19.5% 18 17.5% 12 -12Other Services 1 0.8% 0 0.0% 0 0.0% -1 0Public Administration and Safety 40 32.0% 59 38.3% 16 15.5% 19 -43Retail Trade 20 16.0% 17 11.0% 17 16.5% -3 0Total 125 100.0
% 154 100.0% 103 100.0
% 29 -51Source: Department of Trade, Business and Innovation
In 2017 in Lajamanu: the Education and Training industry was the largest industry employer, with 35
filled jobs or 34% of filled jobs, an increase of 7 jobs from 2014 and an increase of 1 job from 2011
other significant industry employers were:o Health Care and Social Assistance with 18 jobs (or 17.5% of filled jobs), a
decrease of 12 jobs from 2014 and unchanged from 2011o Retail Trade with 17 jobs (or 16.5% of filled jobs), unchanged from 2014 and a
decrease of 3 jobs from 2011o Public Administration and Safety with 16 jobs (or 15.5% of filled jobs), a
decrease of 43 jobs from 2014 and a decrease of 24 jobs from 2011.
JOBS PROFILE LAJAMANU23

Table 11: Count of filled jobs by industry of business and Aboriginal status of person in job, 2011, 2014, and 2017 (a)(c)(h)
Industry (ANZSIC division)
2011 2014 2017Change2011-2014
Change 2014-2017
Ab
orig
inal
Non
-
Tot
al
Ab
orig
inal
Non
-
Tot
al
Ab
orig
inal
Non
-
Tot
al
Ab
orig
inal
Non
-
Tot
al
Ab
orig
inal
Non
-Ab
orig
inal
Tot
al
Arts and Recreation Services 5 1 6 10 1 11 6 1 7 5 0 5 -4 0 -4Construction 0 2 2 5 4 9 6 2 8 5 2 7 1 -2 -1Education and Training 13 21 34 11 17 28 12 23 35 -2 -4 -6 1 6 7Financial and Insurance Services 0 0 0 0 0 0 2 0 2 0 0 0 2 0 2Health Care and Social Assistance 8 10 18 19 11 30 11 7 18 11 1 1
2 -8 -4 -12
Other Services 0 1 1 0 0 0 0 0 0 0 -1 -1 0 0 0Public Administration and Safety 34 6 40 48 11 59 13 3 16 14 5 1
9 -35 -8 -43
Retail Trade 7 13 20 1 16 17 16 1 17 -6 3 -3 15 -15 0
Total 70 55 125 9
460 154 6
637 103 2
4 5 29
-28
-23
-51
Source: Department of Trade, Business and Innovation
JOBS PROFILE LAJAMANU24
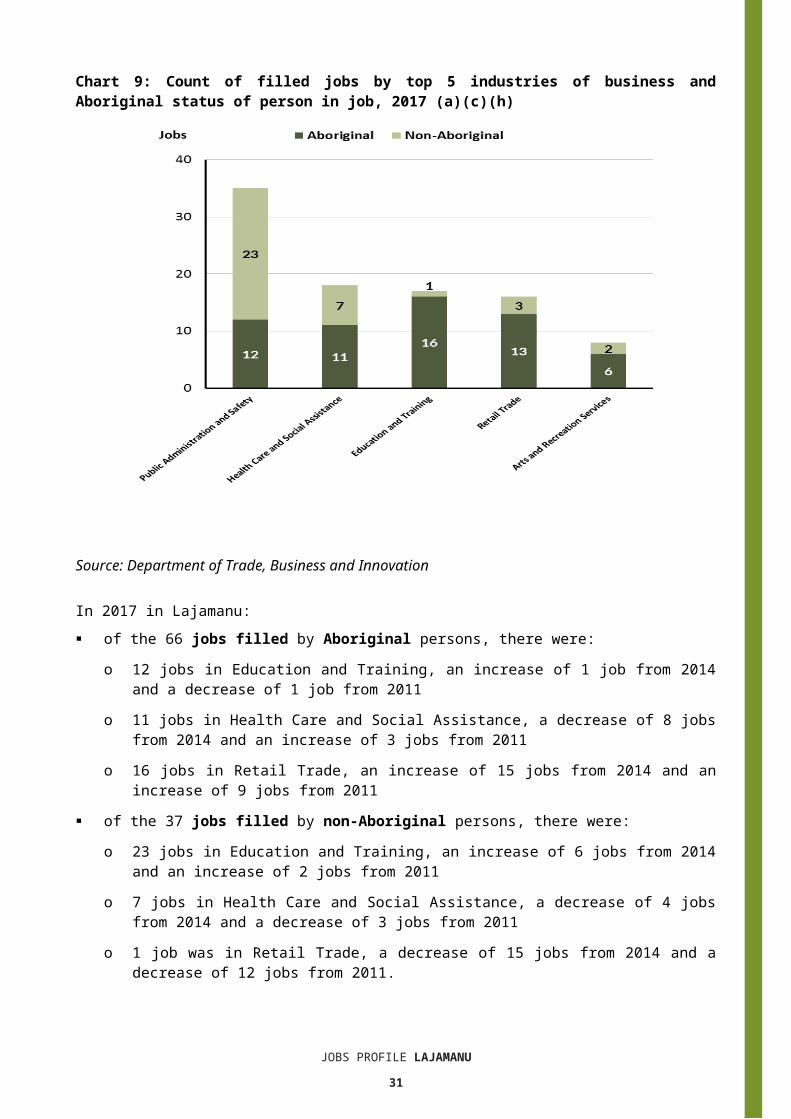
Chart 9: Count of filled jobs by top 5 industries of business and Aboriginal status of person in job, 2017 (a)(c)(h)
Source: Department of Trade, Business and Innovation
In 2017 in Lajamanu: of the 66 jobs filled by Aboriginal persons, there were:
o 12 jobs in Education and Training, an increase of 1 job from 2014 and a decrease of 1 job from 2011
o 11 jobs in Health Care and Social Assistance, a decrease of 8 jobs from 2014 and an increase of 3 jobs from 2011
o 16 jobs in Retail Trade, an increase of 15 jobs from 2014 and an increase of 9 jobs from 2011
of the 37 jobs filled by non-Aboriginal persons, there were:o 23 jobs in Education and Training, an increase of 6 jobs from 2014 and an
increase of 2 jobs from 2011o 7 jobs in Health Care and Social Assistance, a decrease of 4 jobs from 2014
and a decrease of 3 jobs from 2011o 1 job was in Retail Trade, a decrease of 15 jobs from 2014 and a decrease of
12 jobs from 2011.
JOBS PROFILE LAJAMANU25
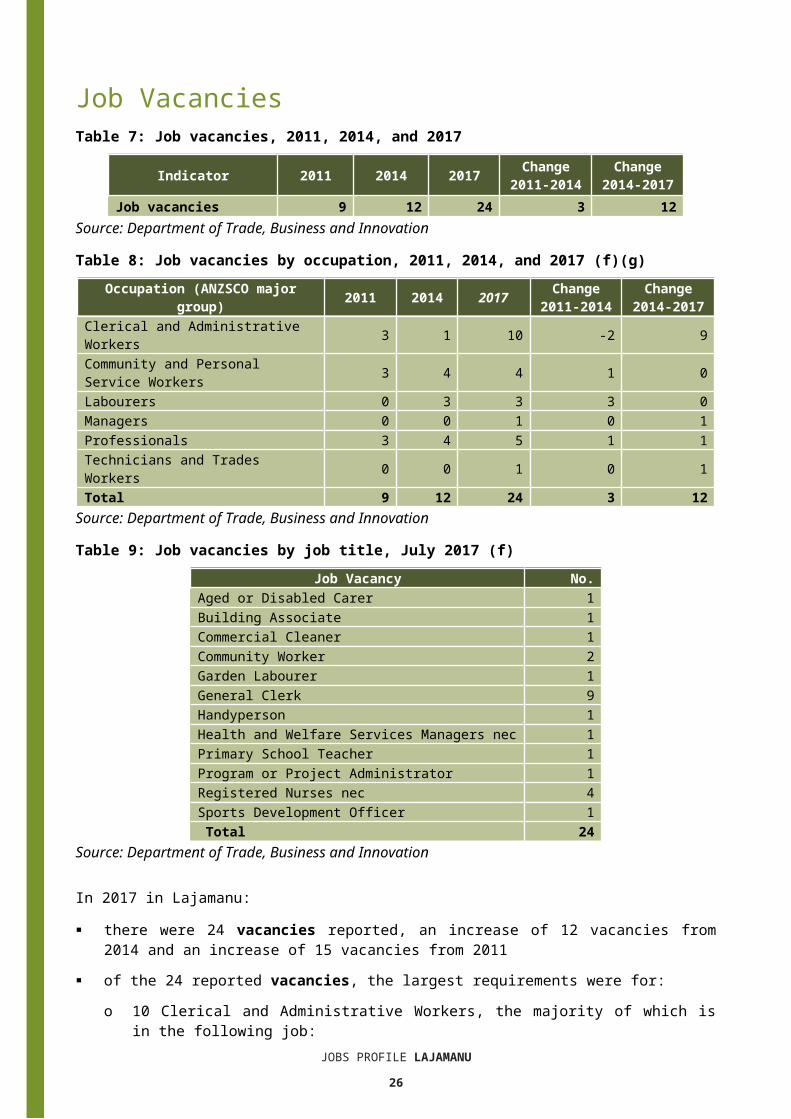
Table 12: Count of filled jobs by industry, employment status and Aboriginal status of person in job, 2011 (a)(c)(e)(h)
Industry (ANZSIC division)
2011Aboriginal Non-Aboriginal Total
Perm
Temp
Total
Perm
Temp
Total
Perm
Temp
Total
Arts and Recreation Services 0 5 5 0 1 1 0 6 6
Construction 0 0 0 2 0 2 2 0 2Education and Training 6 7 13 9 12 21 15 19 34Health Care and Social Assistance 0 8 8 0 10 10 0 18 18
Other Services 0 0 0 1 0 1 1 0 1Public Administration and Safety 17 17 34 5 1 6 22 18 40
Retail Trade 0 7 7 0 13 13 0 20 20Total 23 47 70 17 38 55 40 85 125Source: Department of Trade, Business and Innovation
Table 13: Count of filled jobs by industry, employment status and Aboriginal status of person in job, 2014 (a)(c)(e)(h)
Industry (ANZSIC division)
2014Aboriginal Non-Aboriginal Total
Perm
Temp
Total
Perm
Temp
Total
Perm
Temp
Total
Arts and Recreation Services 5 5 10 1 0 1 6 5 11
Construction 0 5 5 3 1 4 3 6 9Education and Training 5 6 11 6 11 17 11 17 28Health Care and Social Assistance 10 9 19 11 0 11 21 9 30Public Administration and Safety 30 18 48 10 1 11 40 19 59
Retail Trade 1 0 1 13 3 16 14 3 17Total 51 43 94 44 16 60 95 59 154Source: Department of Trade, Business and Innovation
JOBS PROFILE LAJAMANU26

Table 14: Count of filled jobs by industry, employment status and Aboriginal status of person in job, 2017 (a)(c)(e)(h)
Industry (ANZSIC division)
2017Aboriginal Non-Aboriginal Total
Perm
Temp
Total
Perm
Temp
Total
Perm
Temp
Total
Arts and Recreation Services 6 0 6 1 0 1 7 0 7
Construction 5 1 6 1 1 2 6 2 8Education and Training 5 7 12 7 16 23 12 23 35Financial and Insurance Services 1 1 2 0 0 0 1 1 2Health Care and Social Assistance 3 8 11 4 3 7 7 11 18Public Administration and Safety 3 10 13 2 1 3 5 11 16
Retail Trade 6 10 16 1 0 1 7 10 17Total 29 37 66 16 21 37 45 58 103Source: Department of Trade, Business and Innovation
In 2017 in Lajamanu: of the 45 permanent jobs, there were:
o 12 jobs in Education and Training, an increase of 1 job from 2014 and a decrease of 3 jobs from 2011, including: 5 jobs filled by Aboriginal persons, unchanged from 2014 and a decrease
of 1 job from 2011 7 jobs filled by non-Aboriginal persons, an increase of 1 job from 2014
and a decrease of 2 jobs from 2011o 7 jobs in Arts and Recreation Services, an increase of 1 job from 2014 and an
increase of 7 jobs from 2011, including: 6 jobs filled by Aboriginal persons, an increase of 1 job from 2014 and an
increase of 6 jobs from 2011 1 job was filled by a non-Aboriginal person, unchanged from 2014 and an
increase of 1 job from 2011o 7 jobs in Health Care and Social Assistance, a decrease of 14 jobs from 2014
and an increase of 7 jobs from 2011, including: 3 jobs filled by Aboriginal persons, a decrease of 7 jobs from 2014 and an
increase of 3 jobs from 2011 4 jobs filled by non-Aboriginal persons, a decrease of 7 jobs from 2014
and an increase of 4 jobs from 2011 of the 58 temporary jobs, there were:
o 23 jobs in Education and Training, an increase of 6 jobs from 2014 and an increase of 4 jobs from 2011, including: 7 jobs filled by Aboriginal persons, an increase of 1 job from 2014 and
unchanged from 2011 16 jobs filled by non-Aboriginal persons, an increase of 5 jobs from 2014
JOBS PROFILE LAJAMANU27

and an increase of 4 jobs from 2011
JOBS PROFILE LAJAMANU28

o 11 jobs in Health Care and Social Assistance, an increase of 2 jobs from 2014 and a decrease of 7 jobs from 2011, including: 8 jobs filled by Aboriginal persons, a decrease of 1 job from 2014 and
unchanged from 20114 3 jobs filled by non-Aboriginal persons, an increase of 3 jobs from 2014
and a decrease of 7 jobs from 2011o 11 jobs in Public Administration and Safety, a decrease of 8 jobs from 2014
and a decrease of 7 jobs from 2011, including 10 jobs filled by Aboriginal persons, a decrease of 8 jobs from 2014 and a
decrease of 7 jobs from 2011 1 job was filled by a non-Aboriginal person, unchanged from 2014 and
unchanged from 2011.
JOBS PROFILE LAJAMANU29

Jobs by OccupationTable 15: Count of filled jobs by occupation, 2011, 2014 and 2017 (a)(f)(g)
Occupation (ANZSCO major group)
2011 2014 2017
Chan
ge20
11-2
014
Chan
ge20
14-2
017
Total
% of Total
Total
% of Total
Total
% of Total
Total
Total
Clerical and Administrative Workers 22 17.6% 23 14.9% 13 12.6% 1 -10Community and Personal Service Workers 31 24.8% 48 31.2% 23 22.3% 17 -25Labourers 12 9.6% 13 8.4% 3 2.9% 1 -10Machinery Operators and Drivers 3 2.4% 0 0.0% 3 2.9% -3 3Managers 8 6.4% 7 4.5% 8 7.8% -1 1Professionals 36 28.8% 48 31.2% 36 35.0% 12 -12Sales Workers 9 7.2% 10 6.5% 13 12.6% 1 3Technicians and Trades Workers 3 2.4% 5 3.2% 4 3.9% 2 -1Other occupations 1 0.8% 0 0.0% 0 0.0% -1 0Total 125 100.0
% 154 100.0% 103 100.0
% 29 -51Source: Department of Trade, Business and Innovation
Chart 10: Percentage and count of top 6 filled jobs by occupation, 2011, 2014 and 2017 (a)(f)(g)
JOBS PROFILE LAJAMANU30
Source: Department of Trade, Business and Innovation
JOBS PROFILE LAJAMANU31

In 2017 in Lajamanu: Professionals was the largest occupation classification in terms of filled jobs,
accounting for 36 jobs (35% of total filled jobs), a decrease of 12 jobs from 2014 and unchanged from 2011
other significant occupation classifications were:o Community and Personal Service Workers accounting for 23 jobs or 22.3% of
total jobs a decrease of 25 jobs from 2014 and a decrease of 8 jobs from 2011o Clerical and Administrative Workers accounting for 13 jobs or 12.6% of total
jobs a decrease of 10 jobs from 2014 and a decrease of 9 jobs from 2011o Sales Workers accounting for 13 jobs or 12.6% of total jobs an increase of 3
jobs from 2014 and an increase of 4 jobs from 2011.
Table 16 Count of filled jobs by ANZSCO occupation by Aboriginal status of person employed in job, 2011, 2014 and 2017 (a)(c)(f)(g)
Occupation (ANZSCO major
group)
2011 2014 2017
Chan
ge20
11-
2014
Chan
ge20
14-
2017
Ab
orig
inal
Non
-
Tot
al
Ab
orig
inal
Non
-
Tot
al
Ab
orig
inal
Non
-
Tot
al
Ab
orig
inal
Non
-
Tot
al
Ab
orig
inal
Non
-Ab
orig
inal
Tot
al
Clerical and Administrative Workers
15 7 22 1
6 7 23 7 6 13 1 0 1 -9 -1 -10
Community and Personal Service Workers
24 7 31 4
3 5 48 17 6 23 1
9 -2 17 -26 1 -
25
Labourers 8 4 12 8 5 13 1 2 3 0 1 1 -7 -3 -10
Machinery Operators and Drivers 2 1 3 0 0 0 3 0 3 -2 -1 -3 3 0 3Managers 0 8 8 1 6 7 1 7 8 1 -2 -1 0 1 1Professionals 1
620 36 2
523 48 2
016 36 9 3 1
2 -5 -7 -12
Sales Workers 4 5 9 1 9 10 13 0 13 -3 4 1 12 -9 3
Technicians and Trades Workers 0 3 3 0 5 5 4 0 4 0 2 2 4 -5 -1Other occupations 1 0 1 0 0 0 0 0 0 -1 0 -1 0 0 0Total 7
055
125
94
60
154
66
37
103
24 5 2
9 -28 -23 -51
Source: Department of Trade, Business and Innovation
In 2017 in Lajamanu: of the 66 jobs filled by Aboriginal persons, there were:
o 20 Professionals, a decrease of 5 jobs from 2014 and an increase of 4 jobs from 2011
o 17 Community and Personal Service Workers, a decrease of 26 jobs from 2014 and a decrease of 7 jobs from 2011
o 13 Sales Workers, an increase of 12 jobs from 2014 and an increase of 9 jobs JOBS PROFILE LAJAMANU
32

from 2011
JOBS PROFILE LAJAMANU33
of the 37 jobs filled by non-Aboriginal persons, there were:o 16 Professionals, a decrease of 7 jobs from 2014 and a decrease of 4 jobs from
2011o 7 Managers, an increase of 1 job from 2014 and a decrease of 1 job from 2011o 6 Clerical and Administrative Workers, a decrease of 1 job from 2014 and a
decrease of 1 job from 2011.
JOBS PROFILE LAJAMANU34

Jobs by Industry by OccupationTable 17: Count of filled jobs by industry by occupation, 2011 (a)(f)(g)(h)
2011
Industry (ANZSIC Division)
Occupation (ANZSCO major group)
Cl
eric
al a
nd
Adm
inis
trat
ive
Wor
kers
Co
mm
unit
y an
d Pe
rson
al S
ervi
ce
Wor
kers
La
bour
ers
M
achi
nery
Ope
rato
rs
and
Dri
vers
M
anag
ers
Pr
ofes
sion
als
Sa
les
Wor
kers
Te
chni
cian
s an
d Tr
ades
Wor
kers
O
ther
Occ
upat
ions
To
tal
Arts and Recreation Services 4 0 1 0 1 0 0 0 0 6Construction 2 0 0 0 0 0 0 0 0 2Education and Training 4 11 4 1 1 13 0 0 0 34Health Care and Social Assistance 2 5 3 0 0 8 0 0 0 18
Other Services 0 0 0 0 0 1 0 0 0 1Public Administration and Safety 8 13 0 0 2 14 0 2 1 40Retail Trade 2 0 3 1 4 0 9 1 0 20
Total 22 31 12 3 8 36 9 3 1 125
Source: Department of Trade, Business and Innovation
Table 18: Count of filled jobs by industry by occupation, 2014 (a)(f)(g)(h)2014
Industry (ANZSIC Division)
Occupation (ANZSCO major group)
Cl
eric
al a
nd
Adm
inis
trat
ive
Wor
kers
Co
mm
unit
y an
d Pe
rson
al S
ervi
ce
Wor
kers
La
bour
ers
M
achi
nery
Ope
rato
rs
and
Dri
vers
M
anag
ers
Pr
ofes
sion
als
Sa
les
Wor
kers
Te
chni
cian
s an
d Tr
ades
Wor
kers
O
ther
Occ
upat
ions
To
tal
Arts and Recreation Services 0 0 0 0 1 10 0 0 0 11Construction 2 0 7 0 0 0 0 0 0 9Education and Training 1 9 0 0 2 16 0 0 0 28Health Care and Social Assistance 1 15 3 0 2 7 0 2 0 30Public Administration and Safety 18 24 0 0 0 15 0 2 0 59
Retail Trade 1 0 3 0 2 0 10 1 0 17
Total 23 48 13 0 7 48 10 5 0 154
JOBS PROFILE LAJAMANU35

Source: Department of Trade, Business and Innovation
Table 19: Count of filled jobs by occupation and by industry, 2017 (a)(f)(g)(h)2017
Industry (ANZSIC Division)
Occupation (ANZSCO major group)
Cl
eric
al a
nd
Adm
inis
trat
ive
Wor
kers
Co
mm
unit
y an
d Pe
rson
al S
ervi
ce
La
bour
ers
M
achi
nery
Ope
rato
rs
and
Dri
vers
M
anag
ers
Pr
ofes
sion
als
Sa
les
Wor
kers
Te
chni
cian
s an
d Tr
ades
Wor
kers
O
ther
Occ
upat
ions
To
tal
Arts and Recreation Services 1 0 0 0 1 5 0 0 0 7Construction 1 0 0 3 2 1 0 1 0 8Education and Training 5 7 2 0 2 19 0 0 0 35Financial and Insurance Services 2 0 0 0 0 0 0 0 0 2Health Care and Social Assistance 2 10 1 0 2 3 0 0 0 18
Public Administration and Safety 2 6 0 0 0 8 0 0 0 16Retail Trade 0 0 0 0 1 0 13 3 0 17Total 13 23 3 3 8 36 13 4 0 103
Source: Department of Trade, Business and Innovation
In 2017 in Lajamanu: the majority of Professionals (36) jobs (the largest occupation group) were shared
across the Education and Training (19) and Public Administration and Safety (8) industries
the majority of Community and Personal Service Workers (the second largest occupation group) were in Health Care and Social Assistance accounting for 10 filled jobs
Public Administration and Safety showed the largest decrease in filled jobs of 75 between 2017 and 2014
a new industry in 2017 was Financial and Insurance Services which filled 2 jobs, this industry had nil jobs filled in 2014.
JOBS PROFILE LAJAMANU36

Jobs by GenderTable 20: Counts of filled jobs by gender2 and Aboriginal status of person employed in job 2011, 2014 and 2017 (a)(c)(i)
Indi
cato
r
2011 2014 2017 2011-2014 Change
2014-2017 Change
Ab
orig
inal
Non
-Abo
rigi
nal
Tot
al
Ab
orig
inal
Non
-Abo
rigi
nal
Tot
al
Ab
orig
inal
Non
-Abo
rigi
nal
Tot
al
Ab
orig
inal
Non
-Abo
rigi
nal
Tot
al
Ab
orig
inal
Non
-Abo
rigi
nal
Tot
al
Male 33 28 61 48 30 78 26 13 39 15 2 17 -22 -17 -39
Female 37 27 64 46 30 76 38 24 62 9 3 12 -8 -6 -
14Total 70 55 12
5 94 60 154 64 37 10
1 24 5 29 -30
-23
-53
Source: Department of Trade, Business and Innovation
Chart 11: Count of filled jobs by gender and Aboriginal status of person in job, 2011, 2014 and 2017 (a)(c)(i)
Source: Department of Trade, Business and Innovation
2 2 Aboriginal filled jobs gender status not identified in 2017
JOBS PROFILE LAJAMANU37

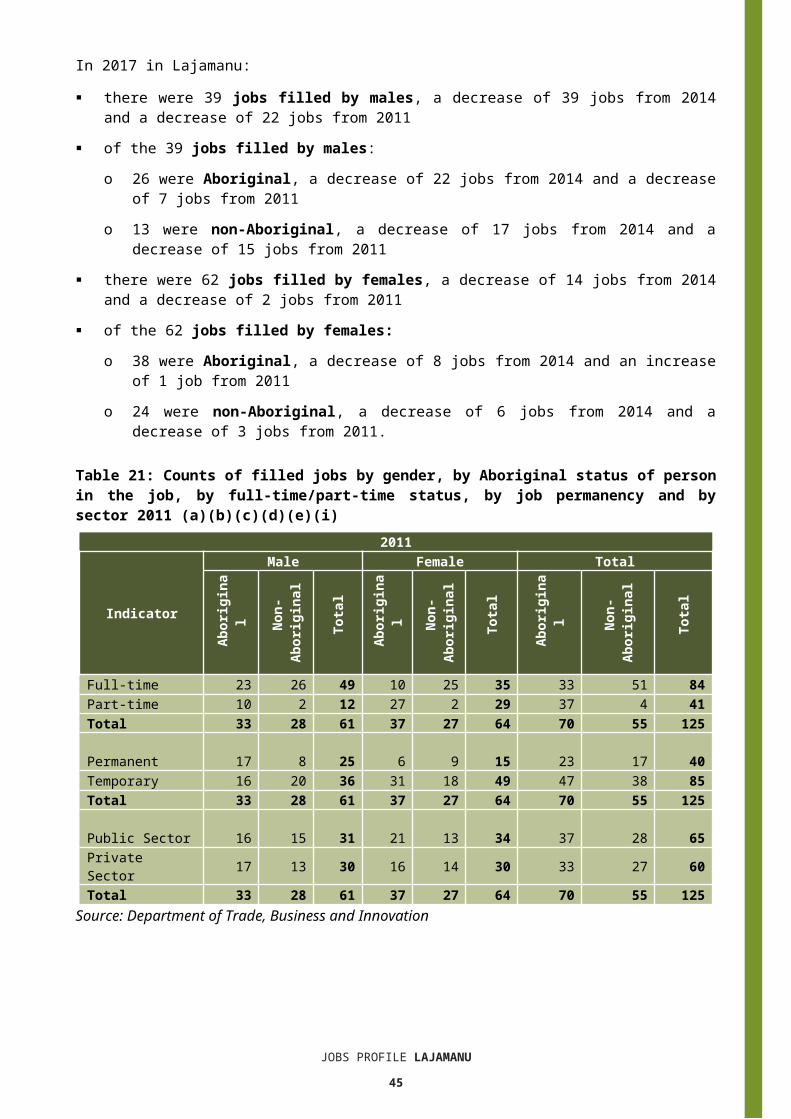
In 2017 in Lajamanu: there were 39 jobs filled by males, a decrease of 39 jobs from 2014 and a
decrease of 22 jobs from 2011 of the 39 jobs filled by males:
o 26 were Aboriginal, a decrease of 22 jobs from 2014 and a decrease of 7 jobs from 2011
o 13 were non-Aboriginal, a decrease of 17 jobs from 2014 and a decrease of 15 jobs from 2011
there were 62 jobs filled by females, a decrease of 14 jobs from 2014 and a decrease of 2 jobs from 2011
of the 62 jobs filled by females:o 38 were Aboriginal, a decrease of 8 jobs from 2014 and an increase of 1 job
from 2011o 24 were non-Aboriginal, a decrease of 6 jobs from 2014 and a decrease of 3
jobs from 2011.
Table 21: Counts of filled jobs by gender, by Aboriginal status of person in the job, by full-time/part-time status, by job permanency and by sector 2011 (a)(b)(c)(d)(e)(i)
2011
Indicator
Male Female Total
Ab
orig
inal
Non
-Ab
orig
inal
Tot
al
Ab
orig
inal
Non
-Ab
orig
inal
Tot
al
Ab
orig
inal
Non
-Ab
orig
inal
Tot
al
Full-time 23 26 49 10 25 35 33 51 84Part-time 10 2 12 27 2 29 37 4 41Total 33 28 61 37 27 64 70 55 125
Permanent 17 8 25 6 9 15 23 17 40Temporary 16 20 36 31 18 49 47 38 85Total 33 28 61 37 27 64 70 55 125
Public Sector 16 15 31 21 13 34 37 28 65Private Sector 17 13 30 16 14 30 33 27 60Total 33 28 61 37 27 64 70 55 125
Source: Department of Trade, Business and Innovation
JOBS PROFILE LAJAMANU38
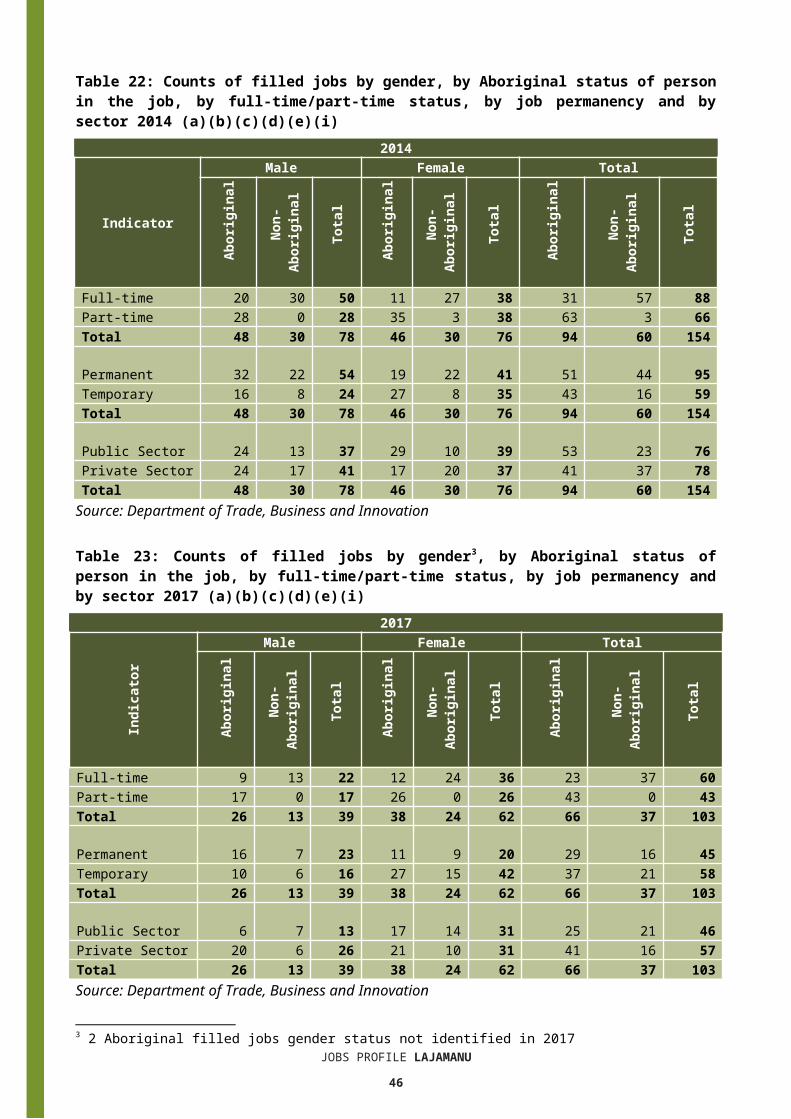
Table 22: Counts of filled jobs by gender, by Aboriginal status of person in the job, by full-time/part-time status, by job permanency and by sector 2014 (a)(b)(c)(d)(e)(i)
2014
Indicator
Male Female Total
Ab
orig
inal
Non
-Ab
orig
inal
Tot
al
Ab
orig
inal
Non
-Ab
orig
inal
Tot
al
Ab
orig
inal
Non
-Ab
orig
inal
Tot
al
Full-time 20 30 50 11 27 38 31 57 88Part-time 28 0 28 35 3 38 63 3 66Total 48 30 78 46 30 76 94 60 154
Permanent 32 22 54 19 22 41 51 44 95Temporary 16 8 24 27 8 35 43 16 59Total 48 30 78 46 30 76 94 60 154
Public Sector 24 13 37 29 10 39 53 23 76Private Sector 24 17 41 17 20 37 41 37 78Total 48 30 78 46 30 76 94 60 154
Source: Department of Trade, Business and Innovation
Table 23: Counts of filled jobs by gender3, by Aboriginal status of person in the job, by full-time/part-time status, by job permanency and by sector 2017 (a)(b)(c)(d)(e)(i)
2017
Indi
cato
r
Male Female Total
Ab
orig
inal
Non
-Ab
orig
inal
Tot
al
Ab
orig
inal
Non
-Ab
orig
inal
Tot
al
Ab
orig
inal
Non
-Ab
orig
inal
Tot
al
Full-time 9 13 22 12 24 36 23 37 60Part-time 17 0 17 26 0 26 43 0 43Total 26 13 39 38 24 62 66 37 103
Permanent 16 7 23 11 9 20 29 16 45Temporary 10 6 16 27 15 42 37 21 58Total 26 13 39 38 24 62 66 37 103
Public Sector 6 7 13 17 14 31 25 21 46Private Sector 20 6 26 21 10 31 41 16 57Total 26 13 39 38 24 62 66 37 103Source: Department of Trade, Business and Innovation
3 2 Aboriginal filled jobs gender status not identified in 2017JOBS PROFILE LAJAMANU
39

In 2017 in Lajamanu: of the 39 jobs filled by males, there were:
o 26 jobs filled by Aboriginal males, a decrease of 22 jobs from 2014 and a decrease of 7 jobs from 2011, including: 9 full-time jobs, a decrease of 11 jobs from 2014 and a decrease of 14 jobs
from 2011 17 part-time jobs, a decrease of 11 jobs from 2014 and an increase of 7
jobs from 2011 16 permanent jobs, a decrease of 16 jobs from 2014 and a decrease of 1
job from 2011 10 temporary jobs, a decrease of 6 jobs from 2014 and a decrease of 6
jobs from 2011 6 public sector jobs, a decrease of 18 jobs from 2014 and a decrease of 10
jobs from 2011 20 private sector jobs, a decrease of 4 jobs from 2014 and an increase of 3
jobs from 2011o 13 jobs filled by non-Aboriginal males, a decrease of 17 jobs from 2014 and
a decrease of 15 jobs from 2011, including: 13 full-time jobs, a decrease of 17 jobs from 2014 and a decrease of 13
jobs from 2011 none were part-time jobs, unchanged from 2014 and a decrease of 2 jobs
from 2011 7 permanent jobs, a decrease of 15 jobs from 2014 and a decrease of 1 job
from 2011 6 temporary jobs, a decrease of 2 jobs from 2014 and a decrease of 14
jobs from 2011 7 public sector jobs, a decrease of 6 jobs from 2014 and a decrease of 8
jobs from 2011 6 private sector jobs, a decrease of 11 jobs from 2014 and a decrease of 7
jobs from 2011 of the 62 jobs filled by females, there were:
o 38 jobs filled by Aboriginal females, a decrease of 8 jobs from 2014 and an increase of 1 job from 2011, including: 12 full-time jobs, an increase of 1 job from 2014 and an increase of 2 jobs
from 2011 26 part-time jobs, a decrease of 9 jobs from 2014 and a decrease of 1 job
from 2011 11 permanent jobs, a decrease of 8 jobs from 2014 and an increase of 5
jobs from 2011 27 temporary jobs, unchanged from 2014 and a decrease of 4 jobs from
2011 17 public sector jobs, a decrease of 12 jobs from 2014 and a decrease of 4
jobs from 2011
JOBS PROFILE LAJAMANU40

21 private sector jobs, an increase of 4 jobs from 2014 and an increase of 5 jobs from 2011
o 24 jobs filled by non-Aboriginal females, a decrease of 6 jobs from 2014 and a decrease of 3 jobs from 2011, including: 24 full-time jobs, a decrease of 3 jobs from 2014 and a decrease of 1 job
from 2011 none were part-time jobs, a decrease of 3 jobs from 2014 and a decrease
of 2 jobs from 2011 9 permanent jobs, a decrease of 13 jobs from 2014 and unchanged from
2011 15 temporary jobs, an increase of 7 jobs from 2014 and a decrease of 3
jobs from 2011 14 public sector jobs, an increase of 4 jobs from 2014 and an increase of 1
job from 2011 10 private sector jobs, a decrease of 10 jobs from 2014 and a decrease of
4 jobs from 2011.
JOBS PROFILE LAJAMANU41

Jobs by AgeTable 24: Counts of filled jobs by age and Aboriginal status of person employed in job, 2011, 2014 and 2017 (a)(c)(j)
Indicator
2011 2014 2017 Change2011-2014
Change2014-2017
Ab
orig
inal
Non
-Ab
orig
inal
Tot
al
Ab
orig
inal
Non
-Ab
orig
inal
Tot
al
Ab
orig
inal
Non
-Ab
orig
inal
Tot
al
Ab
orig
inal
Non
-
Tot
al
Ab
orig
inal
Non
-Ab
orig
inal
Tot
al
15-24 years 2 3 5 7 0 7 8 2 10 5 -3 2 1 2 325-44 years 46 30 76 70 39 10
9 37 21 58 24 9 33 -33 -18 -51
45+ years 22 22 44 17 21 38 19 14 33 -5 -1 -6 2 -7 -5
Total 70 55 125 94 60 15
4 66 37 103 24 5 29 -
28-
23 -51Source: Department of Trade, Business and Innovation
Chart 12: Count of filled jobs by age and Aboriginal status of person in job, 2011, 2014 and 2017 (a)(c)(j)
Source: Department of Trade, Business and Innovation
In 2017 in Lajamanu there were: 10 jobs filled by persons aged 15-24 years, an increase of 3 jobs from 2014 and
an increase of 5 jobs from 2011. Of these:
JOBS PROFILE LAJAMANU42

o 8 jobs were filled by Aboriginal persons, an increase of 1 job from 2014 and an increase of 6 jobs from 2011
o 2 jobs were filled by non-Aboriginal persons, an increase of 2 jobs from 2014 and a decrease of 1 job from 2011
58 jobs filled by persons aged 25-44 years, a decrease of 51 jobs from 2014 and a decrease of 18 jobs from 2011. Of these:o 37 jobs were filled by Aboriginal persons, a decrease of 33 jobs from 2014
and a decrease of 9 jobs from 2011o 21 jobs were filled by non-Aboriginal persons, a decrease of 18 jobs from
2014 and a decrease of 9 jobs from 2011 33 jobs filled by persons aged 45+ years, a decrease of 5 jobs from 2011 and a
decrease of 11 jobs from 2011. Of these:o 19 jobs were filled by Aboriginal persons, an increase of 2 jobs from 2014 and
a decrease of 3 jobs from 2011o 14 jobs were filled by non-Aboriginal persons, a decrease of 7 jobs from 2014
and a decrease of 8 jobs from 2011.
Table 25: Counts of filled jobs by age, by Aboriginal status of person in the job, by full-time/part-time status, by job permanency and by sector June-July 2011 (a)(b)(c)(d)(e)(i)
2011
Indicator
15-24 years 25-44 years 45+ years Total
Ab
orig
inal
Non
-Abo
rigi
nal
Tot
al
Ab
orig
inal
Non
-Abo
rigi
nal
Tot
al
Ab
orig
inal
Non
-Abo
rigi
nal
Tot
al
Ab
orig
inal
Non
-Abo
rigi
nal
Tot
al
Full-time 0 2 2 24 27 51 9 22 31 33 51 84Part-time 2 1 3 22 3 25 13 0 13 37 4 41Total 2 3 5 46 30 76 22 22 44 70 55 125
Permanent 0 0 0 16 7 23 7 10 17 23 17 40Temporary 2 3 5 30 23 53 15 12 27 47 38 85Total 2 3 5 46 30 76 22 22 44 70 55 125
Public Sector 0 2 2 20 12 32 17 14 31 37 28 65Private Sector 2 1 3 26 18 44 5 8 13 33 27 60Total 2 3 5 46 30 76 22 22 44 70 55 125Source: Department of Trade, Business and Innovation
JOBS PROFILE LAJAMANU43

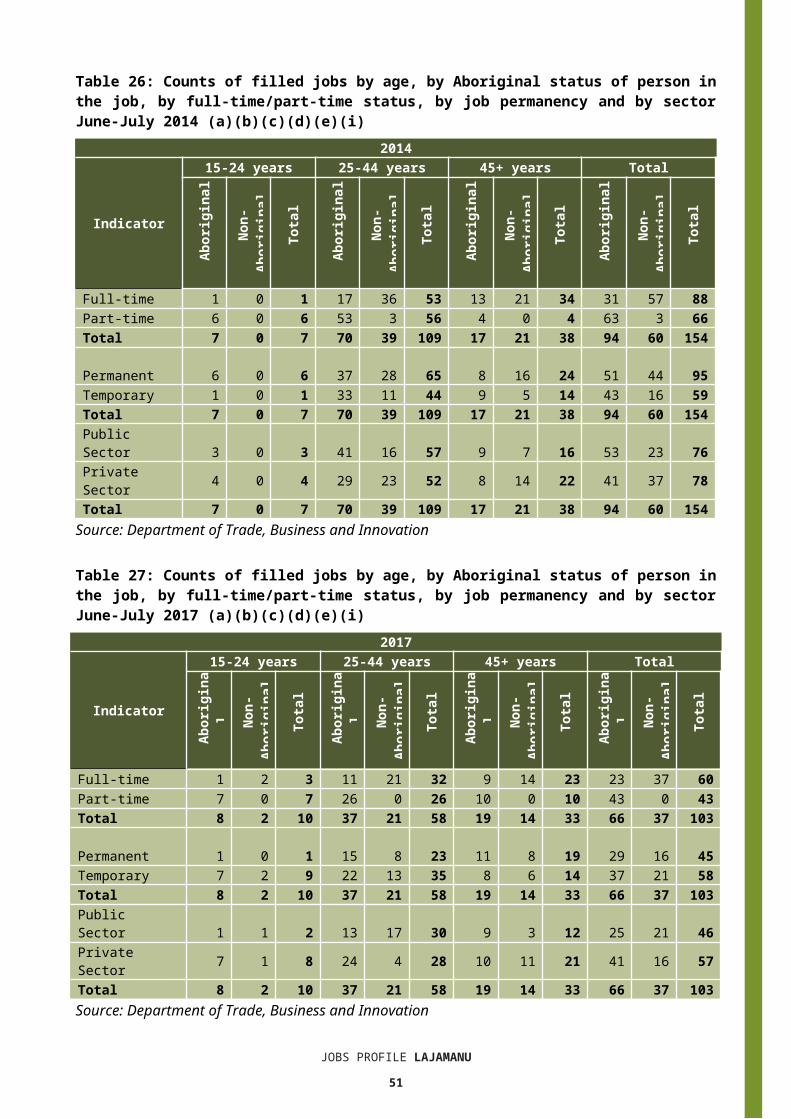
Table 26: Counts of filled jobs by age, by Aboriginal status of person in the job, by full-time/part-time status, by job permanency and by sector June-July 2014 (a)(b)(c)(d)(e)(i)
2014
Indicator
15-24 years 25-44 years 45+ years Total
Ab
orig
inal
Non
-Ab
orig
inal
Tot
al
Ab
orig
inal
Non
-Ab
orig
inal
Tot
al
Ab
orig
inal
Non
-Ab
orig
inal
Tot
al
Ab
orig
inal
Non
-Ab
orig
inal
Tot
al
Full-time 1 0 1 17 36 53 13 21 34 31 57 88Part-time 6 0 6 53 3 56 4 0 4 63 3 66Total 7 0 7 70 39 109 17 21 38 94 60 154
Permanent 6 0 6 37 28 65 8 16 24 51 44 95Temporary 1 0 1 33 11 44 9 5 14 43 16 59Total 7 0 7 70 39 109 17 21 38 94 60 154
Public Sector 3 0 3 41 16 57 9 7 16 53 23 76Private Sector 4 0 4 29 23 52 8 14 22 41 37 78Total 7 0 7 70 39 109 17 21 38 94 60 154
Source: Department of Trade, Business and Innovation
Table 27: Counts of filled jobs by age, by Aboriginal status of person in the job, by full-time/part-time status, by job permanency and by sector June-July 2017 (a)(b)(c)(d)(e)(i)
2017
Indicator
15-24 years 25-44 years 45+ years Total
Ab
orig
inal
Non
-Ab
orig
inal
Tot
al
Ab
orig
inal
Non
-Ab
orig
inal
Tot
al
Ab
orig
inal
Non
-Ab
orig
inal
Tot
al
Ab
orig
inal
Non
-Ab
orig
inal
Tot
al
Full-time 1 2 3 11 21 32 9 14 23 23 37 60Part-time 7 0 7 26 0 26 10 0 10 43 0 43Total 8 2 10 37 21 58 19 14 33 66 37 103
Permanent 1 0 1 15 8 23 11 8 19 29 16 45Temporary 7 2 9 22 13 35 8 6 14 37 21 58Total 8 2 10 37 21 58 19 14 33 66 37 103
Public Sector 1 1 2 13 17 30 9 3 12 25 21 46Private Sector 7 1 8 24 4 28 10 11 21 41 16 57Total 8 2 10 37 21 58 19 14 33 66 37 103Source: Department of Trade, Business and Innovation
In 2017 in Lajamanu: of the 10 jobs filled by persons aged 15-24 years, there were:
o 8 jobs filled by Aboriginal persons, of which:JOBS PROFILE LAJAMANU
44
1 was a full-time job, unchanged from 2014 and an increase of 1 job from 2011
7 were part-time jobs, an increase of 1 job from 2014 and an increase of 5 jobs from 2011
1 was a permanent job, a decrease of 5 jobs from 2014 and an increase of 1 job from 2011
7 were temporary jobs, an increase of 6 jobs from 2014 and an increase of 5 jobs from 2011
1 was a public sector job, a decrease of 2 jobs from 2014 and an increase of 1 job from 2011
7 were private sector jobs, an increase of 3 jobs from 2014 and an increase of 5 jobs from 2011
o 2 jobs filled by non-Aboriginal persons, of which: 2 were full-time jobs, an increase of 2 jobs from 2014 and unchanged from
2011 none were part-time jobs, unchanged from 2014 and a decrease of 1 job
from 2011 none were permanent jobs, unchanged from 2014 and unchanged from
2011 2 were temporary jobs, an increase of 2 jobs from 2014 and a decrease of
1 job from 2011 1 was a public sector job, an increase of 1 job from 2014 and a decrease of
1 job from 2011 1 was a private sector job, an increase of 1 job from 2014 and unchanged
from 2011 of the 58 jobs filled by persons aged 25-44 years, there were:
o 37 jobs filled by Aboriginal persons, of which: 11 were full-time jobs, a decrease of 6 jobs from 2014 and a decrease of
13 jobs from 2011 26 were part-time jobs, a decrease of 27 jobs from 2014 and an increase of
4 jobs from 2011 15 were permanent jobs, a decrease of 22 jobs from 2014 and a decrease
of 1 job from 2011 22 were temporary jobs, a decrease of 11 jobs from 2014 and a decrease
of 8 jobs from 2011 13 were public sector jobs, a decrease of 28 jobs from 2014 and a
decrease of 7 jobs from 2011 24 were private sector jobs, a decrease of 5 jobs from 2014 and a decrease
of 2 jobs from 2011o 21 jobs filled by non-Aboriginal persons, of which:
21 were full-time jobs, a decrease of 15 jobs from 2014 and a decrease of 6 jobs from 2011
none were part-time jobs, a decrease of 3 jobs from 2014 and a decrease of 3 jobs from 2011
JOBS PROFILE LAJAMANU45
8 were permanent jobs, a decrease of 20 jobs from 2014 and an increase of 1 job from 2011
JOBS PROFILE LAJAMANU46
13 were temporary jobs, an increase of 2 jobs from 2014 and a decrease of 10 jobs from 2011
17 were public sector jobs, an increase of 1 job from 2014 and an increase of 5 jobs from 2011
4 were private sector jobs, a decrease of 19 jobs from 2014 and a decrease of 14 jobs from 2011
of the 33 jobs filled by persons aged 45+ years, there were:o 19 jobs filled by Aboriginal persons, of which:
9 were full-time jobs, a decrease of 4 jobs from 2014 and unchanged from 2011
10 were part-time jobs, an increase of 6 jobs from 2014 and a decrease of 3 jobs from 2011
11 were permanent jobs, an increase of 3 jobs from 2014 and an increase of 4 jobs from 2011
8 were temporary jobs, a decrease of 1 job from 2014 and a decrease of 7 jobs from 2011
9 were public sector jobs, unchanged from 2014 and a decrease of 8 jobs from 2011
10 were private sector jobs, an increase of 2 jobs from 2014 and an increase of 5 jobs from 2011
o 14 jobs filled by non-Aboriginal persons, of which: 14 were full-time jobs, a decrease of 7 jobs from 2014 and a decrease of 8
jobs from 2011 none were part-time jobs, unchanged from 2014 and unchanged from
2011 8 were permanent jobs, a decrease of 8 jobs from 2014 and a decrease of
2 jobs from 2011 6 were temporary jobs, an increase of 1 job from 2014 and a decrease of 6
jobs from 2011 3 were public sector jobs, a decrease of 4 jobs from 2014 and a decrease
of 11 jobs from 2011 11 were private sector jobs, a decrease of 3 jobs from 2014 and an
increase of 3 jobs from 2011.
JOBS PROFILE LAJAMANU47

Vocational Education and TrainingNote: Since previous publications, the 2010 data have fallen in line with the new standardised
reporting practices with an emphasis of all training activity undertaken in the remote town regardless of funding stream. As such, figures for 2010 VET data in this publication may differ from previous publications.
The impact of the Remote Jobs and Communities Program (RJCP) being established in 2013 has played a significant role in the downturn of accredited training in many remote towns across the Territory.
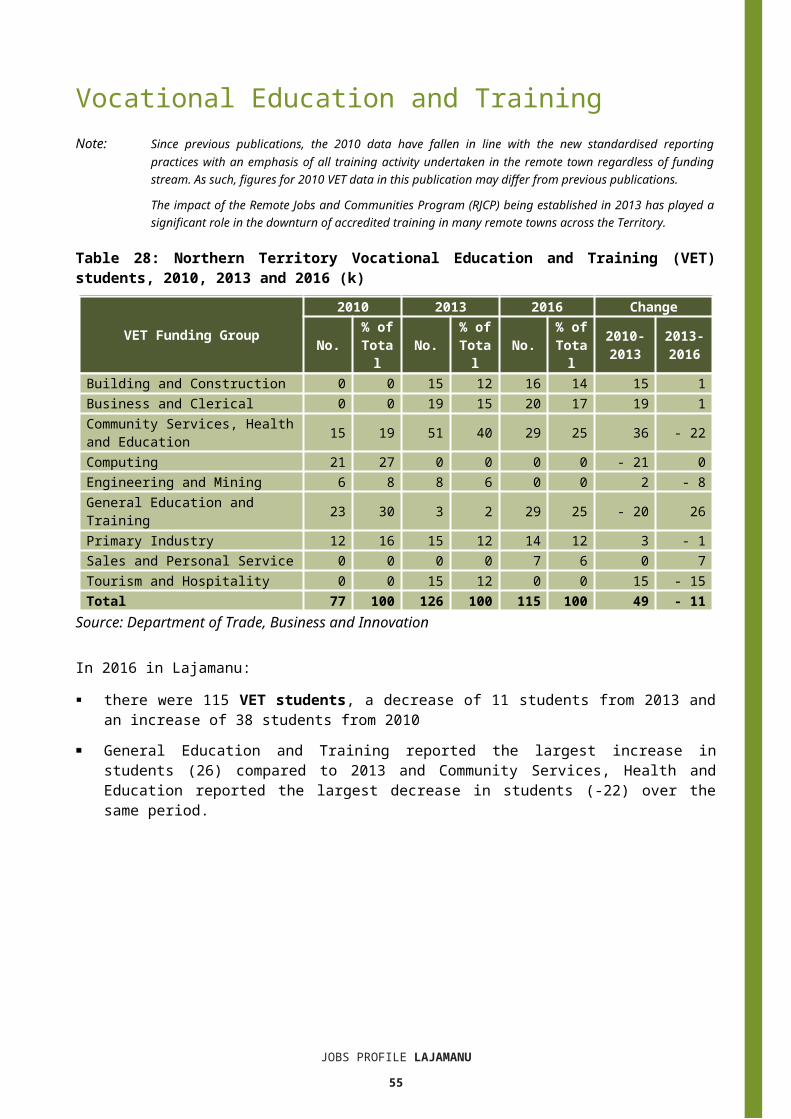
Table 28: Northern Territory Vocational Education and Training (VET) students, 2010, 2013 and 2016 (k)
VET Funding Group
2010 2013 2016 Change
No.% of Tota
lNo.
% of Tota
lNo.
% of
Total
2010-2013
2013-
2016Building and Construction 0 0 15 12 16 14 15 1Business and Clerical 0 0 19 15 20 17 19 1Community Services, Health and Education 15 19 51 40 29 25 36 - 22Computing 21 27 0 0 0 0 - 21 0Engineering and Mining 6 8 8 6 0 0 2 - 8General Education and Training 23 30 3 2 29 25 - 20 26Primary Industry 12 16 15 12 14 12 3 - 1Sales and Personal Service 0 0 0 0 7 6 0 7Tourism and Hospitality 0 0 15 12 0 0 15 - 15Total 77 100 126 100 115 10
0 49 - 11
Source: Department of Trade, Business and Innovation
In 2016 in Lajamanu: there were 115 VET students, a decrease of 11 students from 2013 and an
increase of 38 students from 2010 General Education and Training reported the largest increase in students (26)
compared to 2013 and Community Services, Health and Education reported the largest decrease in students (-22) over the same period.
JOBS PROFILE LAJAMANU48

Table 29: Northern Territory Vocational Education and Training (VET) unit enrolments, 2010, 2013 and 2016 (l)
VET Funding Group
2010 2013 2016 Change
No.% of
Total
No. % of Total No. % of
Total2010-2013
2013-2016
Building and Construction 0 0 98 23 31 5 98 - 67Business and Clerical 0 0 109 26 120 19 109 11Community Services, Health and Education 42 9 114 27 78 13 72 - 36Computing 122 26 0 0 0 0 - 122 0Engineering and Mining 79 17 51 12 0 0 - 28 - 51General Education and Training 161 35 9 2 279 45 - 152 270Primary Industry 57 12 30 7 38 6 - 27 8Sales and Personal Service 0 0 0 0 72 12 0 72Tourism and Hospitality 0 0 15 4 0 0 15 - 15Total 461 10
0 42
6 100 618 100 - 35 192
Source: Department of Trade, Business and Innovation
In 2016 in Lajamanu: there were 618 VET unit enrolments, an increase of 192 unit enrolments from
2013 and an increase of 157 unit enrolments from 2010 the areas of VET activity with the most unit enrolments were General Education
and Training (279), Business and Clerical (120), and Community Services, Health and Education (78)
General Education and Training reported the largest increase in unit enrolments (270) compared to 2013 and Building and Construction reported the largest decrease in unit enrolments (-67) over the same period.
Table 30: Northern Territory Vocational Education and Training (VET) nominal hours, 2010, 2013 and 2016 (m)
VET Funding Group2010 2013 2016 Change
No. % of Total No. % of
Total No.% of Tota
l2010-2013
2013-2016
Building and Construction 0 0 2 706 20 2 300 16 2 706 - 406Business and Clerical 0 0 3 220 24 3 100 22 3 220 - 120Community Services, Health and Education 1 185 10 3 973 30 2 480 18 2 788 -1 493Computing 3 270 28 0 0 0 0 -3 270 0Engineering and Mining 1 440 12 1 680 13 0 0 240 -1 680General Education and Training 3 680 31 270 2 2 935 21 -3 410 2 665Primary Industry 2 300 19 1 220 9 1 060 8 -1 080 - 160Sales and Personal Service 0 0 0 0 2 175 15 0 2 175Tourism and 0 0 225 2 0 0 225 - 225
JOBS PROFILE LAJAMANU49

HospitalityTotal 11 875 100 13
294 100 14 050 100 1 419 756
Source: Department of Trade, Business and Innovation
In 2016 in Lajamanu: there were 14 050 VET nominal hours delivered, an increase of 756 nominal
hours delivered from 2013 and an increase of 2175 nominal hours delivered from 2010
the areas of VET activity with the most nominal hours delivered were Business and Clerical (3100), General Education and Training (2935), and Community Services, Health and Education (2480)
General Education and Training reported the largest increase in nominal hours delivered (2665) compared to 2013 and Engineering and Mining reported the largest decrease in nominal hours delivered (-1680) over the same period.
Caveat: Nominal hours are based on the hours funded through Department of Trade Business and Innovation contracts; students and units includes delivery that has been funded in a previous year, fee for service or training that did not meet the funding requirements. Because of this a direct match cannot be made between hours and student/units.
Table 31: Northern Territory Vocational Education and Training (VET) unit completions, 2010, 2013 and 2016 (n)
VET Funding Group
2010 2013 2016 Change
No.% of Tota
lNo.
% of Tota
lNo.
% of
Total
2010-2013
2013-2016
Building and Construction 0 0 52 21 28 11 52 - 24Business and Clerical 0 0 23 9 82 31 23 59Community Services, Health and Education 33 10 80 32 42 16 47 - 38Computing 67 20 0 0 0 0 - 67 0Engineering and Mining 79 24 51 20 0 0 - 28 - 51General Education and Training 104 31 3 1 9 3 - 101 6Primary Industry 49 15 30 12 36 14 - 19 6Sales and Personal Service 0 0 0 0 65 25 0 65Tourism and Hospitality 0 0 14 6 0 0 14 - 14Total 332 100 253 100 262 100 - 79 9
Source: Department of Trade, Business and Innovation
In 2016 in Lajamanu: there were 262 VET unit completions, an increase of 9 unit completions from
2013 and a decrease of 70 unit completions from 2010 the areas of VET activity with the most unit completions were Business and
Clerical (82), Sales and Personal Service (65), and Community Services, Health and Education (42)
Sales and Personal Service reported the largest increase in nominal hours delivered (65) compared to 2013 and Engineering and Mining reported the largest decrease in nominal hours delivered (-51) over the same period.
JOBS PROFILE LAJAMANU50
PopulationTable 32: Population distribution by gender and age (p)(r)
Indicator2006 2016 Change
Male Female Total Male Femal
e Total Male Female Total
0-4 years 43 62 105 36 31 67 -7 -31 -385-14 years 73 70 143 71 107 178 -2 37 3515-24 years 96 85 181 67 47 114 -29 -38 -6725-44 years 95 103 198 93 108 201 -2 5 345-64 years 37 58 95 60 62 122 23 4 2765+ years 5 20 25 0 0 0 -5 -20 -25TOTAL 349 398 747 327 355 682 -22 -43 -65Source: Department of Trade, Business and Innovation
In 2016 in Lajamanu: there were an estimated 682 persons, of which:
o 327 (47.9%) were maleo 355 (52.1%) were female
between 2006 and 2016, the overall population in Lajamanu decreased by 65 persons from 2006, or an average of -0.9% per year compared to 0.7% across the 28 remote towns and 1.5% Territory wide
the male population decreased by 22 persons from 2006 the female population decreased by 43 persons from 2006 in 2016, the working age population (15 years and over) in Lajamanu was an
estimated 437 persons (64.1% of the total population) compared with 499 persons (66.8% of the total population) in 2006. Of these:o 114 (16.7%) were between 15 and 24 years of ageo 201 (29.5%) were between 25 and 44 years of ageo 122 (17.9%) were between 45 and 64 years of ageo none (0%) were over 65 years of age
of the 437 persons of working age:o 220 (50.3%) were maleo 217 (49.7%) were female.
There were 0.3 jobs in Lajamanu per working age person compared to 0.4 jobs per working age person across the 28 remote towns in the Northern Territory.
o
JOBS PROFILE LAJAMANU51

Chart 13: Population by Aboriginal status compared to the 28 remote towns and the NT (p)(q)
Source: Department of Trade, Business and Innovation
In 2016 in Lajamanu: 92.2% of the population in Lajamanu were Aboriginal, compared to 91.9% in
2006 89.4% of the population across all 28 remote towns were Aboriginal 28.3% of the NT population were Aboriginal.Table 33: Unemployment and participation rates by Aboriginal status compared to the NT (q)
Lajamanu Northern Territory
Aboriginal
Non-Aborigina
lTotal Aborigin
alNon-
Aboriginal
Total
Unemployment rate 28.7% 0.0% 19.9% 26.7% 3.8% 7.0%Participation rate 35.1% 100.0% 42.8% 41.0% 79.9% 70.6%
Source: Department of Trade, Business and Innovation
In 2016 in Lajamanu the:
total unemployment rate was 19.9% compared to 7% for the total Northern Territory
Aboriginal unemployment rate was 28.7% compared to 26.7% for the total Northern Territory
non-Aboriginal unemployment rate was 0% compared to 3.8% for the total Northern Territory
total participation rate was 42.8% compared to 70.6% for the total Northern Territory
Aboriginal participation rate was 35.1% compared to 41% for the total Northern JOBS PROFILE LAJAMANU
52

Territory non-Aboriginal participation rate was 100% compared to 79.9% for the total
Northern Territory.
JOBS PROFILE LAJAMANU53

Community Development ProgrammeTable 34: Community Development Programme Aboriginal job seekers, 30 April 2018 (o)
Indicator AboriginalNo. %
Total Aboriginal Job Seekers 172 N/AAge (years)
19 and under < 20 N/A20-24 26 N/A25-44 108 N/A45+ < 20 N/A
Total 134 100.0Gender
Male 107 62.2Female 65 37.8
Total 172 100.0Employment Outcome - 1 July 2015 to 30 April 2018
13 Weeks 29 54.726 Weeks 24 45.3
Currently in Activities 152 Source: Department of Prime Minister and Cabinet
Chart 14: Community Development Programme Aboriginal job seekers by gender and age-group30 April 2018 (o)
10762.2%
6537.8%
Gender
Male Female
Source: Department of Prime Minister and Cabinet
As at 30 April 2018, in Lajamanu, there were 172 CDP Aboriginal job seekers, of these: 107 (62.2%) were male and 65 (37.8%) were female less than 20 were aged 19 years and under, 26 were aged 20-24 years, 108 were
aged 25-44 years, and less than 20 were aged 45+ years between 1 July 2015 and 30 April 2018, 29 had reached the 13 week reporting
JOBS PROFILE LAJAMANU54
milestone and 24 had reached the 26 week reporting milestone 152 were currently in activities.
JOBS PROFILE LAJAMANU55

BusinessesTable 35: Businesses by sector (d)(s)
Business NameReported on
in 2011?
Reported on
in 2014?
Reported on in 2017?
PUBLIC SECTOR Aboriginal Interpreter Service No No YesCentral Desert Regional Council Yes Yes YesDepartment of Education Yes Yes YesDepartment of Justice (DoJ) Yes No NoDepartment of the Prime Minister and Cabinet Yes Yes YesLajamanu School Council Inc Yes No NoNorthern Territory Police, Fire Emergency Services Yes Yes YesTerritory Families No Yes YesVictoria Daly Regional Council No Yes NoPRIVATE SECTORAFL Northern Territory Ltd No Yes YesBatchelor Institute of Indigenous Tertiary Education (BIITE) No Yes YesCatholic Care NT No Yes NoCentral Land Council Yes Yes NoGlobal Interaction Yes No NoIndustries Services Training Pty Ltd (IS Australia) No Yes YesKatherine West Health Board Aboriginal Corporation Yes Yes YesLajamanu Progress Aboriginal Corporation No Yes NoLajamanu Progress Association (LPA) Yes No NoLife Without Barriers - Lajamanu Childcare Centre No Yes YesPower Project NT Pty Ltd No Yes YesSteps Group Australia Limited No Yes YesThe Arnhem Land Progress Aboriginal Corporation (ALPA) - Lajamanu Store and Workshop No No YesTraditional Credit Union (TCU) No No YesWarlpiri Youth Development Aboriginal Corporation (WYDAC) Yes Yes YesWarnayaka Art and Cultural Aboriginal Corporation Yes Yes YesWestern Desert Nganampa Walytja Palyantjaku Tjutaku Aboriginal Corporation trading as Western Desert Dialysis
No Yes Yes
World Vision Australia No Yes NoWulaign Homelands Council Aboriginal Corporation Yes Yes Yes
Source: Department of Trade, Business and Innovation
Note: Business names captured across the three survey periods have been identified by the current 2017 Business ABN name listed as at 2017.
In 2017 in Lajamanu: there were 19 businesses reported on, of which:
o 6 businesses were from the public sector (32%)o 13 businesses were from the private sector (68%)
there were 10 businesses operating that were not operating in 2011.JOBS PROFILE LAJAMANU
56

Notes(a) These counts represent numbers of filled jobs and not numbers of persons. As such the
totals represent the total number of filled jobs, not the total number of employees. This count is not directly comparable to the total number of employed persons as a person may have several jobs or one job may be shared by more than one person.
(b) Full-time is defined as a job usually requiring 35 hours or more per week or that required 35 hours or more work during the reference week. Part-time is defined as a job usually requiring less than 35 hours per week or that required less than 35 hours work during the reference week. The reference week refers to the period that respondents were asked to provide information about. In most instances it would be the week prior to the week the questionnaire was completed. Questionnaires were predominantly conducted in June and July.
(c) Care needs to be taken when analysing the counts of filled jobs by the Aboriginal status of persons in the jobs. The Aboriginal status of the person employed in a job was reported by the business representative completing the questionnaire.
(d) Sector was classified using the Standard Economic Sector of Classifications of Australia (SESCA), 2008.
(e) Job permanency is classified according to what the business believes the level of job permanency is based on guidelines provided by data collectors. Those guidelines state a permanent job has paid annual and/or sick leave entitlements while a temporary job includes casual and fixed-term contract jobs.
(f) Classified according to the Australian and New Zealand Standard Classification of Occupations (ANZSCO), 2006, major occupation level.
(g) Other occupations include jobs where occupation was not stated, not known or inadequately described.
(h) Classified using the Australian and New Zealand Standard Industrial Classification (ANZSIC), 2006, division level.
(i) Care needs to be taken when analysing the counts of filled jobs by the gender of persons in the jobs. The gender of the person employed in a job is reported by the business representative completing the questionnaire.
(j) Care needs to be taken when analysing the counts of filled jobs by the age of persons in the jobs. The age of the person employed in a job is reported by the business representative completing the questionnaire.
(k) Students represent the number of individual clients that enrolled in a Vocational Education and Training unit during the calendar year.
(l) Unit enrolments represent the count of individual units that students enrolled in during the calendar year.
(m)Nominal hours delivered is the sum of the nominal hours of the units commenced during the calendar year regardless of when the course enrolment commenced.
(n) Unit completions are the count of all successfully completed units reported in the calendar year regardless of the year of commencement of the units.
(o) The Community Development Programme (CDP) supports job seekers in remote Australia to build skills, address barriers and contribute to their communities through a range of flexible activities. Under the CDP, job seekers with activity requirements are expected to do up to 25 hours per week of work-like activities that benefit their community. It should be noted that some CDP participants may be reported on within the profile if they are attached to a filled position with an employer captured in the survey. Due to confidentiality issues, data below 20 people is not published.
(p) Population estimates for both 2006 and 2016 are taken from the estimated resident population (ERP) data produced by the Australian Bureau of Statistics (ABS) and based on Australian Statistical Geography Standard (ASGS) Statistical Area Level 1 (SA1) regions. ERP are official estimates of the Australian population, which link people to a place of usual residence with Australia. All ERP data sources, including the Census of Population and Housing (Census), are subject to error (including inaccuracies in collection, recording and processing data) and should be used with caution.
(q) Indigenous population proportions, unemployment and workforce participation rates are based on ABS Census counts at ASGS Indigenous Locations (ILOCs) for each remote town.
(r) Working-age population includes all residents aged 15 years and over (commonly referred to as the civilian population) and consists of persons that are employed, unemployed or not in the labour force.
JOBS PROFILE LAJAMANU57

(s) A ‘business’ has been defined as any organisation that has undertaken productive activities in the last year, including companies, non-profit organisations, government departments and enterprises operating within the designated remote geography (town), and has one or more employees in paid employment and an Australian Business Number (ABN).
JOBS PROFILE LAJAMANU58

Abbreviations and AcronymsABN Australian Business NumberABS Australian Bureau of StatisticsANZSCO Australian and New Zealand Standard Classification of OccupationsANZSIC Australian and New Zealand Standard Industrial ClassificationASGS Australian Statistical Geography StandardCDP Community Development ProgrammeERP Estimated Resident PopulationILOC Indigenous Locations nec Not Elsewhere ClassifiedNo. NumberPerm Permanentppt Percentage pointRJCP Remote Jobs and Communities ProgramTemp TemporarySA1 Statistical Area Level 1VET Vocational Education and Training
JOBS PROFILE LAJAMANU59