LACE Index: Tying Up Loose Ends with Hospital … · LACE Index: Tying Up Loose Ends with Hospital...
37
LACE Index: Tying Up Loose Ends with Hospital Readmissions April 22 nd , 2016 Nicholas Patykiewicz, PharmD PGY-1 HSPA Resident
Transcript of LACE Index: Tying Up Loose Ends with Hospital … · LACE Index: Tying Up Loose Ends with Hospital...

LACE Index: Tying Up Loose Ends with Hospital Readmissions
April 22nd, 2016
Nicholas Patykiewicz, PharmD
PGY-1 HSPA Resident


Learning Objectives (Pharmacists)
1. Identify independent risk factors for unplanned
readmissions
2. Discuss readmission risk prediction models and common
pitfalls associated with risk assessment stratification
3. Review primary literature relating to the derivation and
validation of the LACE index

Learning Objectives (Technicians)
1. Identify independent risk factors for unplanned
readmissions
2. Discuss readmission risk prediction models and common
pitfalls associated with risk assessment stratification

Hospital Readmissions: Common & Costly
N Engl J Med. 2009 Apr; 360: 1418-28.
Figure 1. Rates of rehospitalizations within 30 days after hospital discharge
19%• 20% of Medicare
patients
discharged are
readmitted within
30 days
• Estimated annual
cost to health care
is $17.4 Billion
• 2015 national
average: 15.2%

Causes of Hospital Readmissions
http://www.hsrd.research.va.gov/for_researchers/cyber_seminars/archives/video_archiv
e.cfm?SessionID=455. Published December 13, 2011. Accessed December 28, 2015.
Hospitalization
Comorbidities
Inpatient care
quality
Social
determinants
Health care access
Post discharge
care

Reasons for Interest
• 30-day hospital readmission rates has become a
standard for measuring quality and value
– Public reporting
– Financial penalties
• Risk prediction can be used to identify high-risk
patients for clinical intervention
– Re-allocation of health care resources
– Targeted efforts to improve outcomes

Predictive Analytics
• Analyzes current and historical data using statistical
methods to make predictions about the future
• Captures relationships among many factors to allow
assessment of risks or opportunities
• Enhances and guides decision-making ability
• Commonly used in actuarial science, marketing,
financial services, travel, and health care
http://www.ibm.com/developerworks/library/ba-predictive-analytics1/. Published May 29, 2012. Accessed April 6, 2016.
https://hbr.org/2014/09/a-predictive-analytics-primer. Published September 2, 2014. Accessed April 6, 2016.

Developing Risk Prediction Models
Screen patients to identify independent risk factors
Apply risk stratification categories (high vs. low risk)
Focus health care resources by targeting at risk patients
Continual model assessment and validation
1
2
3
4

Ideal Characteristics of Prediction Models
�Reliable data that are
easily obtained
�Deployable in large
populations
�Use variables clinically
related to and validated
in target population
�Good predictive value
�Provide data before
discharge
�Discriminate very high
from very low risk
patients
�Not overly complex
�Adapted to settings and
populations in which use
is intended
http://www.hsrd.research.va.gov/for_researchers/cyber_seminars/archives/video_archiv
e.cfm?SessionID=455. Published December 13, 2011. Accessed December 28, 2015.

Predictive Analytics Used in Medicine
• ACC/AHA CV Risk
Assessment
• APACHE III
• CHADS2
• CHADS2-VASc
• Framingham 10-Year
Risk of CVD
• HAS-BLED Risk Score
• MELD Score
• TIMI Risk Score

Derivation of CHADS2
Arch Intern Med. 1994;154(13):1449.
Stroke 1999;30:1223-9
JAMA 2001;285:2864–70.
1994
Atrial Fibrillation Investigators (AFI)
1999
Stroke Prevention in Atrial Fibrillation (SPAF)
2001
CHADS2 index derived by combining risk factors from prior studies and
validated in 1773 Medicare patients
CHADS2 Validation
• AFI scheme: c-statistic 0.68
• SPAF scheme: c-statistic 0.74
• CHADS2 index: c-statistic 0.82
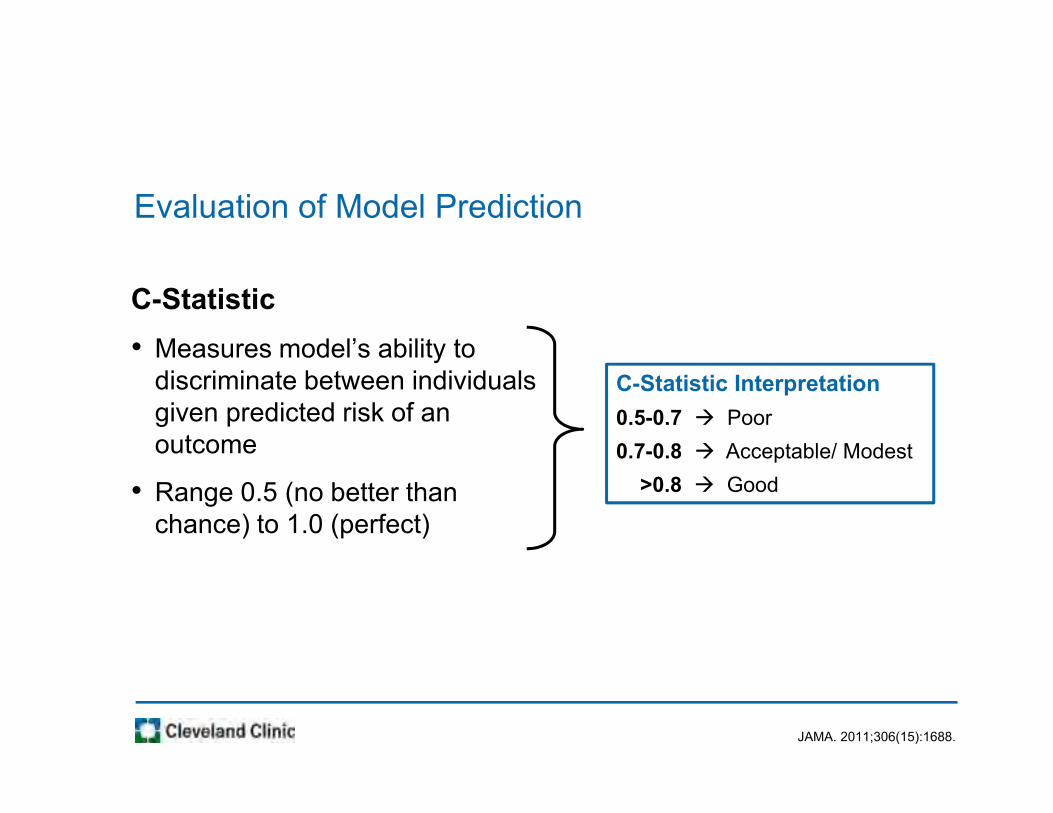
Evaluation of Model Prediction
C-Statistic
• Measures model’s ability to
discriminate between individuals
given predicted risk of an
outcome
• Range 0.5 (no better than
chance) to 1.0 (perfect)
JAMA. 2011;306(15):1688.
C-Statistic Interpretation
0.5-0.7 � Poor
0.7-0.8 � Acceptable/ Modest
>0.8 � Good

Further Development of CHA2DS2-VASc
Chest 2010;137:263-72.
BMJ. 2011; 342: d124.
2003
Framingham score2006
National Institute for Health and Clinical Excellence (NICE) guidelines
2006
ACC/AHA/ESC guidelines
2008
8th ACCP guidelines
2009
Birmingham risk stratification schema
2010
Euro Heart Survey on AF
2011
CHA2DS2-VASc score derived by refining Birmingham/NICE schema
CHA2DS2-VASc Validation
• CHADS2 index: c-statistic 0.812
• CHA2DS2-VASc score: c-statistic 0.888

Lessons Learned From Clinical Practice
• More data does not equate to more insight
• Ability to interpret data varies based on the data itself
• Predication models should be designed around
improving clinical health outcomes
• Developing clinically sound tools takes time and is
usually an iterative process

Types of Readmission Risk Models
JAMA. 2011;306(15):1688.
Clinical Utility
Model Category
Timing of Data Collection
Data Source
POOR
Hospital comparisons
Administrative
Real-Time Administrative
(3 studies)
Real-TimeRetrospective
Retrospective Administrative
(14 studies)
MODEST
Targeted interventions

Retrospective Administrative Data
Circ Cardiovasc Qual Outcomes. 2008;1(1):29-37.
Study CMS CHF Model
Outcome 30-day readmissions
Data Source • Medicare claims data
• Index admission and 12 months before index
admission
Variables 37 total, including age, gender, CV variables, and
comorbidities
Assessment C-statistic 0.60

Real-Time Administrative Data
Med Care. 2010;48(11):981-988.
Study Electronic Health Record (EHR) Model
Outcome 30-day all-cause readmissions
Data Source • EHR data from cohort of CHF patients
• Single urban US center
Variables Social: address changes, marital status, socio-economic
status, anxiety/depression
Behavioral: drug use, missed clinic visits
Utilization: prior admissions, ED presentation time
Assessment C-statistic 0.72 (95% CI 0.70-0.75)

Types of Readmission Risk Models
JAMA. 2011;306(15):1688.
Clinical Utility
Model Category
Timing of Data Collection
Data Source Primary
Real-Time Primary
(4 studies)
Real-TimeRetrospective
Retrospective Primary
(5 studies)
POOR
Targeted interventions
GOOD
Targeted interventions?

Primary Data Collected in Real-Time
J Am Geriatr Soc. 1993;41(8):811-817.
Nurs Res. 2008;57(6):406-415.
J Gen Intern Med. 2011;26(7):771-776.
Study Probability of Repeated Admissions (PRA)
Outcome 4-year all-cause readmission
Data Source Medicare population (age ≥70) from 1984
Variables Age, sex, self-rated health, informal caregiver, coronary
disease, diabetes, hospital admission within past year,
≥6 visits within past year
Assessment C-statistic 0.6
Led to development of PRA survey, also with poor
predictive ability(c-statistic 0.56-0.61, 95% CI 0.44-0.67)

Patient Variables Evaluated
JAMA. 2011;306(15):1688.
Variables Considered
Education
Caregiver availability or social support
Access to care
Socioeconomic status, income, or
employment
Prior hospitalizations
Medical diagnosis or comorbidity
index
24 studies included
14 studies included 5 studies included
2 studies included
0 studies included
5 studies included

Literature Conclusions
• Administrative type data is the most common and
feasible source to collect patient information from
• Real-time data is more beneficial for making clinical
interventions prior to discharge, but depends on the
accuracy of actual data collection
• Most prediction models perform poorly, relying on
comorbidity and utilization data, while few have
examined social determinant variables
JAMA. 2011;306(15):1688.

LACE Index
CMAJ. 2010;182(6):551.
Study Design
• Multicenter, prospective cohort study (Oct 2002 – July 2006)• Included 11 hospitals (6 university-affiliated, 5 community) in Ontario,
Canada
Outcomes Evaluated
• Risk of death or unplanned readmission within 30 days post-discharge
Methods
• Patient interviews pre- and post-discharge, and manual chart review• Split-sample design to derive and validate an index to predict risk of
death or non-elective readmission

Patient Selection
Inclusion Criteria:
• Adult patients
• Discharged from medical
or surgical services
• Agree to follow-up
telephone call
• Cognitively intact
Exclusion Criteria:
• Nursing home residents
CMAJ. 2010;182(6):551.

Results
EnrolledN=5,035
IncludedN=4,812
Death in first 30 days after
discharge (N=36)
Unplanned readmission in
first 30 days after discharge (N=349)
Excluded-Refused follow-up call
(n=124)-Lost to follow-up (n=83)-Nursing home
admissions (n=16)
CMAJ. 2010;182(6):551.

Results – Patient Characteristics
CMAJ. 2010;182(6):551.
Overall no. (%) of patients,
n=4,812
Patients withoutreadmission, no. (%)
n=4,427 (92.0)
Patients withreadmission, no. (%)
n=385 (8.0)
Mean age, years (SD) 61.3 (17.0) 61.0 (17.0) 64.7 (16.5)
Female 2530 (52.6) 2323 (52.5) 207 (53.8)
Living alone 1127 (23.4) 1033 (23.3) 94 (24.4)
Charlson comorbidity, median (IQR) 0 (0-0) 0 (0-0) 0 (0-2)
Prior hospital admissions in previous
6 months, ≥11557 (32.4) 1375 (31.1) 182 (47.3)
Visits to ED in previous 6 months, ≥1 1750 (36.4) 1543 (34.8) 207 (53.8)
Emergent admission 2796 (58.1) 2505 (56.6) 291 (75.6)
Length of stay, days, median (IQR) 5 (2-8) 4 (2-8) 7 (4-12)
Medication count at discharge,
median (IQR)4 (2-7) 4 (2-7) 5 (3-8)

Results – Multivariate Logistic Regression
CMAJ. 2010;182(6):551.
Variable Odds ratio (95% CI)
Length of stay in days 1.47 (1.25-1.73)
Acute (emergent) admission 1.84 (1.29-2.63)
Comorbidity (Charlson comorbidity score) 1.21 (1.10-1.33)
Visits to ED during previous 6 months 1.56 (1.27-1.92)

Scoring Tool
• Derived index score ranging
from 0 to 19
• 1-point increase =
– 18% ↑ odds of unplanned
readmissions
– 29% ↑ odds of early death
CMAJ. 2010;182(6):551.
Attribute Value Points
Length of stay, days <1 0
1 1
2 2
3 3
4-6 4
7-13 5
≥14 7
Acute (emergent) admission Yes 3
Charlson comorbidity score 0 0
1 1
2 2
3 3
≥4 5
Visits to ED, previous 6 mo 0 0
1 1
2 2
3 3
≥4 4

Assessment
• Externally validated using 1
million randomly selected
patient records
• Moderate discrimination for
early death or readmission
– C-statistic of 0.71 for internal
derivation (95% CI 0.67-0.75)
– C-statistic of 0.68 for external
validation (95% CI 0.68-0.69)
CMAJ. 2010;182(6):551.

LACE Index
• Derived from Canadian patient population with overall
low acuity
• Baseline readmission rates were only about 7%
• Model discrimination is better than previous models
and has been externally validated
• Each component of the index is readily and reliably
determined
• Score can be calculated in real-time during
hospitalization
CMAJ. 2010;182(6):551.
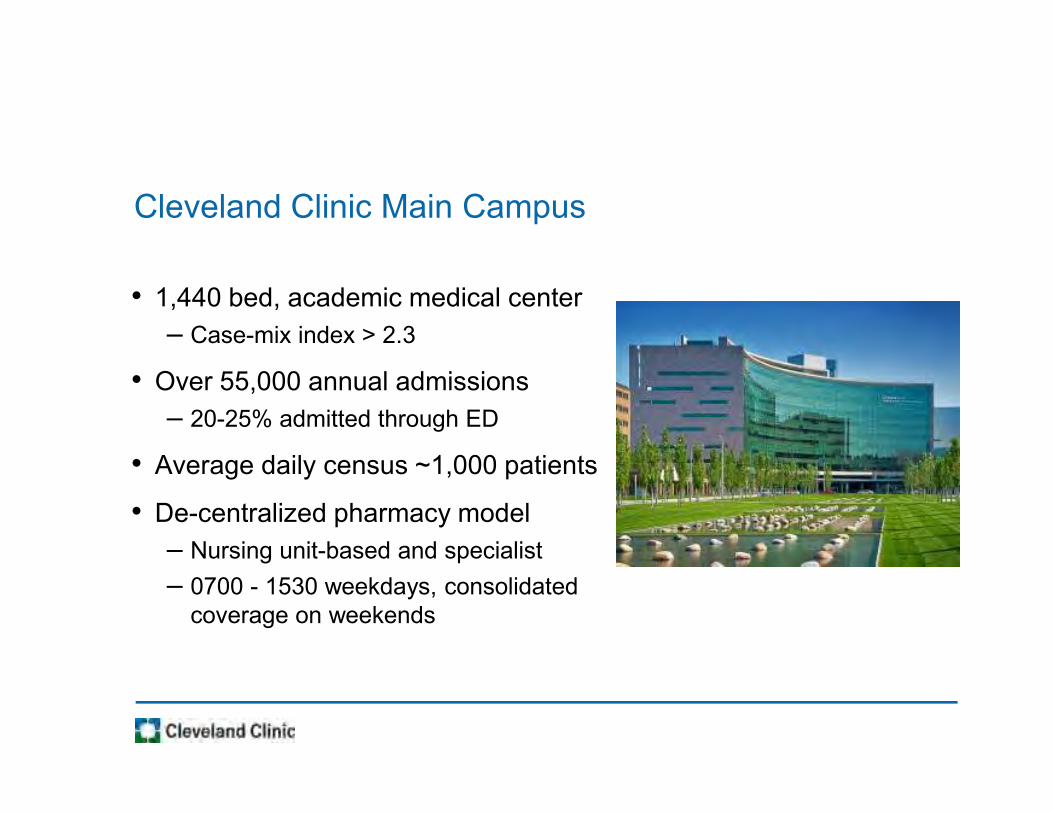
Cleveland Clinic Main Campus
• 1,440 bed, academic medical center
– Case-mix index > 2.3
• Over 55,000 annual admissions
– 20-25% admitted through ED
• Average daily census ~1,000 patients
• De-centralized pharmacy model
– Nursing unit-based and specialist
– 0700 - 1530 weekdays, consolidated
coverage on weekends

Adapting LACE Index Into Clinical Practice
• Medication count
– Active inpatient meds divided by 2
• High risk medications
– Anticoagulants, antiepileptic, diabetic
meds, antiarrhythmics (1 point each)
• Patient age
– 65-74 years (1 point), 75+ (2 points)
• Prior hospitalization
– 1 point for each encounter occurring
in previous 12 months, up to 4 points
2xLACE

Weight of Scores
LACE Score59%
High Risk Med Count
6%
Inpatient Med Count
29%
Patient Age Points
6%

Rx High Risk Scoring Tool
• Calculated automatically in real-time for all
patients
• Ability to set thresholds that differ by hospital
within the health-system
• Minimal correlation with medication history
discrepancies
• Score fluctuates throughout inpatient stay

Conclusion
• Growing interest in improving patient care while
avoiding financial and reimbursement penalties
• Causes of hospital readmissions are multi-factorial
• Risk stratification and predictive analytics are
strategies for better targeting hospital resources
• LACE index provides feasible and accurate model
prediction that can be modified for adaptation into
clinical practice workflow

Take Away Points
• Relying solely on historical utilization data or
clinical factors to predict readmissions may not be
the best approach
• Important to consider additional patient-specific
variables, such as social determinants
• Leveraging inter-hospital variability can lead to
improved clinical event prediction
• Information plus clinical context equals knowledge

LACE Index: Tying Up Loose Ends with Hospital Readmissions
April 22nd, 2016
Nicholas Patykiewicz, PharmD
PGY-1 HSPA Resident