Labour reallocation and demographics
43
Can we really explain worker flows in transition economies? Can we really explain worker flows in transition economies? Evidence from the Life in Transition Survey Joanna Tyrowicz Lucas van der Velde GRAPE Group for Research in APplied Economics November 2015, Instytut Badan Strukturalnych
-
Upload
grape -
Category
Economy & Finance
-
view
225 -
download
0
Transcript of Labour reallocation and demographics

Can we really explain worker flows in transition economies?
Can we really explain worker flows in transitioneconomies?
Evidence from the Life in Transition Survey
Joanna TyrowiczLucas van der Velde
GRAPEGroup for Research in APplied Economics
November 2015,Instytut Badan Strukturalnych

Can we really explain worker flows in transition economies?
Table of contents
1 Introduction
2 Hypotheses
3 Data and methods
4 Results
5 Conclusions

Can we really explain worker flows in transition economies?
Introduction
Introduction
Motivation
Transition theories better than universal labor market theories?When is transition over?
The missing link of demographic changes
Our goal: to understand better worker flows in transition economies
Which types of flows prevailed during transition?What was the role played by demographic processes?
Advantage: new, comprehensive retrospective data: Life inTransition Survey (EBRD)

Can we really explain worker flows in transition economies?
Introduction
Introduction
Motivation
Transition theories better than universal labor market theories?When is transition over?
The missing link of demographic changes
Our goal: to understand better worker flows in transition economies
Which types of flows prevailed during transition?
What was the role played by demographic processes?
Advantage: new, comprehensive retrospective data: Life inTransition Survey (EBRD)
Can we really explain worker flows in transition economies?
Introduction
Introduction
Motivation
Transition theories better than universal labor market theories?When is transition over?
The missing link of demographic changes
Our goal: to understand better worker flows in transition economies
Which types of flows prevailed during transition?What was the role played by demographic processes?
Advantage: new, comprehensive retrospective data: Life inTransition Survey (EBRD)
Can we really explain worker flows in transition economies?
Introduction
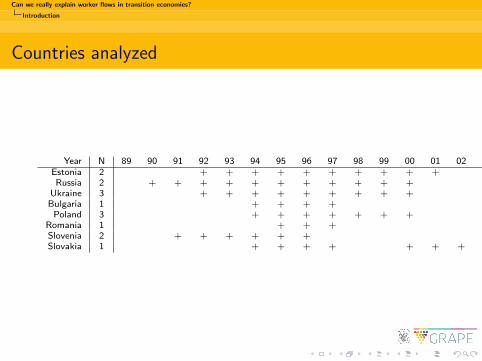
Countries analyzed
Year N 89 90 91 92 93 94 95 96 97 98 99 00 01 02 03 04Estonia 2 + + + + + + + + + +Russia 2 + + + + + + + + + + + +
Ukraine 3 + + + + + + + + +Bulgaria 1 + + + +
Poland 3 + + + + + + +Romania 1 + + +Slovenia 2 + + + + + +Slovakia 1 + + + + + + + + +
Can we really explain worker flows in transition economies?
Introduction
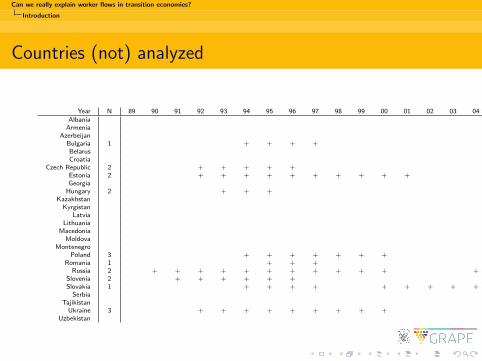
Countries (not) analyzed
Year N 89 90 91 92 93 94 95 96 97 98 99 00 01 02 03 04
AlbaniaArmenia
AzerbeijanBulgaria 1 + + + +BelarusCroatia
Czech Republic 2 + + + + +Estonia 2 + + + + + + + + + +Georgia
Hungary 2 + + +Kazakhstan
KyrgistanLatvia
LithuaniaMacedonia
MoldovaMontenegro
Poland 3 + + + + + + +Romania 1 + + +
Russia 2 + + + + + + + + + + + +Slovenia 2 + + + + + +Slovakia 1 + + + + + + + + +
SerbiaTajikistan
Ukraine 3 + + + + + + + + +Uzbekistan

Can we really explain worker flows in transition economies?
Introduction
Three stories of reallocation
Aghion and Blanchard (1994) → public to private flows.
Cabalero and Hammour (various papers) → Inter-industryreallocation.
Demographic transition.
Common challenges in applying these theories to data
1 Distinguish between worker flows (gross) and job flows (gross) andchange in employment structure (net)
2 Privatization vs. de novo firms might have different impact
3 What if a worker holds more than one job in the period?

Can we really explain worker flows in transition economies?
Hypotheses
Our statements to be tested
1 Flows during transition were generally AB, later intensifying CH
2 Reallocation affected labor supply
Can we really explain worker flows in transition economies?
Data and methods
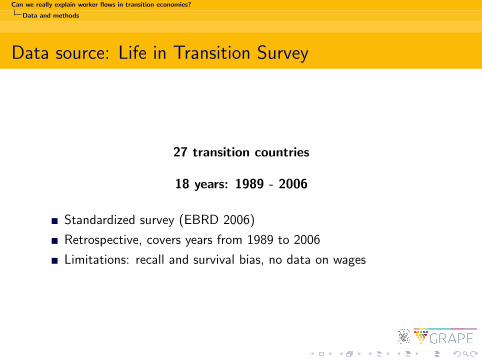
Data source: Life in Transition Survey
27 transition countries
18 years: 1989 - 2006
Standardized survey (EBRD 2006)
Retrospective, covers years from 1989 to 2006
Limitations: recall and survival bias, no data on wages

Can we really explain worker flows in transition economies?
Data and methods
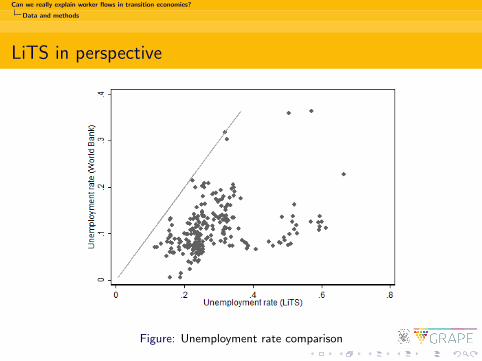
LiTS in perspective
Country YearServices Industry Private Services Industry Private(LFS) (LFS) (SES) (LiTS) (LiTS) (LiTS)
Bulgaria2000 51.8 39.6 57.2 36.0 48.72002 54.9 38.3 55.9 60.0 34.4 53.5
Estonia1997 53.1 33.1 58.4 30.6 52.72002 56.0 32.9 91.8 59.8 30.9 62.2
Latvia1998 47.4 30.1 67.1 23.6 51.22002 49.0 27.7 88.0 67.1 24.4 59.7
Poland2000 46.1 40.1 59.6 34.6 50.02002 51.5 37.8 47.1 59.0 34.3 53.4
Romania1997 48.4 22.8 54.1 39.7 44.22002 58.0 24.7 65.3 58.8 36.1 54.8
Slovakia1998 50.2 29.2 62.6 30.1 39.72002 52.7 27.7 63.0 65.6 28.6 45.9
Note: Own calculation on the basis of data from LiTS, the EU-Labour Force Surveys (LFS) andthe Structure of Earnings Survey (SES).
Can we really explain worker flows in transition economies?
Data and methods
LiTS in perspective
Figure: Unemployment rate comparison

Can we really explain worker flows in transition economies?
Data and methods
Definitions
AB: public ⇒ private sector (within the same industry)
CH: manufacturing ⇒ services (within the same sector)
ABCH: public manufacturing ⇒ private services
OPPOSITE: private service ⇒ public manufacturing
SAME: within sector and industry
EXIT: To retirement
ENTRY: Into employment

Can we really explain worker flows in transition economies?
Results
Our statements to be tested
1 Flows during transition were generally AB or CH
2 Reallocation affected labor supply

Can we really explain worker flows in transition economies?
Results
H1: which flows dominated in transition?

Can we really explain worker flows in transition economies?
Results
H1: Flows from (and into) the state sector
Can we really explain worker flows in transition economies?
Results
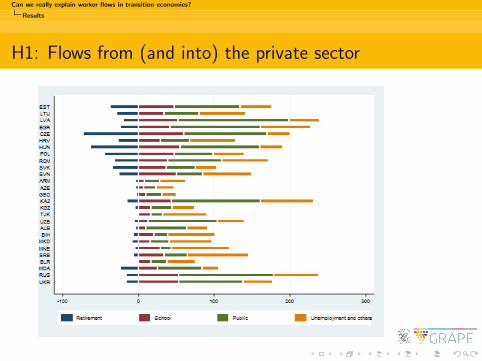
H1: Flows from (and into) the private sector
Can we really explain worker flows in transition economies?
Results
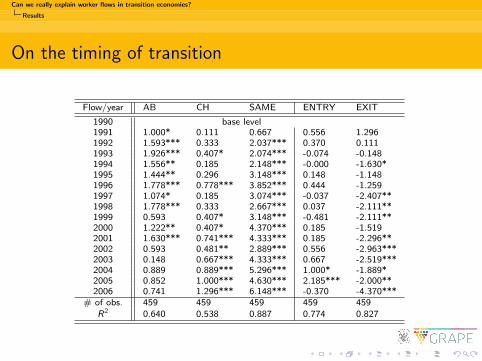
On the timing of transition
Flow/year AB CH SAME ENTRY EXIT
1990 base level1991 1.000* 0.111 0.667 0.556 1.2961992 1.593*** 0.333 2.037*** 0.370 0.1111993 1.926*** 0.407* 2.074*** -0.074 -0.1481994 1.556** 0.185 2.148*** -0.000 -1.630*1995 1.444** 0.296 3.148*** 0.148 -1.1481996 1.778*** 0.778*** 3.852*** 0.444 -1.2591997 1.074* 0.185 3.074*** -0.037 -2.407**1998 1.778*** 0.333 2.667*** 0.037 -2.111**1999 0.593 0.407* 3.148*** -0.481 -2.111**2000 1.222** 0.407* 4.370*** 0.185 -1.5192001 1.630*** 0.741*** 4.333*** 0.185 -2.296**2002 0.593 0.481** 2.889*** 0.556 -2.963***2003 0.148 0.667*** 4.333*** 0.667 -2.519***2004 0.889 0.889*** 5.296*** 1.000* -1.889*2005 0.852 1.000*** 4.630*** 2.185*** -2.000**2006 0.741 1.296*** 6.148*** -0.370 -4.370***
# of obs. 459 459 459 459 459R2 0.640 0.538 0.887 0.774 0.827

Can we really explain worker flows in transition economies?
Results
Our statements to be tested
1 Flows during transition were generally AB or CH
2 Reallocation affected labor supply

Can we really explain worker flows in transition economies?
Results
Our statements to be tested
1 Flows during transition were generally AB or CH
2 Reallocation affected labor supply
Can we really explain worker flows in transition economies?
Results
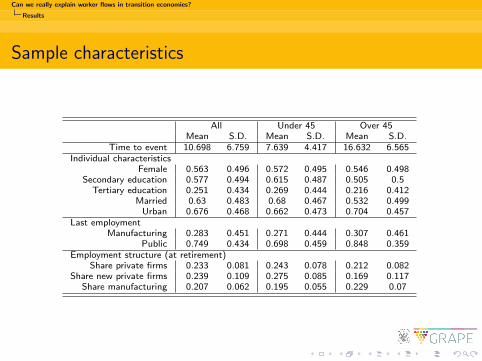
Sample characteristics
All Under 45 Over 45Mean S.D. Mean S.D. Mean S.D.
Time to event 10.698 6.759 7.639 4.417 16.632 6.565Individual characteristics
Female 0.563 0.496 0.572 0.495 0.546 0.498Secondary education 0.577 0.494 0.615 0.487 0.505 0.5
Tertiary education 0.251 0.434 0.269 0.444 0.216 0.412Married 0.63 0.483 0.68 0.467 0.532 0.499
Urban 0.676 0.468 0.662 0.473 0.704 0.457Last employment
Manufacturing 0.283 0.451 0.271 0.444 0.307 0.461Public 0.749 0.434 0.698 0.459 0.848 0.359
Employment structure (at retirement)Share private firms 0.233 0.081 0.243 0.078 0.212 0.082
Share new private firms 0.239 0.109 0.275 0.085 0.169 0.117Share manufacturing 0.207 0.062 0.195 0.055 0.229 0.07
Can we really explain worker flows in transition economies?
Results
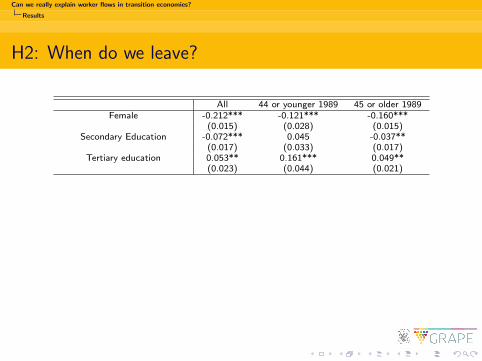
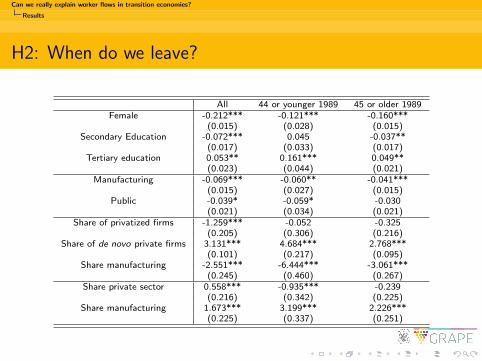
H2: When do we leave?
All 44 or younger 1989 45 or older 1989Female -0.212*** -0.121*** -0.160***
(0.015) (0.028) (0.015)Secondary Education -0.072*** 0.045 -0.037**
(0.017) (0.033) (0.017)Tertiary education 0.053** 0.161*** 0.049**
(0.023) (0.044) (0.021)
Manufacturing -0.069*** -0.060** -0.041***(0.015) (0.027) (0.015)
Public -0.039* -0.059* -0.030(0.021) (0.034) (0.021)
Share of privatized firms -1.259*** -0.052 -0.325(0.205) (0.306) (0.216)
Share of de novo private firms 3.131*** 4.684*** 2.768***(0.101) (0.217) (0.095)
Share manufacturing -2.551*** -6.444*** -3.061***(0.245) (0.460) (0.267)
Share private sector 0.558*** -0.935*** -0.239(0.216) (0.342) (0.225)
Share manufacturing 1.673*** 3.199*** 2.226***(0.225) (0.337) (0.251)

Can we really explain worker flows in transition economies?
Results
H2: When do we leave?
All 44 or younger 1989 45 or older 1989Female -0.212*** -0.121*** -0.160***
(0.015) (0.028) (0.015)Secondary Education -0.072*** 0.045 -0.037**
(0.017) (0.033) (0.017)Tertiary education 0.053** 0.161*** 0.049**
(0.023) (0.044) (0.021)Manufacturing -0.069*** -0.060** -0.041***
(0.015) (0.027) (0.015)Public -0.039* -0.059* -0.030
(0.021) (0.034) (0.021)
Share of privatized firms -1.259*** -0.052 -0.325(0.205) (0.306) (0.216)
Share of de novo private firms 3.131*** 4.684*** 2.768***(0.101) (0.217) (0.095)
Share manufacturing -2.551*** -6.444*** -3.061***(0.245) (0.460) (0.267)
Share private sector 0.558*** -0.935*** -0.239(0.216) (0.342) (0.225)
Share manufacturing 1.673*** 3.199*** 2.226***(0.225) (0.337) (0.251)

Can we really explain worker flows in transition economies?
Results
H2: When do we leave?
All 44 or younger 1989 45 or older 1989Female -0.212*** -0.121*** -0.160***
(0.015) (0.028) (0.015)Secondary Education -0.072*** 0.045 -0.037**
(0.017) (0.033) (0.017)Tertiary education 0.053** 0.161*** 0.049**
(0.023) (0.044) (0.021)Manufacturing -0.069*** -0.060** -0.041***
(0.015) (0.027) (0.015)Public -0.039* -0.059* -0.030
(0.021) (0.034) (0.021)Share of privatized firms -1.259*** -0.052 -0.325
(0.205) (0.306) (0.216)Share of de novo private firms 3.131*** 4.684*** 2.768***
(0.101) (0.217) (0.095)Share manufacturing -2.551*** -6.444*** -3.061***
(0.245) (0.460) (0.267)
Share private sector 0.558*** -0.935*** -0.239(0.216) (0.342) (0.225)
Share manufacturing 1.673*** 3.199*** 2.226***(0.225) (0.337) (0.251)
Can we really explain worker flows in transition economies?
Results
H2: When do we leave?
All 44 or younger 1989 45 or older 1989Female -0.212*** -0.121*** -0.160***
(0.015) (0.028) (0.015)Secondary Education -0.072*** 0.045 -0.037**
(0.017) (0.033) (0.017)Tertiary education 0.053** 0.161*** 0.049**
(0.023) (0.044) (0.021)Manufacturing -0.069*** -0.060** -0.041***
(0.015) (0.027) (0.015)Public -0.039* -0.059* -0.030
(0.021) (0.034) (0.021)Share of privatized firms -1.259*** -0.052 -0.325
(0.205) (0.306) (0.216)Share of de novo private firms 3.131*** 4.684*** 2.768***
(0.101) (0.217) (0.095)Share manufacturing -2.551*** -6.444*** -3.061***
(0.245) (0.460) (0.267)Share private sector 0.558*** -0.935*** -0.239
(0.216) (0.342) (0.225)Share manufacturing 1.673*** 3.199*** 2.226***
(0.225) (0.337) (0.251)
Can we really explain worker flows in transition economies?
Results
H2: When do we leave?
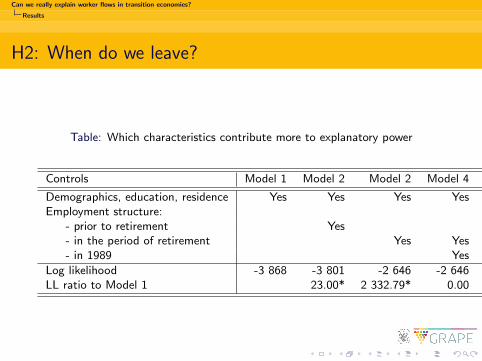
Table: Which characteristics contribute more to explanatory power
Controls Model 1 Model 2 Model 2 Model 4 Model 5
Demographics, education, residence Yes Yes Yes Yes YesEmployment structure:
- prior to retirement Yes Yes- in the period of retirement Yes Yes Yes- in 1989 Yes Yes
Log likelihood -3 868 -3 801 -2 646 -2 646 -2 635LL ratio to Model 1 23.00* 2 332.79* 0.00 11.34 *
Can we really explain worker flows in transition economies?
Results
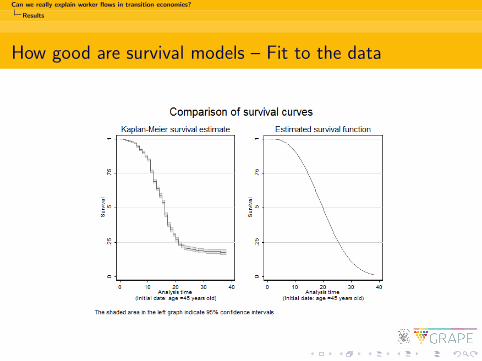
How good are survival models – Fit to the data

Can we really explain worker flows in transition economies?
Conclusions
Summarizing
1 AB and CH movements are the smallest part of transition.
2 School-to-work transition very important for transformation.
3 Retirement decisions are affected by both personal characteristics and thepace of restructuring.
Female workers and medium education workers appear to have alarger share of the burden. Role for SBTC?Positive relation between new firms and retirement time close to ABprediction.

Can we really explain worker flows in transition economies?
Conclusions
Questions or suggestions?
Thank you for your attention!

Can we really explain worker flows in transition economies?
Conclusions
Questions or suggestions?
Thank you for your attention!

Can we really explain worker flows in transition economies?
Conclusions
Tell me more, tell me more
H1: Beyond the graphs
Table: The adjusted size of each type of flows
OPPOSITE EXIT ENTRY SAME
Means 1.18 7.69 3.53 5.88
AB 2.30 -17.76*** 40.16*** 18.89*** 22.67***CH 0.66 17.97*** 45.61*** 44.62*** 27.84***
ABCH 0.60 16.88*** 46.80*** 43.94*** 27.33***
Can we really explain worker flows in transition economies?
Conclusions
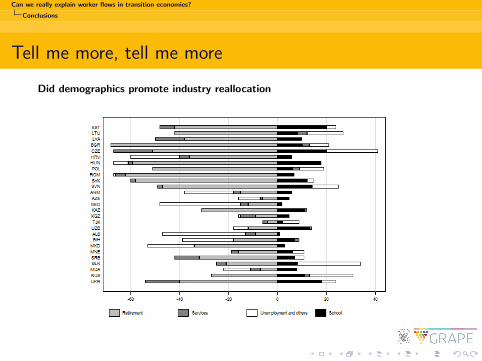
Tell me more, tell me more
Did demographics promote industry reallocation
Can we really explain worker flows in transition economies?
Conclusions
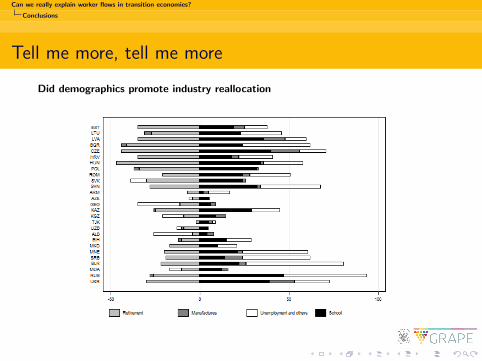
Tell me more, tell me more
Did demographics promote industry reallocation

Can we really explain worker flows in transition economies?
Conclusions
Tell me more, tell me more
How good are survival models 3: Robustness check
All Over 45 in 1989 Under 45 in 1989 55 at risk
Female -0.230*** -0.073*** -0.152*** -0.535***(0.015) (0.021) (0.015) (0.038)
Secondary Education -0.094*** -0.003 -0.057*** -0.130***(0.017) (0.023) (0.016) (0.043)
Tertiary Education 0.000 0.034 -0.001 0.128**(0.022) (0.031) (0.020) (0.053)
Married -0.132*** 0.007 -0.100*** -0.257***(0.015) (0.020) (0.014) (0.037)
Urban 0.046*** 0.006 0.026* 0.019(0.015) (0.019) (0.015) (0.039)
Last employmentManufacturing -0.067*** -0.020 -0.039*** -0.109***
(0.015) (0.020) (0.014) (0.038)Public -0.029 -0.033 -0.018 -0.103**
(0.020) (0.024) (0.020) (0.049)
Employment structure at retirementShare of privatized firms -2.597*** -0.557 -1.150*** -1.464***
(0.295) (0.575) (0.288) (0.449)Share of de novo private firms 4.113*** 7.541*** 3.657*** 5.641***
(0.146) (0.298) (0.132) (0.214)Share manufacturing -0.918** -1.145* -1.622*** -6.041***
(0.359) (0.674) (0.359) (0.579)
Employment structure in 1989Share private 0.860*
(0.467)Share manufacturing 3.820***
(0.521)

Can we really explain worker flows in transition economies?
Conclusions
How good are the survival 4: further robustness check - only retirees
All Under 45 Over 45
Female -0.210*** -0.092*** -0.182***(0.013) (0.025) (0.013)
Secondary Education -0.046*** 0.048** -0.021(0.015) (0.024) (0.014)
Tertiary education 0.014 0.078** 0.024(0.019) (0.032) (0.019)
Married -0.080*** 0.005 -0.065***(0.013) (0.021) (0.013)
Urban 0.027* 0.008 0.011(0.014) (0.020) (0.014)
Last employmentManufacturing -0.057*** -0.006 -0.044***
(0.013) (0.020) (0.013)Public -0.025 0.038 -0.023
(0.018) (0.027) (0.019)
Employment share at retirementShare privatized -0.181 -0.095 0.298
(0.173) (0.222) (0.195)Share new firms 0.791*** 1.628*** 1.072***
(0.089) (0.174) (0.096)Share manufacturing -0.608*** -1.218*** -1.720***
(0.233) (0.394) (0.255)
Employment share in 1989Share private 0.008 -0.442 -0.503**
(0.183) (0.271) (0.204)Share manufacturing 0.502** 0.557** 1.470***
(0.211) (0.265) (0.238)
Observations 2,810 853 1,957
Can we really explain worker flows in transition economies?
Conclusions
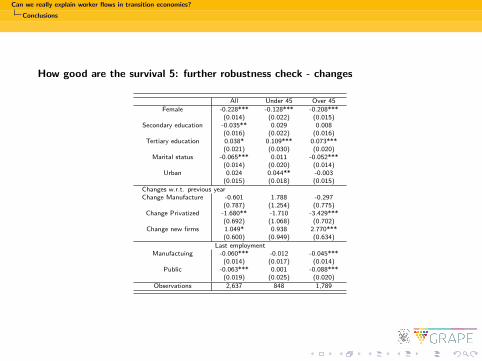
How good are the survival 5: further robustness check - changes
All Under 45 Over 45
Female -0.228*** -0.128*** -0.208***(0.014) (0.022) (0.015)
Secondary education -0.035** 0.029 0.008(0.016) (0.022) (0.016)
Tertiary education 0.038* 0.109*** 0.073***(0.021) (0.030) (0.020)
Marital status -0.065*** 0.011 -0.052***(0.014) (0.020) (0.014)
Urban 0.024 0.044** -0.003(0.015) (0.018) (0.015)
Changes w.r.t. previous yearChange Manufacture -0.601 1.788 -0.297
(0.787) (1.254) (0.775)Change Privatized -1.680** -1.710 -3.429***
(0.692) (1.068) (0.702)Change new firms 1.049* 0.938 2.770***
(0.600) (0.949) (0.634)
Last employmentManufactuing -0.060*** -0.012 -0.045***
(0.014) (0.017) (0.014)Public -0.063*** 0.001 -0.088***
(0.019) (0.025) (0.020)
Observations 2,637 848 1,789