Labour Market Outlook - CIPD › Images › labour-market-outlook_2018-winter … · Report Labour...
37
OUTLOOK Winter 2017–18 VIEWS FROM EMPLOYERS LABOUR MARKET in partnership with
Transcript of Labour Market Outlook - CIPD › Images › labour-market-outlook_2018-winter … · Report Labour...

OUTLOOKWinter 2017–18VIEWS FROM
EMPLOYERS
LABOURMARKET
in partnership with

7
8
9
The CIPD is the professional body for HR and people development. The not-for-profit organisation champions better work and working lives and has been setting the benchmark for excellence in people and organisation development for more than 100 years. It has more than 145,000 members across the world, provides thought leadership through independent research on the world of work, and offers professional training and accreditation for those working in HR and learning and development.

Labour Market Outlook Winter 2017–18
1
1
2
3
4
7
5
8
9
6Contents
Report
Labour Market Outlook Winter 2017–18
1 Foreword from the CIPD 2
2 Foreword from The Adecco Group UK and Ireland 4
3 Recruitment and redundancy outlook 5
4 Pay outlook 11
5 Brexit outlook 14
6 Migration outlook 17
7 Skills outlook 27
8 Survey method 31
9 Endnotes 33

Labour Market Outlook Winter 2017–18
2
1
2
3
4
7
5
8
9
6
1 Foreword from the CIPD
The quarterly CIPD Labour Market Outlook (LMO) provides a set of forward-looking labour market indicators, highlighting employers’ recruitment, redundancy and pay intentions. The survey is based on responses from 2,066 employers. The survey also considers the extent employers have hard-to-fill vacancies and how employers are attempting to tackle skill and labour shortages, including through the employment of EU nationals and through the recruitment of disadvantaged or under-represented groups in the labour market. The report examines the interrelation between migrant worker employment, skills investment and employment practices among UK employers, a significant but often under-reported part of the migration debate. Additionally, this report considers employer attitudes towards the various policy options that the UK Government may be considering to help control the number of migrant workers from the EU through its proposed changes to immigration policy that are due to be unveiled in its forthcoming consultation paper.
EmploymentAccording to the report, the demand for labour in Q1 2018 will remain robust. This quarter’s net employment balance – which measures the difference between the proportion of employers who expect to increase staff levels and those who expect to decrease staff levels in the first quarter of 2018 – has decreased to +16 from +18 over the past three months (Figure 1). This is consistent with official labour market data, which show that the number of vacancies in the UK economy remains well above historical average levels.1 In the projections in this report, employment confidence is highest in the construction (+37), hospitality (+33) and the business services (+30) sub-sectors. On the downside, employment growth looks set to be more modest in healthcare (+6), education (+3) and public administration (–8). Across regions, employment confidence is highest among employers in the north-west of England (+29) and the West Midlands (+19), and lowest among those in Yorkshire and Humberside (+6) and Wales (+3).
Pay In a continuation of recent trends, wage growth is projected to remain subdued in the year ahead according to the survey data. Median basic pay expectations for the year ahead are 2%, which is consistent with recent LMO reports and suggests that there is unlikely to be significant upward pressure on wage growth in the near term at least.
This is despite signs that further labour market expansion is being constrained by a lack of supply of skilled and unskilled staff in some sectors, with about two-thirds of employers reporting they have vacancies which are difficult to fill.
EU migrants Against this backdrop it is not a surprise that a high proportion of organisations continue to employ EU nationals, with two-thirds of employers saying this is the case, against a backdrop of continued albeit slower growth in the number of EU nationals in employment in the UK.
When asked why they recruit EU nationals, by far the most common response by employers is that they don’t consider nationality when hiring but simply choose the best person for the job. The most popular reason given by organisations for recruiting EU nationals is that they cannot find local applicants to fill semi-skilled or unskilled roles from the domestic workforce (see Figure 19) according to this report.
1 Foreword from the CIPD

Labour Market Outlook Winter 2017–18 Labour Market Outlook Winter 2017–18
3
1
2
3
4
7
5
8
9
6
1 Foreword from the CIPD
The research in this report suggests that this difficulty to find sufficient UK-born applicants is not because employers that recruit EU nationals are not making efforts to recruit or train ‘home grown’ workers. The survey shows clearly that organisations that employ EU nationals are significantly more likely than employers that don’t recruit EU nationals to be investing in training and seeking to recruit from a wider range of under-represented or disadvantaged groups, such as older workers or those from minority ethnic backgrounds.
This indicates strongly that organisations that employ EU migrants are typically doing so as part of wider efforts to invest in skills and talent and find the labour they require, not because they are looking to cut costs or are failing to invest in UK-born workers. Consequently, it is highly unlikely that future migration restrictions on EU nationals will act as a catalyst for improving skills investment and the participation rates of under-represented groups in the UK, although it should be recognised that lower pay and employment conditions is the third most popular reason among low-wage employers.
Post-Brexit immigration policy Considering the high proportion of organisations that employ EU nationals and the reasons they do so, it is no surprise that a majority of employers would prefer to see free movement of labour retained rather than have migration restrictions introduced. However, employers’ views vary considerably across regions and sectors. Whereas a substantial majority of employers in Scotland and London favour free movement of labour, opinion is more divided among other regions, especially in the West Midlands, the north-west of England and the south-east of England. Across the board sectors, employers in healthcare and private sector services report that they would prefer to retain free movement of labour than see migration restrictions introduced. Healthcare employers are most likely to favour free movement (60%) over restrictions (22%). In contrast, manufacturing employers are marginally more likely to favour migration restrictions over free movement despite being asked to think about their organisation when responding.
Despite employers’ preference for free movement of labour, it seems inevitable that the Government will introduce migration restrictions post-Brexit that will seek to recruit ‘the brightest and the best’. According to the survey data, employers would like to see the Government extend the existing skills shortage occupation list for non-EU nationals to include a system that caters for low- and high-skilled EU nationals. This reflects employers’ appetite and need to recruit EU nationals to fill low-skilled or unskilled roles (see Table 2). It is also consistent with employers’ preference for a national and simple EU immigration system.2 Relatively few employers express support for other schemes, such as a regional or sectoral scheme. The extent of support for a regional system is much stronger in Scotland, although overall employers based in Scotland still would favour a UK-wide scheme.
SkillsFinally, the survey data underlines the need for government skills policy to boost participation in adult learning in the UK, which remains significantly below that in most other EU countries. As the survey data highlight, the share of organisations that plan to increase their training investment is broadly similar to the proportion of organisations that plan to reduce it, despite the prospect of migration restrictions for non-UK nationals from the EU and a tightening labour market.
One way of boosting investment in training would be to broaden the apprenticeship levy into a more flexible training levy, which would prove popular among employers and make it much more responsive to their skills requirements3 alongside, more significantly, more funding for adult skills via the National Productivity Investment Fund.

Labour Market Outlook Winter 2017–18
4
1
2
3
4
7
5
8
9
6
2 Foreword from The Adecco Group UK and Ireland
2 Foreword from The Adecco Group UK and Ireland
The CIPD/The Adecco Group Labour Market Outlook (LMO) winter 2017–18 report reveals many similarities with the summer 2017 report: namely the high demand for labour (particularly in the near term), and a relatively multi-tiered economy, characterised by vastly differing levels of employment confidence based on region and sector.
However, one of the most startling focus areas for this period is the apathy over training and investment, specifically in the face of a growing skills shortage and potential reduction in the flow of EU nationals.
Indeed, the statistics show that while 72% of employers have a dedicated training budget, growth in this area is comparatively slow. Under a quarter (23%) have increased their training budget over the past two years and 15% have actually decreased it. Similarly, most (54%) expect their training expenditure to remain unchanged over the coming year and 16% will decrease it.
The Brexit factor here is that 55% say that leaving the EU has had no impact on their training and skills development investment, while 20% say it has caused them to reduce it. This shows that some employers are dialling back on development and training, at the very time they should be investing heavily to mitigate against the real risk of the current skills shortage worsening when Brexit takes effect – especially when the report suggests an ongoing issue with skills shortage vacancies, which account for 50% of all hard-to-fill jobs.
But it’s not just labour leaving the UK jobs market that’s at play. There’s also a rising trend in employees being offered substantially higher salaries to move jobs. At 37%, pay rises elsewhere is the biggest driver for expecting pay to rise by 2% or more, and retention issues is second at 33%. Investment in workforce development can simultaneously help improve talent retention and also ensure that an organisation has ready-made replacements if it is unable or unwilling to match the market rate for a candidate.
The key takeaway for this period is that skills and training investment stasis makes very little sense. Whatever Brexit scenario we face, it’s unlikely that resource spent on developing in-situ employees will be wasted. Although organisations may not be able to act decisively at the current time, they can make preparations to ensure they are ready to act swiftly when required. Auditing and mapping talent will help employers understand their talent development needs as well as future recruitment requirements.
With the skills shortage getting worse, and some form of restriction to European labour likely, investment is as safe a bet as anything can be in a fluctuating and uncertain political and employment climate. As you’ll see in the full report, the demand for labour is high, but business cannot just assume the market will be able to meet it – they can’t just stick their heads in the sand.
Alex Fleming, President of General Staffing, The Adecco Group UK&I

Labour Market Outlook Winter 2017–18 Labour Market Outlook Winter 2017–18
5
1
2
3
4
7
5
8
9
6
3 Recruitment and redundancy outlook
Base: Winter 2017–18, all employers (n=2,006)
Change in employment
25
10
15
5
0
200,000
150,000
100,000
50,000
0
–50,000
–100,000
250,000
20
300,000
3
5
89
18 18
21
16 1617
19 1920 20
14 1415
1616
18 18
•
•
••
•
•
•
•
Winte
r 12–
13
Summ
er 13
Spring 14
Spring 15
Spring 16
Spring 17
Summ
er 14
Summ
er 15
Summ
er 16
Summ
er 17
Autum
n 13
Autum
n 14
Autum
n 15
Autum
n 16
Autum
n 17
Winte
r 17–
18
Spring 13
Winte
r 13–
14
Winte
r 14–15
Winte
r 15–
16
Winte
r 16–17
••
• •
•
• •
••
•
• •
•
• CIPD LMO
Figure 1: Correlation between quarterly increase in LFS employment levels4 and LMO data
3 Recruitment and redundancy outlook
What is the short-term employment outlook?This section focuses on the recruitment and redundancy intentions of employers in the first quarter of 2018. This latest report suggests that employers’ demand for labour is likely to remain relatively strong in the near term. This quarter’s net employment balance – which measures the difference between the proportion of employers who expect to increase staff levels and those who expect to decrease staff levels – has fallen to +16 from +18 in autumn 2017. As in recent reports, this figure remains well above the survey’s historical average (Figure 1), which is consistent with the strong growth reported in the official data (Figures 1 and 2). Employment confidence remains much higher in the private sector (+22) and voluntary sector (+20) than in the public sector (–7).

Labour Market Outlook Winter 2017–18
6
1
2
3
4
7
5
8
9
6
3 Recruitment and redundancy outlook
–100
–60
0
–20
–80
–40
20
40
60
80
100
Base: Winter 2017–18, all employers (total: n=2,006; private: n=1,515; public: n=274; voluntary: n=277)
Spring 13
Winter
12–13
Autumn 13
Summer 13
Spring 14
Winter
13–14
Autumn 14
Summer 14
Autumn 15
Summer 15
Winter
15–16
Spring 16
Summer 16
Autumn 16
Winter
16–17
Spring 17
Summer 17
Autumn 17
Winter
17–18
Spring 15
Winter
14–15
Private sector
Public sector
Voluntary sector
Overall net
Figure 2: Overall effect of recruiting new staff and/or making redundancies next three months, by sector
Employment intentions remain strong in manufacturing (+20) and services (+20), which is broadly consistent with the most recent GDP figures. According to the preliminary estimate of GDP for the fourth quarter of 2017, manufacturing grew by 1.3% in the fourth quarter of 2017 and services grew by 0.6%.5
However, there is considerable variation across sub-sectors among employers who responded to the survey (see Figure 3). Employment confidence is highest in the construction (+37),6 hospitality (+33) and business services (+30) sub-sectors. Meanwhile, it is lowest in healthcare (+6), education (+3) and public administration (–8).
Looking across different nations and regions of the UK, employment confidence is highest among employers in the north-west of England (+29) and the West Midlands (+19), and lowest among those in Yorkshire and Humberside (+6) and Wales (+3).

Labour Market Outlook Winter 2017–18 Labour Market Outlook Winter 2017–18
7
1
2
3
4
7
5
8
9
6
3 Recruitment and redundancy outlook
Figure 3: Net employment intentions for the next three months, by sector (%)
Base: Winter 2017–18, all employers [manufacturing (n=182); construction (n=88); education (n=140); healthcare (n=135); wholesale, retail and real estate (n=128); transport and storage (n=61); information and communication (n=134); finance and insurance (n=155); business services (n=253); hotels, catering and restaurants/arts, entertainment and recreation (n=127); public administration and other public sector (n=97); voluntary (n=277)]
Hotels, catering and restaurants/arts, entertainment and recreation
Construction*
Manufacturing
Voluntary
Finance and insurance
Transport and storage*
Wholesale, retail and real estate
Public administration and other public sector*
Healthcare
Education
Information and communication
30
37
20
33
20
19
17
16
12
6
3
–8
Business services (for example consultancy, law, PR, marketing, scientific and technical services)
Figure 4: Net employment intentions for the next three months, by region (%)
Base: Winter 2017–18, all employers north-west of England (n=135); Yorkshire and Humberside (n=113); West Midlands (n=120); East Midlands (n=102); south-west of England (n=157); south-east of England (n=305); Scotland (n=155); Wales (n=60); Eastern England (n=110); London (n=375)]
*Sample size is under n=100
** We were unable to report on Northern Ireland due to a sample size of 19.
North-west of England
West Midlands
London
Eastern England
South-east of England
South-west of England
East Midlands
Scotland
Yorkshire and Humberside
Wales*
Northern Ireland**
+18+18
+29**
+13
+8
+3
+8
+18
+6
+19

Labour Market Outlook Winter 2017–18
8
1
2
3
4
7
5
8
9
6
3 Recruitment and redundancy outlook
Has the strong demand for labour led to an increase in recruitment difficulties? The survey data indicates that the strong demand for labour has led to a tightening labour market and an increase in recruitment difficulties over the past year. Among employers who currently have vacancies in their organisation, the share of organisations that report hard-to-fill vacancies has increased to almost two-thirds (64%) of establishments compared with just over half (56%) of organisations in the spring 2017 report and four in ten (40%) employers in the autumn 2015 report. Care should be taken not to over-interpret this data, however, because of a fall in the density of recruitment difficulties over the same period.
Employers in the public (68%) and private (63%) sectors are more likely than those in the voluntary sector (53%) to report hard-to-fill vacancies, with recruitment difficulties most prevalent in the healthcare sector (76%).
However, the density of recruitment difficulties among organisations with hard-to-fill vacancies has fallen compared with previous recent reports. On average, organisations with hard-to-fill vacancies report that more than a third of their total vacancies (38%) are proving hard to fill, compared with around half of vacancies in the spring 2017 report. The sectors with the highest proportion of total vacancies categorised as hard-to-fill vacancies are manufacturing (40%) and healthcare (44%).7
While SMEs are less likely than larger organisations to have hard-to-fill vacancies in the first instance, among those who do, one in two (51%) of their total vacancies are proving hard to fill. This compares with 33% of the total vacancies among large organisations with 250+ employees.
64
32
4
No
Yes
Don’t know
Base: Winter 2017–18, all employers who currently have vacancies (n=1,038)
Figure 5: Proportion of organisations with current vacancies who have hard-to-fill vacancies (%)

Labour Market Outlook Winter 2017–18 Labour Market Outlook Winter 2017–18
9
1
2
3
4
7
5
8
9
6
3 Recruitment and redundancy outlook
When looking at the overall population of employers, including those who have not reported any current vacancies, around one in three (35%) state they have a hard-to-fill vacancy. Looking at the sub-sectors in more detail, recruitment difficulties are highest in healthcare (47%), public administration (39%), manufacturing (38%) and education (37%) and lowest in the transport and storage sector (27%).8
Public administration and other public sector*
Healthcare
Education
Finance and insurance
Construction*
Voluntary
Hotels, catering and restaurants/arts, entertainment and recreation
Transport and storage*
Information and communication
Wholesale, retail and real estate
Business services (for example consultancy, law, PR, marketing, scientific and technical services)
38
47
37
39
34
34
33
32
31
31
30
27
Manufacturing
Base: Winter 2017–18, all employers [manufacturing (n=182); construction (n=88); education (n=140); healthcare (n=135); wholesale, retail and real estate (n=128); transport and storage (n=61); information and communication (n=134); finance and insurance (n=155); business services (n=253); hotels, catering and restaurants/arts, entertainment and recreation (n=127); public administration and other public sector (n=97); voluntary (n=277)]
*Note: Sample size is under n=100
Figure 6: Proportion of total population of employers who have hard-to-fill vacancies, by sector (%)

Labour Market Outlook Winter 2017–18
10
1
2
3
4
7
5
8
9
6
3 Recruitment and redundancy outlook
However, there is considerable variation across regions. The incidence of hard-to-fill vacancies among employers is highest in eastern England (50%), Wales (40%) and Scotland (39%). Meanwhile, the share of employers reporting recruitment difficulties is lowest in the East Midlands (21%) and Yorkshire and Humberside (24%).
Base: Winter 2017–18, all employers [north-west of England (n=135); Yorkshire and Humberside (n=113); West Midlands (n=120); East Midlands (n=102); south-west of England (n=157); south-east of England (n=305); Scotland (n=155); Wales (n=60); Eastern England (n=110); London (n=375)]
*Note: Sample size is under n=100
The sample sizes in north-east of England and Northern Ireland are too low to analyse.
Yorkshire and Humberside
North-west of England
East Midlands
Eastern England
South-west of England
South-east of England
Scotland
Wales*
London
38
26
21
24
50
36
29
37
39
40
West Midlands
Figure 7: Proportion of total population of employers who have hard-to-fill vacancies, by region (%)
To what extent are organisations experiencing skills-shortage vacancies? It seems that a lack of skills, qualifications or experience amongst applicants is a key reason for employers’ recruitment difficulties. Half (50%) of hard-to-fill vacancies were reported to be skills-shortage vacancies compared with six in ten employers in the spring 2017 report and the four in ten establishments in the autumn 2015 report. However, it is perhaps no surprise that the density of skills-shortage vacancies is higher among high-wage organisations (59%) than among medium-wage organisations (49%) or low-wage organisations (42%).9

Labour Market Outlook Winter 2017–18 Labour Market Outlook Winter 2017–18
11
1
2
3
4
7
5
8
9
6
4 Pay outlook
What is likely to happen to wage settlements in the next 12 months?Many economic commentators predict that the recent tightening in the labour market is likely to lead to greater upward pressure on wage growth. However, as in previous reports, the survey data suggest that the long-run trend of a tightening labour market will continue to put only limited upward pressure on wage settlements in the year ahead at least. Employers’ median basic pay increase expectations in the 12 months to December 2018 is 2%, which is consistent with recent reports. As in previous reports, median basic pay increase expectations are higher in the private sector (2%) than in the public (1%) and voluntary (1.5%) sectors (Figure 8). Median basic pay expectations in manufacturing and services are also 2%.
At the same time, the report’s average basic pay expectations indicator (the report’s less preferred measure) shows that basic pay expectations have fallen slightly to 1.8% from 2.1% over the past three months.
The data is also consistent with the backward-looking data in this report, which indicates that the median basic pay award among employers that have conducted a pay review in 2017 is also 2%.
Overall, the survey data is broadly consistent with other survey indicators – most notably the Bank of England’s agents’ survey, which recently noted that ‘growth had only increased a little, reflecting greater focus on non pay benefits, a limited number of pay reviews in Q4, and rising input costs’.10
4 Pay outlook
4
5
2
3
–1
Base: Winter 2017–18, all employers who report an expected increase, decrease or pay freeze in the next 12 months (total n=929: private n=626: public n=155: voluntary n=148)
Public sector
Private sector
Voluntary sectorOverall – net
1
0
Summer 12
Winter
12–13
Summer 13
Winter
13–14
Summer 14
Winter
14–15
Summer 15
Summer 16
Summer 17
Winter
15–16
Winter
16–17
Spring 12
Autumn 12
Spring 13
Autumn 13
Spring 14
Autumn 14
Spring 15
Spring 16
Spring 17
Autumn 15
Autumn 16
Autumn 17
2.22.0
1.5
2.0
1.0 1.0 1.0 1.0
1.0 1.0 1.0 1.0 1.0 1.0
1.5 1.51.4 1.41.1
1.5
1.0
1.0
2.0
1.1
1.71.2
2.01.8
1.0 1.0
1.5 1.51.5 1.5
1.81.41.9
2.0 2.0 2.0 2.0 2.0
2.0
2.0
2.02.0
1.51.9
1.0 1.0
0.0
1.0 1.0 1.01.0 1.0
1.0 1.0 1.0 1.0 1.0 1.0 1.01.0 1.0 1.0
1.0 1.01.01.0
0.0
1.0
0.0
2.0
2.0
2.0
2.0 2.0
2.0
2.0
2.0 2.0 2.0 2.0 2.0 2.0 2.02.02.0 2.0 2.0
2.0
2.0
Winter
17–18
Figure 8: Average predicted annual basic pay awards (median), by business sector

Labour Market Outlook Winter 2017–18
12
1
2
3
4
7
5
8
9
6
4 Pay outlook
Around half (46%) of LMO employers who are planning to make a pay decision in the next 12 months expect basic pay to increase at their organisation during that timeframe. Meanwhile, the proportion of employers that intend to freeze pay has fallen from almost one in five (18%) employers to almost one in ten employers (9%) over the past six months. This is primarily driven by a lower proportion of public sector employers that expect to freeze pay in the year ahead.
Among those employers that can estimate their next basic pay award, the survey data indicate that nearly a third (31%) of LMO employers anticipate a basic pay increase of 2–2.99%, while over a quarter (26%) of LMO employers plan to give a basic pay increase of 1–1.99%. Additionally, close to a fifth of employers expect basic pay to increase by 3–3.99% (16%). Ten per cent of employers anticipate basic pay rising by 4% or more in the 12 months to August 2018.
Hard to tell; it will depend on our organisational performance/don’t know
Increase We will have a pay freeze Decrease
Base: Winter 2017–18, all employers who expect a pay decision in the next 12 months (total n=1,725: private n=1,241: public n=239: voluntary n=245)
Winter2017–18
Winter2017–18
Winter2017–18
Spring2017
Spring2017
Spring2017
Summer2017
Summer2017
Summer2017
Public sector Private sector Voluntary sector
Autumn2017
Autumn2017
Autumn2017
32
15
1
52
24
18
1
57
32
11
2
56
34
9
56
35
7
37
9
34
8
36
121
56
10
33
49
7
42
48
82
42
47
9
43
1 1 2 2 2
56 51 58 52
Figure 9: Likelihood of a basic pay increase, decrease or pay freeze, by business sector (%)

Labour Market Outlook Winter 2017–18 Labour Market Outlook Winter 2017–18
13
1
2
3
4
7
5
8
9
6
4 Pay outlook
40
50
1 01 1
60
30
20
10
0
–4.0+
Figure 10: Distribution of forward-looking basic pay settlements (%)
Autumn 2017
Winter 2017–18
Summer 2017
Base: All employers who report an expected increase, decrease or pay freeze in the next 12 months (winter 2017–18: n=929; autumn 2017: n=911; summer 2017: n=436)
Base: Winter 2017–18, all employers who expect their organisation’s basic pay will increase by 2% or more (n=532)
1
16
26
31
16
10
31
11 1014
30
1 0 100 01 1
23
34
22
118
00 01
–3.0–3
.99
–2.0–2
.99
–1.0–1.
99
–0.1–
0.99
Pay fr
eeze
0.1–0.99
1.0–1.
99
2.0–2
.99
3.0–3
.994.0+
What are the key factors behind employers’ basic pay decisions? Despite the absence of upward pressure in wage growth reported in this survey, external labour market and economic conditions will continue to put upward pressure on pay for some organisations (Figure 11). Among employers that plan to award a pay increase of 2% or more, nearly two in five (37%) say this is because they need to match the going rate of pay elsewhere. A third (33%) of employers cite recruitment and retention pressures and the current rate of inflation (32%) as reasons for planning to raise pay by 2% or more in the year ahead.
0 5 10 15 20 25 30 35 40
33
37
32
28
22
20
19
15
14
11
10
Organisation’s ability to pay more
Recruitment and retention issues
The ‘going rate’ of pay rises elsewhere
Current official rate of inflation
Anticipated future increase in inflation rate
Movement in market rates
The National Living Wage
Pay catch-up, following modest pay increases, freezes or cuts in recent years
The ‘ripple effect’ of higher starting salaries
Union/staff pressures
Improved employee productivity and performance
Figure 11: Key factors behind basic pay award increases of 2% or more (%)

Labour Market Outlook Winter 2017–18
14
1
2
3
4
7
5
8
9
6
5 Brexit outlook
Among employers that predict that average basic pay will increase at their organisation by less than 2%, or not increase at all, over four in ten employers (41%) say that the key reason why they cannot match the inflation rate target is restraint on public sector pay – the vast majority of whom (81%) are public sector employers. The other key reason is affordability (33%).
Additionally, nearly a fifth (16%) of employers who predict pay increases of less than 2% cite uncertainty around the UK’s future access to the EU market as a factor behind restricting pay increases (see Figure 12).
Figure 12: Main factors that are restricting organisations’ ability to match the inflation rate target of 2% (%)
Base: Winter 2017–18, all employers who expect their organisation’s basic pay will increase by less than 2%, be frozen, or decrease (n=397)
0 5 10 15 20 25 30 35 40 45
Organisation’s inability to pay more
Restraint on public sector pay
The National Living Wage
Other labour costs (for example national insurance contributions, pensions contributions)
Anticipated continuation of current rate of inflation
The ‘going rate’ of pay rises elsewhere
To absorb the cost of the introduction of auto-enrolment pensions scheme
The introduction of the apprenticeship levy in April 2017
Current official rate of inflation
Uncertainty about future access to the EU market
41
33
16
13
13
11
10
9
7
9
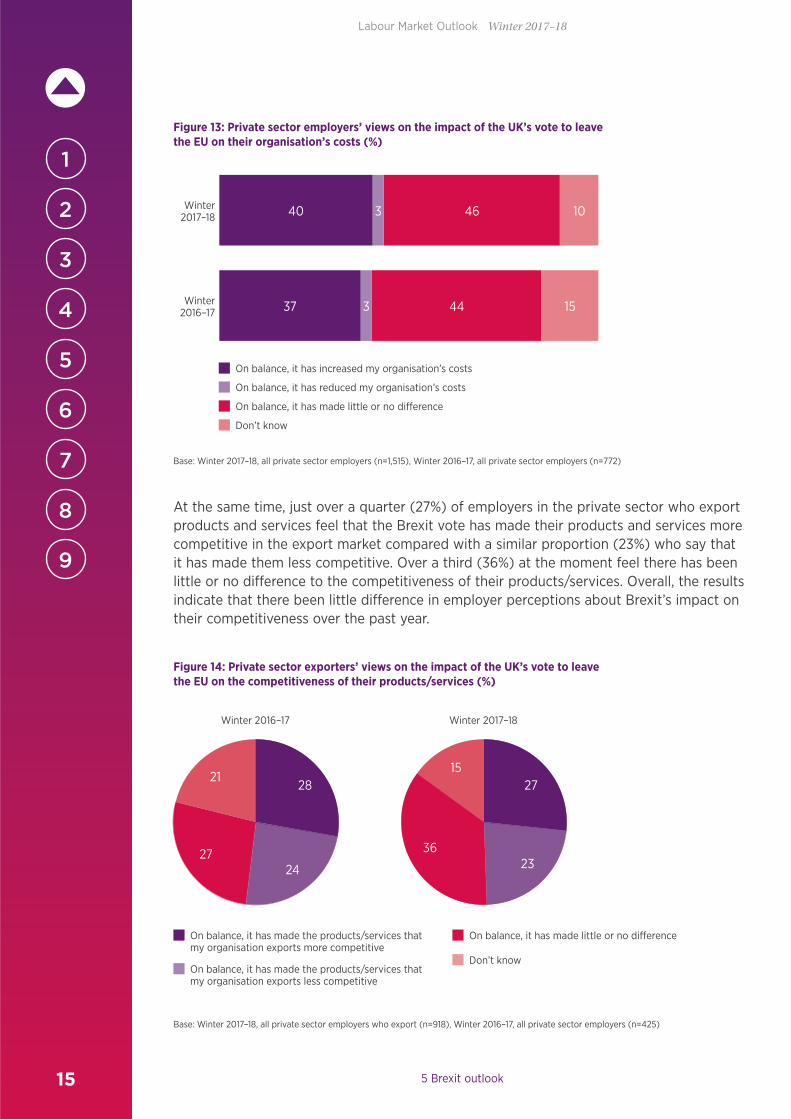
5 Brexit outlookImpact of BrexitReflecting higher import prices stemming from the past depreciation of sterling that followed the UK’s decision to leave the European Union, four in ten private sector employers (40%) report that the Brexit vote has increased costs at their organisation. However, nearly half feel that on balance the vote has made little or no difference to their organisation’s costs. Overall, the figures remain broadly consistent with the winter 2016–17 report (see Figure 13).
Labour Market Outlook Winter 2017–18 Labour Market Outlook Winter 2017–18
15
1
2
3
4
7
5
8
9
6
5 Brexit outlook
Base: Winter 2017–18, all private sector employers (n=1,515), Winter 2016–17, all private sector employers (n=772)
On balance, it has reduced my organisation’s costs
On balance, it has increased my organisation’s costs
On balance, it has made little or no difference
Don’t know
Winter2017–18
Winter2016–17
40
37
46
44
3
3
10
15
Figure 13: Private sector employers’ views on the impact of the UK’s vote to leave the EU on their organisation’s costs (%)
At the same time, just over a quarter (27%) of employers in the private sector who export products and services feel that the Brexit vote has made their products and services more competitive in the export market compared with a similar proportion (23%) who say that it has made them less competitive. Over a third (36%) at the moment feel there has been little or no difference to the competitiveness of their products/services. Overall, the results indicate that there been little difference in employer perceptions about Brexit’s impact on their competitiveness over the past year.
Figure 14: Private sector exporters’ views on the impact of the UK’s vote to leave the EU on the competitiveness of their products/services (%)
On balance, it has made the products/services that my organisation exports less competitive
On balance, it has made the products/services that my organisation exports more competitive
On balance, it has made little or no difference
Don’t know
Base: Winter 2017–18, all private sector employers who export (n=918), Winter 2016–17, all private sector employers (n=425)
28 2721
15
27 36
24 23
Winter 2016–17 Winter 2017–18

Labour Market Outlook Winter 2017–18
16
1
2
3
4
7
5
8
9
6
5 Brexit outlook
Some survey indicators (Bank of England) indicate that the UK’s decision to leave the European Union has weighed on private sector investment intentions.11 However, the majority of private sector LMO employers report that the Brexit vote has had no impact on their level of investment in equipment/technology. Almost one in five (19%) employers say that it has had a negative impact, which is almost offset by a similar proportion who report that it has weighed on investment in physical capital.
Perhaps reflecting the positive impact the depreciation in sterling has had on export capacity in the manufacturing sector, a fifth (20%) of manufacturers say that they have increased their investment in physical capital compared with just over one in ten (13%) services’ firms.
Base: Winter 2017–18, all private sector employers (n=1,515), Winter 2016–17, all private sector employers (n=772)
Base: Winter 2017–18, all private sector employers (n=1,515), Winter 2016–17, all private sector employers (n=772)
Figure 15: Private sector employers’ views on the impact of the UK’s vote to leave the EU on their investment in equipment/technology (%)
Figure 16: Private sector employers’ views on the impact of the UK’s vote to leave the EU on their investment in workforce training and skills development (%)
On balance, my organisation has increased its investment in equipment/technology
On balance, my organisation has reduced its investment in equipment/technology
On balance, it has made little or no difference
Don’t know
Winter2017–18
Winter2016–17
19
15
55
59
15
11
11
16
15 19
12
1113
5561
15
Winter 2016–17 Winter 2017–18
On balance, my organisation has increased its investment in workforce training and skills development
On balance, my organisation has reduced its investment in workforce training and skills development
On balance, it has made little or no difference
Don’t know

Labour Market Outlook Winter 2017–18 Labour Market Outlook Winter 2017–18
17
1
2
3
4
7
5
8
9
6
6 Migration outlook
Additionally, it seems that the Brexit vote has had little overall impact on skills investment levels to date. More than half (55%) of employers report that Brexit has had no impact on their investment in workforce training and skills development, although a fifth (19%) do feel the Brexit vote has meant they reduced their investment in workforce training – an increase from the 15% who reported this in winter 2016–17.
6 Migration outlookThe UK’s decision to leave the European Union has generated considerable debate about the future of EU immigration policy in the UK. On the one hand, various business groups and public sector employer bodies claim that free movement of EU migrant labour has been essential to allowing UK establishments to fill skill and labour shortages. On the other hand, there is considerable public concern that overall immigration levels are too high.12 The Government has reiterated its intention to reduce net migration to the tens of thousands and to end free movement of labour. As a result, there is no doubt that the UK Government will seek to control the number of migrant workers from the EU through its proposed changes to immigration policy due to be unveiled in its forthcoming consultation paper.
To help inform the debate, this section of the report examines employer attitudes towards various policy options while looking at the interrelation between migrant worker employment, skills investment and HR employment practices among UK employers – which is a significant but often under-reported part of the migration debate.
Employer attitudes to free movement of labourIt is no surprise that a majority (54%) of employers are in favour of continued free movement of labour, compared with just around one in three (29%) establishments that favour restrictions.
However, there is considerable variation across sectors. For example, just over half of private services organisations (51%) report they favour free movement compared with fewer than one in three (33%) that support migration controls when asked to think about their organisation. Perhaps reflecting the high proportion of healthcare employers reporting recruitment difficulties, healthcare employers are most likely to favour free movement (60%) over restrictions (22%).
In contrast, a small majority of manufacturing employers judge that migration restrictions are preferable to free movement of labour, despite being asked to think about their organisation. Over two in five (44%) manufacturing establishments would prefer to see migration restrictions for their organisation compared with just over two in five (42%) who would prefer free movement.
In addition, there is some variation across regions. The majority of employers in London (66%) and Scotland (62%) would prefer to retain free movement of labour. However, other regions in the UK are more enthusiastic about controls over the movement of EU labour into the UK, especially in the West Midlands (41%), the north-west of England (40%) and the south-east of England (39%), compared with a survey average of 29%.
Additionally, the survey data captures the difference in attitudes between employers that employ EU nationals and those that don’t. Around six in ten (60%) employers who employ

Labour Market Outlook Winter 2017–18
18
1
2
3
4
7
5
8
9
6
6 Migration outlook
EU nationals favour free movement, compared with just over a third (34%) of employers who don’t employ EU nationals.
Across firms, almost six in ten (56%) large firms favour free movement of labour compared with just under half of SMEs (44%), which may be partly explained by the higher share of large organisations that employ EU nationals.
Employers’ policy preferencesWhen asked which policies employers would favour the most if migration restrictions were introduced, one clear conclusion emerges from the survey data. The survey data indicates a clear support for a UK-wide immigration system that is based on national labour or skills-shortage occupations. More than two in five (41%) said that this was their preferred option (Table 2).
In contrast, around one in ten (13%) report that they would favour a sectoral policy and just one in twenty (5%) would back a regional policy. This is consistent with recent research,13 which indicated that employers were sceptical about the preferential arrangements certain sectors and regions would enjoy over others, especially among employers in the north of England. Employers were also concerned about the additional cost and complexity such a system would cause, especially among multi-site organisations.
Nonetheless, the support for different immigration policies was more broad-based among Scottish employers, with almost one in five (19%) employers favouring a regional system compared with just under one in three (29%) employers who would like to see a national labour or shortage occupation list. Other less popular policy options included an age-specific system that gives preferential treatment to younger nationals (2%) and a seasonal system (2%). Additionally, around one in five employers (21%) were unable to give an answer, while around one in seven (14%) employers did not like any of the policy options put forward in the survey questionnaire.
Table 1: LMO employers’ views on free movement of labour (%)
Favour free movement of labour
Favour controls on movement of labour
All 54 29
Manufacturing 42 44
Private sector services 53 31
London 66 21
Scotland 62 23
West Midlands 41 41
North-west of England 42 40
Employ EU nationals 63 23
Don’t employ EU nationals 34 47
Base: Winter 2017–18, all employers (total: n=2,006; private: n=1,515; public: n=274; voluntary: n=277)

Labour Market Outlook Winter 2017–18 Labour Market Outlook Winter 2017–18
19
1
2
3
4
7
5
8
9
6
6 Migration outlook
Table 2: EU immigration policy that employers would favour most if migration restrictions are introduced (%)
A regional immigration policy that gives preferential arrangements to some regions over others 5
A sectoral immigration policy that gives preferential arrangements to some sectors over others 13
A UK-wide immigration system that gives preferential arrangements to employers based on national labour or skills-shortage occupations
41
An age-specific system that gives preferential arrangements to younger EU nationals 2
A seasonal system 2
Other 2
None of these 14
Don’t know 21
Base: Winter 2017–18, all employers (total: n=2,006; private: n=1,515; public: n=274; voluntary: n=277)
Another migration restriction that has been discussed is the idea of putting limits on the amount of time EU migrants can stay in the UK if they enter the country post-Brexit. The evidence in the survey suggests that most employers would want any limit on the time EU nationals can spend in the UK post-Brexit to be longer than three years. Seven in ten (70%) employers say their ability to employ EU nationals would be restricted if such workers were limited to staying in the UK for a period of between two and three years.
In contrast, just over one in ten employers (13%) report that their ability to employ EU citizens would not be restricted as most of their EU workers stay less than two to three years and/or are newly arrived.
Table 3: Share of employers that say that restricting the amount of time EU nationals can spend in the UK to two to three years would be a constraint on employers’ ability to employ EU nationals (%)
All employers
Manufacturing and production Education Healthcare
Private sector services
Public administration
and defence
Yes – most of our EU workers stay at least 2–3 years in the job and/or have previous UK work experience
70 69 80 68 69 67
No – most of our EU nationalsstay for less than 2–3 years and/or are newly arrived
13 15 4 13 16 9
Don’t know 17 16 16 18 15 25
Base: Winter 2017–18, all employers that employ EU nationals (total: n=1,390; private: n=979; public: n=331; voluntary: n=80)
Representation of EU nationals across organisationsA third of LMO employers (33%) report that EU nationals in their organisation have a particularly large representation in certain occupations/functions. Reflecting the occupational profile of EU nationals in employment (ONS), around a third of employers report that EU nationals are more likely to be in professional occupations (32%) while over a quarter (27%) say that EU nationals are more likely to be employed in elementary occupations (Figure 17).

Labour Market Outlook Winter 2017–18
20
1
2
3
4
7
5
8
9
6
6 Migration outlook
Base: Winter 2017–18, all employers who say EU nationals have a particularly large representation in certain occupations (n=439)
0 5 10 15 20 25 30 35
32
27
20
19
19
18
18
14
11
10
Skilled trades occupations
Professional occupations
Elementary occupations (for example cleaners, catering assistants, hotel porters, etc)
Managers, directors and senior officials
Caring, leisure and other service occupations
Administrative and secretarial occupations
Associate professional and technical occupations
Sales and customer service occupations
Other
Process, plant and machine operatives
Figure 17: Occupational profile of EU nationals (%)
Recruitment methodsAccording to the survey data, corporate websites are the most common recruitment method employers use to recruit EU nationals. More than half (54%) of employers use their website to attract applicants, although their use varies across sectors. More than two-thirds (68%) of public sector employers and voluntary sector organisations (72%) use this method compared with less than half (48%) of private sector firms.
In contrast, private sector employers are more likely to use recruitment consultancies to recruit EU nationals, which is the second most popular recruitment channel for hiring EU nationals. Overall, almost two in the five (39%) employers use recruitment agencies based in the UK to hire EU nationals. However, it is more prevalent in the private sector (42%) than in the public sector (32%) and voluntary sector (26%). In addition, more than a fifth (22%) of employers use recruitment agencies in the home country of EU nationals.
Other popular recruitment channels include professional networking websites (35%), job referral schemes/word of mouth (30%) and social networking sites such as Facebook (26%). This is particularly popular among healthcare (30%) and retail (30%) employers.
In terms of sub-sectors, apprenticeships are a more commonly used recruitment method in the manufacturing and production sector than they are in the service sector (28% versus 19%). In addition, employers in the service sector are more likely than those in the manufacturing and production sector to be using social networking (27% versus 19%), word of mouth (36% versus 29%) and their own website (53% versus 38%).

Labour Market Outlook Winter 2017–18 Labour Market Outlook Winter 2017–18
21
1
2
3
4
7
5
8
9
6
6 Migration outlook
Base: Winter 2017–18, all employers (n=2,066)
0 5 10 15 20 25 4030 4535 50 55
30
54
24
39
23
35
22
22
20
17
14
13
4
Specialist journals/trade press
Social networking websites (for example Facebook)
Job referral scheme/word of mouth
Professional networking websites (for example LinkedIn)
Recruitment agency based in the UK
Our own website
Local newspapers (online or in print)
Recruitment agency/consultant in home country
Jobcentre Plus
Apprenticeships
National newspapers (online or in print)
Other
Links with schools/colleges/universities
Figure 18: Recruitment methods used for roles that EU nationals could apply for (%)
Word of mouth (41%) and social media recruitment (38%) is also more prominent in the hotels, catering and arts sector than in other sectors. In contrast, the business services sector and the finance sector are more likely to use recruitment agencies based in the UK and professional networking sites than other sectors.
A relatively small proportion of LMO employers are using links with schools, colleges or universities to recruit EU nationals.
Reasons for employing EU nationalsThe survey data provides evidence that most employers do not base their recruitment practices and decisions on a conscious strategy to encourage or discourage the employment of migrants based on predetermined judgements or assumptions about the suitability of UK-born or EU migrant workers. This is reflected by the relatively high proportion (38%) of employers who are unable to identify a reason for employing EU nationals because they simply select the best person for the role.

Labour Market Outlook Winter 2017–18
22
1
2
3
4
7
5
8
9
6
6 Migration outlook
Labour shortagesConsistent with previous research,14 the most commonly mentioned reason cited by survey respondents for employing EU migrant workers is an inadequate supply of UK-born labour, especially for low-skilled roles and among low-wage employers. Almost a fifth of employers (18%) cite a ‘difficulty in attracting UK-born candidates to fill unskilled or semi-skilled jobs’ as the reason for recruiting EU nationals (see Figure 19). It is perhaps no surprise that almost three in ten (28%) low-wage employers say they recruit EU nationals because they cannot fill the positions with UK-born applicants.
Apart from difficulties finding candidates for low-skilled jobs, the next most frequently cited reason given by surveyed employers for employing migrant workers is because of their better work ethic or higher levels of motivation (17%). Work ethic is more commonly mentioned by private sector employers (20%) than public sector (8%) and voluntary sector employers. Additionally, almost one in four (23%) low-wage employers cite work ethic. This is also consistent with previous research,15 which indicated that where differences are reported between the work ethic of EU and British workers, it is most often in relation to EU nationals’ superior flexibility, especially in relation to their willingness to work additional hours.
Job-specific/technical skills Reflecting the relatively high share of EU nationals that are in highly skilled positions in the UK workforce, the third most important reason for employing EU migrant labour is to use their job-specific or technical knowledge (16%). More than a fifth (21%) of high-wage employers say that skills is a key factor behind their decision to employ EU nationals.
Challenging common assumptions, the survey finds that a relatively low proportion (6%) of employers employ EU nationals because they have lower expectations towards pay and employment conditions. However, around one in seven (14%) low-wage employers say that this is a key reason why they employ EU nationals.16
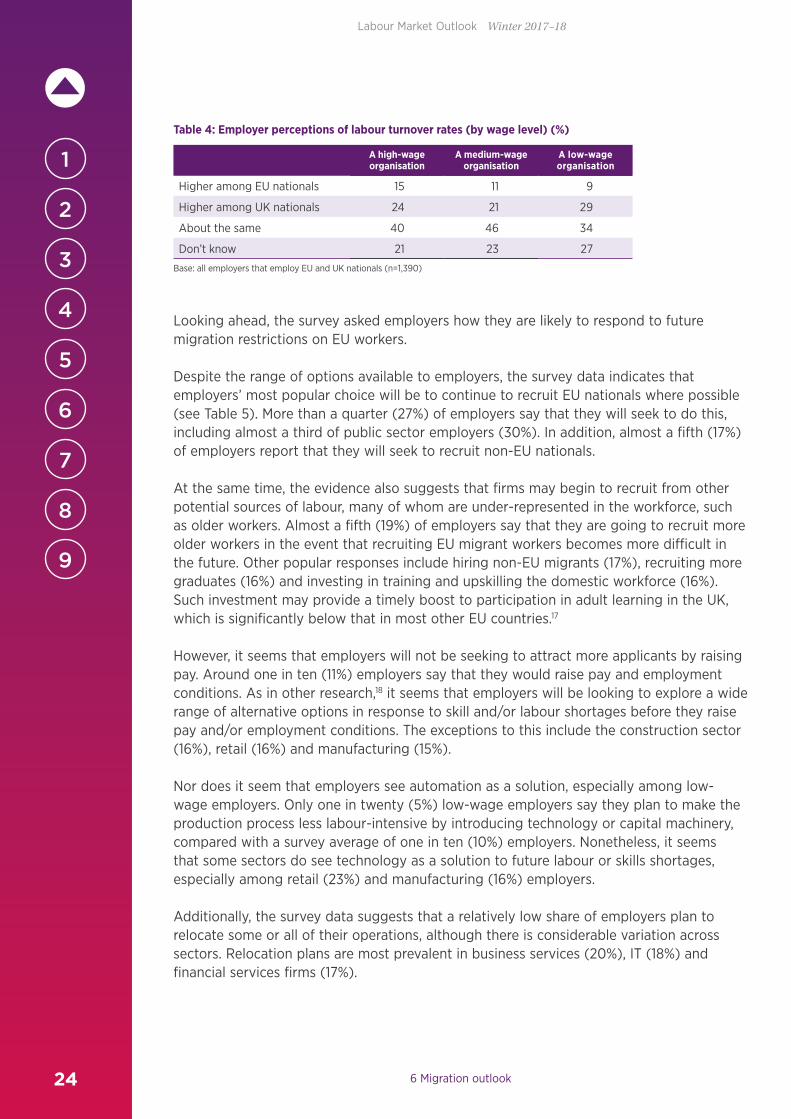
Employer perceptions of labour turnover rates Another factor that can help explain why organisations employ EU nationals is the perception among employers that EU nationals tend to stay with them longer. Almost a third (30%) of organisations that could provide an answer believe that labour turnover rates are higher among UK citizens, compared with 15% of organisations who believe that churn rates are higher among EU workers. Nonetheless, a majority (55%) of establishments report no difference.
It seems that low-skilled sectors are more likely to report higher labour turnover rates among UK nationals (see Table 4), especially hospitality (43%) and retail (41%). Meanwhile, some sectors, such as manufacturing and construction, report that turnover rates are modestly higher among EU nationals.
It seems that low-skilled sectors are more likely to report higher labour turnover rates among UK nationals (see Table 4), especially hospitality (43%) and retail (41%). Almost one in three (29%) low-wage employers say that labour turnover rates are higher among UK nationals compared with around one in ten low-wage employers who report that labour turnover rates are higher among UK nationals. Meanwhile, some sectors, such as manufacturing and construction, report that turnover rates are modestly higher among EU nationals.

Labour Market Outlook Winter 2017–18 Labour Market Outlook Winter 2017–18
23
1
2
3
4
7
5
8
9
6
6 Migration outlook
Base: Winter 2017–18, all employers who employ EU nationals (n=1,207)
0 5 10 15 20 25 30 35 40
Better work ethic/motivation
We have difficulty attracting UK-born applicants to fill unskilled or semi-skilled jobs
Not applicable – we do not consider nationality when making hiring decisions, we just choose the best person for the job
Commitment to or fit with the organisation’s values/behaviours
Language skills
Lower expectations about pay and employment conditions
More work experience
IT skills
Better generic or soft skills (for example oral communication, teamworking)
Basic skills (literacy and numeracy)
Other
Lower labour turnover
Better qualifications
16
18
38
14
17
9
8
6
6
5
5
4
3
3
Better job-specific, practical or technical knowledge
Figure 19: Reasons given by LMO employers as to why they employ EU nationals (%)
3055
15
Higher among UK nationals
Higher among EU nationals
About the same
Base: Winter 2017–18, all employers who employ EU nationals and could provide an answer (n=867)
Figure 20: Perceptions of labour turnover rates between EU nationals and UK nationals (%)
Labour Market Outlook Winter 2017–18
24
1
2
3
4
7
5
8
9
6
6 Migration outlook
Looking ahead, the survey asked employers how they are likely to respond to future migration restrictions on EU workers.
Despite the range of options available to employers, the survey data indicates that employers’ most popular choice will be to continue to recruit EU nationals where possible (see Table 5). More than a quarter (27%) of employers say that they will seek to do this, including almost a third of public sector employers (30%). In addition, almost a fifth (17%) of employers report that they will seek to recruit non-EU nationals.
At the same time, the evidence also suggests that firms may begin to recruit from other potential sources of labour, many of whom are under-represented in the workforce, such as older workers. Almost a fifth (19%) of employers say that they are going to recruit more older workers in the event that recruiting EU migrant workers becomes more difficult in the future. Other popular responses include hiring non-EU migrants (17%), recruiting more graduates (16%) and investing in training and upskilling the domestic workforce (16%). Such investment may provide a timely boost to participation in adult learning in the UK, which is significantly below that in most other EU countries.17
However, it seems that employers will not be seeking to attract more applicants by raising pay. Around one in ten (11%) employers say that they would raise pay and employment conditions. As in other research,18 it seems that employers will be looking to explore a wide range of alternative options in response to skill and/or labour shortages before they raise pay and/or employment conditions. The exceptions to this include the construction sector (16%), retail (16%) and manufacturing (15%).
Nor does it seem that employers see automation as a solution, especially among low-wage employers. Only one in twenty (5%) low-wage employers say they plan to make the production process less labour-intensive by introducing technology or capital machinery, compared with a survey average of one in ten (10%) employers. Nonetheless, it seems that some sectors do see technology as a solution to future labour or skills shortages, especially among retail (23%) and manufacturing (16%) employers.
Additionally, the survey data suggests that a relatively low share of employers plan to relocate some or all of their operations, although there is considerable variation across sectors. Relocation plans are most prevalent in business services (20%), IT (18%) and financial services firms (17%).
Table 4: Employer perceptions of labour turnover rates (by wage level) (%)
A high-wage organisation
A medium-wage organisation
A low-wage organisation
Higher among EU nationals 15 11 9
Higher among UK nationals 24 21 29
About the same 40 46 34
Don’t know 21 23 27
Base: all employers that employ EU and UK nationals (n=1,390)

Labour Market Outlook Winter 2017–18 Labour Market Outlook Winter 2017–18
25
1
2
3
4
7
5
8
9
6
6 Migration outlook
The debate about how employers plan to respond to restrictions on EU migrants also increases the focus on the efforts organisations make to recruit from under-represented groups in the UK’s labour market. The survey explored the extent employers are already trying to recruit from such groups and also whether these efforts are likely to intensify over the next three years.
Despite the underlying trend in unemployment, it seems that some firms are still reluctant to recruit from many groups that are under-represented in the workforce. On the one hand, more than half (60%) of employers have recruited people aged 50–64 during the past three years, while a similar share of employers say they have recruited from black, Asian or ethnic minority backgrounds (see Table 6). However, it seems that some employers are not exploiting other potential sources of labour, especially in the private sector.
Fewer than one in five (17%) employers say they have hired somebody aged 65 and over (17%), although there is some variation across sectors. More than a quarter (28%) of private sector employers say they have recruited from within this cohort during the past two years, compared with just one in seven (14%) private sector employers who report that they have recruited from this group during the same period. Across sub-sectors, the hiring rate of older workers over the past two years is highest in public administration (29%) and healthcare (24%). In contrast, around one in ten employers in the IT (9%), finance (11%) and hospitality (11%) sectors have recruited from this group.
The potential to increase the participation rate of people aged 65 and over is underlined by OECD data, which suggest that the participation rate of people aged 65 and over is lower in the UK (10.7%) than the OECD average (14.5%).19
Table 5: Employer responses to migration restrictions (%)
Continue to recruit EU nationals where possible 27
Seek to retain older workers 19
Recruit from outside the EU 17
Recruit more UK graduates 16
Invest more in training and upskilling existing staff 16
Recruit more apprentices 13
Build closer links with local schools and colleges to boost talent pipeline 11
Increase pay to attract more UK nationals 11
Leave positions unfilled 10
Invest more in new technology/equipment 10
Consider relocating some or all of our operations abroad 9
Recruit more school-leavers 8
Scale back/reduce business activity/service levels 7
Create more apprenticeships for existing staff 7
Hire more university or school students on a part-time basis 5
Other 2
None of these 16
Don’t know 22

Labour Market Outlook Winter 2017–18
26
1
2
3
4
7
5
8
9
6
6 Migration outlook
People with disabilities are another source of labour which is not being exploited fully by employers. Just over a third (37%) of employers say they have recruited people with a disability over the past two years. However, as in many other groups, hiring rates are higher in the public sector (50%) compared with the private sector (30%). This comes at a time when the Government wants to improve the participation rate of many under-represented groups, especially the disabled.
Additionally, the low proportion of employers that have hired long-term unemployed (17%) implies some further labour market slack. Hiring rates are highest in healthcare (26%), retail (21%) and public administration and defence (20%) and lowest in business services (8%) and IT (9%) (see Table 6).
Looking ahead, the survey data helps to paint a similar picture of future hiring intentions, despite the falls in unemployment over the past year. On the plus side, a modestly higher number of employers plan to hire people with a history of long-term unemployment, ex-offenders and war veterans in the next three years, compared with the proportion of employers that say that they have recruited from these groups in the recent past. However, the share of organisations that plan to recruit from other under-represented groups shows a fall, which may partly reflect employer perceptions that the buoyant demand for labour over the past three years will not be reflected in the next three years. Nonetheless, some care should be taken not to over-interpret these figures because of the high levels of uncertainty.
Table 6: Proportion of employers that have recruited from under-represented groups during the past three years (%)
All Private Public Voluntary
People aged 50–64 60 58 66 71
People aged 65 and above 17 14 28 23
People with a disability 37 30 56 50
People from a black, Asian or minority ethnic background 57 53 70 62
People aged 19–24 with few or no qualifications 50 49 54 46
People aged 16–18 with few or no qualifications 27 26 32 22
People with a history of long-term unemployment 17 15 22 16
Ex-offenders 9 7 14 9
People returning to the workforce after time out of the labour market, for example to have children or because of other caring responsibilities or a health condition
37 32 54 45
War veterans 11 10 19 5
None of the above 10 12 5 5
Don’t know 11 10 16 9

Labour Market Outlook Winter 2017–18 Labour Market Outlook Winter 2017–18
27
1
2
3
4
7
5
8
9
6
7 Skills outlook
Table 6: Proportion of employers that have recruited from under-represented groups during the past three years (%)
All Private Public Voluntary
People aged 50–64 60 58 66 71
People aged 65 and above 17 14 28 23
People with a disability 37 30 56 50
People from a black, Asian or minority ethnic background 57 53 70 62
People aged 19–24 with few or no qualifications 50 49 54 46
People aged 16–18 with few or no qualifications 27 26 32 22
People with a history of long-term unemployment 17 15 22 16
Ex-offenders 9 7 14 9
People returning to the workforce after time out of the labour market, for example to have children or because of other caring responsibilities or a health condition
37 32 54 45
War veterans 11 10 19 5
None of the above 10 12 5 5
Don’t know 11 10 16 9
Table 7: Share of organisations that plan to recruit from disadvantaged groups in the next three years (%)
All Private Public Voluntary
People aged 50–64 45 41 54 53
People aged 65 and above 18 15 27 25
People with a disability 33 29 46 45
People from a black, Asian or minority ethnic background 45 42 55 52
People aged 19–24 with few or no qualifications 40 39 44 39
People aged 16–18 with few or no qualifications 24 23 29 22
People with a history of long-term unemployment 19 15 29 30
Ex-offenders 10 8 15 18
People returning to the workforce after time out of the labour market, for example to have children or because of other caring responsibilities or a health condition
36 33 46 44
War veterans 17 15 24 16
None of the above 10 12 6 5
Don’t know 32 31 33 33
7 Skills outlookOverall, the survey data suggests that the volume of training has remained broadly unchanged over the past year – measured in terms of the share of organisations that have a training budget and the proportion of organisations that have increased their training budgets over the past two years.
Over seven in ten (72%) LMO employers have a dedicated training budget, up from 70% in the autumn 2015 report – although it is somewhat surprising that the share of organisations has fallen from almost three-quarters (73%) given the underlying trend in unemployment. Consistent with previous reports, the existence of training budgets is higher in the public sector (89%) than in the private (65%) and voluntary (88%) sectors (see Figure 21).
Across sub-sectors, training budgets are most prevalent in education (90%) and public administration (89%) and least likely in hospitality (57%) and retail (59%).
In the context of the migration debate, the data reveals that organisations that employ EU nationals are more likely to have a training budget (84%) than those that don’t employ EU nationals (45%).20 The survey data controls for size of organisation, sector and wage-level of organisation (see Appendices).

Labour Market Outlook Winter 2017–18
28
1
2
3
4
7
5
8
9
6
7 Skills outlook
Current and future spending on training initiatives Mirroring the buoyant demand for labour over the past 18 months, around a quarter (23%) of establishments have increased their training budgets during the past two years compared with 15% that have decreased them (see Figure 22).
However, underlining the budgetary pressures many public sector employers currently face, public sector employers (33%) are significantly more likely than private (12%) and voluntary (10%) sector employers to say the amount spent on training initiatives has decreased over the past two years. At the same time, around a quarter (25%) of private sector organisations have increased their skills investment budget compared with one in ten (10%) who have decreased it during the same period. Almost half (48%) of establishments say that the budget used for training initiatives has stayed the same. Additionally, around a third (33%) of high-wage organisations say they have increased their spend on training over the past two years compared with around a quarter (23%) of medium-wage organisations and less than a fifth (17%) of low-wage organisations.
The survey data also indicates that organisations that employ EU nationals are more likely to have increased their investment in skills during the same period than those that don’t
Base: Winter 2017–18, all employers (private sector: n=1,515; public sector: n=274; third/voluntary sector: n=277; manufacturing and production: n=335; education: n=140; healthcare: n=135; private sector services: n=1,052; public administration and defence: n=115)
65
89
88
90
89
81
69
64
Third/voluntary sector
Private sector
Public sector
Healthcare
Education
Manufacturing and production
Private sector services
Public administration and defence
Figure 21: Proportion of employers whose organisation has a training budget, by sector (%)
For instance, just over half (55%) of private sector SMEs that employ EU nationals have a training budget compared with just over a quarter (28%) of SMEs that don’t employ EU nationals. In addition, over half (56%) of low-wage employers that employ EU nationals have a training budget compared with one in ten (13%) low-wage employers that don’t employ EU nationals.
At the same time, the data indicates that there is more that some employers could do to address skill gaps and reduce labour turnover to help ease recruitment difficulties. Around one in seven employers (13%) that have recruitment difficulties do not have a training budget.

Labour Market Outlook Winter 2017–18 Labour Market Outlook Winter 2017–18
29
1
2
3
4
7
5
8
9
6
Don’t know
Don’t know
7 Skills outlook
Figure 22: Change in the amount of money spent on training initiatives during the past two years (%)
Base: Winter 2017–18, all employers (all: n=2,066; private sector: n=1,515; public sector: n=274; third/voluntary sector: n=277)
Stayed the sameIncreased Decreased
All employers 23 15 1350
Private sector 25 10 1253
Public sector 14 33 1835
Voluntary sector 28 12 654
on average. (see Appendices); especially among large private sector employers. More than a third (35%) of large private sector firms that employ EU nationals have increased their training budget during the last two years compared with one in ten (10%) large companies that don’t employ EU nationals. However, this is partly offset by the higher share of large private sector firms that employ EU nationals and have decreased their training budget (13%) compared with the proportion that don’t employ EU nationals (6%). The situation among SMEs paints a similar picture.
Looking ahead to the next 12 months, a fifth (20%) of employers expect training expenditure to increase in the next year, but the majority (54%) expect it to stay the same. Meanwhile, around one in six establishments (16%) anticipate the amount will decrease. In a continuation of recent trends, higher investment in skills is more prevalent in the private (26%) and voluntary (30%) sectors than in the public sector (12%). LMO employers in the manufacturing and production sector are particularly likely to be expecting training spend to increase at their organisation over the next 12 months, with a third (32%) reporting this.
Base: Winter 2017–18, all employers (all: n=2,066; private sector: n=1,515; public sector: n=274; third/voluntary sector: n=277)
Stay the sameIncrease Decrease
All employers 20 15 1254
Private sector 22 10 1256
Public sector 12 32 1443
Voluntary sector 19 12 664
Figure 23: Expected change in the amount of money spent on training initiatives in the next 12 months (%)

Labour Market Outlook Winter 2017–18
30
1
2
3
4
7
5
8
9
6
7 Skills outlook
Off-the-job training and development Around three-quarters (73%) of LMO employers with a training budget say their organisation has funded/arranged off-the-job training or development for employees over the past 12 months. This is relatively consistent across organisations of various sizes and sectors.
However, the survey also finds considerable variation in the amount of training employees receive in terms of occupation. On average, nearly half (45%) of employees in high-skilled roles have received this training over the past two years, compared with almost two-fifths (38%) of people in medium-skilled roles and a quarter (25%) of people in low-skilled roles.
Although the proportion of employees who have received off-the-job training in roles of various skill levels is relatively consistent across size and sector in most cases, findings indicate that large organisations offer off-the-job training to a higher proportion of staff in low-skilled roles than SMEs do (28%, compared with 20% on average).
Figure 24: Proportion of employees at each role level who have received off-the-job training or development in the past two years (%)
Base: Winter 2017–18, all employers whose organisation has funded off-the-job training in the past 12 months (base varies from n=897 to n=980)
25
38
45High-skilled roles
Low-skilled roles
Medium-skilled roles
Figure 25: Proportion of employees at each role level who have received on-the-job training or development in the past two years (%)
Base: Winter 2017–18, all employers (base varies from n=1,894 to n=1,978)
49
50
47High-skilled roles
Low-skilled roles
Medium-skilled roles
On-the-job training and development When looking at the offer of on-the-job training among all employers, there is less distinction by skill level. On average, roughly half of employees in low-, medium- and high-skilled roles have been offered on-the-job training or development in the past two years (49%, 50% and 47% respectively).

Labour Market Outlook Winter 2017–18 Labour Market Outlook Winter 2017–18
31
1
2
3
4
7
5
8
9
6
7 Skills outlook
50
52
5951
58
3432
40
High-skilled roles
Low-skilled roles
Medium-skilled roles
Base: Winter 2017–18, all employers (manufacturing and construction: n=250–261; finance and insurance: n=148–151; business services: n=212–248; information and communication: n=115–130)
4645
45
38
Finance and insurance
Manufacturing and construction
Business services
Information and communication
Figure 27: Proportion of employees at each role level who have received on-the-job training or development in the past two years, by detailed sector (%)
6360
47
4456
60
5258
47
High-skilled roles
Low-skilled roles
Medium-skilled roles
Base: Winter 2017–18, all employers (private: n=1,377–1,439; public: n=266–272; voluntary: n=251–268)
PublicPrivate Voluntary
Figure 26: Proportion of employees at each role level who have received on-the-job training or development in the past two years, by overall sector (%)
Overall, public sector organisations have provided on-the-job training to a higher proportion of staff in each role level than organisations in the private sector (Figure 26).
Organisations in the manufacturing and construction sectors offer on-the-job training to a significantly higher proportion of staff in low-skilled roles than organisations in business services (Figure 27). However, the opposite is true when looking at high-skilled roles; organisations across various business sector services offer on-the-job training to a much higher proportion of staff than those in manufacturing and construction do.
On average, large organisations offer on-the-job training to a larger proportion of people in low- (55% versus 42%) and medium-skilled roles (53% versus 47%), but there is no difference in the proportion of staff being offered this training in high-skilled roles (48% and 46% respectively).

Labour Market Outlook Winter 2017–18
32
1
2
3
4
7
5
8
9
6
8 Survey method
8 Survey methodThe fieldwork for the LMO survey is managed by YouGov Plc and this survey has been conducted using the bespoke YouGov online system administered to members of the YouGov Plc UK panel who have agreed to take part in surveys and the CIPD membership.
The survey is based on responses from 2,066 HR professionals and senior decision-makers. The sample is targeted to senior business leaders of senior officer level and above.
An email was sent to each respondent from the YouGov sample, who are selected at random from the base sample according to the sample definition, inviting them to take part in the survey and providing a link to the survey. The survey was carried out online and fieldwork was undertaken between 8 December and 31 December 2017.
WeightingThe quarterly LMO survey is sampled from the YouGov panel of senior decision-makers from UK businesses. The data is weighted to be representative of the UK public and private sector business population by size of employer and sector. Rim weighting is applied using targets on size and, sector drawn from the Business population estimates for the UK and regions 2016.
The delivered sample is drawn across all business sizes and in total 1,285 unweighted responses were received from small establishments (1–249 employees) and 781 from large employers (250+ employees). Additionally, the sample comprises 1,508 private sector employers, 434 public sector employers and 124 voluntary sector employers.
Table 8: Breakdown of the sample, by number of employees in organisation (%)
Win
ter
2017
–18
Aut
umn
2017
Sum
mer
20
17
Sprin
g20
17
Win
ter
2016
–17
Aut
umn
2016
Sum
mer
2016
Sprin
g20
16
Win
ter
2015
–16
2–9 14 14 14 14 14 14 14 14 14
10–49 14 14 14 14 14 14 14 14 14
50–99 6 6 6 6 6 6 6 6 6
100–249 7 7 7 7 7 7 7 7 7
250–499 10 10 15 10 10 9 8 8 8
500–999 9 9 7 10 10 7 8 6 8
1,000 or more 40 40 37 40 39 41 43 44 43
N 2,066 2,007 1,139 1,060 1,051 1,024 1,050 1,014 1,007
Table 9: Breakdown of the sample, by sector (%)
Win
ter
2017
–18
Aut
umn
2017
Sum
mer
20
17
Sprin
g20
17
Win
ter
2016
–17
Aut
umn
2016
Sum
mer
2016
Sprin
g20
16
Win
ter
2015
–16
Private 73 73 73 73 73 73 73 73 73
Public 21 21 21 21 21 21 21 21 21
Voluntary 6 6 6 6 6 6 6 6 6
N 2,066 2,007 1,139 1,060 1,051 1,024 1,050 1,014 1,007

Labour Market Outlook Winter 2017–18 Labour Market Outlook Winter 2017–18
33
1
2
3
4
7
5
8
9
6
8 Survey method8 Survey method
Table 10: Breakdown of the sample, by industry (%)
Win
ter
2017
–18
Aut
umn
2017
Sum
mer
2017
Spri
ng20
17
Win
ter
2016
–17
Aut
umn
2016
Sum
mer
2016
Sprin
g20
16
Win
ter
2015
–16
MANUFACTURING AND PRODUCTION 16 15 15 15 15 15 15 15 15
Agriculture, forestry and fishing 1 1 1 1 1 1 1 1 1
Manufacturing 8 9 9 9 9 9 9 9 9
Construction 6 4 4 4 4 4 4 4 4
Mining and extraction 0 1 0 0 0 0 0 1 0
Energy and water supply 2 1 1 1 1 1 1 1 1
EDUCATION 8 7 6 6 6 7 7 7 6
HEALTHCARE 11 12 11 12 12 12 11 11 11
PRIVATE SECTOR SERVICES 54 52 52 52 52 52 52 52 52
Hotels, catering and leisure 8 8 8 8 8 8 8 8 8
Transport and storage 4 4 4 4 4 4 4 4 4
Finance, insurance 3 5 5 5 5 5 5 5 5
Information and communication 4 1 1 1 1 1 1 1 1
Wholesale, retail and real estate 16 16 16 16 17 17 17 17 16
Business services (for example consultancy, law, PR, marketing, scientific and technical services)
8 7 8 8 8 8 8 9 7
Administrative and support service activities and other business services
11 9 9 9 9 9 9 9 9
PUBLIC ADMINISTRATION AND DEFENCE 10 9 9 9 9 9 9 9 9
Public administration 8 8 8 7 8 8 8 8 8
Armed forces/police 2 0 1 2 1 1 1 1 1
N 2,066 2,007 1,139 1,060 1,051 1,024 1,050 1,014 1,007

Labour Market Outlook Winter 2017–18
34
1
2
3
4
7
5
8
9
6
9 Endnotes
9 Endnotes1 www.ons.gov.uk/releases/uklabourmarketstatisticsjan2018 2 www.cipd.co.uk/knowledge/fundamentals/emp-law/recruitment/post-brexit-skills-
shortages 3 www.cipd.co.uk/knowledge/fundamentals/people/routes-work/impact-apprenticeship-levy 4 Labour Force Survey data taken at quarterly intervals based on GB population aged 16+.
Winter (November–January), Autumn (August–October), Summer (May–July), Spring (February–April).
5 www.ons.gov.uk/economy/grossdomesticproductgdp/bulletins/grossdomesticproductpreliminaryestimate/octobertodecember2017/previous/v1
6 Care should be taken not to over-extrapolate from the data because of a sample size of 88. 7 Care should be taken not to over-extrapolate from the data because of a sample size of
61 in both cases. 8 Care should be taken not to over-extrapolate from the data because of a sample size of 61. 9 Care should be taken not to over-extrapolate from this cohort because of a sample size of 82. 10 www.bankofengland.co.uk/-/media/boe/files/agents-summary/2017/2017-q4.pdf?la=en&
hash=A0641F6FEB34205F5B89BCDFAE7DA91FF9B497BF 11 www.bankofengland.co.uk/agents-summary/2017/2017-q3 12 www.bsa.natcen.ac.uk/media/39149/bsa34_brexit_final.pdf 13 www.cipd.co.uk/knowledge/fundamentals/emp-law/recruitment/post-brexit-skills-
shortages 14 www.cipd.co.uk/knowledge/fundamentals/emp-law/recruitment/post-brexit-skills-
shortages 15 www.cipd.co.uk/knowledge/fundamentals/emp-law/recruitment/post-brexit-skills-
shortages 16 Some care should be taken not to over-extrapolate from this data because the cheaper
labour motive may be underestimated by surveys of this type. 17 http://ec.europa.eu/eurostat/web/microdata/adult-education-survey 18 www.cipd.co.uk/knowledge/fundamentals/emp-law/recruitment/post-brexit-skills-
shortages 19 http://data.oecd.org/emp/labour-force-participation-rate.htm 20 The data also controls for size of organisation, sector and the wage level of
organisations.

Chartered Institute of Personnel and Development151 The Broadway London SW19 1JQ United Kingdom T +44 (0)20 8612 6200 F +44 (0)20 8612 6201E [email protected] W cipd.co.ukIncorporated by Royal Charter Registered as a charity in England and Wales (1079797) Scotland (SC045154) and Ireland (20100827)
Issued: February 2018 Reference: 7650 © CIPD 2018