Labour Market Assessments for the Residential Construction ... · for the Residential Construction...
52
Labour Market Assessments for the Residential Construction Industry 2016–2025
-
Upload
nguyentuong -
Category
Documents
-
view
218 -
download
0
Transcript of Labour Market Assessments for the Residential Construction ... · for the Residential Construction...

Labour Market Assessments for the Residential Construction Industry2016–2025


1
ContentsExecutive summary ....................................................... 2
Residential labour market assessments – Overview ................................................ 3Data gaps and priorities .....................................................4Provincial highlights ............................................................ 5
British Columbia ........................................................... 5Alberta ............................................................................... 5Saskatchewan ................................................................6Manitoba ...........................................................................6Ontario ..............................................................................6Quebec ..............................................................................6Maritime Provinces ..................................................... 7Newfoundland and Labrador .................................. 7
1. Introduction ................................................................8
2. Issues, gaps and priorities: The LMI system and residential labour market assessments .......... 9Gaps and priorities .............................................................10
3. Residential labour market assessment, 2016–2025 ................................................................ 12Overview ................................................................................ 12Residential market drivers and the workforce ...... 13Residential trades and occupations ........................... 15
Specialized trades and occupations ................... 17Retirements .......................................................................... 17Mobility ..................................................................................18
Gaps ..................................................................................19
4. Provincial highlights .............................................. 20British Columbia ................................................................ 20Alberta ................................................................................... 23Saskatchewan .................................................................... 26Manitoba ............................................................................... 29Ontario ................................................................................... 32Quebec ................................................................................... 35 New Brunswick ................................................................... 38Prince Edward Island ........................................................40Nova Scotia ........................................................................... 43Newfoundland and Labrador ........................................46
5. Conclusion ................................................................ 49

2
Executive summary
Executive summary
Each year, BuildForce Canada produces the Construction and Maintenance Looking Forward reports to offer insights across residential and non-residential provincial labour markets for 34 trades and occupations. This second annual Labour Market Assessments for the Residential Construction Industry report, based on data from BuildForce’s labour market information (LMI) system, focuses exclusively on market assessments for the residential construction sector.
The forecast scenario in this report covers the period from 2016 to 2025 and is based on macroeconomic, industry and demographic projections across all provinces and five regions in Ontario. Residential market conditions for each occupation and region are also described more generally in the provincial Construction and Maintenance Looking Forward reports available at www.constructionforecasts.ca.
While the BuildForce LMI system makes the best use of available data, there are gaps in secondary data sources (such as Statistic Canada’s surveys) that are used to describe the residential construction industry’s trades and occupations. BuildForce has been working to fill these gaps and in 2010 prepared the first measures of employment by trades and occupations in the housing industry. The 2016 labour market assessments include another major innovation: new estimates of key labour force (supply side) measures have been combined with
labour requirements to produce market rankings that are released for the first time in this review. These innovations are just one step in the direction of improved labour market information specific to the residential sector. This report also includes a discussion of where other new data sources can add important detail and insights for home builders and renovators.
This report aims to accomplish two things:
1) provide an assessment of labour market conditions for residential construction to 2025 based on the current LMI system (sections 3 and 4)
2) review the gaps in statistics used to describe residential markets and identify priorities to improve and add needed data to future reports (section 2)

3
Residential labour market assessments – Overview Recognizing the distinct characteristics of housing and renovation work, BuildForce Canada expanded the construction LMI system to include separate estimates of employment for residential and non-residential work. To estimate labour market requirements for housing-related work, BuildForce takes into account both labour supply and labour demand.
Supply and the available local workforce are measured by unemployment, young people entering the labour force and the potential mobility of new entrants from (or to) other regions and industries. This includes the industry’s share of interprovincial migration and international immigration. Demand (labour require-ments), on the other hand, includes expansion demand for new housing and renovation, and replacement demand, which is driven by retirements.
Cycles in new housing activity vary by province and across time in the scenario. Slowing population growth is likely to limit household formation1 in many provinces and this drives housing starts lower across the latter part of the scenario period.
There are distinctly different scenario paths from 2016 to 2025 among the provinces. Ontario, British Columbia and Prince Edward Island begin a rising cycle in housing starts and employment in 2016. Quebec and Manitoba have a very mild upward cycle. In contrast, and partially driven by lower resource prices, Newfoundland and Labrador, Nova Scotia, Saskatchewan and Alberta are on the downward leg of a current housing cycle at the start of the scenario. On balance, the national profile shows a mild rise in starts and employment to 2020 and then it drops across the remainder of the scenario period as projected population growth slows. Assumptions on provincial economic and population growth and migra-tion patterns (interprovincial and international) are built into the outlook scenario.
Across Canada, the most important factor driving demand (recruiting) across the scenario will be retire-ment. The aging population in every market adds to retirements each year. Nationally, replacement demand due to retirements (including mortality) across the residential sector is estimated to add 118,000 job opportunities by 2025, while market-related expansion demand related to new housing and renovation growth in the scenario presented declines by 24,000 workers.
After taking account of these changes, in some regions, training systems will need to expand and the housing industry will have to invest in promotion and retention programs to meet labour demand requirements.
The BuildForce LMI system tracks the ebb and flow of market dynamics, and signals the extent and timing of changes in market demands. Unemployment is a traditional source of labour that helps balance markets, but long-term demographic trends are reducing labour force growth and unemployment, which leaves a smaller pool of qualified workers in most markets. Workforce mobility becomes an important step to balancing markets as employers look beyond local markets and workers move further afield to find work. This pattern is well established in the non-residential sector, and industry consultations indicate that the residential workforce may be becoming more mobile in regions with high or increasing demand.
The provincial forecast scenarios also signal movement across regions. Stakeholders on the BuildForce LMI committees attested to anecdotal evidence of residential workers moving across provinces (i.e., a long history of worker movement from east to west).
Looking forward, the goal is to provide all of these details for each trade and occupation working in home building and renovation. This level of detail is required to more fully understand the human resource needs of the residential construction industry.
1 Household formation refers to the change in the number of households (persons living under one roof or occupying a separate housing unit) from one year to the next. It is the means by which population growth is transformed into demand for new housing.

4
Data gaps and prioritiesAlthough the main themes and implications for human resource planning are the same in many ways for both residential and non-residential construction, it is essential to recognize the particular circumstances that challenge residential employers. This includes distinct cycles in new housing, trends in renovation and the impact of these on the distribution of work across occupations. BuildForce has made model improvements that address these features, including the addition of new rankings that measure market balances by trades and occupations working specifically in the residential construction industry. Adding market rankings is another innovation by BuildForce that adds more depth to assessing market conditions.
More innovations are planned.
As BuildForce and the industry make efforts to improve secondary data sources and expand the research, the labour market information provided in these reports will include more detailed measures.
BuildForce continues to add depth and breadth to the analysis and to consider more of the characteristics that distinguish residential markets, including such factors as:
¿ the presence of tens of thousands of small and very small businesses – especially among trade contractors, home builders and renovators2
¿ distinct building regulations that impact employment practices
¿ local resources – for example, in Ontario, 81 percent of urban single-family homes are built by locally based contractors3
¿ renovation work that represents at least half of residential employment and has unique skills and workplace features
¿ mobility between work in new housing and renovation work
¿ distinctive trade and occupational specialties that are related to work practices and building systems
¿ subcontracting among many small, specialized firms
¿ a growing share of multi-unit residential buildings, including high-rise construction, that
» are typically built by larger firms
» use workforce skills more similar to non-residential building
¿ the growing role of manufactured housing and prefabricated building components
The BuildForce LMI system is being adapted to reflect many of these factors.
BuildForce has identified key areas for continuing data improvement:
¿ identifying specialized residential occupations
¿ measuring work in related areas such as manufactured housing
¿ tracking additional supply-side measures
A first priority is to expand data measures to help distinguish the residential side of work done by specialty trade contractors4 and other groups. To accomplish this, these refinements would need to be applied to core Statistics Canada surveys and programs such as the Labour Force Survey, the National Household Survey or Census, job vacancy surveys and the Survey of Employment, Payrolls and Hours. The expansion of standard occupational classifications to include residen-tial specializations is an important refinement needed for the residential sector.
2 These are revealed by Statistics Canada business counts based on Canda Revenue Agency administrative data. As of June 2015, more than 100,000 firms were potentially engaged in various aspects of residential construction and renovation.
3 Michael Buzzelli and Richard Harris, “Cities and Industrial Districts of Housebuilding,” International Journal of Urban and Regional Research, Volume 30, Issue 4, 2006.
4 “Specialty trade contractors” is comprised of establishments primarily engaged in trade activities such as finish carpentry, drywall installation, flooring, painting, plumbing, electrical, etc. that are generally needed in the construction of buildings and structures. The work performed may include new work, additions, alterations, renovations, maintenance and repairs. Specialty trade contractors usually work under contract to general contractors or operative builders to carry out a component of an overall project.

5
The second priority is to measure work in related areas such as manufactured housing. The Canadian Manufactured Housing Institute (CMHI) tracks production trends and technological advances in the manufacturing of single-family and multi-family homes. More work is needed to better understand emerging labour demand requirements for this market segment and how demands are changing by region. Research in this area is needed to understand the potential impact of prefabri-cated building technology and business models on the supply side. The potential impact on on-site labour force requirements in terms of skill and training requirements and demand also needs to be better understood.
The third priority is to develop additional details to track supply-side measures, including skill require-ments, training requirements and portability of skills across markets. Differences in market dynamics will signal the potential for workforce mobility, which is key to balancing markets.
Furthermore, government and industry surveys and statistics could be refined to add labour market details. This might include adapting Canada Mortgage and Housing Corporation (CMHC) data and the Canadian Home Builders’ Association (CHBA) Pulse Survey5 of its home builder and renovator members to focus on labour- sensitive sectors such as specialty trade contractors.
All of these targeted improvements will provide consistent measures across markets, regions and time. New data sources would reveal residential labour market cycles across time and mobility by occupation across sectors and regions.
A final consideration for future scenario-building work is measuring potential impacts of recently announced plans for federal and associated provincial and municipal initiatives to stimulate infrastructure construction, including social housing, during the next several years.
Provincial highlightsEach province’s residential labour market has unique conditions.
British Columbia ¿ Residential construction in British Columbia is
on a gradual upward track that began in 2012.
¿ Housing starts and employment will continue to rise to a peak in 2016 and then decline to 2025.
¿ The down side of the cycle is gradual from 2017 to 2020 and then slower population growth accelerates a drop to 2025.
¿ Job losses in new housing exceed requirements in renovation so that total residential construction employment falls by 10 percent by 2025.
¿ Hiring remains a priority, however, as replacement (retirement) demands total 20,000.
¿ Markets are balanced from 2016 to 2020 and then weaken from 2020 to 2022 as new housing slows.
Alberta ¿ The oil price decline sets off a new housing cycle
that started in 2015 and then continues to drive employment down over the medium term to 2019. Total residential employment declines by 18 percent.
¿ A limited recovery leaves employment in the new housing sector 12 percent below 2015 levels in 2025.
¿ While cyclical changes are concentrated in new housing, renovation employment grows by 8 percent and maintenance employment grows by 18 percent.
¿ The extent of movement of residential workers out of Alberta in the down cycle is an important measure of potential market mobility.
5 The Canadian Home Builders’ Association Pulse Survey is an annual survey of home builders on housing trends, market conditions and construction practices.

6
Saskatchewan ¿ As the resource expansion slows, new
housing activity declines across the entire 2016–2025 scenario.
¿ While jobs are added in renovation, the relatively young housing stock requires less work than in other provinces.
¿ Residential employment, including both new housing and renovation, declines by 20 percent.
¿ Hiring must take account of 3,200 employees who will be lost to retirement.
¿ The steady pace of decline allows the market to adjust smoothly with only a few points where conditions signal weakness – but there is a steady decline in the workforce across the scenario period.
Manitoba ¿ Manitoba has one of the stronger residential
housing markets, with employment rising across the scenario with gains from 2016 to 2018.
¿ Manitoba has been the destination for a growing number of international immigrants over the past decade and these new arrivals have driven new housing activity higher. Employment in residential work slowed in 2015, but continues to rise to a peak in 2018.
¿ New housing employment cycles up and down across the period, finishing the decade just below 2015 levels.
¿ Renovation and maintenance work rise steadily across the scenario period, with employment 8 and 13 percent above 2015 levels, respectively.
¿ Overall, residential employment rises 6 percent across the scenario period.
Ontario ¿ Ontario is on a strong housing cycle, with
employment gains from 2016 to 2019.
¿ A new residential cycle began in 2015 with housing starts continuing to rise to a peak in 2019 before slowing across the remainder of the scenario period.
¿ Driven by rising immigration, new housing employment in Ontario rises by 25 percent to a new peak in 2019, before declining to 2025.
¿ By the end of the scenario period new housing employment is 6 percent below 2015 levels.
¿ Steady, but limited gains in renovation and maintenance employment add 2 percent by the end of the period.
¿ Employment gains are strongest in the Greater Toronto Area, where immigration tends to be focused.
¿ Rising labour requirements create a series of tight markets in Ontario over the medium term, particularly in 2017.
Quebec ¿ Across the scenario period demographics
dominate. Employment in new housing declines across the decade as population growth slows and household formations and starts decline.
¿ The older housing stock demands a growing renovation and maintenance workforce, with modest gains across the period partially offsetting new residential employment losses.
¿ Total residential employment declines by 8 percent from 2016 to 2025.

7
Maritime Provinces ¿ A decade-long rise in New Brunswick housing
ended in 2010 followed by an extended period of decline to 2015. Investment and employment is unchanged in 2016 and the modest rise in activity increases employment from 2017 until 2019, coinciding with the cycle in non-residential investment.
¿ In Prince Edward Island, new housing rises to 2021 and then declines, while renovation and maintenance work rise in steady, annual increments across the scenario period. Employment grows by 12 percent.
¿ Nova Scotia’s pattern of slowing starts related to slow population growth and weak household formation continues across the scenario period. While renovation activity sees gains, it is not enough to offset declines in new housing. By the end of the scenario period, residential employment is 14 percent below 2015 levels.
¿ Housing cycles move in different directions across the Maritimes, with Nova Scotia declining across the scenario while New Brunswick and Prince Edward Island show expected gains from 2016 to 2019.
Newfoundland and Labrador ¿ Newfoundland and Labrador is on a distinct cyclical
path, with new housing declining since 2011.
¿ New housing declined in 2015, but activity remains stable, reflecting demolition and vacancy requirements.
¿ Overall, residential construction employment declines by 6 percent across the 2016–2025 scenario.
¿ Trends in Newfoundland and Labrador fit into the housing cycles that are anticipated in the Maritime Provinces:
» Residential workers in Newfoundland and Labrador may find opportunity to seek work in the stronger markets, including New Brunswick and Prince Edward Island.

8
Each year, BuildForce Canada produces the Construction and Maintenance Looking Forward reports to offer insights across provincial construction labour markets for 34 trades and occupations. The latest edition covers the 2016–2025 period and offers a fresh perspective on Canada’s construction workforce and how demand and supply in each labour market is linked to demographic and economic conditions. The report, which uses BuildForce’s unique labour market information (LMI) system, highlights the factors that determine the residential and non-residential construction labour markets across Canada.
Recently, the LMI system has been expanded to track separately, by province, residential and non-residential construction employment by trade and occupation.
BuildForce is pleased to present this second annual Labour Market Assessments for the Residential Construction Industry report that focuses exclusively on labour market assessments for the residential construction sector. More specifically, sections 3 and 4 provide a detailed assessment of labour market conditions for residential construction across the country and in each province to 2025.
While the expanded LMI system uses the best available data, there are gaps in the historical secondary data sources (e.g., Statistics Canada), which BuildForce uses to analyze and describe the labour force of trades and occupations working in the residential construction industry.
Section 2 includes a discussion of where new data sources can add important detail and insights about home builders and renovators. In particular, the 2016 Construction and Maintenance Looking Forward report includes new estimates of the available labour force in residential construction. This innovation by BuildForce offers the first available measures of key supply-side measures for trades and occupations working in the housing sector. This research is an important first step, offering estimates of unemployment, retirements and other measures. BuildForce looks forward to the industry’s review and validation of these measures.
Section 2 also points to initiatives that could contribute to new statistics and provide the basis for improvements in the next round of residential market assessments.
1. Introduction

9
Findings in this residential labour market report are based on the BuildForce LMI system, which tracks labour market measures for 34 construction trades and occupations in 10 provinces and five Ontario regions.
For this report, BuildForce used the LMI system to prepare estimates of demand (labour requirements) and supply (the available workforce) in the residential sector for each market. It then assessed labour market balance based on the local difference between supply and demand. Local imbalances formed the basis for measuring mobility (e.g., both interprovincial and international migration), which further adjusts labour market conditions.
BuildForce divides labour demand into two categories:
¿ Expansion demand6, which reflects the ebb and flow of jobs. Employment levels change as cyclical shifts in economic conditions, popula-tion growth and household formation7 drive new housing starts and renovation activity.
¿ Replacement demand8, which is driven by the age of the workforce.
Labour supply, on the other hand, is driven by unemploy-ment, population change and immigration trends. In the short term, unemployment is the traditional first source of needed workers as markets shift. In the medium and longer term, adjustments are driven by population change (demographics) and immigration trends, with the main additions to the workforce comprised of youth entering the industry and the recruitment of workers from other regions, industries and countries.
BuildForce uses the LMI system to assess each labour market with rankings that combine measures of employment growth, unemployment and mobility requirements that capture both short-term housing cycles and longer-term trends in renovation activity and retirements. These rankings are presented for the first time in this 2016 report. BuildForce reviews market conditions for each year across a 10-year scenario period – in this case, 2016–2025. Regional LMI commit-tees comprised of owners, contractors and labour
6 Expansion demand refers to the increase in the demand for workers driven by increased construction activity.
7 Household formation refers to the change in the number of households (persons living under one roof or occupying a separate housing unit) from one year to the next. It is the means by which population growth is transformed into demand for new housing.
8 Replacement demand refers to the loss of workers due to permanent retirement from the workforce.
2. Issues, gaps and priorities:
The LMI system and residential labour market assessments

10
groups validate labour market assessments and rankings. For this report, BuildForce engaged its National Residential Construction Industry LMI Committee.
Gaps and prioritiesIt is important to note that the BuildForce analysis focuses primarily on the direct 34 trades and occupations that work on the job site, including new home builders and renovators, estimators and construction managers. BuildForce also includes an “Other trades and occupa-tions” group that captures workers such as office staff, salespeople, managers, etc. that work for construction firms, but are not directly involved in the on-site con-struction activity. Data for “Other” trades is only reported as an aggregate total. Section 3 reviews this in detail.
Creating separate measures for residential and non-residential markets was a challenge because standard secondary statistical sources, such as Statistics Canada surveys, do not report data specific to the residential workforce. This expansion was BuildForce’s first step toward analyzing the distinctive features that define residential workers and their employers.9
The 2016 Construction and Maintenance Looking Forward analysis includes a second innovation with the development of labour supply measures for each trade and occupation in the residential sector. Estimates provided this year include the labour force, unemploy-ment, retirements, new entrants of youth from the regional population and net in-mobility10. These unique additions offer a new and more detailed understanding of how residential construction labour markets adjust to changing conditions. These new measures, and the rankings that are based on them, require close scrutiny and validation by industry stakeholders. BuildForce invites residential construction industry employers to join in a detailed review of these innovative estimates.
Recognizing that other limitations remain in the data available for the residential construction industry, BuildForce has identified key additional areas for improvement:
¿ identifying specialized residential occupations
¿ measuring work in related areas, such as manufactured housing
¿ tracking even more specific supply-side measures
To this end, there are at least three priority areas where new information and data should be considered:
1 Assess the potential to expand the standard occupational classifications used by current secondary statistical sources to include more detailed residential specializations. This would require bringing together key federal government groups (e.g., Statistics Canada; Immigration, Refugees and Citizenship Canada; Employment and Social Development Canada), provincial governments and industry to discuss and recom-mend changes to existing classifications with new, more detailed and residential-specific occupations.
2 Expand data measures in secondary data sources to distinguish the residential component of work done by specialty trade contractors.11 Currently, Statistics Canada data sources do not separate specialty trade contractor data into residential and non-residential work. BuildForce’s residential employment estimates by trade and occupation are an important first step in measur-ing the employment breakdown for specialty trade contractors. The BuildForce analysis, however, needs to develop a similar breakdown for the labour supply specific to the residential workforce working for specialty trade contractors.
9 BuildForce used the 2006 census data and other sources in a complex set of calculations that divided standard statistics for major construction sectors (in particular, the trade contractors) into residential and non-residential groups. These measures are unique and rely on the residential industry for validation and refinement.
10 In-mobility refers to the arrival of workers from outside the local construction industry.
11 “Specialty trade contractors” is comprised of establishments primarily engaged in trade activities generally needed in the construction of buildings and structures such as finish carpentry, drywall installation, flooring, painting, plumbing, electrical etc. The work performed may include new work, additions, alterations, renovations, maintenance and repairs. Specialty trade contractors usually work under contract to general contractors or operative builders to carry out a component of an overall project.

11
In order to obtain the specialty trade data meas-ures, Statistics Canada’s core surveys, such as the Labour Force Survey, the National Household Survey or Census, job vacancy surveys and the Survey of Employment, Payrolls and Hours require improvements or expansion. In addition, any new occupational and industry detail on immigration statistics and measures of interprovincial migra-tion related to the residential sector would help to provide a more comprehensive picture of residen-tial labour market conditions.
3. Develop an approach to tracking supply-side measures, including skill requirements, training and portability of skills across markets. Differences in market dynamics will signal the potential for workforce mobility, which is key to balancing markets and using Canada’s scarce supply of skilled workers efficiently.
Provincial research and industry’s surveys could also be used. This might include adapting Canada Mortgage and Housing Corporation (CMHC) data and
the Canadian Home Builders’ Association (CHBA) Pulse Survey12 of its new home builder and renovator members to focus on labour-sensitive sectors such as specialty trade contractors.
Improving and expanding trade and occupational detail will allow for more accurate measures of labour market conditions specific to residential construction by sector (new home building and renovation) and by province.
A final consideration for future scenario-building work is measuring potential impacts of recently announced plans for federal and associated provincial and munici-pal initiatives to stimulate infrastructure construction, including social housing, during the next several years.
BuildForce Canada and the Canadian Home Builders’ Association have moved forward with initiatives to improve information in each of these priority areas. This includes a dialogue with Statistics Canada regarding occupational classifications and adding new residential content in key surveys, as well as industry surveys and research on training, manufactured housing and other labour-market-related issues.
12 The Canadian Home Builders’ Association Pulse Survey is an annual survey of home builders on housing trends, market conditions and construction practices.

12
OverviewThe economic news in 2015 was mostly negative, signalling slower economic growth in the near future. The headlines focused on the resource industries, but this shift to slower growth was apparent on a global scale and now seems to be an extension of a trend that was starting as far back as 2013.
In Canada, housing was a leading indicator, as some markets began an extended downward trend in 2012 or 2013. Immigration is an important factor and, in some provinces, international immigration began to fall in 2013 and 2014. Each year, as BuildForce extends the scenario further into the future, population restrictions grow more severe. As the age profile grows older, the number of youth entering the workforce is restricted while retirements increase. Slower growth or a decline in natural population (births less deaths) reduces both household formations and the growth of the labour force. These fundamentals set limits on growth that can only be exceeded by rising international immigra-tion. The 2016 BuildForce Canada Construction and Maintenance Looking Forward forecast incorporates these changing conditions and slower growth for housing activity and employment into the 2016–2025 scenario period. The residential construction industry
reflects these demographic forces both in terms of trends in housing demand and changes in the labour market. The BuildForce LMI system sets out the details and clarifies long-term implications. In particular, it helps to see past the initial negative impression that focuses on declining housing starts. This is only part of the long-term vision and it can be misleading.
Reports of weaker housing starts can create an expectation of rising unemployment and surplus labour in the residential sector, when the opposite is true. In many markets across Canada there may be difficulty finding specialized and experienced workers that are needed to build and renovate Canadian homes. This section describes the roots of this situation and offers insights into how labour market conditions may unfold over the 2016–2025 outlook scenario.
3. Residential labour market
assessment, 2016–2025

13
Residential market drivers and the workforceFrom a national perspective, the trend to lower activity is spread out across the full decade of the scenario and, in most provinces, residential construction employment is lower at the end of the period in 2025. There are, however, distinctly different scenario paths across the period among the provinces. Ontario, British Columbia and Prince Edward Island begin a rising cycle in housing starts and employment in 2016. Quebec and Manitoba have a very mild upward cycle. In contrast, and partially driven by lower resources prices, Newfoundland and Labrador, Nova Scotia, Saskatchewan and Alberta are on the downward leg of a current housing cycle at the start of the scenario. On balance, the national profile, set out in Figure 1, shows a mild rise in housing starts and employment to 2020 and then drops across the remainder of the scenario period as projected popula-tion growth slows. Assumptions on provincial economic and population growth and migration patterns (interprovincial and international) are built into the outlook scenario. The shape of the national profile is driven by immigration that rises to a peak in 2020 and then flattens out to 2025.
For the residential sector, the last decade (2006 to 2015) was a complex winding down of a major cyclical peak. While new national housing activity peaked after 2004, the big housing boom was sus-tained in the West until 2007. The 2008–2009 recession was concentrated in housing and all markets declined. Recovery has not been consistent since 2009, with some markets in the West rising while activity in Central Canada has slowed. A modest peak occurred in 2012 in most big markets, and new housing activity weakened in 2013 and 2014. Residential activity, in general, and employment, in particular, has not returned to the 2004–2006 peaks.
Figure 1 illustrates national housing starts and household formation trends for the new housing sector. Housing starts in the long run are expected to follow the core demographic trends set by population growth and household formation. Formations will be determined by population change, migration and immigration. The highlight here is the extended period across the 2000s when starts ran well ahead of formations. A national 2008–2009 cyclical decline was apparent in most provinces, but the down cycle was brief, with a strong recovery in 2010.
100
120
140
160
180
200
220
240
260
2025202320212019201720152013201120092007200520032001
Household formationHousing starts
000s
OF
UN
ITS
FIGURE1 Residential construction: housing starts and household formation, Canada
Source: BuildForce Canada
Forecast

14
The 2016–2025 BuildForce national outlook scenario shows that the 2013 decline in starts fell below this trend and that a gradual recovery to 2018 will close the gap.
Figure 2 tracks total residential activity, including new housing and renovation construction. New housing investment runs in parallel with housing starts, rising up slightly to 2018 and then declining over the long term to 2025. More than half of the investment in residential construction will be dedicated to renova-tion and maintenance work, and these demands will be driven steadily higher as the housing stock ages.
At the national level, the annual changes in activity are not large by historical standards, but the real action occurs in provincial markets, where investment and regional employment demands move in different orders of magnitude and directions. Provincial labour market information can be found in the Construction and Maintenance Looking Forward reports available at www.constructionforecasts.ca.
National employment in new residential construction declines across the scenario, but this is partly offset by rising employment in renovation. The provincial cycles
in housing starts help to raise employment to 2018, but it then falls to 2025. Overall employment falls by 24,000 jobs across the scenario period.
These forces shift residential workers across sectors and regions where demand is increasing and into the renovation sector in their local labour market. Regular employment gains in renovation work that offer steady employment for workers provide the most reliable demand compared to the more volatile new residential cycles.
Changing conditions offer many possibilities for recruiting and job search in different markets. The residential scenario set out here demonstrates the potential for workers on new residential projects to move into renovation work as the former markets weaken. Much depends on the qualifications and skills of the workforce. In some cases, trades and occupations in the residential sector have access to jobs in other construction sectors. For example, the BuildForce non-residential scenarios often project relative strength in commercial building activity that coincides with weaker new housing markets. This sets out the potential
20,000
25,000
30,000
35,000
40,000
45,000
50,000
55,000
60,000
65,000
2025202320212019201720152013201120092007200520032001
RenovationNew housing
Residential investment, Canada, $2007 millions*
Forecast
Source: BuildForce Canada
* $2007 millions indicates that the investment values are in year 2007 dollars (base year), that is, adjusted for inflation. �is is used to calculate the real physical year-to-year change of the value of construction, factoring out growth (increase value) due to increases in prices.
FIGURE2

15
for skilled workers in new residential markets to move into small commercial projects. Movement of the skilled and experienced workforce is important in the scenario, as demographics will limit the availability of skilled workers even as new housing markets weaken.
A key to workforce planning is to understand the potential for mobility that is driven by shifting labour requirements and the need for skilled workers. In addition, the forecast shows that demographic changes will add to market challenges. Slower population growth reduces the number of young people entering the workforce, which has the long-term effect of driving unemployment down and leaving a limited pool of local workers while encouraging mobility across markets as employers look for workers outside their local labour market.
Mobility is the dominant factor in labour force adjust-ments. Similarly, there is a growing pool of construction workers willing and able to move, often on a short-term basis, to find work. While these trends are highlighted in major resource project work, industry stakeholders suggest that the residential workforce may be adjusting in similar ways.
The BuildForce analysis offers insights into how market challenges are distributed among occupations and managed by the mobility of the workforce across regions and sectors. Mobility is discussed in greater detail at the end of section 3. Regional supply/demand balances and workforce mobility are summarized for each province in section 4.
Residential trades and occupationsFigure 3 illustrates direct13 residential, non-residential and total employment for the 2016–2025 scenario period.
The national totals in this graph conceal important cycles and trends for specific trades and provinces. National residential construction employment follows a narrow and flat path across the scenario period, rarely changing by more than plus/minus 2 percent each year. For non-residential construction, growth is spread over a moderate expansion period from 2016 to 2019 and then sustained across most of the remainder of the scenario period to 2025.
13 “Direct” refers to the total of the 34 construction trades and occupations tracked by BuildForce Canada. Visit www.constructionforecasts.ca for a full list of trades and occupations.
0
200
400
600
800
1,000
1,200
202520242023202220212020201920182017201620152014201320122011
TotalNon-residentialResidential
000s
OF
WO
RKER
SEm
ploy
men
t
FIGURE3 Direct construction employment in Canada, residential and non-residential
Forecast
Residential employment in 2015 = 501,359
Source: BuildForce Canada

16
This figure, and the associated market assessments for housing, is also presented in each of the provincial highlights documents and PowerPoint reports in the Construction and Maintenance Looking Forward series that is available at www.constructionforecasts.ca.
In 2015, total residential employment14 was estimated at 619,000 workers, 501,000 of which are in the 34 on-site trades and occupations tracked by BuildForce.
Figure 4 illustrates the distribution of the 501,000 residential employees tracked by BuildForce across the workforce by occupation. The largest trade, carpenters, includes many important specializations, such as framers, formworkers, finish carpenters and other key groups.
Residential labour markets are distinguished from non-residential markets by many characteristics, which affect the way in which BuildForce analyzes data from the LMI system. These distinguishing features include:15
¿ the presence of tens of thousands of small and very small businesses – especially among trade contractors, home builders and renovators16
¿ distinct building regulations that impact employment practices
¿ local resources – for example, in Ontario, research shows that an estimated 81 percent of urban single-family homes are built by locally based contractors17
14 Total residential employment includes “Other trades and occupations “so that the total industry measures are consistent with Statistics Canada’s Labour Force Survey. “Other” occupations include workers such as office staff, salespeople, engineers, etc. that work for construction establishments, but are not directly involved in on-site construction activity.
15 Comments here were offered by the Canadian Home Builders’ Association and the Home Builders and Renovators LMI Committee. See “A Profile of the Canadian Residential Construction Industry,” CHBA, February 28, 2014.
16 These are revealed by Statistics Canada business counts based on Canda Revenue Agency administrative data. As of June, 2015, over 100,000 firms were potentially engaged in various aspects of residential construction and renovation.
17 Michael Buzzelli and Richard Harris, “Cities and Industrial Districts of Housebuilding,” International Journal of Urban and Regional Research, Volume 30, Issue 4, 2006.
0% 5% 10% 15% 20% 25%
Elevator constructors and mechanicsGlaziers
Ironworkers, structural metal and platework fabricators and fittersInsulators
Refrigeration and air conditioning mechanicsGasfitters
Sheet metal workersConcrete finishers
Truck driversTilesetters
Heavy equipment operators (except crane)Construction estimatorsFloor covering installers
BricklayersResidential and commercial installers and servicers
PlumbersRoofers and shinglers
ElectriciansPlasterers, drywall installers and finishers, and lathers
Painters and decoratorsContractors and supervisors
Construction managersHome building and renovation managers
Trades helpers and labourersCarpenters
FIGURE4 Percent distribution of residential construction employment
across the 34 trades and occupations tracked by BuildForce
Source: BuildForce Canada

17
¿ renovation work that represents at least half of residential employment and has unique skills and workplace features
¿ mobility between work in new housing and renovation work
¿ distinctive trade and occupational specialties that are related to work practices and building systems
¿ subcontracting among many small, specialized firms
¿ a growing share of multi-unit residential buildings, including high-rise construction, that
» are typically built by larger firms
» use workforce skills more similar to non-residential building
¿ a growing role of manufactured housing and prefabricated building components
The BuildForce LMI system is being adapted to reflect and consider many of these unique characteristics.
Specialized trades and occupationsBuildForce recognizes the role of specialized trades and occupations, especially in low-rise new housing and renovation work. Where this refinement is pos-sible, efforts will be made to add needed detail to labour market assessments to help employers recruit special skills, and to track training and portability of skills across markets.
Canada’s apprenticeship programs as well as its national and provincial occupational standards and regulations are slowly recognizing specialized skills in residential construction, for example:
¿ Framer/Framing Technician (Saskatchewan and Newfoundland and Labrador)
¿ Domestic Thermal Residential Heating Technician (British Columbia)
¿ Electrician, domestic and rural (Ontario)
¿ Refrigeration and Air Conditioning Mechanic, residential (Manitoba)
¿ Residential Air Conditioning Mechanic (Ontario)
¿ Residential (low-rise) Sheet Metal Installer (British Columbia)
¿ Residential Building Maintenance Worker (British Columbia)
Many other specializations are recognized among residential employers, including formwork and finishing in carpentry. The workforce employed in these specializ-ations is included in the broad trade and occupation measures in the BuildForce LMI system. Therefore, measures for Residential Carpenter, for example, would include framers, formers, finishing and other specialties.
RetirementsWhen assessing construction labour market conditions, a key component is tracking the changes in labour supply and, more specifically, the impact of an aging workforce. The BuildForce LMI system breaks down the annual change in the residential construction labour force into key components that capture the impact of demographic change: retirements, new entrants and net mobility.18
As the overall construction workforce ages across Canada, retirements translate into a greater need for replacement workers. The exit of older workers is partly offset by the addition of new workers (first-time new entrants to the workforce) aged 30 and younger; however, growth in the number of young entrants is slowing and, in many provinces, is even beginning to decline. These changes in the construction workforce are the largest overall force driving labour markets.
Short-term cycles in new construction expansion demand, driven by economic growth, can dominate conditions for short periods, but across the full 2016–2025 scenario period, retirements will create the largest demand for new workers.
Figure 5 shows the estimated replacement demand (retirement plus mortality) for residential construction workers over the next decade from 2016 to 2025. Nationally, replacement demands are estimated at 118,000 workers, or 23 percent of the current residential workforce. This reflects a significant loss of skilled workers.
18 Net mobility refers to the arrival of workers from outside the local construction industry.

18
Applying the new supply-side measures to the residen-tial workforce signals that the labour force will decline by 31,000 workers across the 2016–2025 scenario as new housing markets slow. Replacement demands total 118,000 workers and 95,000 young Canadians are estimated to join the residential workforce. The estimate for the arriving young people is based on the historical share of the population that has joined construction. Construction employers will need to attract youth to construction in competition with other industries who face similar demographic challenges.
Adding to market challenges, the current forecast scenario suggests that unemployment will not be a reliable source of recruiting across much of the scenario period. New housing cycles will create brief periods of rising unemployment among the residential trades; however, the continuing demands in renovation and the limited number of new entrants will keep unemploy-ment below historical levels, even in a weak market.
Mobility To balance markets and meet industry’s labour demand requirements from 2016 to 2025, the Construction and Maintenance Looking Forward forecast scenario suggests the increasing importance of mobility across locations (e.g., regions, provinces, international) and sectors (i.e., new housing, renovations, and industrial, commercial and institutional).
Home builders participating on the BuildForce LMI committees report that interprovincial mobility often provides needed residential workers where markets are strong. The forecast scenario tracks the potential for geographic mobility of residential workers. The 2016 Construction and Maintenance Looking Forward analysis, for example, captures the emerging impact of the oil price decline in Alberta. Lower oil prices drive down new housing in Alberta from 2015 to 2018, creating the first significant weakening since the abrupt, but brief drop in 2009. As residential labour requirements
0
2,000
4,000
6,000
8,000
10,000
12,000
14,000
20252024202320222021202020192018201720162015201420132012
Replacement demand = Retirements + Mortality
Num
ber o
f wor
kers
FIGURE5 Residential replacement demand (retirements), Canada
Forecast
Source: BuildForce Canada

19
in Alberta ease off, there is continuing growth in Manitoba. Another notable market shift in the 2016 scenario is the relative strength of housing in Ontario (Greater Toronto Area) and the related potential need to draw workers from other Ontario regions. These and other market trends signal the potential direction and duration of labour force movements across regions. There is no doubt that the workforce has grown more mobile in recent years19 and the final extent of the projected movements will depend on the portabil-ity of skills and experience and the flexibility of provincial regulations.
Mobility within the residential sector and between construction sectors is also possible. Within the residential industry, potential exists for workers to shift from low-rise new housing starts to renovation work. There is anecdotal evidence that mobility has been increasing within the residential workforce. Looking across all construction sectors, the workforce in some provinces has the potential to shift workers out of high-rise residential into commercial, and possibly, institutional work.
The dominant challenge across all provinces, however, is the aging workforce and the need to replace skilled workers as retirements rise. Nationally, and in each province, there will be shortfalls that will require increased immigration. This development is not unique to residential construction, as many other employers will face the same recruiting challenge.
GapsThe industry needs more refined statistics that define and measure the existing workforce, including essential details such as age profiles and skills. Beyond this, human resource planners need to know more about the portability of skills, experience and mobility across markets and regions.
In order to improve the assessment of residential labour market conditions, more research is needed in the area of regional and sector mobility. Improvements and additions to statistical sources noted in section 2 is a key first step. Measures of changing employment, labour force, unemployment and migration for resi-dential workers will create a new foundation for the analysis. These sources, however, will not include detailed measures of the mobility of the workforce and the portability of skills across regions and between residential and non-residential sectors.
A key industry challenge in addressing an aging work-force is the long-term adjustment required to prepare new entrants and upgrade the less-skilled employed to replace retiring workers. Replacement demand will rise steadily each year over the scenario period and the annual challenge will be to bring forward qualified workers at the same pace. There is a critical lag here, as time is required for new entrants and unskilled workers to acquire needed skills and experience.
19 See “Inter-provincial Employees in Canada” by Christine Laporte and Yuqian Lu, Analytical Studies Branch, Social Analysis Division, Statistics Canada, 2013, 11-626, No. 29.

20
This section describes the investment cycles in new housing and renovations, and the related employment trends and replacement demand for each province.
In virtually every province there is a steady rise in renovation activity that will add jobs across the scenario period. In provinces with older housing stocks (e.g., Manitoba, Ontario, Quebec, New Brunswick and Nova Scotia), renovation spending as a share of residential investment is notably higher.
The impact of these job gains in renovation work is set against the more cyclical change in new housing invest-ment. As population growth slows, household formation trends lower, which reduces housing starts.
There are variations in the cycles, however, especially where strong migration responds to economic development:
¿ In Alberta and Newfoundland and Labrador, a drop in new housing from 2016 to 2020 is a consequence of declining resource investments. This weakness is reversing the past in-migration and household formations are declining.
¿ In Ontario, new housing rises in the middle of the scenario period as the economy expands and brings in immigrants. In Manitoba, steady economic growth translates into a continued rise in new housing to 2018. These gains, combined with high and rising renovation activity, build the local residential workforce to higher levels in each successive year.
Over the scenario period, new housing and renovation demands, together, create a modest upward trend in employment for only a selected group of provinces, including Ontario, Manitoba and Prince Edward Island. In contrast, British Columbia, Alberta, Saskatchewan, Quebec, New Brunswick, Nova Scotia and Newfoundland and Labrador show notable declines over the long term.
For the first time, the 2016 BuildForce analysis includes an assessment of market conditions for trades and occupations in the residential sector using a ranking system that combines measures of the change in employment, unemployment, net mobility and adjustments based on industry input. The rankings are adapted to specific residential market conditions unique to each province based on current and pro-posed construction activity. Each market is assessed each year with a ranking that ranges from 1 to 5.
British Columbia Residential construction employment remains largely unchanged between 2016 and 2018, supported by stable new housing and growing renovation investment. A housing down cycle starts in 2019 as population growth slows and new housing declines.
¿ The current new housing cycle grew out of rising immigration, and from 2016 to 2019, employment is expected to remain near current levels.
4. Provincial highlights

21
» Moderate job losses in new housing are partially offset by gains in renovation work, but the total residential workforce is projected to decline modestly by 800 workers.
¿ From 2020 to 2025, new housing activity slows and employment declines by 10,000 jobs.
» Over the same period, renovation and mainten-ance work continues to grow, adding 2,000 jobs.
¿ There is a net loss of 9,300 residential jobs across the 2016‒2025 scenario period.
Recruiting will remain a priority for residential employers as the industry in British Columbia will need to meet replacement demands estimated at 20,000 workers across the scenario period.
Figures 6.1, 6.2 and 6.3 illustrate the changes in housing starts and household formation, new and renovation investment (adjusted for inflation in millions of 2007 dollars), and total residential employment, respectively.
0
5
10
15
20
25
30
35
40
45
2025202320212019201720152013201120092007200520032001
000s
OF
UN
ITS
FIGURE6.1 Residential construction: housing starts and household formation, British Columbia
Forecast
Household formationHousing starts
Source: BuildForce Canada
0
2,000
4,000
6,000
8,000
10,000
12,000
2025202320212019201720152013201120092007200520032001
RenovationNew housing
FIGURE6.2 Residential investment, $2007 millions*, British Columbia
Source: BuildForce Canada
* $2007 millions indicates that the investment values are in year 2007 dollars (base year), that is, adjusted for inflation. �is is used to calculate the real physical year-to-year change of the value of construction, factoring out growth (increase value) due to increases in prices.
Forecast

22
Table 1 shows the rankings for residential construc-tion in British Columbia. Rankings reflect the mild conditions in residential labour markets, with markets reported to be in balance with a rank of 3. A stable
peak in 2017 and 2018 retreats to a 2 in 2020 and 2022. This last period would be a time when weak markets might prompt workers to look for opportunities in other markets.
0
10,000
20,000
30,000
40,000
50,000
60,000
70,000
80,000
90,000
100,000
202520242023202220212020201920182017201620152014201320122011
Residential
Forecast
Empl
oym
ent
FIGURE6.3 Residential employment, British Columbia
Source: BuildForce Canada
Table 1: Residential Rankings, British Columbia
TRADES AND OCCuPATIONS ‒ RESIDENTIAL
2015 2016 2017 2018 2019 2020 2021 2022 2023 2024 2025
Bricklayers 3 3 3 3 3 2 2 2 3 3 3
Carpenters 3 3 3 3 3 2 2 2 3 3 3
Concrete finishers 3 3 3 3 3 3 2 3 3 3 3
Construction estimators 3 3 3 3 3 2 2 2 3 3 3
Construction managers 3 3 3 3 3 2 2 2 3 3 3
Contractors and supervisors 3 3 3 3 3 3 2 2 3 3 3
Crane operators 3 3 3 3 3 2 2 2 3 3 3
continued on next page
Market rankings
1 Qualified workers are available in local markets. Excess supply is apparent. Workers may move to other markets.
2 Qualified workers are available in local markets.
3 Qualified workers in the local market may be limited by short-term increases in demand. Established patterns of recruiting are sufficient.
4 Qualified workers are generally not available in local markets. Recruiting may extend beyond traditional sources and practices.
5 Qualified workers are not available in local markets. Competition is intense.

23
Alberta Alberta’s housing market tends to follow the cycle generated by the oil sands. Residential employment rose to a record peak level in 2014 and then began a down cycle, with employment falling by 5,000 jobs in 2015 to be followed by another 9,000 to 2019. A partial recovery after 2019 raises employment by 7,000 jobs before the scenario ends in 2025. Housing and job losses from 2014 to 2019 are similar in magnitude to the 2008–2009 downturn, but the cycle is spread out
over five years with a more moderate recovery that reflects the growing impact of demographic trends and declining immigration.
Job losses as new housing declines will cut 11,000 jobs from the sector from 2015 to 2019, but rising starts add back 5,000. The more stable renovation and maintenance markets will avoid major job losses, adding 2,300 jobs across the scenario period. Renovation work joins commercial building activity as one of the few more stable markets for construction employment.
TRADES AND OCCuPATIONS ‒ RESIDENTIAL
2015 2016 2017 2018 2019 2020 2021 2022 2023 2024 2025
Electricians 3 3 3 3 3 3 2 3 3 3 3
Elevator constructors and mechanics 3 3 3 3 3 3 3 3 3 3 3
Floor covering installers 3 3 3 3 3 3 3 3 3 3 3
Gasfitters 3 3 3 3 3 2 2 2 3 3 3
Glaziers 3 3 3 3 3 3 2 3 3 3 3
Heavy equipment operators (except crane) 3 3 3 3 3 2 2 2 3 3 3
Home building and renovation managers 3 3 3 3 3 3 3 2 3 3 3
Insulators 3 3 3 3 3 2 2 2 3 3 3
Ironworkers and structural metal fabricators 3 3 3 3 3 2 2 2 3 3 3
Painters and decorators (except interior decorators) 3 3 3 3 3 3 3 3 3 3 3
Plasterers, drywall installers and finishers, and lathers
3 3 3 3 3 2 2 3 3 3 3
Plumbers 3 3 3 3 3 3 3 3 3 3 3
Refrigeration and air conditioning mechanics 3 3 3 3 3 3 3 3 3 3 3
Residential and commercial installers and servicers 3 3 3 3 3 3 3 3 3 3 3
Roofers and shinglers 3 3 3 3 3 3 3 3 3 3 3
Sheet metal workers 3 3 3 3 3 2 2 2 3 3 3
Tilesetters 3 3 3 3 3 3 2 2 3 3 3
Trades helpers and labourers 3 3 3 3 3 2 2 3 3 3 3
Truck drivers 3 3 3 3 3 2 2 3 3 3 3
Welders and related machine operators 3 3 3 3 3 2 2 3 3 3 3
Source: BuildForce Canada

24
0
10
20
30
40
50
60
2025202320212019201720152013201120092007200520032001
000s
OF
UN
ITS
FIGURE7.1 Residential construction: housing starts and household formation, Alberta
Forecast
Household formationHousing starts
Source: BuildForce Canada
Hiring plans in Alberta must also take into account the pattern of demographic change that has created a relatively young residential workforce and lower retirement estimates than in other provinces, but still represent a large portion of future job opportunities.
Replacement demand in Alberta is estimated at 19,000 workers over the scenario period, representing 19 percent of the current workforce.
Figures 7.1, 7.2 and 7.3 illustrate the changes in housing starts and household formation, new and renovation investment (adjusted for inflation in millions of 2007 dollars), and total residential employment, respectively.
0
2,000
4,000
6,000
8,000
10,000
12,000
14,000
2025202320212019201720152013201120092007200520032001
FIGURE7.2 Residential investment, $2007 millions*, Alberta
Source: BuildForce Canada
* $2007 millions indicates that the investment values are in year 2007 dollars (base year), that is, adjusted for inflation. �is is used to calculate the real physical year-to-year change of the value of construction, factoring out growth (increase value) due to increases in prices.
Forecast
RenovationNew housing

25
Table 2 shows rankings for Alberta residential labour markets that reflect the decline in housing activity and job losses from 2015 to 2019. The rankings of 2 in those
years would indicate periods when workers might look for work in other markets or provinces.
0
10
20
30
40
50
60
70
80
90
202520242023202220212020201920182017201620152014201320122011
Forecast
000s
OF
WO
RKER
SEm
ploy
men
t
FIGURE7.3 Residential employment, Alberta
Residential
Source: BuildForce Canada
Table 2: Residential rankings, Alberta
TRADES AND OCCuPATIONS ‒ RESIDENTIAL
2015 2016 2017 2018 2019 2020 2021 2022 2023 2024 2025
Bricklayers 2 2 2 2 3 3 3 3 3 3 3
Carpenters 2 2 2 2 3 3 3 3 3 3 3
Concrete finishers 2 2 2 3 3 3 3 3 3 3 3
Construction estimators 2 2 2 2 2 3 3 3 3 3 3
Construction managers 2 2 2 2 2 2 3 3 3 3 3
Contractors and supervisors 2 2 2 2 2 3 3 3 3 3 3
continued on next page
Market rankings
1 Qualified workers are available in local markets. Excess supply is apparent. Workers may move to other markets.
2 Qualified workers are available in local markets.
3 Qualified workers in the local market may be limited by short-term increases in demand. Established patterns of recruiting are sufficient.
4 Qualified workers are generally not available in local markets. Recruiting may extend beyond traditional sources and practices.
5 Qualified workers are not available in local markets. Competition is intense.

26
TRADES AND OCCuPATIONS ‒ RESIDENTIAL
2015 2016 2017 2018 2019 2020 2021 2022 2023 2024 2025
Electricians 2 2 2 2 2 3 3 3 3 3 3
Floor covering installers 3 2 2 2 2 3 3 3 3 3 3
Gasfitters 2 2 2 2 2 3 3 3 3 3 3
Glaziers 2 2 2 2 2 3 3 3 3 3 3
Heavy equipment operators (except crane) 2 2 2 3 3 3 3 3 3 3 3
Heavy-duty equipment mechanics 2 2 2 2 3 3 3 3 3 3 3
Home building and renovation managers 2 2 2 3 3 3 3 3 3 3 3
Insulators 2 2 2 2 3 3 3 3 3 3 3
Painters and decorators (except interior decorators) 3 3 3 3 3 3 3 3 3 3 3
Plasterers, drywall installers and finishers, and lathers
2 2 2 2 3 3 3 3 3 3 3
Plumbers 2 2 2 2 2 3 3 3 3 3 3
Refrigeration and air conditioning mechanics 2 2 2 2 2 3 3 3 3 3 3
Residential and commercial installers and servicers 2 2 2 3 3 3 3 3 3 3 3
Roofers and shinglers 3 3 3 3 3 3 3 3 3 3 3
Sheet metal workers 2 2 2 2 2 3 3 3 3 3 3
Tilesetters 2 2 2 2 2 3 3 3 3 3 3
Trades helpers and labourers 2 2 2 2 2 3 3 3 3 3 3
Truck drivers 2 2 2 3 3 3 3 3 3 3 3
Source: BuildForce Canada
Saskatchewan Since 2012, when housing starts hit an all-time record of 10,000 units, weaker global demand and lower commod-ity prices have slowed resource developments and this has contributed to slower population growth and a housing downturn that is expected to continue across the scenario period.
The new housing down cycle translates into a decline of 3,600 jobs over the 2016‒2025 period that are only partly offset by a modest gain of 100 jobs in the renova-tion sector. The relatively new Saskatchewan housing stock drives a smaller maintenance and renovation market than might be found in other provinces.
Residential employment declines each year across the scenario period, falling back to the pre-2011 level of 13,000 workers that is consistent with an annual trend of 4,000 housing starts.
While hiring requirements for new housing construc-tion and renovation are declining, the residential industry faces demands to replace retiring workers. In Saskatchewan, the pattern of economic develop-ment and demographic change over the last decade has created a relatively young residential workforce. Estimated retirements are lower than in other provinces, but still represent a large portion of future demand requirements. In total, replacement requirements in Saskatchewan total, 3,200 workers across the scenario period.

27
0
2
4
6
8
10
12
2025202320212019201720152013201120092007200520032001
000s
OF
UN
ITS
FIGURE8.1 Residential construction: housing starts and household formation, Saskatchewan
Forecast
Household formationHousing starts
Source: BuildForce Canada
0
500
1,000
1,500
2,000
2,500
2025202320212019201720152013201120092007200520032001
FIGURE8.2 Residential investment, $2007 millions*, Saskatchewan
Source: BuildForce Canada
* $2007 millions indicates that the investment values are in year 2007 dollars (base year), that is, adjusted for inflation. �is is used to calculate the real physical year-to-year change of the value of construction, factoring out growth (increase value) due to increases in prices.
Forecast
RenovationNew housing
Figures 8.1, 8.2 and 8.3 illustrate the changes in housing starts and household formation, new and renovation investment (adjusted for inflation
in millions of 2007 dollars), and total residential employment, respectively.

28
0
2
4
6
8
10
12
14
16
18
20
202520242023202220212020201920182017201620152014201320122011
Residential
Forecast
000s
OF
WO
RKER
SEm
ploy
men
t
FIGURE8.3 Residential employment, Saskatchewan
Source: BuildForce Canada
Table 3 shows rankings for residential labour markets in Saskatchewan that reflect a mix of weak or balanced markets as employment moves gradually lower across the scenario period. In most years there is a balance of moderate job losses, retirements and new entrants.
Recruiting and job search will be confined to local areas. In 2015, 2018 and 2024 there are short periods when losses disrupt the balance and job seekers may be forced to look in other markets.
Market rankings
1 Qualified workers are available in local markets. Excess supply is apparent. Workers may move to other markets.
2 Qualified workers are available in local markets.
3 Qualified workers in the local market may be limited by short-term increases in demand. Established patterns of recruiting are sufficient.
4 Qualified workers are generally not available in local markets. Recruiting may extend beyond traditional sources and practices.
5 Qualified workers are not available in local markets. Competition is intense.
Table 3: Residential rankings, Saskatchewan
TRADES AND OCCuPATIONS ‒ RESIDENTIAL
2015 2016 2017 2018 2019 2020 2021 2022 2023 2024 2025
Bricklayers 2 3 3 3 3 3 3 3 3 3 3
Carpenters 2 3 3 2 3 3 3 3 3 2 3
Construction estimators 2 3 3 3 3 3 3 3 3 2 3
Construction managers 2 3 3 3 3 3 3 3 3 2 3
Contractors and supervisors 2 3 3 3 3 3 3 3 3 3 3
continued on next page

29
Manitoba Manitoba has been the destination for a growing number of international immigrants over the past decade and these new arrivals have driven new housing activity higher. This activity slowed during 2015, but resumes growth from 2016 to 2018. Levels are sustained to 2020, when a slow decline in housing starts begins, following slower population growth and a decline in household formation.
Manitoba has an older housing stock that is serviced by a large and slowly expanding renovation and maintenance sector.
The new housing cycle adds 1,500 jobs from 2016 to 2018, a 10 percent gain on 2015 levels. Activity then slows, losing almost 1,500 jobs to 2025, with a small net loss remaining at the end of the scenario period. A large renovation market adds 500 jobs with modest gains across the period, while maintenance work adds another 300. The residential maintenance and renovation workforce consists of similar trades and occupations as those working in new housing, but this group is distinguished by some degree of specialization and unique job experience.
In Manitoba, replacement demands are estimated at 3,300 workers, or 22 percent of the current residential labour force.
TRADES AND OCCuPATIONS ‒ RESIDENTIAL
2015 2016 2017 2018 2019 2020 2021 2022 2023 2024 2025
Electricians 2 3 3 2 3 3 3 3 3 2 3
Floor covering installers 2 3 3 3 3 3 3 3 3 3 3
Heavy equipment operators (except crane) 2 3 3 2 3 3 3 3 3 2 3
Home building and renovation managers 3 3 3 3 3 3 3 3 3 3 3
Painters and decorators (except interior decorators) 2 3 3 3 3 3 3 3 3 3 3
Plasterers, drywall installers and finishers, and lathers 2 3 3 3 3 3 3 3 3 2 3
Plumbers 2 3 3 3 3 3 3 3 3 3 3
Residential and commercial installers and servicers 2 3 3 3 3 3 3 3 3 3 3
Roofers and shinglers 2 3 3 3 3 3 3 3 3 3 3
Sheet metal workers 2 3 3 2 2 3 3 3 2 2 3
Trades helpers and labourers 2 3 2 2 3 3 3 2 2 2 3
Truck drivers 2 3 3 3 3 3 3 3 3 2 3
Source: BuildForce Canada

30
0
1
2
3
4
5
6
7
8
9
2025202320212019201720152013201120092007200520032001
000s
OF
UN
ITS
FIGURE9.1 Residential construction: housing starts and household formation, Manitoba
Forecast
Household formationHousing starts
Source: BuildForce Canada
Figures 9.1, 9.2 and 9.3 illustrate the changes in housing starts and household formation, new and renovation
investment (adjusted for inflation in millions of 2007 dollars), and total residential employment, respectively.
400
600
800
1,000
1,200
1,400
1,600
1,800
2,000
202520232021201920172015201320112009200720052003
FIGURE9.2 Residential investment, $2007 millions*, Manitoba
Source: BuildForce Canada
* $2007 millions indicates that the investment values are in year 2007 dollars (base year), that is, adjusted for inflation. �is is used to calculate the real physical year-to-year change of the value of construction, factoring out growth (increase value) due to increases in prices.
Forecast
RenovationNew housing
2001

31
Table 4 reports Manitoba residential market rankings, noting a few isolated years when
stronger markets and rising retirements drive tighter conditions.
0
2
4
6
8
10
12
14
16
18
202520242023202220212020201920182017201620152014201320122011
Forecast
000s
OF
WO
RKER
SEm
ploy
men
t
FIGURE9.3 Residential employment, Manitoba
Residential
Source: BuildForce Canada
Table 4: Residential rankings, Manitoba
TRADES AND OCCuPATIONS ‒ RESIDENTIAL
2015 2016 2017 2018 2019 2020 2021 2022 2023 2024 2025
Bricklayers 2 3 3 3 3 3 3 3 3 3 3
Carpenters 3 3 3 3 3 3 3 3 3 3 3
Concrete finishers 3 3 3 3 3 3 3 3 3 3 3
Construction estimators 2 3 3 3 3 3 3 3 3 3 3
Construction managers 2 4 4 3 3 3 3 3 3 3 3
Contractors and supervisors 2 3 3 3 3 3 3 3 3 3 3
Electricians 2 3 3 3 3 3 3 3 3 3 3
Floor covering installers 3 3 3 3 3 3 3 3 3 3 3
Home building and renovation managers 3 3 3 3 3 3 3 3 3 3 4
Painters and decorators (except interior decorators) 3 3 3 3 3 3 3 3 3 3 3
continued on next page
Market rankings
1 Qualified workers are available in local markets. Excess supply is apparent. Workers may move to other markets.
2 Qualified workers are available in local markets.
3 Qualified workers in the local market may be limited by short-term increases in demand. Established patterns of recruiting are sufficient.
4 Qualified workers are generally not available in local markets. Recruiting may extend beyond traditional sources and practices.
5 Qualified workers are not available in local markets. Competition is intense.

32
TRADES AND OCCuPATIONS ‒ RESIDENTIAL
2015 2016 2017 2018 2019 2020 2021 2022 2023 2024 2025
Plasterers, drywall installers and finishers, and lathers 2 3 3 3 3 3 3 3 3 3 3
Plumbers 2 3 3 3 3 3 3 3 3 3 3
Residential and commercial installers and servicers 3 3 3 3 3 3 3 3 3 3 3
Roofers and shinglers 3 3 3 3 3 3 3 3 3 3 3
Sheet metal workers 2 3 3 3 3 3 3 3 3 3 3
Trades helpers and labourers 2 4 4 3 3 3 3 3 3 3 3
Truck drivers 2 3 4 3 3 3 3 3 3 3 3
Source: BuildForce Canada
OntarioResidential employment in Ontario peaks in 2019 and then declines as new housing investment slows. By the end the scenario period, employment is down by 1,700 workers, or a modest 1 percent decline.
¿ A new housing cycle grows out of rising immigra-tion, adding 22,000 jobs from 2016 to 2019.
¿ The cycle reverses from 2020 to 2025, and employment in new housing markets drops just below 2015 levels.
¿ A large renovation market adds 2,000 jobs with modest gains across the scenario, while main-tenance work adds another 700.
¿ A small net loss of 1,700 jobs remains in 2025.
¿ The new housing cycle is volatile, with employment rising and then falling.
Market changes are concentrated in the Greater Toronto Area (GTA), where immigration tends to be focused. Half of the new housing impacts are in the local Toronto labour market, creating recruiting challenges.
Figures 10.1, 10.2 and 10.3 illustrate the changes in housing starts and household formation, new and renovation investment (adjusted for inflation in millions of 2007 dollars), and total residential employment, respectively.
Ontario employers will also need to plan for retirements estimated at 46,200 workers, or 22 percent of the current residential labour force across the scenario.
0
20
40
60
80
100
2025202320212019201720152013201120092007200520032001
000s
OF
UN
ITS
FIGURE10.1 Residential construction: housing starts and household formation, Ontario
Forecast
Household formationHousing starts
Source: BuildForce Canada

33
0
50
100
150
200
250
202520242023202220212020201920182017201620152014201320122011
Forecast
000s
OF
WO
RKER
SEm
ploy
men
t
FIGURE10.3 Residential employment, Ontario
Residential
Source: BuildForce Canada
0
5,000
10,000
15,000
20,000
25,000
2025202320212019201720152013201120092007200520032001
FIGURE10.2 Residential investments, $2007 millions*, Ontario
Source: BuildForce Canada
* $2007 millions indicates that the investment values are in year 2007 dollars (base year), that is, adjusted for inflation. �is is used to calculate the real physical year-to-year change of thevalue of construction, factoring out growth (increase value) due to increases in prices.
Forecast
RenovationNew housing
Table 5 shows Ontario rankings that are notably stronger than in the other provinces. Markets are tight from 2016 to 2018, with the new housing activity concentrated in the GTA and Central Ontario. Lower rankings – often periods of weak markets with a
2 rank – are common in some regions of Ontario and further afield, in Alberta. Such a clear market divergence creates the potential for mobility.

34
Market rankings
1 Qualified workers are available in local markets. Excess supply is apparent. Workers may move to other markets.
2 Qualified workers are available in local markets.
3 Qualified workers in the local market may be limited by short-term increases in demand. Established patterns of recruiting are sufficient.
4 Qualified workers are generally not available in local markets. Recruiting may extend beyond traditional sources and practices.
5 Qualified workers are not available in local markets. Competition is intense.
Table 5: Residential rankings, Ontario
TRADES AND OCCuPATIONS ‒ RESIDENTIAL
2015 2016 2017 2018 2019 2020 2021 2022 2023 2024 2025
Bricklayers 3 3 3 3 3 3 3 3 3 3 3
Carpenters 3 3 3 3 3 3 3 3 3 3 3
Concrete finishers 3 3 3 3 3 3 3 3 3 3 3
Construction estimators 3 3 4 3 3 3 3 3 2 3 3
Construction managers 4 4 4 4 3 3 3 2 2 2 2
Contractors and supervisors 3 3 3 3 3 3 3 3 3 3 3
Crane operators 4 4 4 4 3 3 3 2 2 2 2
Electricians 3 3 4 3 3 3 3 3 2 2 3
Elevator constructors and mechanics 3 4 4 4 3 3 3 2 3 3 3
Floor covering installers 3 3 3 3 3 3 3 3 3 3 3
Gasfitters 3 3 3 3 3 3 3 3 2 3 3
Glaziers 4 4 4 4 3 3 3 2 2 2 2
Heavy equipment operators (except crane) 3 3 3 3 3 3 3 3 2 3 3
Heavy-duty equipment mechanics 3 3 4 4 3 3 3 3 3 3 3
Home building and renovation managers 3 3 3 3 3 3 3 3 3 3 3
Insulators 3 3 3 3 3 3 3 3 3 3 3
Ironworkers and structural metal fabricators 4 3 4 4 3 3 3 2 2 2 2
Painters and decorators (except interior decorators) 3 3 3 3 3 3 3 3 3 3 3
Plasterers, drywall installers and finishers, and lathers 3 3 4 3 3 3 3 3 3 3 3
Plumbers 3 3 4 3 3 3 3 3 2 2 3
Refrigeration and air conditioning mechanics 3 3 4 3 3 3 3 3 2 2 3
Residential and commercial installers and servicers 3 3 3 3 3 3 3 3 3 3 3
Roofers and shinglers 3 3 3 3 3 3 3 3 3 3 3
Sheet metal workers 3 3 4 3 3 3 3 3 2 2 3continued on next page

35
0
10
20
30
40
50
60
70
2025202320212019201720152013201120092007200520032001
000s
OF
UN
ITS
FIGURE11.1 Residential construction: housing starts and household formation, Quebec
Forecast
Household formationHousing starts
Source: BuildForce Canada
TRADES AND OCCuPATIONS ‒ RESIDENTIAL
2015 2016 2017 2018 2019 2020 2021 2022 2023 2024 2025
Steamfitters, pipefitters and sprinkler system installers 3 3 3 3 3 3 3 3 3 3 3
Tilesetters 3 3 4 4 3 3 3 2 2 2 2
Trades helpers and labourers 3 3 4 3 3 3 3 3 2 2 3
Truck drivers 3 3 3 3 3 3 3 3 3 3 3
Welders and related machine operators 3 3 4 4 3 3 3 2 2 2 3
Source: BuildForce Canada
QuebecAcross the 2016–2025 scenario period, new housing in Quebec will cycle up in 2016, remain relatively unchanged to 2021, and then decline for the remainder of the period to 2025, in line with household formation.
Across the scenario period, employment in new housing is estimated to decline by 32 percent from current levels. With some of the oldest housing stocks in Canada, however, Quebec’s market for maintenance and renovation is much larger and more stable than its new housing market. Overall, employment in residential-related work will be supported by regular, rising demand for renovation work.
Across the decade, residential employment will drop by 8 percent, as losses in new housing are not fully offset by gains in renovation.
In Quebec, retirements are estimated at 20,300 workers, or 23 percent of the current residential labour force.
Figures 11.1, 11.2 and 11.3 illustrate the changes in housing starts and household formation, new and renovation investment (adjusted for inflation in millions of 2007 dollars), and total residential employment, respectively.

36
0
2,000
4,000
6,000
8,000
10,000
12,000
14,000
16,000
2025202320212019201720152013201120092007200520032001
FIGURE11.2 Residential investment, $2007 millions*, Quebec
Source: BuildForce Canada
* $2007 millions indicates that the investment values are in year 2007 dollars (base year), that is, adjusted for inflation. �is is used to calculate the real physical year-to-year change of the value of construction, factoring out growth (increase value) due to increases in prices.
Forecast
RenovationNew housing
0
10
20
30
40
50
60
70
80
90
202520242023202220212020201920182017201620152014201320122011
Forecast
000s
OF
WO
RKER
SEm
ploy
men
t
FIGURE11.3 Residential employment, Quebec
Residential
Source: BuildForce Canada
Table 6 shows residential rankings in Quebec that track generally balanced markets, as the new housing cycle is mild. There is an annual balance of new entrants arriving to meet requirements. This pattern does not fully capture the challenges of replacing retiring
workers with specialized skills and experience. Some older management and supervisory occupations are particularly vulnerable to shortages for this reason and these factors appear in rankings for some years.

37
Table 6: Residential rankings, Quebec
TRADES AND OCCuPATIONS ‒ RESIDENTIAL
2015 2016 2017 2018 2019 2020 2021 2022 2023 2024 2025
Bricklayers 3 3 3 3 3 3 3 3 3 3 3
Carpenters 3 3 3 3 3 3 3 3 3 3 3
Concrete finishers 3 3 3 3 3 3 3 3 3 3 3
Construction estimators 2 3 3 3 3 3 3 3 2 3 3
Construction managers 3 4 3 3 3 3 3 3 2 3 3
Contractors and supervisors 2 3 3 3 3 3 3 3 3 3 3
Electricians 3 3 3 3 3 3 3 3 3 3 3
Floor covering installers 3 3 3 3 3 3 3 3 3 3 3
Heavy equipment operators (except crane) 3 3 3 3 3 3 3 3 3 3 3
Heavy-duty equipment mechanics 3 3 3 3 3 3 3 3 3 3 3
Home building and renovation managers 3 3 3 4 4 4 4 4 3 3 3
Ironworkers and structural metal fabricators 3 3 3 3 3 3 3 3 3 3 3
Painters and decorators (except interior decorators) 3 3 3 3 3 3 3 3 3 3 3
Plasterers, drywall installers and finishers, and lathers 3 3 3 3 3 3 3 3 3 3 3
Plumbers 3 3 3 3 3 3 3 3 3 3 3
Refrigeration and air conditioning mechanics 3 3 3 3 3 3 3 3 3 3 3
Residential and commercial installers and servicers 3 3 3 3 3 3 3 3 3 3 3
Roofers and shinglers 3 3 3 3 3 3 3 3 3 3 3
Sheet metal workers 3 3 3 3 3 3 3 3 3 3 3
Tilesetters 3 3 3 3 3 3 3 3 3 3 3
Trades helpers and labourers 3 3 3 3 3 3 3 3 3 3 3
Source: BuildForce Canada
Market rankings
1 Qualified workers are available in local markets. Excess supply is apparent. Workers may move to other markets.
2 Qualified workers are available in local markets.
3 Qualified workers in the local market may be limited by short-term increases in demand. Established patterns of recruiting are sufficient.
4 Qualified workers are generally not available in local markets. Recruiting may extend beyond traditional sources and practices.
5 Qualified workers are not available in local markets. Competition is intense.

38
New BrunswickNew Brunswick housing activity hit a peak in 2010 followed by a decline that continued through 2015 and is expected to bottom out in 2016. A rise in new housing adds 600 jobs and is expected to peak in 2020 before turning down until 2025.
A modest gain in renovation work helps total residential employment to sustain its 2015 level at the end of the scenario period.
In New Brunswick, retirements are estimated at 3,500 workers, or 26 percent of the current residential labour force.
Figures 12.1, 12.2 and 12.3 illustrate the changes in housing starts and household formation, new and renovation investment (adjusted for inflation in millions of 2007 dollars), and total residential employment, respectively.
0
500
1,000
1,500
2,000
2,500
3,000
3,500
4,000
4,500
5,000
2025202320212019201720152013201120092007200520032001
FIGURE12.1 Residential construction: housing starts and household formation, New Brunswick
Forecast
Household formationHousing starts
Source: BuildForce Canada
0
200
400
600
800
1,000
1,200
1,400
2025202320212019201720152013201120092007200520032001
FIGURE12.2 Residential investment, $2007 millions*, New Brunswick
Source: BuildForce Canada
* $2007 millions indicates that the investment values are in year 2007 dollars (base year), that is, adjusted for inflation. �is is used to calculate the real physical year-to-year change of the value of construction, factoring out growth (increase value) due to increases in prices.
Forecast
RenovationNew housing

39
Table 7 shows New Brunswick rankings that capture the challenges that can be expected to meet require-ments as employment rises from 2018 to 2020. Labour requirements in 2018 and 2019 strain markets
because of rising retirements and the very limited pool of local youth that is available for work. Recruiting to meet demands may need to turn to other markets in Atlantic Canada.
0
2
4
6
8
10
12
14
202520242023202220212020201920182017201620152014201320122011
Forecast
000s
OF
WO
RKER
SEm
ploy
men
tFIGURE
12.3 Residential employment, New Brunswick
Residential
Source: BuildForce Canada
Market rankings
1 Qualified workers are available in local markets. Excess supply is apparent. Workers may move to other markets.
2 Qualified workers are available in local markets.
3 Qualified workers in the local market may be limited by short-term increases in demand. Established patterns of recruiting are sufficient.
4 Qualified workers are generally not available in local markets. Recruiting may extend beyond traditional sources and practices.
5 Qualified workers are not available in local markets. Competition is intense.
Table 7: Residential rankings, New Brunswick
TRADES AND OCCuPATIONS ‒ RESIDENTIAL
2015 2016 2017 2018 2019 2020 2021 2022 2023 2024 2025
Bricklayers 3 3 3 3 4 3 3 3 3 3 3
Carpenters 2 3 3 3 4 4 3 3 3 3 3
Construction estimators 2 3 3 4 4 3 3 3 3 3 3
Construction managers 2 3 4 4 4 4 3 3 3 3 3
Contractors and supervisors 3 3 3 3 3 3 3 3 3 3 3
continued on next page

40
Prince Edward IslandSimilar to the cycle in New Brunswick, a housing cycle in Prince Edward Island that starts in 2016 is expected to peak in 2021 and then recede with declining population growth, but employment remains well above the recent historical record high levels reached in 2011 and 2012.
Prince Edward Island stands out among the Atlantic provinces in the 2016 scenario, as weak natural population growth and rising retirements due to an aging population create a need to draw new residents to the region to meet increasing labour market demand. As a result, household formation is on a rising trend and housing starts rise to keep pace. Employment gains from 2016 to 2021 reach more than 30 percent of the
2015 starting level. Losses from 2022 to 2025 are equally cyclical, as demographic trends take hold in the final years of the scenario. Overall residential employ-ment finishes the period with a 12 percent gain from 2015 levels, with gains in new housing, renovations and maintenance.
In addition to the strong cycle in new housing, residential employers will need to cope with the loss of more than 700 workers to retirement across the scenario period.
Figures 13.1, 13.2 and 13.3 illustrate the changes in housing starts and household formation, new and renovation investment (adjusted for inflation in millions of 2007 dollars), and total residential employment, respectively.
TRADES AND OCCuPATIONS ‒ RESIDENTIAL
2015 2016 2017 2018 2019 2020 2021 2022 2023 2024 2025
Electricians 2 3 3 3 4 3 3 3 3 3 3
Floor covering installers 3 3 3 3 3 3 3 3 3 3 3
Heavy equipment operators (except crane) 2 3 3 3 4 4 3 3 3 3 3
Home building and renovation managers 3 3 3 3 4 4 3 3 4 4 4
Painters and decorators (except interior decorators) 3 3 3 3 4 3 3 3 3 3 3
Plasterers, drywall installers and finishers, and lathers 3 3 3 3 3 3 3 3 3 3 3
Plumbers 3 3 3 3 3 3 3 3 3 3 3
Residential and commercial installers and servicers 3 3 3 3 3 3 3 3 3 3 3
Roofers and shinglers 3 3 3 3 3 3 3 3 3 3 3
Trades helpers and labourers 2 3 3 3 3 3 3 3 3 3 3
Truck drivers 2 3 3 3 4 4 3 3 3 3 3
Source: BuildForce Canada

41
0
50
100
150
200
250
2025202320212019201720152013201120092007200520032001
FIGURE13.2 Residential investment, $2007 millions*, Prince Edward Island
Source: BuildForce Canada
* $2007 millions indicates that the investment values are in year 2007 dollars (base year), that is, adjusted for inflation. �is is used to calculate the real physical year-to-year change of the value of construction, factoring out growth (increase value) due to increases in prices.
Forecast
RenovationNew housing
0
200
400
600
800
1,000
1,200
1,400
2025202320212019201720152013201120092007200520032001
FIGURE13.1 Residential construction: housing starts and household formation, Prince Edward Island
Forecast
Household formationHousing starts
Source: BuildForce Canada

42
Rankings for Prince Edward Island, shown in Table 8, capture the strains on local markets with rankings of 4 for several trades and occupations from 2016 to 2021.
Indeed, the volatility of the cycle is reflected in the extent of recruiting challenges expected for residential electricians in 2020.
0
500
1,000
1,500
2,000
2,500
3,000
202520242023202220212020201920182017201620152014201320122011
Forecast
Empl
oym
ent
FIGURE13.3 Residential employment, Prince Edward Island
Residential
Source: BuildForce Canada
Table 8: Residential rankings, Prince Edward Island
TRADES AND OCCuPATIONS ‒ RESIDENTIAL
2015 2016 2017 2018 2019 2020 2021 2022 2023 2024 2025
Carpenters 3 3 4 4 3 4 3 3 2 3 3
Contractors and supervisors 4 3 3 4 3 4 3 3 3 3 3
Electricians 3 3 4 4 3 5 3 2 2 2 2
Home building and renovation managers 4 3 3 4 3 4 4 3 3 3 3
Painters and decorators (except interior decorators) 3 3 3 3 3 4 3 3 3 3 3
Residential and commercial installers and servicers 3 3 3 3 3 4 3 3 3 3 3
Trades helpers and labourers 3 3 4 4 3 4 3 2 2 2 2
Source: BuildForce Canada
Market rankings
1 Qualified workers are available in local markets. Excess supply is apparent. Workers may move to other markets.
2 Qualified workers are available in local markets.
3 Qualified workers in the local market may be limited by short-term increases in demand. Established patterns of recruiting are sufficient.
4 Qualified workers are generally not available in local markets. Recruiting may extend beyond traditional sources and practices.
5 Qualified workers are not available in local markets. Competition is intense.

43
0
1,000
2,000
3,000
4,000
5,000
6,000
2025202320212019201720152013201120092007200520032001
FIGURE14.1 Residential construction: housing starts and household formation, Nova Scotia
Forecast
Household formationHousing starts
Source: BuildForce Canada
Nova ScotiaInvestment growth in Nova Scotia’s new housing market ended in 2012 and housing starts declined in 2013 and 2014. Activity stabilized briefly in 2015, but the down cycle resumes in 2016 and carries starts lower to 2018. Housing starts are estimated to average 1,700 units for the balance of the scenario period.
The decline in new housing reflects slower population growth and declines in household formation. Employment in new housing drops by almost 2,500 jobs, with most of the losses expected in 2017 and 2018. In contrast, renovation activity expands to sustain the older housing stock and 400 new jobs moderate the impact in the residential sector. The age of the housing stock is also a factor in the demand for new housing. It is estimated that a portion of the existing stock will
need to be replaced, rather than renovated, and these demands will add to housing starts even as the number of household formations declines after 2019.
Home builders and contractors will face rising replace-ment demands as 4,000 workers leave the labour force, creating challenges in finding skilled and experienced workers to replace these losses. Recruiting and related training will be the dominant challenge for human resource management in residential construction over the scenario period.
Figures 14.1, 14.2 and 14.3 illustrate the changes in housing starts and household formation, new and renovation investment (adjusted for inflation in millions of 2007 dollars), and total residential employment, respectively.

44
0
200
400
600
800
1,000
1,200
1,400
1,600
1,800
2025202320212019201720152013201120092007200520032001
FIGURE14.2 Residential investment, $2007 millions*, Nova Scotia
Source: BuildForce Canada
* $2007 millions indicates that the investment values are in year 2007 dollars (base year), that is, adjusted for inflation. �is is used to calculate the real physical year-to-year change of the value of construction, factoring out growth (increase value) due to increases in prices.
Forecast
RenovationNew housing
0
2
4
6
8
10
12
14
16
18
202520242023202220212020201920182017201620152014201320122011
Forecast
000s
OF
WO
RKER
SEm
ploy
men
t
FIGURE14.3 Residential employment, Nova Scotia
Residential
Source: BuildForce Canada

45
Table 9: Residential rankings, Nova Scotia
TRADES AND OCCuPATIONS ‒ RESIDENTIAL
2015 2016 2017 2018 2019 2020 2021 2022 2023 2024 2025
Bricklayers 3 3 2 2 3 3 3 3 3 3 3
Carpenters 3 3 2 2 3 3 3 3 3 3 3
Construction estimators 3 3 2 2 3 3 3 3 3 3 4
Construction managers 4 3 2 2 3 3 3 3 3 4 4
Contractors and supervisors 3 3 2 2 3 3 3 3 3 3 4
Electricians 3 3 2 2 3 3 3 3 3 3 3
Floor covering installers 3 3 2 3 3 3 3 3 3 3 3
Heavy equipment operators (except crane) 3 3 2 2 3 3 3 3 3 3 3
Home building and renovation managers 3 3 3 3 3 4 4 4 4 4 4
Painters and decorators (except interior decorators) 3 3 2 3 3 3 3 3 3 3 3
Plasterers, drywall installers and finishers, and lathers 3 3 2 2 3 3 3 3 3 3 3
Plumbers 3 3 2 2 3 3 3 3 3 3 4
Residential and commercial installers and servicers 3 3 2 3 3 3 3 3 3 3 3
Roofers and shinglers 3 3 3 3 3 3 3 3 3 3 3
Trades helpers and labourers 3 3 2 2 3 3 3 3 3 3 3
Truck drivers 3 3 2 2 3 3 3 3 3 3 3
Source: BuildForce Canada
Market rankings
1 Qualified workers are available in local markets. Excess supply is apparent. Workers may move to other markets.
2 Qualified workers are available in local markets.
3 Qualified workers in the local market may be limited by short-term increases in demand. Established patterns of recruiting are sufficient.
4 Qualified workers are generally not available in local markets. Recruiting may extend beyond traditional sources and practices.
5 Qualified workers are not available in local markets. Competition is intense.
In Table 9, residential rankings for Nova Scotia show generally balanced conditions with some weakness anticipated in 2017 and 2018. This latter period
coincides with a stronger housing market in New Brunswick and Prince Edward Island that signals the potential for mobility.

46
Newfoundland and LabradorThe older age profile of the Newfoundland and Labrador population crossed a key threshold in 2014 when estimated deaths exceeded births for the first time. As deaths rise and births decline across the scenario period, the natural population declines, carrying the provincial labour force and household formations lower. International immigration and interprovincial in-mobility will be key to sustaining long-term population growth.
Activity tied to resource projects attracted in-migration from 2010 to 2013. Associated gains in household formation prompted a rise in housing starts and growing residential construction employment. Housing peaked in 2011 and trends turned down, with starts and employ-ment declining in each year from 2011 to 2015.
The province’s population declines across the scenario period, as estimated migration is not high enough to offset the impact of natural loss. The departure of the resource project workforce from 2016 to 2019
aggravates these trends and household formations decline. Housing starts fall to a long-term historical level that reflects the need to replace an aging housing stock.
Much of the decline in residential employment occurred prior to the start of the scenario period. Residential construction employment falls modestly from 2016 to 2019.
¿ An estimated 350 jobs are lost.
¿ As the resource cycle turns up after 2020, there is limited revival in in-migration and related work on renovations and maintenance.
A small gain in employment from 2020 to 2025 leaves employment with a net loss of 300 jobs across the scenario period.
Retirements are estimated at 2,000 workers, or 32 percent of the current residential labour force.
Figures 15.1, 15.2 and 15.3 illustrate the changes in housing starts and household formation, new and renovation investment (adjusted for inflation in millions of 2007 dollars), and total residential employment, respectively.
-1,000
-500
0
500
1,000
1,500
2,000
2,500
3,000
3,500
4,000
4,500
2025202320212019201720152013201120092007200520032001
FIGURE15.1 Residential construction: housing starts and household formation, Newfoundland and Labrador
Forecast
Household formationHousing starts
Source: BuildForce Canada
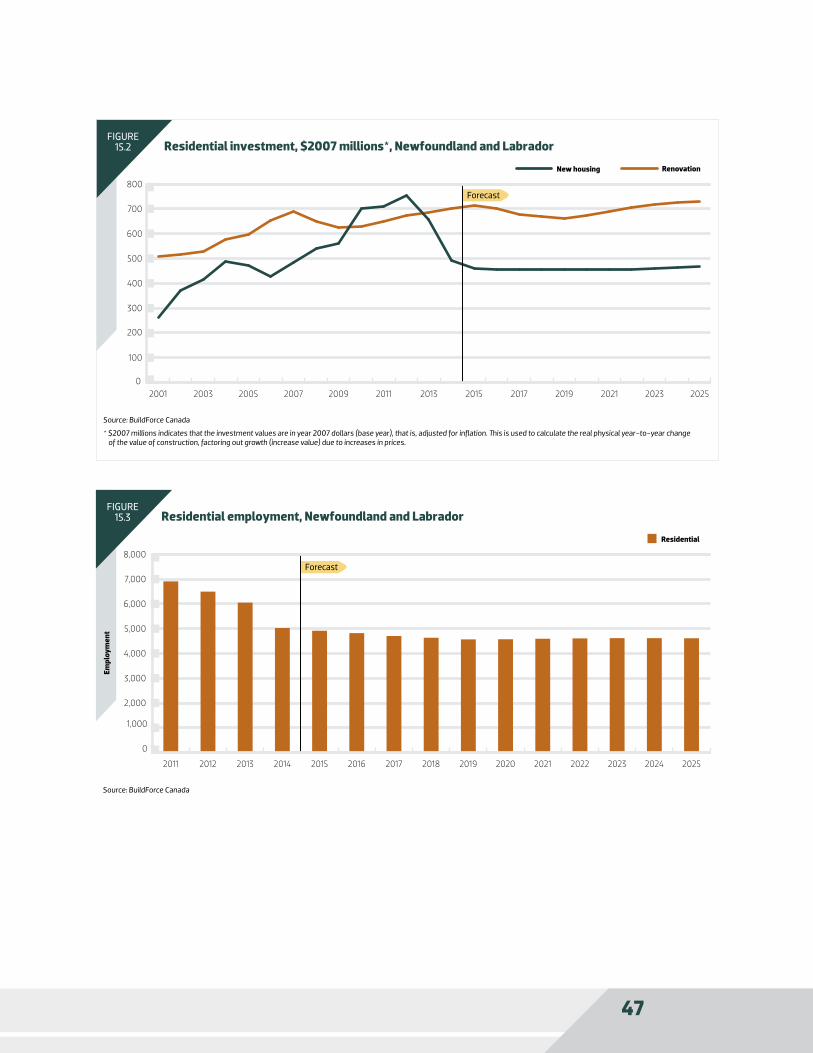
47
0
1,000
2,000
3,000
4,000
5,000
6,000
7,000
8,000
202520242023202220212020201920182017201620152014201320122011
Forecast
Empl
oym
ent
FIGURE15.3 Residential employment, Newfoundland and Labrador
Residential
Source: BuildForce Canada
0
100
200
300
400
500
600
700
800
2025202320212019201720152013201120092007200520032001
FIGURE15.2 Residential investment, $2007 millions*, Newfoundland and Labrador
Source: BuildForce Canada
* $2007 millions indicates that the investment values are in year 2007 dollars (base year), that is, adjusted for inflation. �is is used to calculate the real physical year-to-year change of the value of construction, factoring out growth (increase value) due to increases in prices.
Forecast
RenovationNew housing

48
Table 10: Residential rankings, Newfoundland and Labrador
TRADES AND OCCuPATIONS ‒ RESIDENTIAL
2015 2016 2017 2018 2019 2020 2021 2022 2023 2024 2025
Carpenters 3 3 3 3 3 3 3 3 3 3 3
Construction managers 3 3 3 3 3 3 3 3 3 3 3
Contractors and supervisors 3 3 3 3 3 3 3 3 3 3 3
Electricians 3 3 3 3 3 3 3 3 3 3 3
Home building and renovation managers 3 3 3 3 3 3 4 4 3 3 3
Painters and decorators (except interior decorators) 3 3 3 3 3 3 3 3 3 3 3
Plasterers, drywall installers and finishers, and lathers 3 3 3 3 3 3 3 3 3 3 3
Plumbers 3 3 3 3 3 3 3 3 3 3 3
Residential and commercial installers and servicers 3 3 3 3 3 3 3 3 3 3 3
Roofers and shinglers 3 3 3 3 3 3 3 3 3 3 3
Trades helpers and labourers 3 3 3 3 3 3 3 3 3 3 3
Source: BuildForce Canada
Market rankings
1 Qualified workers are available in local markets. Excess supply is apparent. Workers may move to other markets.
2 Qualified workers are available in local markets.
3 Qualified workers in the local market may be limited by short-term increases in demand. Established patterns of recruiting are sufficient.
4 Qualified workers are generally not available in local markets. Recruiting may extend beyond traditional sources and practices.
5 Qualified workers are not available in local markets. Competition is intense.
Table 10 shows mostly balanced residential markets in Newfoundland and Labrador, as retirements balance lower market demands. A key human resource challenge lies behind these numbers, as the skills of new entrants starting work in the housing industry will not match the specialized skills and experience of the retiring
workforce. This intergenerational shift is often a factor in other provinces, but Newfoundland and Labrador’s much older age profile and significant decline in market demand make this condition a higher priority in the province.

49
In many ways, the main themes and labour market implications are the same in residential and non- residential construction. Both feel the dominant impact of demographics, retirement and the essential role of workforce mobility for labour market adjustments in the future.
This report, however, recognizes the particular needs and circumstances that challenge residential employers, including rising retirements, the tracking of cycles in new housing, trends in renovation, and the impact of these on the distribution of work across trades and occupations.
New analytical features and the shifting impact of demographics and market demands bring a new insight to the 2016 Construction and Maintenance Looking Forward forecast.
Declining employment in new housing in many provinces is mostely offset by increased renovation requirements across the scenario period. In most cases, market job reductions in new construction, when combined with the estimated number of new entrants of young people, create a new workforce that offsets expected retire-ments. This shows the appearance of market balance – especially as the market rankings in this case will likely report as a 3 – but this balance is misleading. As noted in the Newfoundland and Labrador case, the challenge arises that the available workforce of the young and unemployed lacks the specialized skills and experience of the retiring workforce.
Significant recruiting and training challenges remain, as industry will need to fill the middle ranks, preparing the next generation of supervisors and managers. This will be a big challenge in a situation of weak market demands. Not all provinces seem destined to face this combination of circumstances, but given the demographics across Canada, any extended housing downturn could create these challenges – especially if weak markets prompt older workers to retire early.
These new insights combine with the ongoing data gaps. Improvements are needed to current statistical sources and related research to measure the mix of skills and qualifications, the availability of residential specializa-tions and the mobility of the workforce. As measures improve and research expands, the labour market information reported in this annual report can include more detailed measures for key residential occupations (e.g., framers, formworkers, finish carpenters, residen-tial HVAC work, etc.) and work in related areas such as manufactured housing.
BuildForce Canada looks forward to using the findings in this report to open a broader and deeper dialogue with residential employers as the National Residential Construction Industry LMI Committee reaches out to gather further input.
5. Conclusion

Timely construction forecast data is available online at www.constructionforecasts.ca.
Create customized reports on a broad range of selected categories within sector, trade or
province covering up to 10 years.
For more information, contact:BuildForce Canada
Phone: [email protected]
February 2016 Funded by the Government of Canada’s Sectoral Initiatives Program
The opinions and interpretations in this publication are those of the authorand do not necessarily reflect those of the Government of Canada.