Laboratory Tests of Platelet Function · Laboratory Tests of Platelet Function H. JAMES DAY, M.D....
12
Annals of Clinical Laboratory Science, Vol. 2, No. 1 Copyright © 1972, Institute for Clinical Science Laboratory Tests of Platelet Function H. JAMES DAY, M.D. and HOLM HOLMSEN, Ph .D. Hematology Laboratories, Temple University School of Medicine Philadelphia, PA 19140 Introduction There has been growing interest in the role of platelets in the hemostatic process. Following injury to the blood vessel wall, the platelets are exposed to some substance in the basement membrane, which may or may not be collagen, which leads to the rapid formation of a platelet plug. The steps involved here are those of adhesion to the site of injury and exposed basement membrane, then aggregation of the plate- lets during which time the platelets un- dergo a release reaction. Formation of a permeable platelet plug then occurs and finally, the subsequent development into a hemostatic plug with the incorporation of fibrin strands. It is important to note that the time needed for the formation of a plate- let plug correlates well with the bleeding time measured from the beginning of the infliction of the wound to the time the bleeding ceases, i.e., approximately 6 min- utes. Thus, in performing a bleeding time, the steps are measured which are necessary for platelet plug formation. In vitro the function of platelets is tested by measuring platelet adhesion to glass, aggregation with various agents, the release reaction, clot re- traction, platelet-phagocytosis and platelet uptake of numerous substances. Platelets contain large amounts of ade- nine nucleotides which are released during the platelet release reaction, an important step in hemostasis. Possibly the most im- portant adenine nucleotide released is ADP, a powerful platelet aggregating substance. Platelets also contribute a major source of phospholipids required for platelet coagula- tion and this has been identified as platelet factor 3 or platelet thromboplastic factor. This phospholipid is not normally available on the platelet surface and only becomes so when the platelets are altered or acti- vated. Hardisty and Hutton 1 have shown that Kaolin makes this thromboplastic activ- ity available and Spaet and Cintron24 have shown that connective tissue suspensions are equally active. Platelets are also re- quired for clot retraction, the energy for which is derived from the breakdown of platelet ATP to ADP. During this time, fibrin strands form which tend to radiate between the clumps of platelets which act as the nidus of clot retraction. To date, clot retraction has only been shown to be abnor- mal in those patients who have a defect known as thrombasthenia and in those who lack a normal number of platelets, i.e., thrombocytopenia. It is uncertain which role clot retraction plays in the mainte- nance of normal hemostasis. 5-Hydroxytryptamine (5-HT), a power- ful vasoconstrictor, is also carried by the platelets and released during the platelet release reaction. The role of 5-HT in nor - mal hemostasis is not known, but recent evidence has shown that a low platelet serotonin level is often associated with low 63
Transcript of Laboratory Tests of Platelet Function · Laboratory Tests of Platelet Function H. JAMES DAY, M.D....

A n n a l s o f C l i n i c a l L a b o r a t o r y S c i e n c e , V o l . 2, N o . 1C o p y r i g h t © 1972, I n s t i t u t e f o r C l i n i c a l S c i e n c e
Laboratory Tests o f Platelet Function
H. JAMES DAY, M .D. and HOLM H O LM SEN , Ph .D .
Hematology Laboratories, Temple University School of MedicinePhiladelphia, PA 19140
IntroductionThere has been growing interest in the
role of platelets in the hemostatic process. Following injury to the blood vessel wall, the platelets are exposed to some substance in the basement membrane, which may or may not be collagen, which leads to the rapid formation of a platelet plug. The steps involved here are those of adhesion to the site of injury and exposed basement membrane, then aggregation of the platelets during which time the platelets undergo a release reaction. Formation of a permeable platelet plug then occurs and finally, the subsequent development into a hemostatic plug with the incorporation of fibrin strands. It is important to note that the time needed for the formation of a platelet plug correlates well with the bleeding time measured from the beginning of the infliction of the wound to the time the bleeding ceases, i.e., approximately 6 minutes. Thus, in performing a bleeding time, the steps are measured which are necessary for platelet plug formation. In vitro the function of platelets is tested by measuring platelet adhesion to glass, aggregation with various agents, the release reaction, clot retraction, platelet-phagocytosis and platelet uptake of numerous substances.
Platelets contain large amounts of adenine nucleotides which are released during the platelet release reaction, an important step in hemostasis. Possibly the most im
portant adenine nucleotide released is ADP, a powerful platelet aggregating substance. Platelets also contribute a major source of phospholipids required for platelet coagulation and this has been identified as platelet factor 3 or platelet thromboplastic factor. This phospholipid is not normally available on the platelet surface and only becomes so when the platelets are altered or activated. Hardisty and Hutton 1 have shown that Kaolin makes this thromboplastic activity available and Spaet and Cintron24 have shown that connective tissue suspensions are equally active. Platelets are also required for clot retraction, the energy for which is derived from the breakdown of platelet ATP to ADP. During this time, fibrin strands form which tend to radiate between the clumps of platelets which act as the nidus of clot retraction. To date, clot retraction has only been shown to be abnormal in those patients who have a defect known as thrombasthenia and in those who lack a normal number of platelets, i.e., thrombocytopenia. It is uncertain which role clot retraction plays in the maintenance of normal hemostasis.
5-Hydroxytryptamine (5-HT), a powerful vasoconstrictor, is also carried by the platelets and released during the platelet release reaction. The role of 5-HT in normal hemostasis is not known, but recent evidence has shown that a low platelet serotonin level is often associated with low
63

64 DAY AND HOLMSEN
releasable nucleotide levels. Thus, platelets are unable to release aggregating materials and hemorrhagic manifestations result. Such a defective release reaction is typical of thrombopathy or thrombocytopathy, a clinical condition characterized by hemorrhagic manifestations.
By definition, patients having defects in platelet function ( also called qualitative platelet disorders) are those who have a normal platelet count, but a prolonged bleeding time owing to abnormal functioning platelets. It is generally accepted that bleeding phenomena do not occur unless the platelet count is below 2 0 ,0 0 0 per mm3. However, some patients, specifically those with thrombopathy, may have platelet counts that are in the range of 75 to 150,000 per mm3 and have bleeding phenomena even with this relatively minor thrombocytopenia. Under these circumstances, the platelets can often be shown to have a functional defect.
The major diseases of platelet function that have been identified to date are classified in the following manner:
1. Thrombasthenia — a disease which seems to be characterized by a defective platelet membrane resulting in a failure of platelet aggregation.
2. Thrombopathy — in which there is a failure of the release mechanism in platelets and a failure to make platelet factor 3 (PF3) available.
3. Von Willebrands disease or pseudohemophilia—which is characterized by a prolonged bleeding time and a low factor VIII. Strictly, this is not a platelet functional abnormality in as much as the platelets function perfectly well, but is included mainly because of a prolonged bleeding time. These patients lack a plasma factor called von Willebrand’s factor.
Many platelet functional abnormalities are seen as secondary to other disease states. These include renal diseases, para- proteinemias, thrombocythemia, iatrogenic
disease, etc. It is not in the scope of this paper to discuss these in detail. More detailed general review papers on this subject should be consulted.12- ls- 16- 20
Methods
This paper will describe those tests of platelet function which are simple to perform and yield the desired information. All are now available for use in clinical laboratories.
Collection of Blood Sample
It is important to collect a sample of blood from a normal subject at the same time as that of the patient if detailed tests of platelet function are to be performed. The volume of blood to be drawn for study of platelet function may vary anywhere from 9 to 38 ml. As performed in our laboratory, 18 or 38 ml of blood are drawn by gravity into plastic conical tubes by free flow into 2 ml or 4 ml of 0.11 M sodium citrate (31.3 g per 1 trisodium citrate 'H^O) with a teflon coated needle attached to a plastic tubing. The tube is then capped with parafilm and inverted several times for adequate mixing. Two blood smears are also made at this time for staining with Wright’s stain and examined with particular reference to platelet number, platelet morphology and the presence or absence of platelet aggregates. A sample of the whole blood is then submitted for platelet counting by standard electronic counting techniques. Plastic equipment or siliconized glassware is used for all platelet transfers.
Preparation of Platelet-Rich and Platelet-Poor Plasma
Citrated whole blood is centrifuged for ten minutes at 2 0 0 x g at room temperature. It is important that the platelets not be subjected to extreme cold. The platelet-rich plasma (PRP) is then transferred to a second plastic tube, care being taken to avoid transferring any red cells. A platelet count

LABORATORY TESTS OF PLATELET FUNCTION 65
is performed on this PRP which is kept at room temperature until tested. Approximately 5 ml of PRP is re-centrifuged at 4°C for 30 minutes at 2,000 xg to remove platelets and obtain platelet poor plasma (PPP), which is collected and kept at 22 to 25 °C until tested.
Capillary Resistance
Principle
The test for capillary resistance, called the tourniquet test, is performed every time a venous blood specimen is obtained with venostasis. It is best quantitated by putting a blood pressure cuff on the arm and inflating it to a point mid-way between systole and diastole (about 100 mm Hg). The cuff is left in place for 3 to 4 minutes with an area approximately the size of a half- dollar, circumscribed on the volar aspect of the forearm. The number of petechiae in this area are then counted following deflation of the cuff. Some petechiae also occur on the dorsum of the hand, this area should be observed closely. At the same time petechiae may develop in the area to which the cuff is applied.
Discussion
The test is not very useful in assessing platelet function because the results may be abnormal in many disease states, only some of which are related to abnormal hemostatic processes . It is generally abnormal in thrombasthenia and von Wille- brand’s disease, but more commonly it is pathological in patients with severe thrombocytopenia or increased vascular fragility. Patients who develop petechiae under the cuff or on the dorsum of the hand usually have increased vascular fragility.
Normal Values
Less than 5 petechiae on the area under observation on the forearm is within the normal range.
Bleeding Time
Introduction
The bleeding time is perhaps the best screening test for defects of platelet function. As mentioned previously it measures the entire sequence of events in the formation of the hemostatic platelet plug. When the bleeding time is abnormal, other tests of platelet function are performed which yield specific information as to the specific type of hemostatic defect.
Principle
A standard incision is made through the skin and the time necessary for stopping of bleeding is carefully measured. As useful as is this test, it must be rigidly controlled. The method of Ivy et al. 13 is preferred in as much as it is better controlled than any others. Recent modifications1 ’ 4- 17 have introduced even further methods for quantitating the bleeding time. Strict attention must be paid to detail and each laboratory must establish its normal range.
Procedure1, 4
A sphygnomanometer is placed around the patient’s arm and inflated to 40 mm of mercury. Following adequate cleansing of the volar surface of the forearm, three parallel cuts are made on the forearm with a #11 Bard-Parker blade. These cuts should be 5 to 6 mm long, 1 mm deep and 1.5 cm apart. Blood is carefully absorbed with the edge of a filter paper every 30 s until bleeding ceases, the wound itself not being touched. Wounds which bleed profusely from the start probably represent perforated veins. Those which do not bleed for at least 2 minutes are assumed to be incorrectly performed and therefore disregarded. Two separate end points may be considered: a) the longest time taken to stop bleeding and b ) the mean time for all three wounds. The former is to be preferred. The modification of Mielke et al. 17

66 DAY AND HOLMSEN
utilizes a template which controls the length and depth of the incisions made with the surgical blade. With this method, bleeding time is longer than might normally be seen using a puncture method.
Discussion
The bleeding time is the premier test for determining whether or not a patient with a normal platelet count has a platelet function defect. All diseases of platelet function have abnormal bleeding times at some period in their disease. If the clinical circumstances suggest a defect in platelet function, several bleeding times may have to be done if the original one is normal. This is particularly true for von Willebrand’s disease where daily variations in the bleeding time have been recorded. Thrombas- thenias and thrombocytopathias, unless of an extremely mild nature, always have prolonged bleeding times.
Sources of Error
In addition to those mentioned previously, the status of the patient’s subcutaneous tissues must be considered. Patients receiving intravenous fluids, patients with generalized edema, etc. may have bleeding times which are not truly reflective of the hemostatic status. Non-steroidal, anti-in- flammatory drugs, such as acetylsalicylic acid have been shown to prolong bleeding times by as much as 2 to 3 minutes. Patients must be carefully questioned as to the recent ingestion of these drugs. It has been demonstrated that the effect of aspirin will last for as long as 7 to 10 days.
Normal Values
As performed in these laboratories, the longest time recorded in all three wounds is 5.5* 2 minutes and the mean of all three wounds is 4.8* 2 minutes. As the single reading is usually the longest, this seems to be the optimal value for assessing the patient’s bleeding time. An arbitrary upper
limit of 8 minutes might be set for normal values.
Clot-retractionIntroduction
Probably one of the oldest tests of platetet function, clot retraction, has been surpassed by more specific and more useful tests. Several methods for clot-retraction are employed using whole blood, plasma clot, dilute clot, etc. The test is affected by red cell volume and plasma fibrinogen concentration. Therefore, it is not solely a test of platelet function. Generally, the more simple the test, the easer it is to interpret. The method listed is a modification of the original method of McFarlane14 as proposed by Hardisty et al.4- 12
MethodExactly 2 ml of whole blood is allowed
to flow into each of two plastic conical tubes which are then placed in a water bath at 37°. Blood may be allowed to flow directly from the needle-plastic tube combination suggested in the general procedure section. In another method, 5 ml may be drawn into a plastic syringe, 1 ml discarded and exactly 2 ml added to two plastic or siliconized tubes. A stainless steel metal wire (made from a paper clip) is immediately placed in each tube. Exactly 60 minutes after the blood has clotted, the clot is removed with the wire spiral and is allowed to drain for 15 seconds without pressing it against the side of the tube. The volume of expressed serum is measured with a graduated pipet and recorded as a percentage of the original 2.0 ml. The test is always performed in duplicate.
DiscussionClot retraction is a function of the retrac
tile protein, thrombosthenin, in blood platelets. Clot retraction is generally abnormal in states where the platelet count is decreased. The only specific disorder of platelet function in which clot retraction is abnormal is thrombasthenia. It is gen-

LABORATORY TESTS OF PLATELET FUNCTION 67
erally not held to be useful in assessing platelet function defects, either primary or secondary, and has been replaced by many more specific tests.
Sources of Error
If the equipment used is not clean, the clot will adhere to the sides of the tube and not retract. It is probably best to rim the clot in the tube after clotting has occurred to allow for maximum retraction.
Normal Ranges
After 60 minutes the clot should have retracted 48 to 64 percent of its original volume.
Platelet Aggregation
Introduction
The development of aggregates upon exposure to various agents is considered to be one of the major functions of platelets and of cardinal importance in hemostasis. In vivo, the source of aggregating agents are probably collagen from the vessel wall and adenosine diphosphate (ADP) from other platelets. The platelet’s ability to respond to various aggregating agents may be measured in vitro with specialized instrumentation as originally described. 2
Principle
Platelet rich plasma (PRP) is slightly turbid due to the presence of platelets in suspension. When the platelets aggregate, the turbidity decreases. A light beam is directed through PRP in a cuvette and the percent transmission or optical density recorded on a linear recorder. The contents of the cuvette have to be stirred constantly and kept at 37°. When ADP, epinephrine or collagen is added to PRP, the formation of platelet clumps produces an increase in percentage transmission or a decrease in optical density which is then recorded. A photoelectric colorimeter, absorptimeter or
one of the commercially available aggregation meters may be utilized. Platelet aggregation is a function of the final concentration of the aggregating agent used. The method described is based on several methods.2' 19-21 •25
ReagentsPlatelet-rich and platelet-poor normal and
test plasma. Citrated platelet rich plasma is prepared as stated. The platelet count should be adjusted to a set number in the range of 150 to 300,000/mm3 by dilution of the plasma under test with the appropriate platelet poor plasma (PPP).
Adenosine phosphate (ADP) (Sigma Chemical Co., St. Louis, MO).
Stock solution: 400 ¡¿g per ml in saline. This is stored in 0.5 ml volumes at —20°C.
Working solution:a) 8 fjig per ml. The entire content of
one of the 0.5 ml tubes of the 400 ¡a,g per ml stock is now diluted to 25 ml total volume with saline,
b ) 4 ¡jig per ml. 10 ml of the 8 ¡¿g per ml working solution is diluted with an equal volume of saline.
Epinephrine. Epinephrine bi-tartrate, (Cal- biochem ).
Stock solution: 0.5 mg per ml of saline. This is stored in volume of 0.5 ml at —20°C.
Working solution: One tube of the stock solution is diluted to 50 ml total volume with saline. Final concentration: 5 fig per ml.
Collagen. Crude equine tendon extract (Sigma Chem. Corp., St. Louis, MO). May be prepared by any one of two methods.
Method (1)1SFour g of crude collagen (Sigma) is placed in 50 ml of 0.9 percent NaCl in a Waring blender at 0°C. The blender
68 DAY AND HOLMSEN
is run at top speed for 3 separate one minute periods making sure that not too much heat is generated. The mixture is well shaken for 5 minutes in the cold and then centrifuged at 1800 X g for 15 minutes at 5°C. The material is to be made up each day the test is to be run.
Method(2)16
This method avoids the necessity of having to make up new collagen each day. It employs a relatively stable collagen suspension prepared by solubilizing collagen in dilute acid. One gram of collagen (Sigma) is homogenized in a Waring blender with 100 ml of 8.35 mM acidic acid for 30 s at 20,000 revolutions per minute at 0°C. Following this, 100 ml of cold distilled water is added and the mixture rehomogenized for another 30 s followed by dilution with 4 volumes of 1.67 mM acidic acid. The resulting gel is stored at —20°C. Immediately before use, the collagen solution is thawed and rehomogenized with a teflon pestle-glass homogenizer for 5 to 10 s and diluted with 1 volume of 1.67 mM acidic acid. This mixture is referred to as soluble collagen and is kept at 4° (ice-bath) during experiments. Instantaneous transformation to insoluble collagen fibrils occurs upon addition of this material to saline or plasma.
Special Apparatus Aggregometer*Linear Response Recorderf
Procedure
Depending upon the aggregometer used, one volume (0.4 ml or 1 ml) of citrated platelet rich plasma is pipetted into the
* Platelet aggregometer, Chronolog Corporation or EEL platelet aggregometer.
f Bausch and Lomb, Vom-6 .
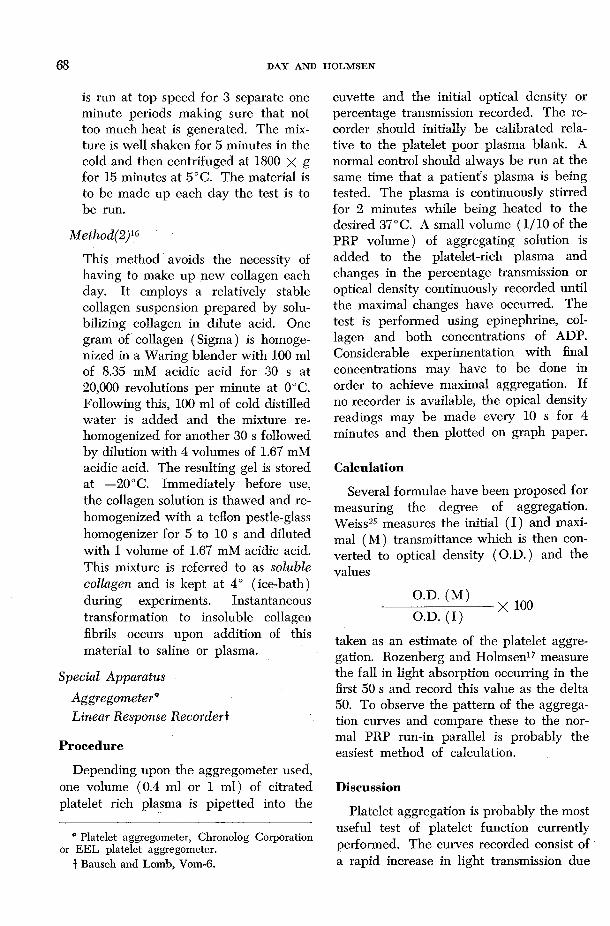
cuvette and the initial optical density or percentage transmission recorded. The recorder should initially be calibrated relative to the platelet poor plasma blank. A normal control should always be run at the same time that a patient’s plasma is being tested. The plasma is continuously stirred for 2 minutes while being heated to the desired 37 °C. A small volume (1/10 of the PRP volume) of aggregating solution is added to the platelet-rich plasma and changes in the percentage transmission or optical density continuously recorded until the maximal changes have occurred. The test is performed using epinephrine, collagen and both concentrations of ADP. Considerable experimentation with final concentrations may have to be done in order to achieve maximal aggregation. If no recorder is available, the opical density readings may be made every 10 s for 4 minutes and then plotted on graph paper.
Calculation
Several formulae have been proposed for measuring the degree of aggregation. Weiss25 measures the initial ( I) and maximal (M ) transmittance which is then converted to optical density (O.D.) and the values
taken as an estimate of the platelet aggregation. Rozenberg and Holmsen17 measure the fall in light absorption occurring in the first 50 s and record this value as the delta 50. To observe the pattern of the aggregation curves and compare these to the normal PRP run-in parallel is probably the easiest method of calculation.
Discussion
Platelet aggregation is probably the most useful test of platelet function currently performed. The curves recorded consist of a rapid increase in light transmission due

LABORATORY TESTS OF PLATELET FUNCTION 69
to initial aggregation which is a function of the platelets’ primary aggregating ability (figure 1). If the final concentration of aggregating agents is low, rapid disaggregation occurs (figure 1). This is referred to as a first phase of aggregation. Using ADP, the final concentration may be so adjusted that following first phase aggregation, a plateau and then a second phase of aggregation occurs. This second phase represents the release reaction of platelets where more ADP accumulates in the plasma as released from the platelets themselves. 18 Epinephrine similarly has a bi- phasic pattern but not as pronounced as that seen with ADP (figure 2). Epinephrine induced aggregation is sub-optimal in those conditions characterized by the release failures such as thrombopathia. Collagen-induced aggregation may be quantitated by varying the final concentration of collagen suspension. After a lag of a few seconds, aggregation occurs in only one phase and the aggregates do not dis-aggre- gate. Collagen induces aggregation by being phagocytosed by the platelet by which the cell releases ADP which is then primarily responsible for the aggregation. 10
Platelets from patients with thrombasthenia do not aggregate with any modality. In thrombopathia, characterized by failure of release process, a failure of second phase aggregation is seen. As may be seen in figure 1, first phase ADP-induced aggregation does occur with a patient with thrombopathia, but there is no evidence of second phase aggregation. Epinephrine and collagen induced aggregation are sub-optimal in this condition (figures 2 and 3). Patients who have been on non-steroidal anti-inflammatory drugs such as phenylbutazone or aspirin may have inadequate or sub-optimal aggregation with epinephrine and collagen, and lack of second phase ADP-induced aggregation. Conditions such as uremia, macroglobulinemia, thrombocytosis, and scurvy are also characterized by abnormal aggregation patterns.
AGGREGATION WITH ADP
F ig u r e 1. Platelet aggregation curves obtained from platelets of a normal control and a patient with thrombopathia. ADP induced aggregation. Final concentrations of ADP are given for each type of curve. Note that the greatest aggregation (expressed as highest percent transmission) is obtained with highest concentration. The normal control shows a first phase aggregation with 0.8 /¿M and 1.2 /iM ADP (final concentration) but a second phase with 1.6 /¿M. The thrombocytopathic platelets fail to show a second phase aggregation even with 3.2 /iM ADP.
Sources of Error
Aggregation tests are best performed in the time period of 30 to 180 minutes after drawing the blood and preparation of platelet rich plasma. All patients must be questioned about the recent ingestion of nonsteroidal anti-inflammatory agents since these will block release and interfere with the aggregation patterns. Thrombocytopenia will also yield poor aggregation since the test is dependent on the platelet concentration in the PRP.
Normal Ranges
The type of changes in aggregation are best illustrated in the changes in aggregation patterns. Each laboratory must establish its own normal patterns with each aggregating agent used.

70 DAY AND HOLMSEN
AGGREGATION WITH EPINEPHRINE
F ig u r e 2 . Epinephrine induced aggregation of platelets from a normal control and a patient with thrombopathia. The control platelets show a typical two-phase aggregation curve while the patient’s platelets yield only a first phase.
Platelet Factor 3 (PFS) Availability Introduction
Platelets function in the coagulation sequence by supplying phospholipid necessary for the generation of thrombin. This lipid material is called platelet factor 3 (PF3). The platelets make the PF3 available for the coagulation process by the same release mechanism that yields ADP. Therefore, the measurement of PF3 availability from the platelets is a measure of the platelet release reaction. 5
Principle
The re-calcification time of platelet rich plasma is considerably shortened since the plasma is incubated with kaolin prior to
the addition of calcium. During the incubation with kaolin, PF3 is released from the platelets and the plasma contact factors are activated. At a specific time period, calcium is added to the mixture of platelet rich and platelet poor plasma and a recalcification time done immediately.
Reagents
Platelet rich normal and test plasma. Prepared as described previously. Platelet count is performed on this plasma and should be in the range of 150,000 to 400,000.
Platelet poor and test plasma. Prepared as described previously.
Kaolin. (Fischer Scientific Co.) 5 percent (w /v weight/volume) 5 mg per ml made up in 0.05 M imidazol buffered normal saline, pH 7.3.
Calcium chloride. 0.025 M.
Procedure6, 12, 25
Two separate 75 X 12 mm glass test tubes are set up in a water bath at 37°. Tube #1 contains 0.1 ml of test platelet rich plasma and 0 . 1 ml of normal platelet poor plasma. Tube #2 contains 0.1 ml of test platelet poor plasma and 0 . 1 ml of normal platelet rich plasma. These tubes differ only in the source of the platelets. Precisely 0.2 ml of the 5 percent kaolin suspension is added to each tube and the incubation carried out for 2 0 minute periods of time with occasional shaking. At the end of this incubation period, 0 . 2 ml of the calcium chloride solution is added to each tube and the clotting times of the recalcified plasma recorded with a second stop watch.
Discussion
As the plasma factors are maximally activated, the recalcification time performed in these tests reflects the amount of PF3
released from the platelets. Conditions in which the platelets are unable to release

LABORATORY TESTS OF PLATELET FUNCTION 71
their phospholipid are thrombocytopathy, thrombasthenia and various clinical conditions, such as uremia, protein abnormalities, scurvy, etc. Blockers of the release reaction, such as aspirin or phenylbutazone, may inhibit the platelet factor 3 availability. An absolute deficiency of platelet factor 3 probably does not occur.
Sources of Error
As with all tests of platelet function, prior ingestion of drugs can markedly affect any laboratory result. Since this test indirectly measures the same platelet function (the release reaction) as a second phase of aggregation, the sources of error in platelet aggregation also apply. It is important to note that thrombocytopenia will cause an abnormality of the recalcification time which would be recorded as a failure of platelet factor 3 release.
Normal Ranges
The recalcification time after 20 minutes of incubation should be between 45 and 50 s. A failure of platelet factor 3 release is characterized by prolonged recalcification times of 80 to 100 s.
Platelet Glass Retention(Platelet Adhesiveness)
Introduction
The initial step in hemostasis involves platelets adhering to the site of a damaged vessel. Platelets have the function of adhering to many seemingly diverse substances such as glass, collagen, latex particles, glass wool fibers, etc. Wright26 was the first to quantitate the platelet glass adhesion by rotating heparinized whole blood in a glass bulb and observing a decrease in the platelet count. Recent modifications have allowed the passage of native whole blood, anti-coagulated whole blood or anti-coagulated PRP through columns containing small glass beads. In this process, the platelets are retained on or trapped
COLLAGEN INDUCED AGGREGATIO N
F ig u r e 3. Collagen induced aggregation of platelets from a normal control and a patient with thrombopathia. Note the suboptimal aggregation response to soluble collagen manifested by this patient.
between the glass beads and the number retained is a measure of the platelet adhesiveness. The procedure is better called the platelet glass retention test.
Principle21' 22With the method of Hellem,7' 8 citrated
whole blood is passed at a constant speed through a glass bead column. The percentage of platelets retained in this column is estimated from the differences between platelet counts carried out before and after the passage of blood through the column.
ProcedureThe procedure used is a modification of
the method of Hellem.7’8 A motor driven device is used such as a Harvard Constant

n DAY AND HOLMSEN
Infusion Pump* which delivers 1 ml of blood in 23.5 s from a 5 ml syringe. This pumps the blood through a glass bead column containing 5 g of beadsf with a diameter of 0.5 ml, in a plastic tubing with an internal diameter of 5 mm. Both ends of the column are provided with filters of nylon cloth to prevent loss of beads from the column. The number of beads in the column is about 15,000 with a total glass surface area of 12,000/mm2. It is important that the columns be well packed with a good fit; there should be no more than 1.2 ml of free space available. The time required for a platelet to pass through this column is about 30 s and this contact time must be strictly controlled. The rate of blood flow through the column is 28 cm per minute and is constant regardless of blood viscosity. For whole blood estimations, the blood is collected into plastic or siliconized glass tubes with a 10 ml mark. Platelet counting is done as described previously. The hematocrit of the patient is very important and must be estimated by a micro method before blood collection. At a normal hematocrit (45 percent), 1 ml of 0.11 M sodium citrate solution is pipetted into the collecting tube with a mark at 10 ml. A venipuncture is performed. After the first 2 to 3 ml of blood has been discarded, the tube is filled to the 10 ml mark directly from the end of the plastic tubing attached to the needle. The tube is then covered with parafilm and inverted 10 times to mix the contents. The ratio of citrate solution to plasma in the blood sample is now 1 to 4.95 and must be constant. In patients with an abnormal hematocrit, the amount of citrate which is pipetted into the collecting tube is adjusted according to the formula
* Model 975, Harvard Apparatus Company, Dover, MA.
I Type 070, Superbrite, Beads, Minnesota Mining and Manufacturing Corporation, St. Paul, MN.
(X = ml of citrate solution — H = hematocrit). This formula is expressed in such a way that the amount of citrate concentration in the plasma fraction of the blood is always constant since the results are dependent upon the amount of ionized calcium. Exactly 12 minutes after the withdrawal of blood, citrated blood is transferred to a 5 ml plastic syringe to which a short plastic tubing is attached. The syringe is then placed in a machine; the motor is started and for 23.5 s the blood is drained directly into a glass tube containing 19 ml of isotonic citrate solution. The tube is covered with parafilm and inverted 10 times before it is placed on the bench for sedimentation of the red cells. The syringe is now connected to the glass bead column and 1 ml of blood is collected after its passage through the column in another glass tube containing 19 ml of isotonic citrate. After 2 to 3 hours, the platelet count is performed on the supernatant plasma. Duplicate tests are always performed, the results being rejected if they differ more than 10 percent. The difference of the mean value of the platelet counts before and after passage through the column gives the number of adhesive platelets. This is usually expressed as percentage of the initial count.
Other Methods
Several methods are presently available for estimating platelet glass retention. The method of Salzman23 is most commonly used in this country, but in our laboratory it has been the most difficult to quantitate. This method, using a vacuum tube system, draws the blood directly from a vein through a pre-packed glass bead column. The method of Bowie3 et al. combines the infusion pump principle and heparinized whole blood and seems to be reliable. The type of anti-coagulants used, flow rate of the blood through the glass bead column, size of the glass beads, etc. have been shown to influence results obtained.
LABORATORY, TESTS OF PLATELET FUNCTION 73
Discussion
Platelet adhesiveness is abnormal in all disorders of platelet function. This test has a diagnostic spectrum as broad as the bleeding time. It serves best as a screening test for detection of platelet function abnormalities. It, combined with the bleeding time, probably serves as the best tool to substantiate a diagnosis of von Willebrand’s disease, a condition characterized by prolonged bleeding time, low factor VIII levels and a decreased platelet glass bead retention.
Sources of ErrorThe test is difficult to standardize. Any
one attempting to perform this procedure should consult detailed descriptions of methodology.24
Normal RangeRetention of platelets by the column
is 25 to 40 percent.
Summary of Laboratory Tests of Platelet Function
A summary of the laboratory abnormalities found in the disorders of platelet func
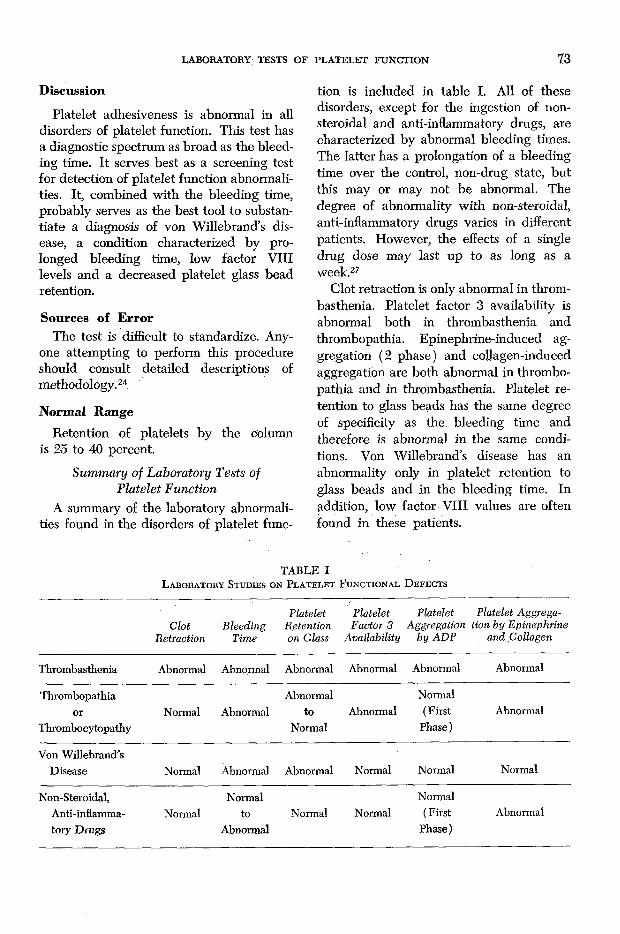
tion is included in table I. All of these disorders, except for the ingestion of nonsteroidal and anti-inflammatory drugs, are characterized by abnormal bleeding times. The latter has a prolongation of a bleeding time over the control, non-drug state, but this may or may not be abnormal. The degree of abnormality with non-steroidal, anti-inflammatory drugs varies in different patients. However, the effects of a single drug dose may last up to as long as a week.27
Clot retraction is only abnormal in thrombasthenia. Platelet factor 3 availability is abnormal both in thrombasthenia and thrombopathia. Epinephrine-induced aggregation (2 phase) and collagen-induced aggregation are both abnormal in thrombopathia and in thrombasthenia. Platelet retention to glass beads has the same degree of specificity as the bleeding time and therefore is abnormal in the same conditions. Von Willebrand’s disease has an abnormality only in platelet retention to glass beads and in the bleeding time. In addition, low factor VIII values are often found in these patients.
TABLE IL a b o r a t o r y S t u d ie s o n P l a t e l e t F u n c t io n a l D e f e c t s
ClotRetraction
BleedingTime
Platelet Retention on Glass
Platelet Factor 3
Availability
Platelet Platelet Aggrega- Aggregation tion by Epinephrine
by ADP and.Collagen
Thrombasthenia Abnormal Abnormal Abnormal Abnormal Abnormal Abnormal
Thrombopathiaor
ThrombocytopathyNormal Abnormal
Abnormalto
NormalAbnormal
Normal (First
Phase )Abnormal
Von Willebrand’s Disease Normal Abnormal Abnormal Normal Normal Normal
Non-Steroidal, Anti-inflammatory Drugs
NormalNormal
toAbnormal
Normal NormalNormal
( First Phase)
Abnormal

74 DAY AND HOLMSEN
References1. B o r c h g r e v in k , C., E g e b e r g , O., G o d a l , H.
C., a n d H jo r t , P. F.: The effect of plasma and Cohn’s fraction I on the Duke and Ivy bleeding times in von Willebrand’s disease. Acta Med. Scand. 173: 235-242, 1963.
2. B o r n , G. V. R.: Aggregation of blood platelets by adenosine diphosphate and its reversal. Nature 194: 927-929, 1962.
3. B o w ie , E. J. W., O w e n , C. A., T h o m p s o n , J.H., a n d D i d is h e im , P.: Platelet adhesiveness in von Willebrand’s disease. Amer. J. Clin. Path. 52: 69-77, 1969.
4. H a r d is t y , R. M., D o r m a n d y , K., a n d H u t t o n , R. A.: Thrombasthenia. Brit. J. Haemat. 10: 371-387, 1964.
5. H a r d is t y , R. M. a n d H u t t o n , R. A.: Platelet aggregation and the availability of platelet factor 3. Brit. J. Haemat. 12: 764-776, 1966.
6 . H a r d is t y , R. M. a n d H u t t o n , R. A.: The kaolin clotting time of platelet-rich plasma. A test of platelet factor 3 availability. Brit. J. Haemat. 11: 258-269, 1965.
7. H e l l e m , A. J.: Platelet adhesiveness. Ser.Haemat. 1: 99-145, 1968.
8 . H e l l e m , A. J.: The adhesiveness of human blood platelets in vitro. Scand. J. Clin. Lab. Invest. 12(Suppl. 51): 1-117, 1960.
9. H o l m s e n , H., D a y , H. J., a n d St o r m , E.: Adenine nucleotide metabolism of blood platelets. VI. Subcellular localization of nucleotide pools with different functions in the platelet release reaction. Biochim. Biophys. Acta 186: 254-266, 1969.
10. H o l m s e n , H ., D a y , H . J., a n d S t o r m o r k e n ,H .: The blood platelet release reaction. Scand. J. Haemat. (Suppl. # 8 ), 3-26, 1969.
11. H o v ig , T.: Aggregation of rabbit blood platelets produced in vitro by saline “extract” of tendons. Thromb. Diath. Haemorrh. 9: 248- 263, 1963.
12. H u t t o n , R. A.: Tests of platelet function and their use in the investigation of bleeding disorders. J. Med. Lab. Tech. 23: 161-185,1966.
13. I v y , A. C., N e l s o n , D., a n d B u c h e r , G.: Their standardization of certain factors in the cutaneous “venostasis” bleeding time technique. J. Lab. Clin. Med. 26: 1812-1816, 1940.
14. M a c F a r l a n e , R. G.: A simple method of measuring clot retraction. Lancet i: 1199- 1202, 1939.
15. M a r c u s , A. J.: Platelet function. New Eng. J. M e d . 280: 1213-1220, 1278-1284, 1330-1335,1969.
16. M ic h a l , F . a n d F i r k i n , B. G.: Physiological and pharmacological aspects of the platelet. Ann. Rev. Pharm. 95: 118, 1969.
17. M i e l k e , C. H ., K a n e s h ir o , M . M ., M a h e r ,I. A., W e i n e r , J. M ., a n d R a p a p o r t , S. I.: The standardized normal Ivy bleeding time and its prolongation by aspirin. Blood 34: 204-215, 1969.
18. M i l l s , D. C. B., R o b b , C. A., a n d R o b e r t s ,G. C. K.: The release of nucleotides, 5-hy- droxytryptamine and enzymes from human blood platelets during aggregation. J. Physiol. (London) 195:715-729, 1968.
19. M u s t a r d , J. F., N e g a r d t , B., R o s w e l l , H .C., a n d M a c M i l l a n , R . K.: Effect of adenosine nucleotides on platelet aggregation and clotting time. J. Lab. Clin. Med. 64: 548-555, 1964.
20. M u s t a r d , J. F. a n d P a c k h a m , M . A.: Factors influencing platelet function: Adhesion, release and aggregation. Pharmacology Rev. 22: 97-187, 1970.
21. O ’B r i e n , J. R.: Platelet aggregation. II. Some results from a new method of study. J. Clin. Path. 15: 452-455, 1962.
22. R o z e n b e r g , M. a n d H o l m s e n , H .: Adenine nucleotide metabolism of blood platelets. II. Uptake of adenosine and inhibition of ADP- induced platelet aggregation. Biochim. Biophys. Acta 155: 342-352, 1968.
23. S a l z m a n , E. W.: Measurement of plateletadhesiveness. A simple in-vitro technique demonstrating an abnormality in von Willebrand’s disease. J. Lab. Clin. Med. 62: 724- 735, 1963.
24. S p a e t , T. H. a n d C in t r o n , J.: Studies on platelet factor 3 availability. Brit. J. Haemat. 11: 269-275, 1965.
25. W e is s , H . J.: Platelet aggregation, adhesion and adenosine diphosphate release in throm- bopathia (Platelet factor 3 deficiency). Amer. J. Med. 43: 570-578, 1967.
26. W r ig h t , H. P.: The adhesiveness of blood platelets in normal subjects with varying concentrations of anti-coagulants. J. Path. Bact. 53: 255-259, 1941.
27. Z u c k e r , M. B.: Tests of platelet adhesion, aggregation and release. Thromb. Diath. Haemorrh. In press.