
LABORATOIRE OCEANOGRAPHIQUE DE L1ATLANTIQUE …
177
DFO - Lib/ I Mii- Ebb otheque 111 10028231 DEPARTMENT OF ENERGV,MINES AND RESOURCES MARINE SCIENCES BRANCH MINISTERE DE L'ENERGIE DE MINES ET DES RESSOURCES DIRECTION DES SCIENCES DE LA MER ATLANTIC OCEANOGRAPHIC LABORATORY BEDFORD INSTITUTE LABORATOIRE OCEANOGRAPHIQUE DE L 1 ATLANTIQUE INSTITUT de BEDFORD Dartmouth, Nova Scotia Canada WAVE CLIMATE OF THE CANADIAN ATLANTIC COAST and CONTINENTAL SHELF — 1970 by H. A. NEU AOL REPORT 1971-10 DECEMBER 1971 PROGRAMMED BY THE CANADIAN COMMITTEE OF OCEANOGRAPHY
Transcript of LABORATOIRE OCEANOGRAPHIQUE DE L1ATLANTIQUE …
DFO - Lib/ I Mii- Ebb otheque
111 10028231
DEPARTMENT OF ENERGV,MINES AND RESOURCES MARINE SCIENCES BRANCH
MINISTERE DE L'ENERGIE DE MINES ET DES RESSOURCES DIRECTION DES SCIENCES DE LA MER
ATLANTIC OCEANOGRAPHIC LABORATORY BEDFORD INSTITUTE
LABORATOIRE OCEANOGRAPHIQUE DE L1ATLANTIQUE INSTITUT de BEDFORD
Dartmouth, Nova Scotia
Canada
WAVE CLIMATE OF THE CANADIAN ATLANTIC COAST
and
CONTINENTAL SHELF — 1970
by
H. A. NEU
AOL REPORT 1971-10
DECEMBER 1971
PROGRAMMED BY
THE CANADIAN COMMITTEE OF OCEANOGRAPHY
ATLANTIC OCEANOGRAPHIC LABORATORY
BEDFORD INSTITUTE
DARTMOUTH, NOVA SCOTIA
WAVE CLIMATE OF THE CANADIAN ATLANTIC COAST
AND CONTINENTAL SHELF - 1970
by
H.A. NEU
AOL REPORT 1971-10
DECEMBER 1971
(1)
ABSTRACT
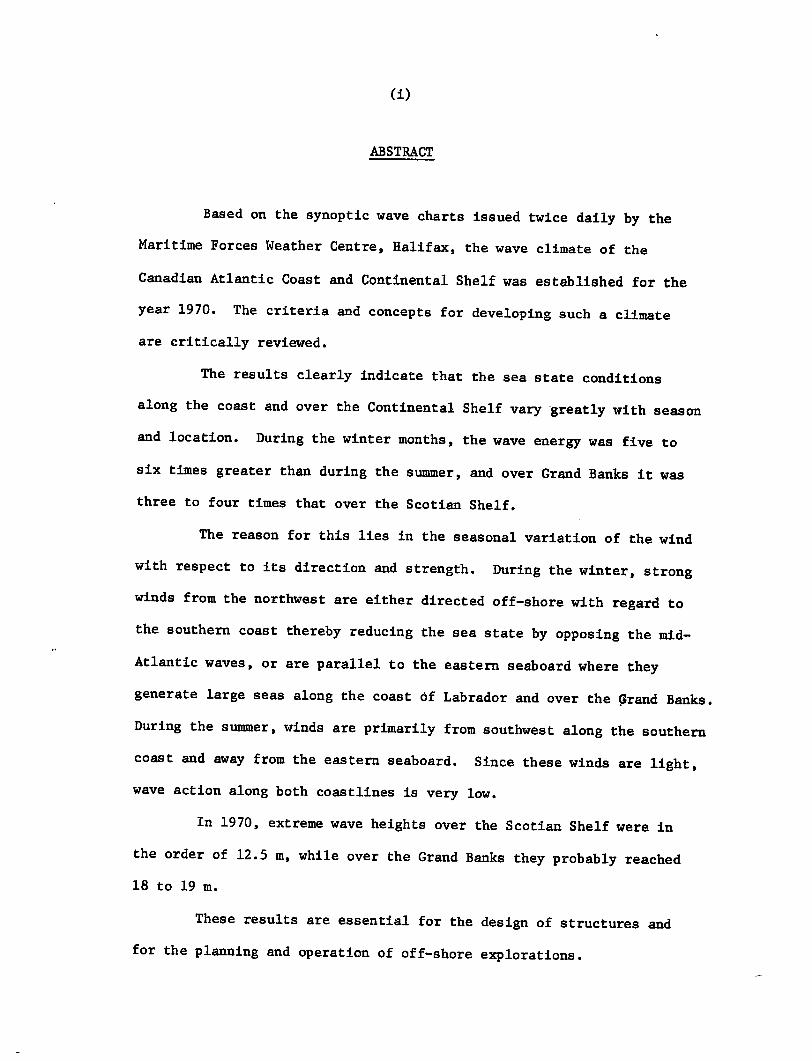
Based on the synoptic wave charts issued twice daily by the
Maritime Forces Weather Centre, Halifax, the wave climate of the
Canadian Atlantic Coast and Continental Shelf was established for the
year 1970. The criteria and concepts for developing such a climate
are critically reviewed.
The results clearly indicate that the sea state conditions
along the coast and over the Continental Shelf vary greatly with season
and location. During the winter months, the wave energy was five to
six times greater than during the summer, and over Grand Banks it was
three to four times that over the Scotian Shelf.
The reason for this lies in the seasonal variation of the wind
with respect to its direction and strength. During the winter, strong
winds from the northwest are either directed off-shore with regard to
the southern coast thereby reducing the sea state by opposing the mid-
Atlantic waves, or are parallel to the eastern seaboard where they
generate large seas along the coast Of Labrador and over the grand Banks.
During the summer, winds are primarily from southwest along the southern
coast and away from the eastern seaboard. Since these winds are light,
wave action along both coastlines is very low.
In 1970, extreme wave heights over the Scotian Shelf were in
the order of 12.5 m, while over the Grand Banks they probably reached
18 to 19 m.
These results are essential for the design of structures and
for the planning and operation of off-shore explorations.
TABLE OF CONTENTS
Page
Abstract (i)
List of Figures (iii)
1. Introduction 1
2. The Atlantic Coast and Continental Shelf 2
3. Weather and Wind 4
4. Waves 6
4.1 Shoaling of Waves 6
4.2 Wave Observation Methods 8
4.3 Wave Data 10
4.4 Significant Wave 15
4.5 Extreme Wave 15
4.6 Wave Energy 16
4.7 Grid System 18
5. Results 19
5.1 Monthly Non-Directional Energy Distribution .. 19
5.2 Monthly Directional Energy Spectra 23
5.3 Monthly Directional Wave Statistics 24
5.4 Extreme Wave Heights 25
6. Conclusions 26
7. Acknowledgement 27
8. Appendix 28
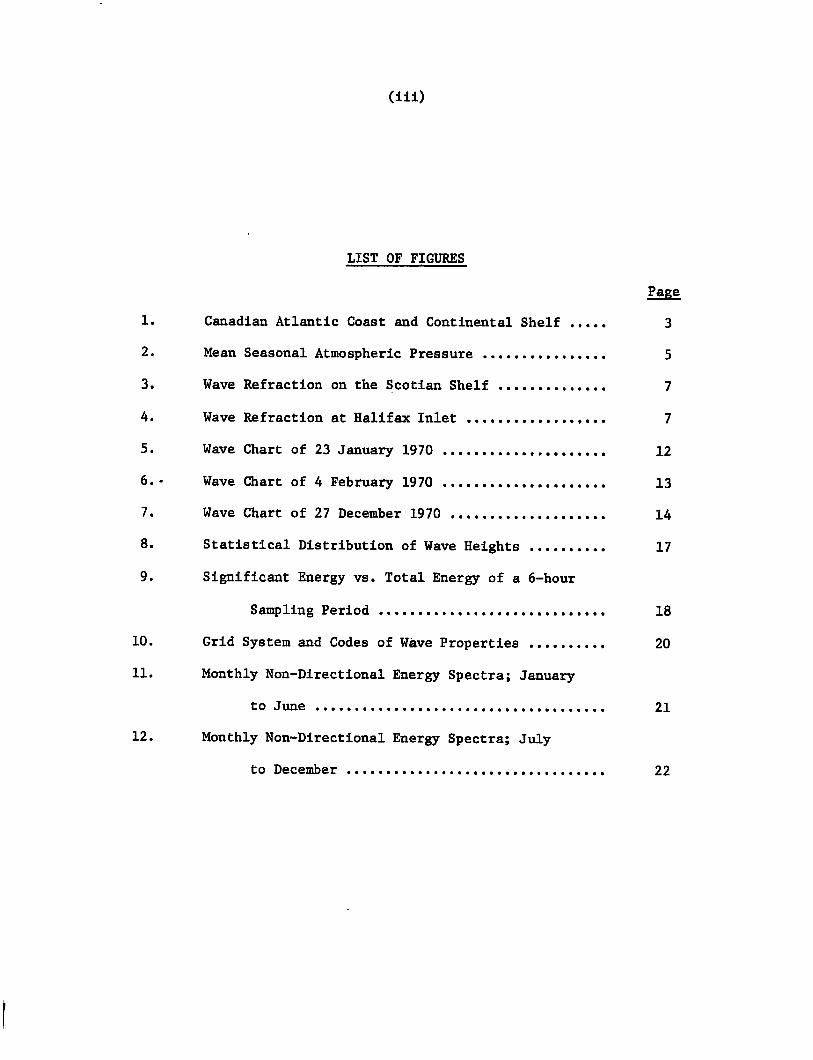
LIST OF FIGURES
Page
1. Canadian Atlantic Coast and Continental Shelf 3
2. Mean Seasonal Atmospheric Pressure 5
3. Wave Refraction on the Scotian Shelf 7
4. Wave Refraction at Halifax Inlet 7
5. Wave Chart of 23 January 1970 12
6.• Wave Chart of 4 February 1970 13
7. Wave Chart of 27 December 1970 14
8. Statistical Distribution of Wave Heights 17
9. Significant Energy vs. Total Energy of a 6-hour
Sampling Period 18
10. Grid System and Codes of Wave Properties 20
11. Monthly Non-Directional Energy Spectra; January
to June 21
12. Monthly Non-Directional Energy Spectra; July
to December 22
I. INTRODUCTION
Canada has the longest coastline in the world, with a total
length of about 50,000 km. A large portion of it is along the Atlantic
seaboard, extending from the Gulf of Maine, at the Canada-U.S. border,
to the Arctic. Along this coastline stretches the Continental Shelf,
which is about 200 km wide off Nova Scotia, reaches out 500 km on the
Grand Banks south-east of Newfoundland, and then narrows to less than
100 km along the coast of Labrador. In general, the depths are less than
200 m, with the exception of the Laurentian Channel, which connects with
the Gulf of St. Lawrence,and Hudson Strait.
In recent years mineral exploration has increased in this area
particularly with respect to oil. Nearly all the available concession
rights have been acquired by oil firms, and several oil rigs are drilling
in the general vicinity of Sable Island and on the Grand Banks.
This exploration is faced with exceptional technological problems
with regard to the aquatic environment, especially the sea state. The
planning of the operation, the choice and design of drilling rigs which
can survive extreme storms and the knowledge of the occurrence of wave
heights which would limit drilling operations or threaten the platform,
all require reliable wave information.
It is well known that this type of information is scarce and
frequently non-existent. An investigation into the wave climate of the
Canadian Atlantic Coast and Continental Shelf thus became imperative to
provide systematic sea state information.
-2-
2. THE ATLANTIC COAST AND CONTINENTAL SHELF
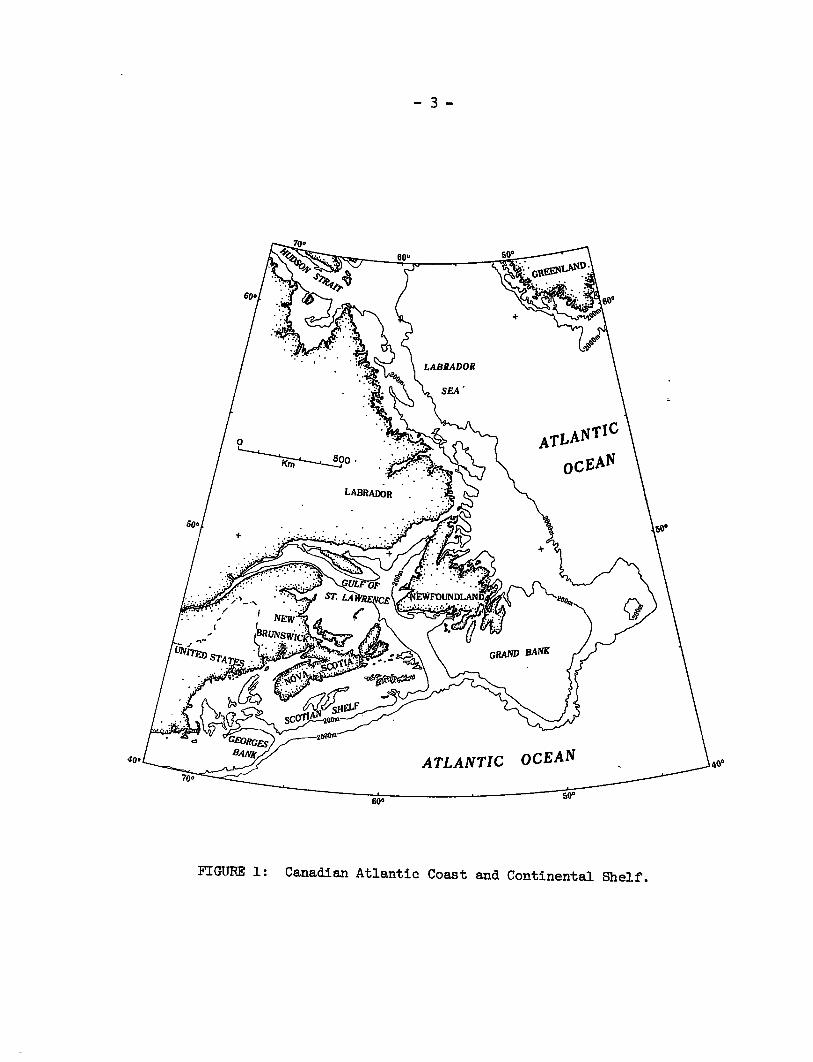
As shown in Fig. 1, the Atlantic Coast and the Continental Shelf
are exposed to waves approaching the southern seaboard from the south-
west, south and east, and the eastern seaboard from the north and east.
Excluded from the investigation are the Bay of Fundy and the Gulf of
St. Lawrence which are partly protected by land. Fully exposed to wave
action from the south are Georges Bank at the entrance to the Bay of
Fundy, the Scotian Shelf, and the southern portion of the shelf off
Newfoundland. The Grand Banks, southeast of Newfoundland, are open to
nearly every direction, with the exception of a sector from the north-
west, while the east coasts of Newfoundland and Labrador are open to
waves from the Labrador Sea and the North Atlantic. The open sea dis-
tance, in all these directions, exceeds 3000 km. Storms rarely extend
over distances greater than 1000 to 1500 km.
When dealing with the wind-wave relationship, it is well known
and has been demonstrated by a number of researchers (Neumannl,
Bretschneider2, Darbyshire3 and others) that storm winds blowing over
such expanses, referred to as 'fetch', can generate exceptionally high
waves. In addition, swell waves, which may have originated outside
of the storm area - perhaps as far away as the South Atlantic - may
augment these wind-generated waves.
1. Neumann, G. "On ocean wave spectra and a new method of forecasting wind-generated sea". Tech. Memorandum No. 43, Beach Erosion Board, U.S. Army Corps of Eng., 1952.
2. Bretschneider, C.L. "Revised wave forecasting curves and procedures". Tech. Report No. HE-155047, Inst. of Eng. Research, Univ. of Calif., Berkeley, 1951.
3. Darbyshire, J. "The generation of waves by wind". Proc. Roy Soc. (London), Ser. A, 1952.
4o. 400
FIGURE 1: Canadian Atlantic Coast and Continental Shelf.
4
3. WEATHER AND WIND
During the winter months there is a strong outflow of very cold
Continental Arctic air into the Canadian Atlantic Region. Over the Gulf
Stream this encounters the moist warm air associated with the circula-
tion of the Azores High. The resultant great exchange of energy produces
frequent storm developments and these storms reach greatest intensity
between South Greenland and Iceland. A strong pressure gradient is
normally present, therefore, over the Scotian Shelf and Labrador Sea.
During the summer months, the temperature differential between
the Continental Arctic and the Maritimes air is much less pronounced
and consequently the polar front is less intense. Depressions forming
on this front rarely reach storm dimensions and the area of lowest
pressure is displaced northward towards the Davis Straits. Under these
conditions, winds over the Canadian Atlantic are generally moderate.
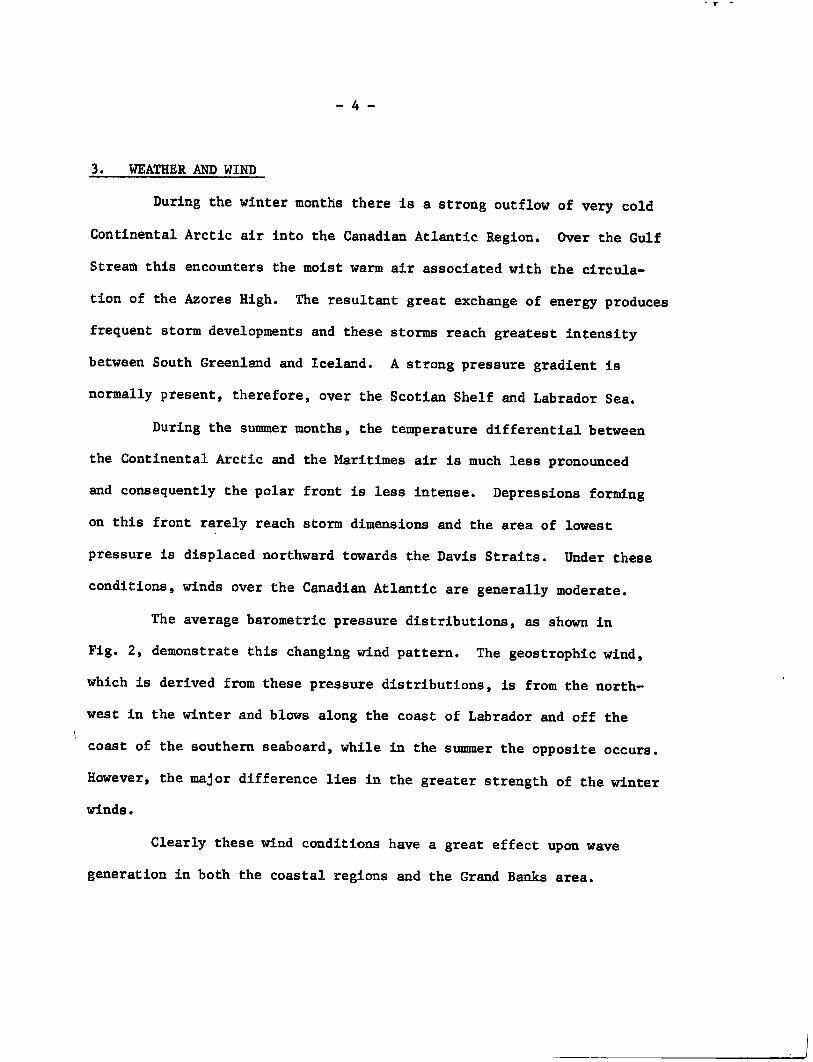
The average barometric pressure distributions, as shown in
Fig. 2, demonstrate this changing wind pattern. The geostrophic wind,
which is derived from these pressure distributions, is from the north-
west in the winter and blows along the coast of Labrador and off the
coast of the southern seaboard, while in the summer the opposite occurs.
However, the major difference lies in the greater strength of the winter
winds.
Clearly these wind conditions have a great effect upon wave
generation in both the coastal regions and the Grand Banks area.
40•
90.
-5
NOTE ATMOSPHERIC PRESSURE IN MILLIBARS MEAN SEA LEVEL PRESSURE OF PERIOD 1940 TO 1953 FROM ATLAS OF CANADA, OPT. OF MINES AND TECH. SURVEYS , 1957
FIGURE 2: Mean Seasonal Atmospheric Pressure
4. WAVES
4.1 Shoaling of Waves
Waves are modified on moving into shallower water. The
speed of a wave depends upon the water depth as well as upon the wave
length; the shallower the water, the slower the speed. Thus, wave
fronts must be bent when advancing at an angle into shoaling areas
because of the reduction of wave speed at the point of contact. This
behaviour is known as wave refraction. During the process, wave
energy may be concentrated or dispersed and, consequently, the wave
height increased or decreased locally. It is readily seen therefore
that heights and directions of waves in areas where shoaling occurs
are not directly related to the wave conditions in deep water.
According to the first order wave theory; waves shoal when
the depth of water is less than half the wave length. A 10-second wave,
which occurs frequently, begins to be affected when the depth is less
than 75 m, while a 14-second wave, which either results from a large
storm or is present as a swell wave, is affected when the depth is less
than 150 m. The depths on the Continental Shelf are usually greater
than 75 m and less than 200 m. It can be assumed therefore that most
waves, with the exception of very long ones, can move freely over most
of the Continental Shelf without being noticeably affected. This,
however, does not apply to some shallower areas on Georges Bank, around
Sable Island, and on the south tip of the Grand Banks, where depths are
less than 50 m.
66° 64° 63° 62° 61° 60° 59°
66' 65°
45°
44°
43°
PERIMI4 SECONDS DIRECTION FROM 180° SOUNDINGS IN METRES
9 190 290 Km
42°
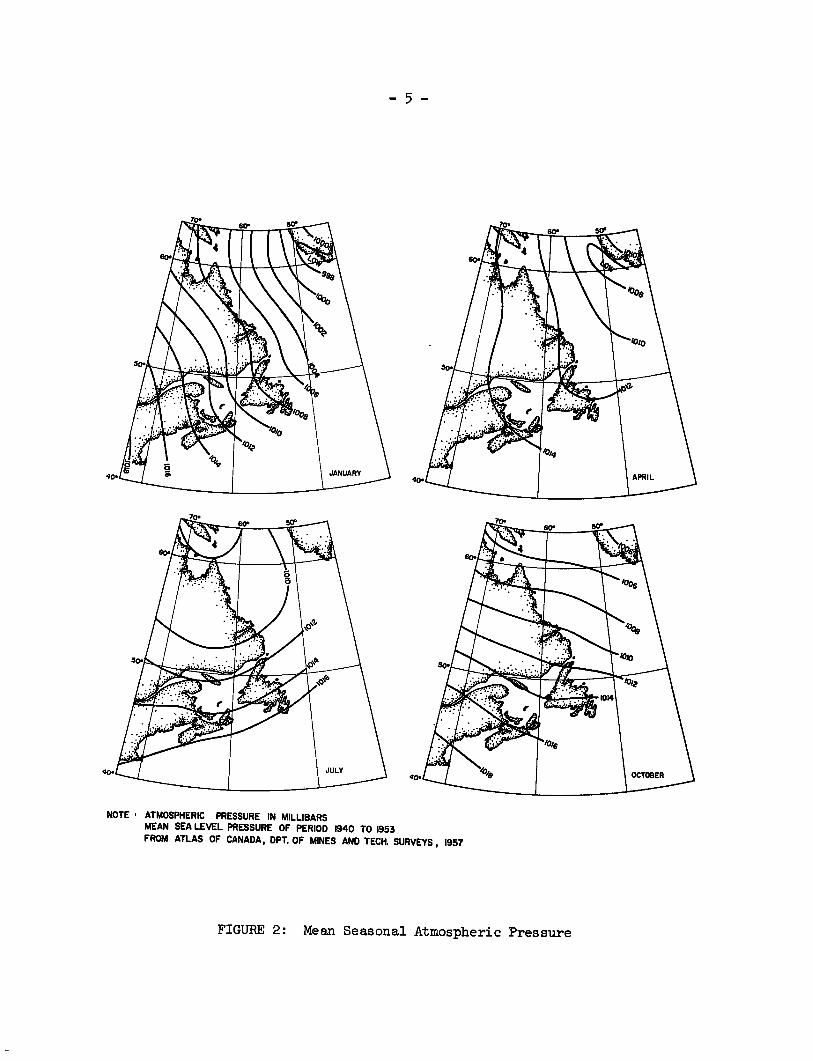
FIGURE 3: Wave Refraction on the Scotian Shelf -
40'
30'
10'
64°00'
30' 20' 10' 63°00' 64° 00' 50'
40'
30'
44° 20'
10'
PERIOD 14 SECONDS DIRECTION FROM. 180°
SOUNDINGS IN METRES rioo
i~o, 10 20 Km
44° 20'
40' 10' 20'
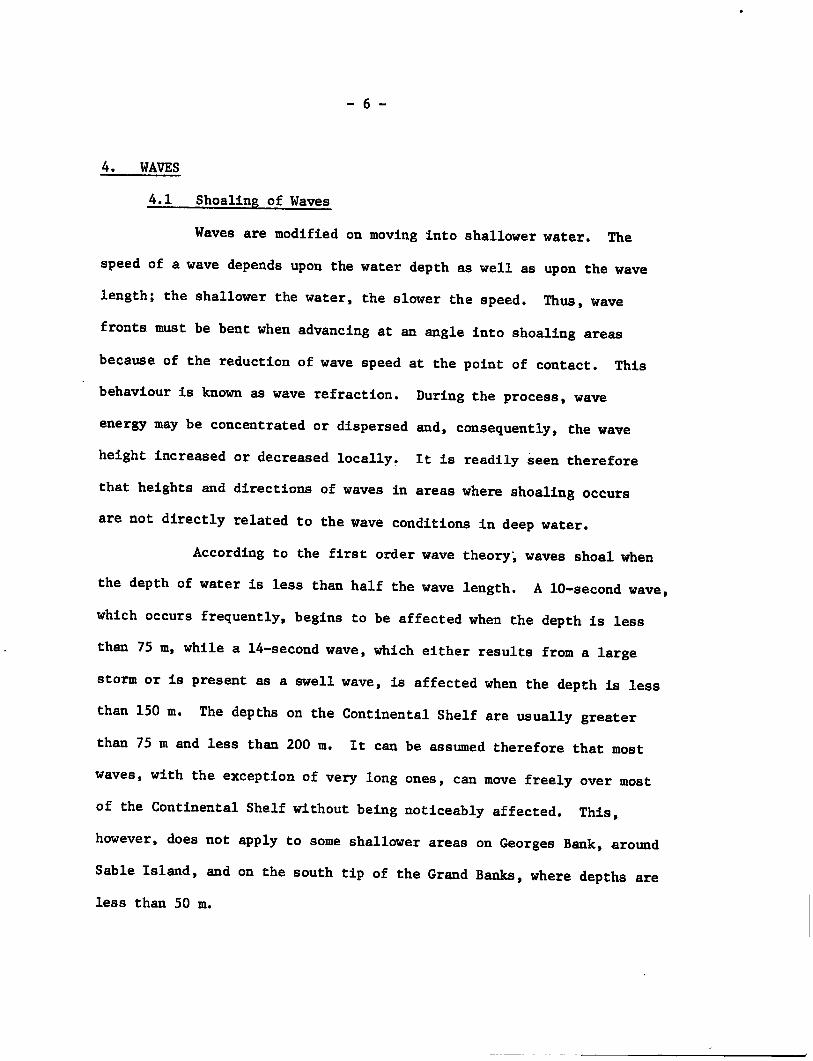
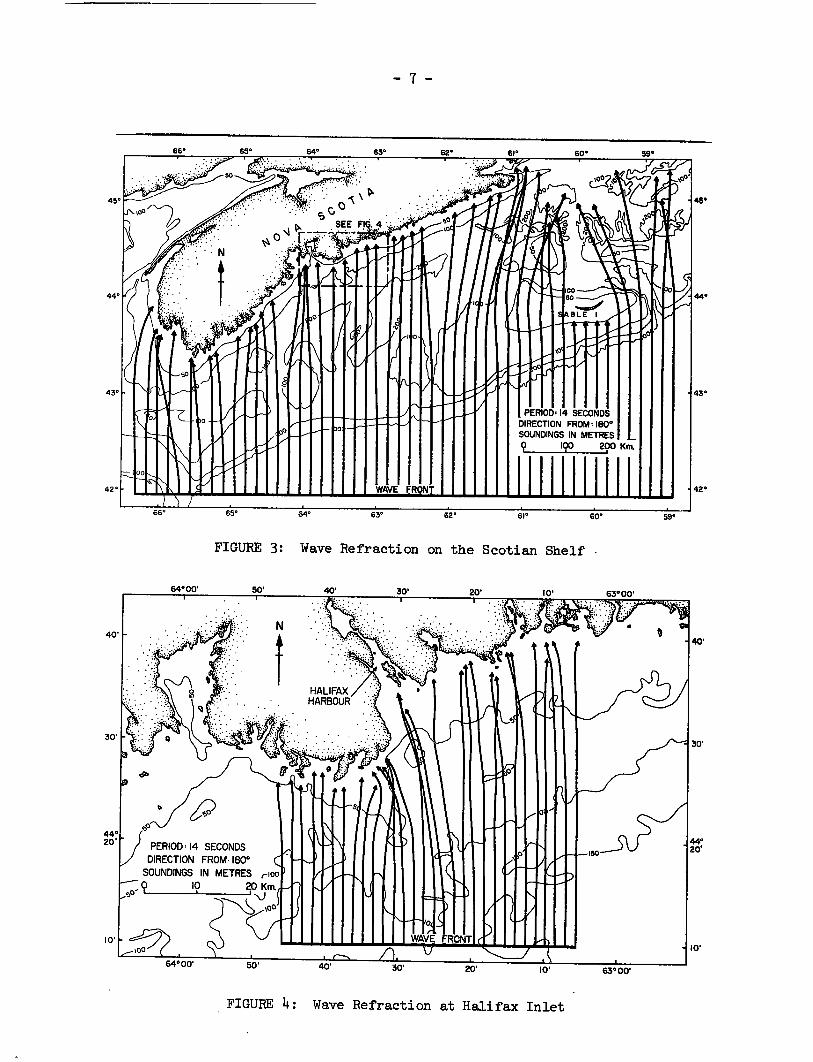
FIGURE 4: Wave Refraction at Halifax Inlet
For a detailed analysis of wave conditions in these areas, the effect
of these shoals must be considered. An example of such a study for the
Scotian Shelf is shown in Fig. 3, where the Refraction Diagram of a
14-second wave approaching from the south is plotted.
Along the coast the sea bed generally rises landward from
a depth of 75 m in the last 10 to 20 km. Since the underwater topography
of this region is very irregular, the waves are modified greatly in
height and direction by shoaling and refraction. Such a modification
occurs at the entrance to Halifax Inlet, and is shown by the Fig. 4.
Thus it is obvious that wave observations performed in the
near-shore zone, with respect to wave height and direction of propagation,
are not representative of the sea state of the off-shore deep water region.
4.2 Wave Observation Methods
There are two ways of describing the sea state - one in
terms of power spectra, and the other with the characteristic physical
properties of the waves: their height, length or period, and the direc-
tion of propagation. The first is used primarily by scientists studying
the physics of waves, their relationship to the atmosphere, etc. It is
difficult and, in the opinion of the author, impracticable at present to
apply these data to a wave climate investigation. The second type of
description is more useful for applied scientists and engineers and also
more adaptable to a time series study.
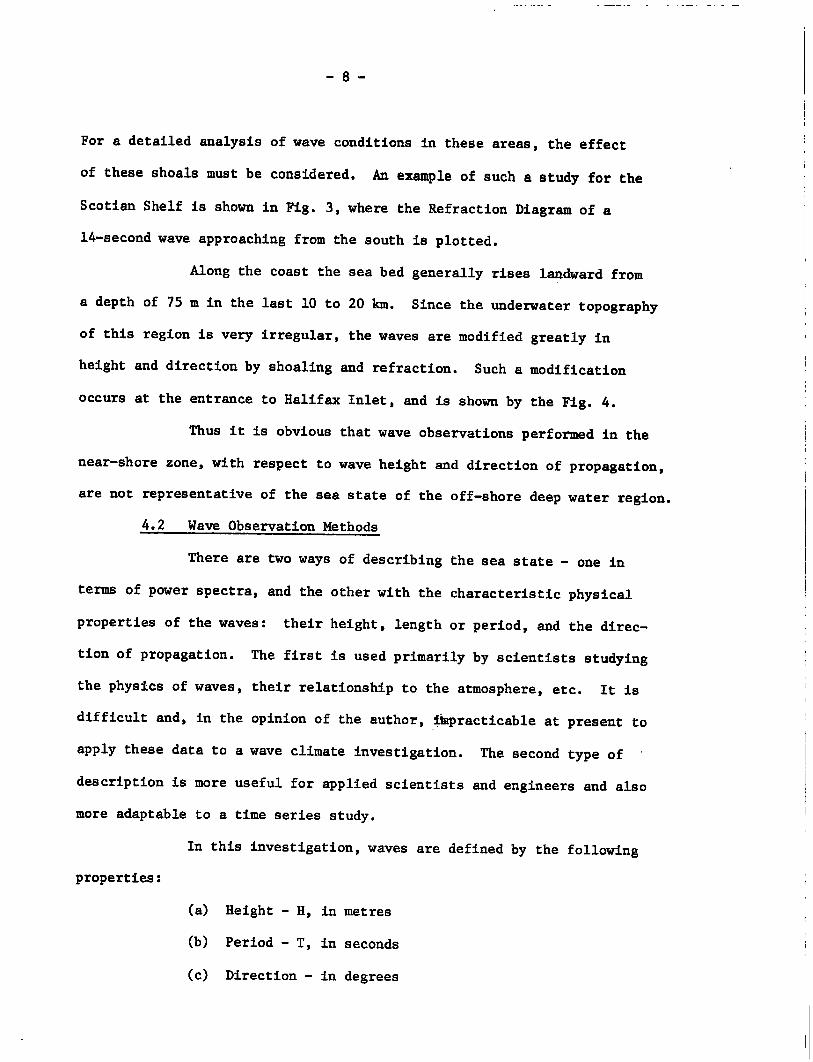
In this investigation, waves are defined by the following
properties:
(a) Height - H, in metres
(b) Period - T, in seconds
(c) Direction - in degrees
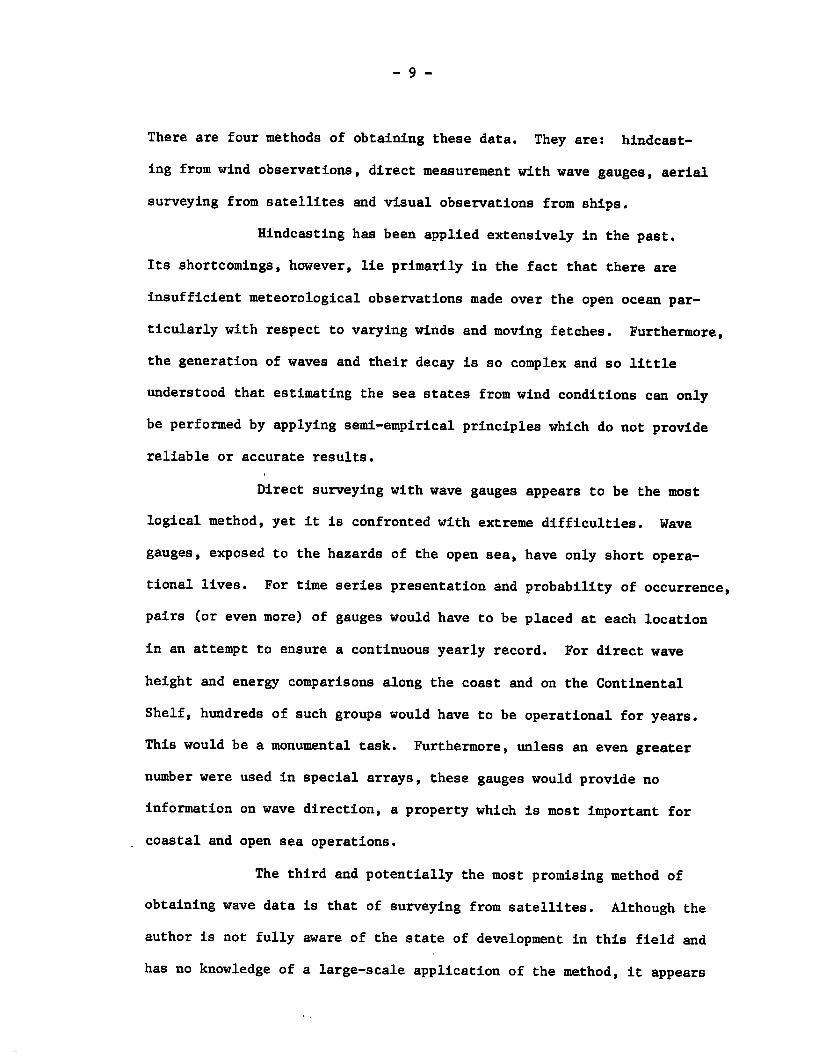
There are four methods of obtaining these data. They are: hindcast-
ing from wind observations, direct measurement with wave gauges, aerial
surveying from satellites and visual observations from ships.
Hindcasting has been applied extensively in the past.
Its shortcomings, however, lie primarily in the fact that there are
insufficient meteorological observations made over the open ocean par-
ticularly with respect to varying winds and moving fetches. Furthermore,
the generation of waves and their decay is so complex and so little
understood that estimating the sea states from wind conditions can only
be performed by applying semi-empirical principles which do not provide
reliable or accurate results.
Direct surveying with wave gauges appears to be the most
logical method, yet it is confronted with extreme difficulties. Wave
gauges, exposed to the hazards of the open sea, have only short opera-
tional lives. For time series presentation and probability of occurrence,
pairs (or even more) of gauges would have to be placed at each location
in an attempt to ensure a continuous yearly record. For direct wave
height and energy comparisons along the coast and on the Continental
Shelf, hundreds of such groups would have to be operational for years.
This would be a monumental task. Furthermore, unless an even greater
number were used in special arrays, these gauges would provide no
information on wave direction, a property which is most important for
. coastal and open sea operations.
The third and potentially the most promising method of
obtaining wave data is that of surveying from satellites. Although the
author is not fully aware of the state of development in this field and
has no knowledge of a large-scale application of the method, it appears
- 10 -
that it may be available for general use in the late seventies or
early eighties.
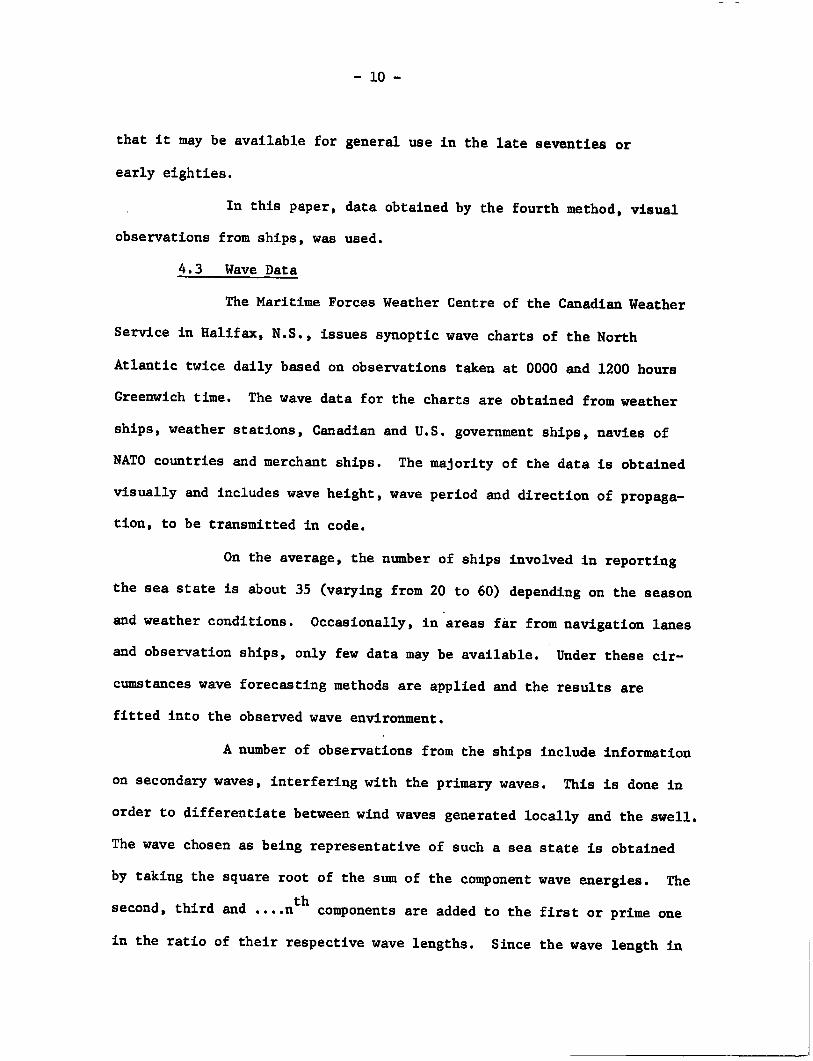
In this paper, data obtained by the fourth method, visual
observations from ships, was used.
4.3 Wave Data
The Maritime Forces Weather Centre of the Canadian Weather
Service in Halifax, N.S., issues synoptic wave charts of the North
Atlantic twice daily based on observations taken at 0000 and 1200 hours
Greenwich time. The wave data for the charts are obtained from weather
ships, weather stations, Canadian and U.S. government ships, navies of
NATO countries and merchant ships. The majority of the data is obtained
visually and includes wave height, wave period and direction of propaga-
tion, to be transmitted in code.
On the average, the number of ships involved in reporting
the sea state is about 35 (varying from 20 to 60) depending on the season
and weather conditions. Occasionally, in areas far from navigation lanes
and observation ships, only few data may be available. Under these cir-
cumstances wave forecasting methods are applied and the results are
fitted into the observed wave environment.
A number of observations from the ships include information
on secondary waves, interfering with the primary waves. This is done in
order to differentiate between wind waves generated locally and the swell.
The wave chosen as being representative of such a sea state is obtained
by taking the square root of the sum of the component wave energies. The
second, third and ....nth
components are added to the first or prime one
in the ratio of their respective wave lengths. Since the wave length in
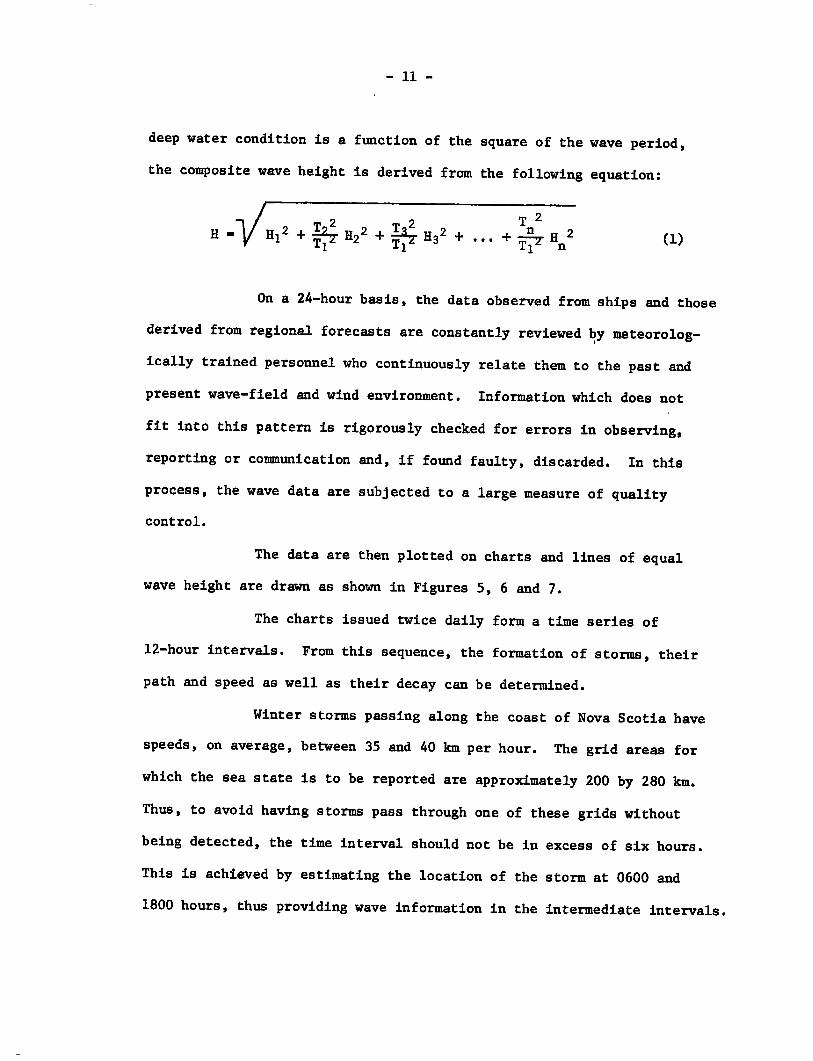
deep water condition is a function of the square of the wave period,
the composite wave height is derived from the following equation:
2 T H = H12 + T— T22 H 2 I. Tn2 H 2 4. 4. H 2 7 2 "T72- 3 • • • F2" n (1)
On a 24-hour basis, the data observed from ships and those
derived from regional forecasts are constantly reviewed by meteorolog-
ically trained personnel who continuously relate them to the past and
present wave-field and wind environment. Information which does not
fit into this pattern is rigorously checked for errors in observing,
reporting or communication and, if found faulty, discarded. In this
process, the wave data are subjected to a large measure of quality
control.
The data are then plotted on charts and lines of equal
wave height are drawn as shown in Figures 5, 6 and 7.
The charts issued twice daily form a time series of
12-hour intervals. From this sequence, the formation of storms, their
path and speed as well as their decay can be determined.
Winter storms passing along the coast of Nova Scotia have
speeds, on average, between 35 and 40 km per hour. The grid areas for
which the sea state is to be reported are approximately 200 by 280 km.
Thus, to avoid having storms pass through one of these grids without
being detected, the time interval should not be in excess of six hours.
This is achieved by estimating the location of the storm at 0600 and
1800 hours, thus providing wave information in the intermediate intervals.
roi GEOSTRONDC WIND SCUD NOWS.4201KTUNNW
T/h
D — DIRECTION T — PERIOD IN SEC
h — WAVE HEIGHT IN 1/2 METRES
— CONFUSED PERIOD
— ALL WAVE CONTOUR HEIGHTS IN METRES
4147, 411 41111111s 0
4!*
ICE •
•
4*
4s
nF 5/03
•
2/0
2/0
iwoas
WAVE DATA CHART
FOR 0000Z JAN 23 1970 SSUE0 BY MR WEATHER COM lIALIVAX
MATED SY CFN NALI1412 CANADA raw wineCTION
•11110•711011r.IMANDI• 011020•0110/110M110111.0Yea • RCM WM
20 40 60 SON . I -444111111111101 :l ANADIAN WEATHER SERVI 3/01 •
5/0
.ir
5/oi
- 12 -
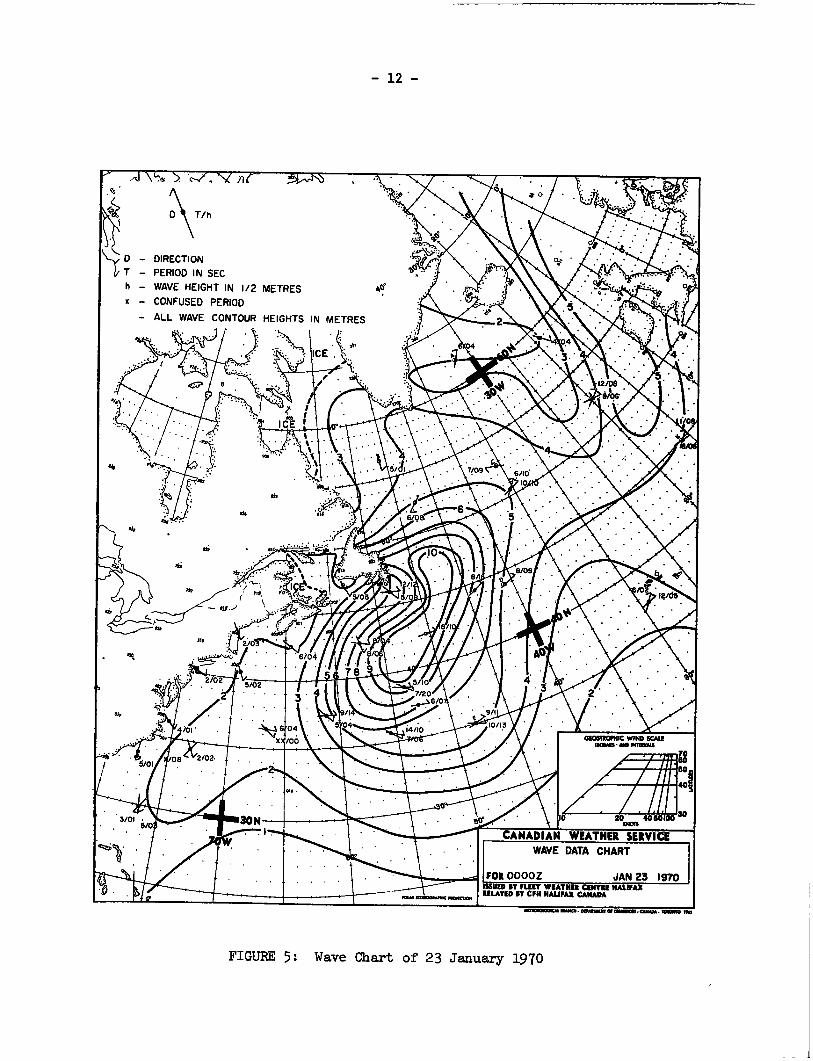
FIGURE 5: Wave Chart of 23 January 1970
T/h
D - DIRECTION T - PERIOD IN SEC h - WAVE HEIGHT IN 1/2 METRES X - CONFUSED PERIOD
- ALL WAVE CONTOUR HEIGHTS IN METRES
/06 .
U.
CANADIAN WEATHER SERVICE
MID UT FLEET WIATNIA CENTRE HALIFAX RELATED ET CFN HALIFAX CANADA
WAVE DATA CHART
FOR 0000Z FEB a 1970
- 13 -
.1710101011al 01111101• Ova/OP =WINN, • CJIMa [011740 1%3
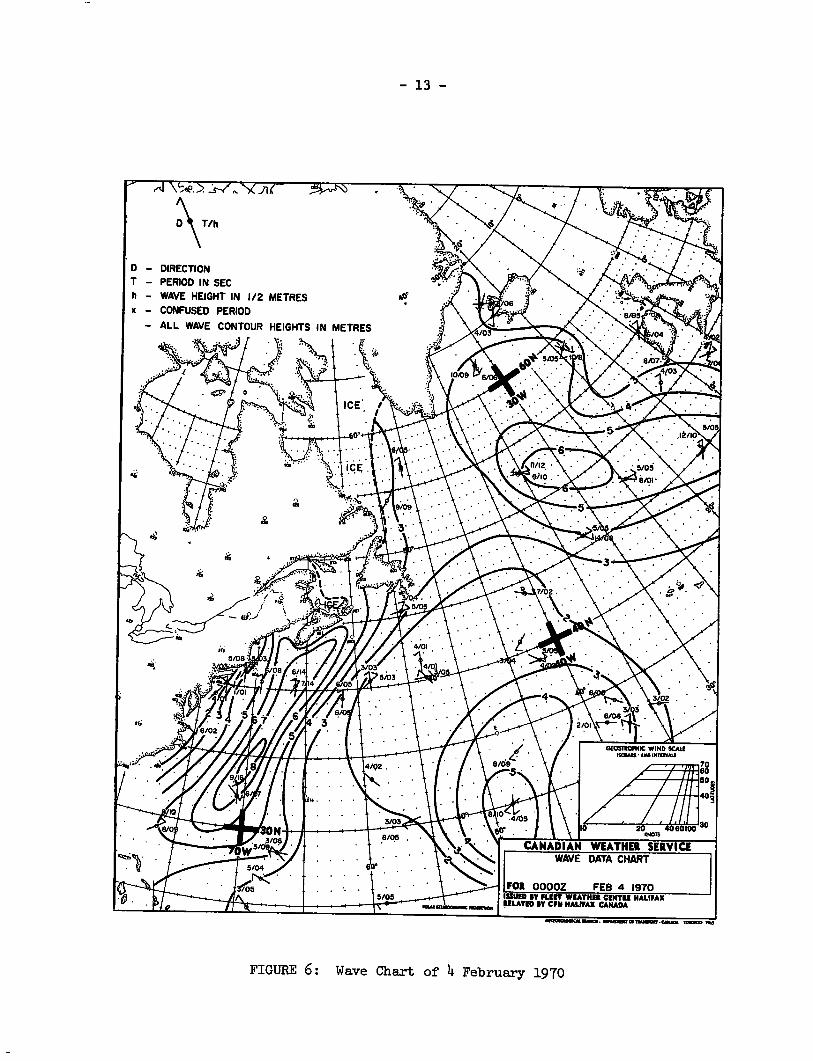
FIGURE 6: Wave Chart of 14 February 1970
- DIRECTION - PERIOD IN SEC - WAVE HEIGHT IN 1/2 METRES
- CONFUSED PERIOD
- ALL WAVE CONTOUR HEIGHTS IN METRES
. 40,1;), x/07.5/
• X/0 •
9/08. INOSTROPNIC WIND SCALE
1501AIS Olit NUMMI
10 AVM
20 40 100
CANADIAN WEATHER SERVICE WAVE DATA CHART
FOR 1200Z DEC. 27 1970 EYED WY FLEET WEATHER CENTRE HALIFAX
DILATED DT CFN HALIFAX CANADA
odlaNOUXICat NYCO • COMMON OP TIMIPOIT • Met
SON
. .70W •
- 14 -
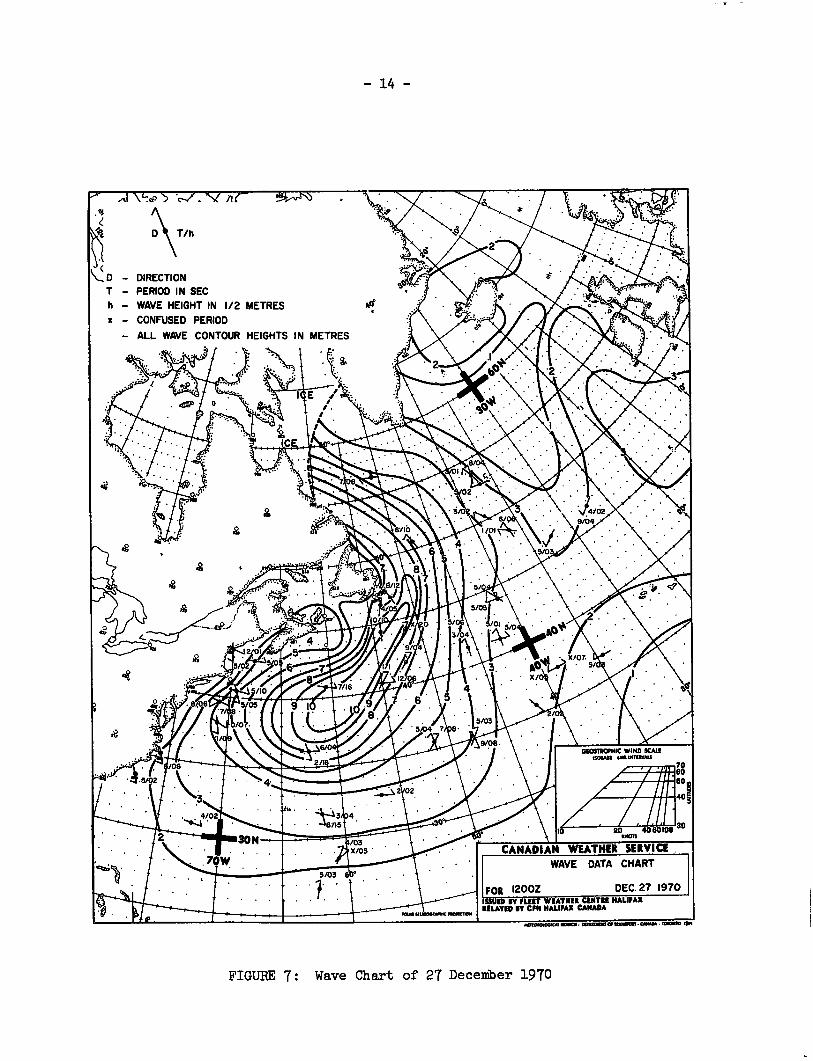
FIGURE 7: Wave Chart of 27 December 1970
- 15 -
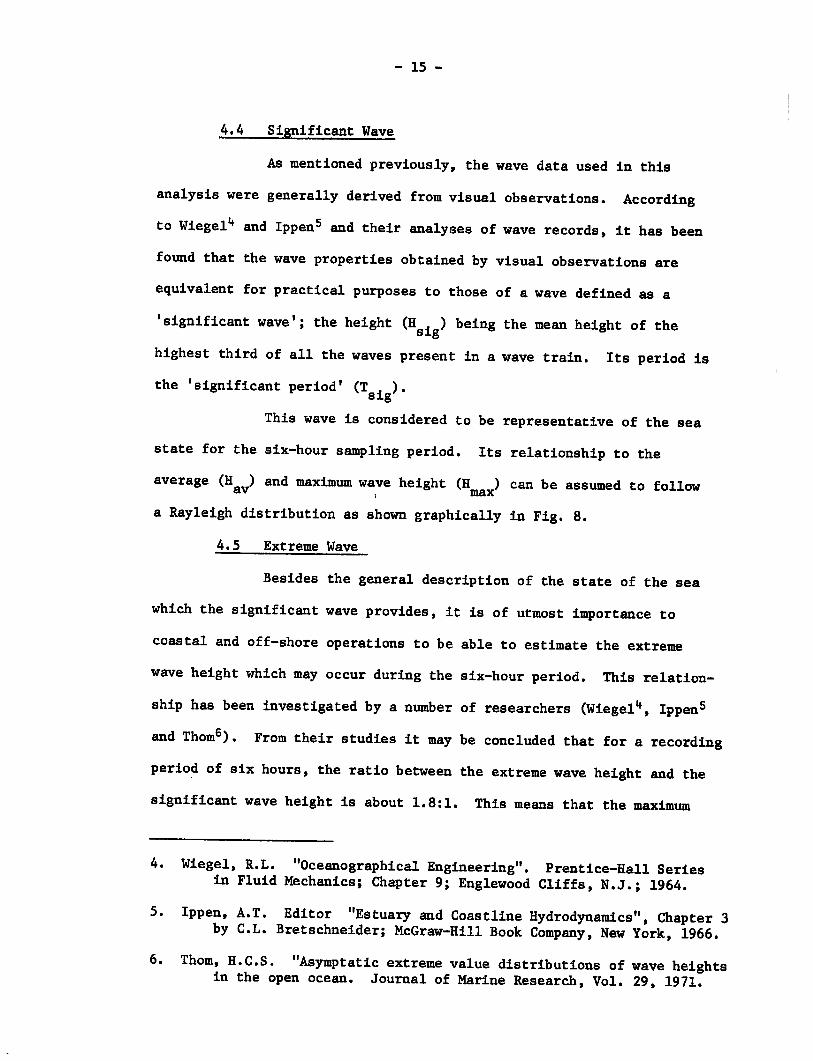
4.4 Significant Wave
As mentioned previously, the wave data used in this
analysis were generally derived from visual observations. According
to Wiegel4 and Ippen5 and their analyses of wave records, it has been
found that the wave properties obtained by visual observations are
equivalent for practical purposes to those of a wave defined as a
'significant wave'; the height (Haig) being the mean height of the
highest third of all the waves present in a wave train. Its period is
the 'significant period' (Trig).
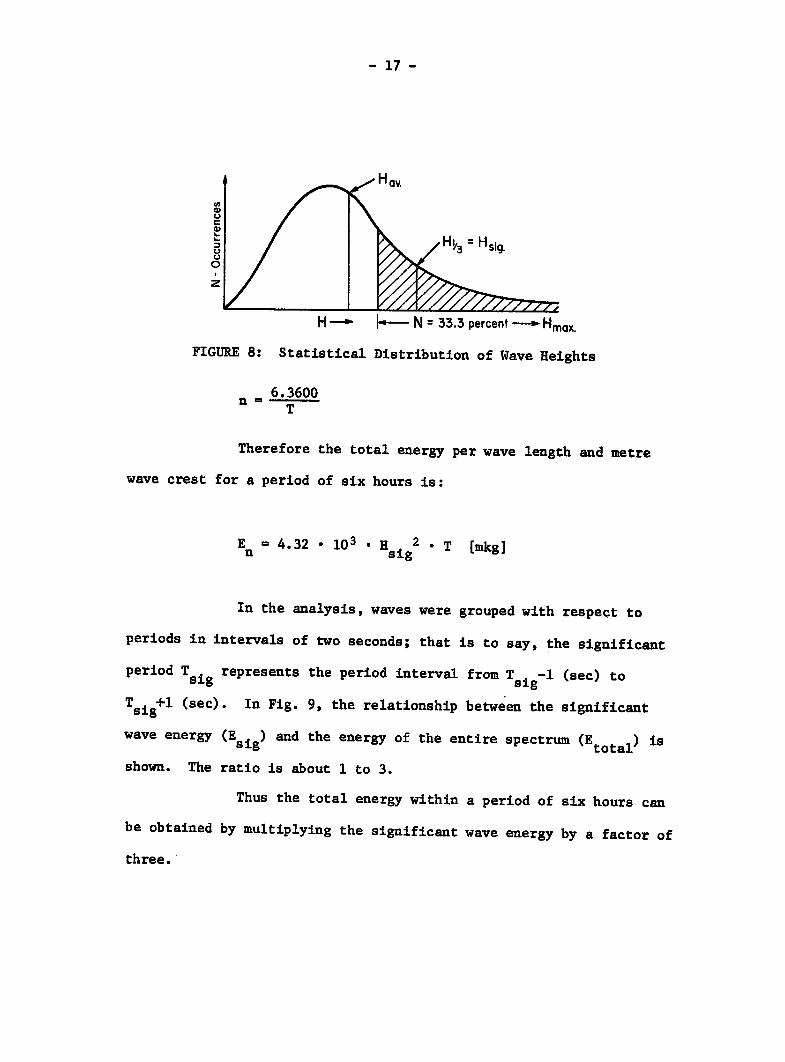
This wave is considered to be representative of the sea
state for the six-hour sampling period. Its relationship to the
average (Hav) and maximum wave height (Hmax)
can be assumed to follow
a Rayleigh distribution as shown graphically in Fig. 8.
4.5 Extreme Wave
Besides the general description of the state of the sea
which the significant wave provides, it is of utmost importance to
coastal and off-shore operations to be able to estimate the extreme
wave height which may occur during the six-hour period. This relation-
ship has been investigated by a number of researchers (Wiege14, Ippen5
and Thom6). From their studies it may be concluded that for a recording
period of six hours, the ratio between the extreme wave height and the
significant wave height is about 1.8:1. This means that the maximum
4. Wiegel, R.L. "Oceanographical Engineering". Prentice-Hall Series in Fluid Mechanics; Chapter 9; Englewood Cliffs, N.J.; 1964.
5. Ippen, A.T. Editor "Estuary and Coastline Hydrodynamics", Chapter 3 by C.L. Bretschneider; McGraw-Hill Book Company, New York, 1966.
6. Thom, H.C.S. "Asymptatic extreme value distributions of wave heights in the open ocean. Journal of Marine Research, Vol. 29, 1971.
- 16 -
wave height can be obtained by multiplying the observed wave height,
which is equivalent to the significant wave height, by this factor.
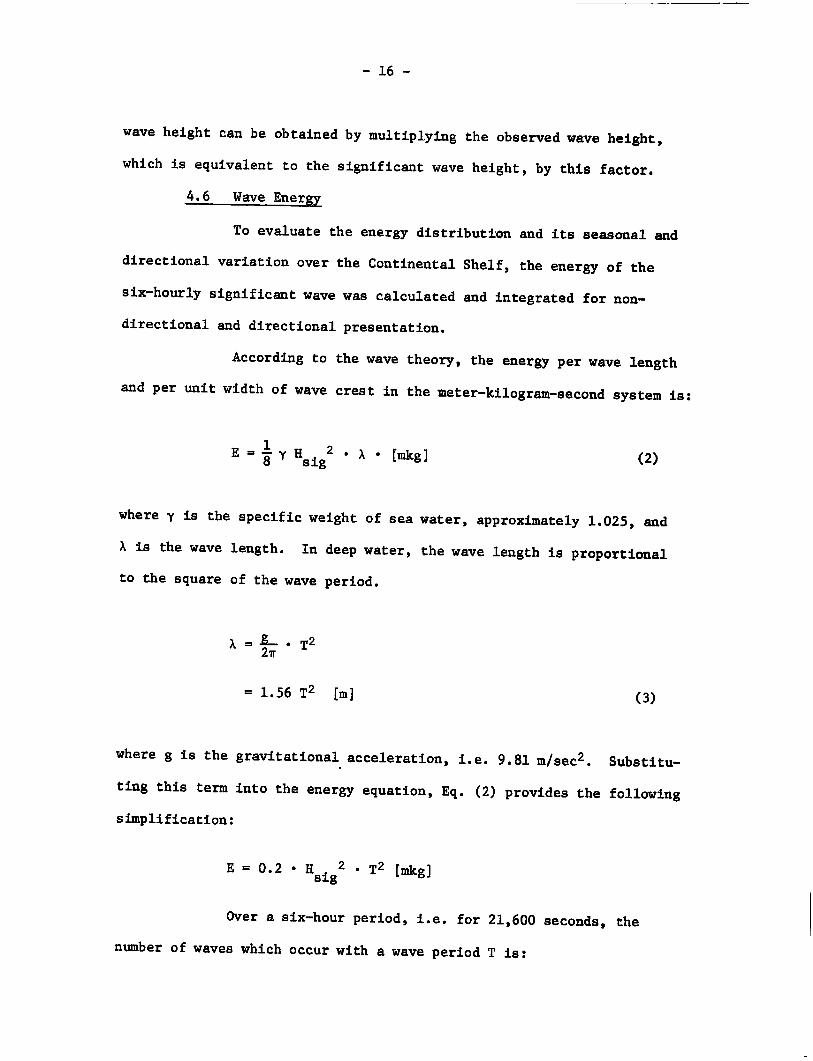
4.6 Wave Energy
To evaluate the energy distribution and its seasonal and
directional variation over the Continental Shelf, the energy of the
six-hourly significant wave was calculated and integrated for non-
directional and directional presentation.
According to the wave theory, the energy per wave length
and per unit width of wave crest in the meter-kilogram-second system is:
1 E = -8- y Hsig2 • A • [mkg] (2)
where y is the specific weight of sea water, approximately 1.025, and
A is the wave length. In deep water, the wave length is proportional
to the square of the wave period.
A = 2- • T2 271.
= 1.56 T2 [m] (3)
where g is the gravitational acceleration, i.e. 9.81 m/sec2. Substitu-
ting this term into the energy equation, Eq. (2) provides the following
simplification:
E = 0.2 • Hsig
2 • T2 [mkg]
Over a six-hour period, i.e. for 21,600 seconds, the
number of waves which occur with a wave period T is:
- 17 -
H N = 33.3 percent Hmax.
FIGURE 8: Statistical Distribution of Wave Heights
n = 6.3600 T
Therefore the total energy per wave length and metre
wave crest for a period of six hours is:
En = 4.32 • 103 • H
sig2 • T [mkg]
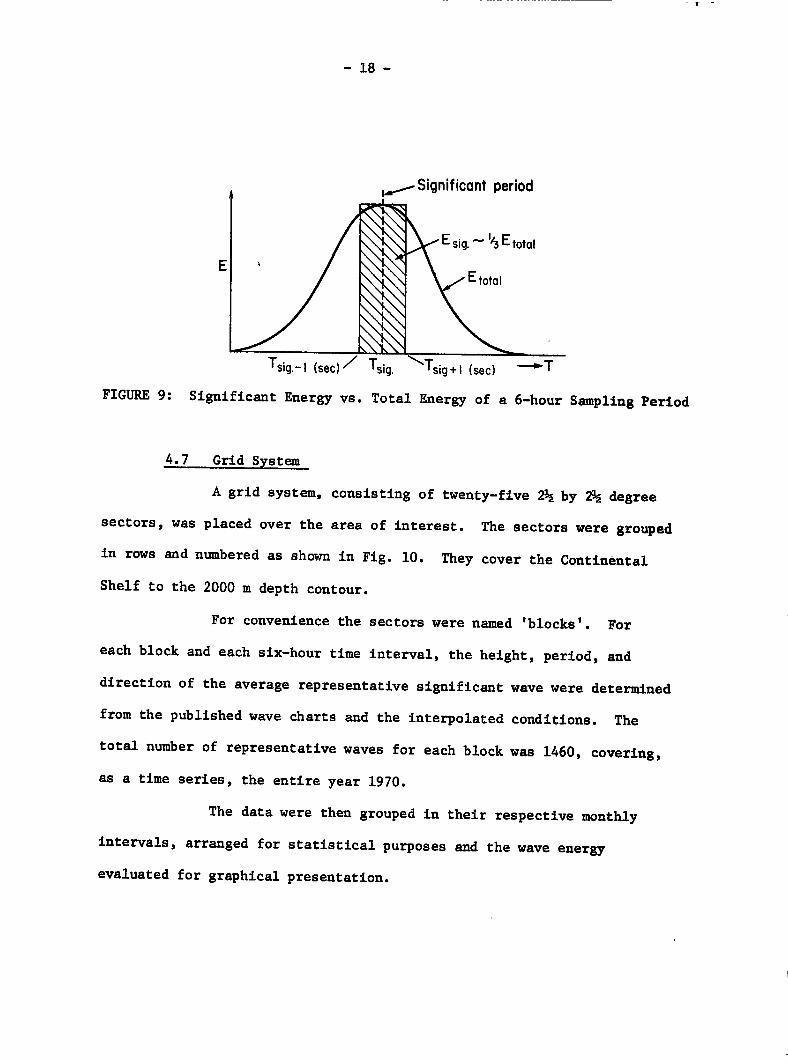
In the analysis, waves were grouped with respect to
periods in intervals of two seconds; that is to say, the significant
period Taig
represents the period interval from Tsig-1
(sec) to
T+1 (sec). In Fig. 9, the relationship between the significant
wave energy (Esig)
and the energy of the entire spectrum (Etotal)
is
shown. The ratio is about 1 to 3.
Thus the total energy within a period of six hours can
be obtained by multiplying the significant wave energy by a factor of
three.
1,.....--Significant period
• —I/3E total
Etotai
sig.-1 (sec)// Tsig. (sec)
FIGURE 9: Significant Energy vs. Total Energy of a 6-hour Sampling Period
- 18 -
4.7 Grid System
A grid system, consisting of twenty-five by 21/2 degree
sectors, was placed over the area of interest. The sectors were grouped
in rows and numbered as shown in Fig. 10. They cover the Continental
Shelf to the 2000 m depth contour.
For convenience the sectors were named 'blocks'. For
each block and each six-hour time interval, the height, period, and
direction of the average representative significant wave were determined
from the published wave charts and the interpolated conditions. The
total number of representative waves for each block was 1460, covering,
as a time series, the entire year 1970.
The data were then grouped in their respective monthly
intervals, arranged for statistical purposes and the wave energy
evaluated for graphical presentation.
- 19 -
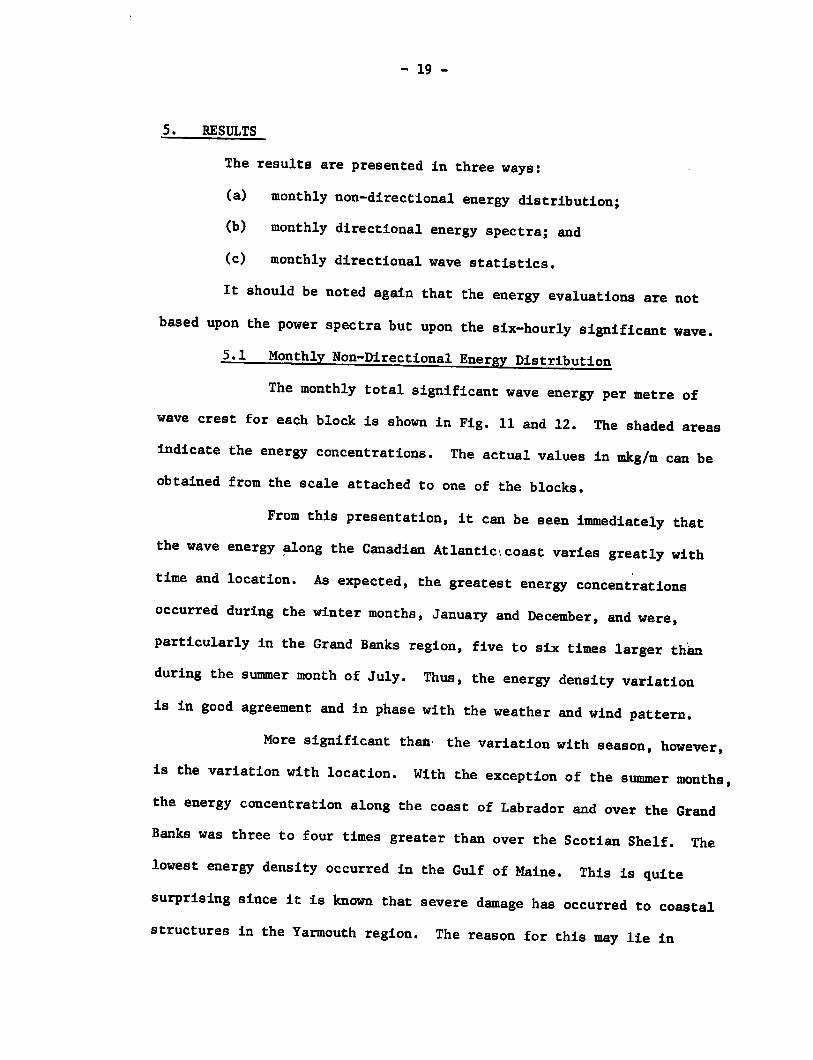
5. RESULTS
The results are presented in three ways:
(a) monthly non-directional energy distribution;
(b) monthly directional energy spectra; and
(c) monthly directional wave statistics.
It should be noted again that the energy evaluations are not
based upon the power spectra but upon the six-hourly significant wave.
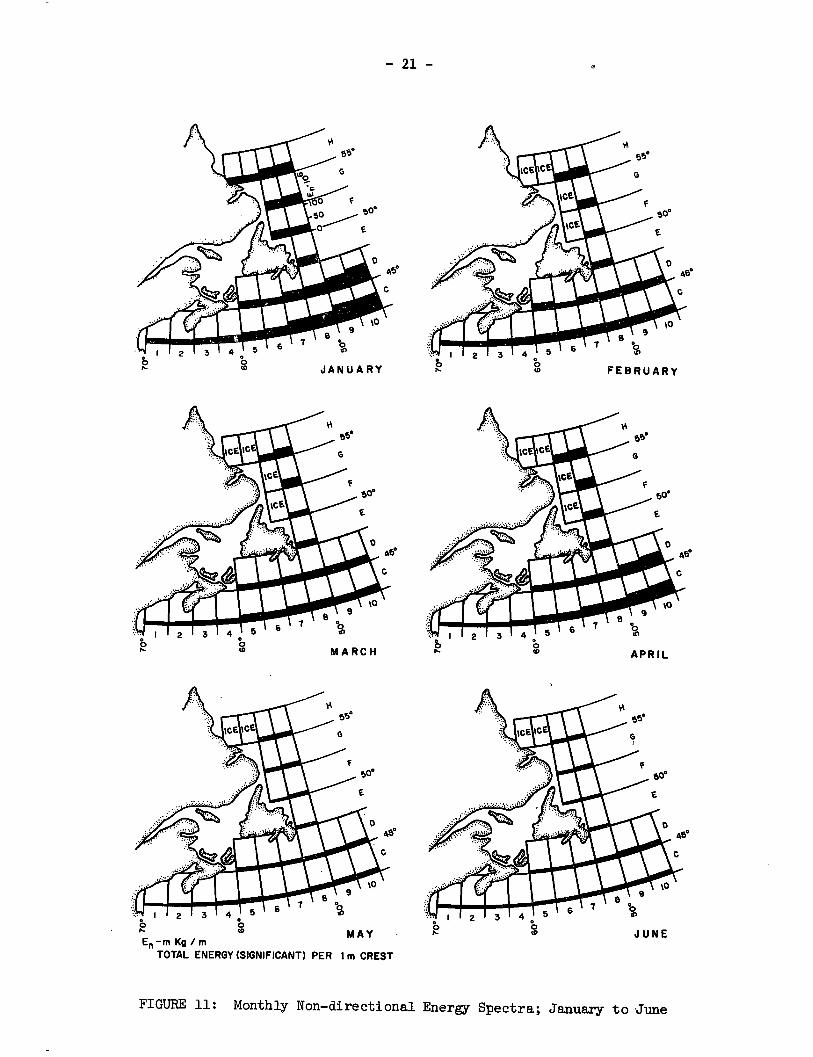
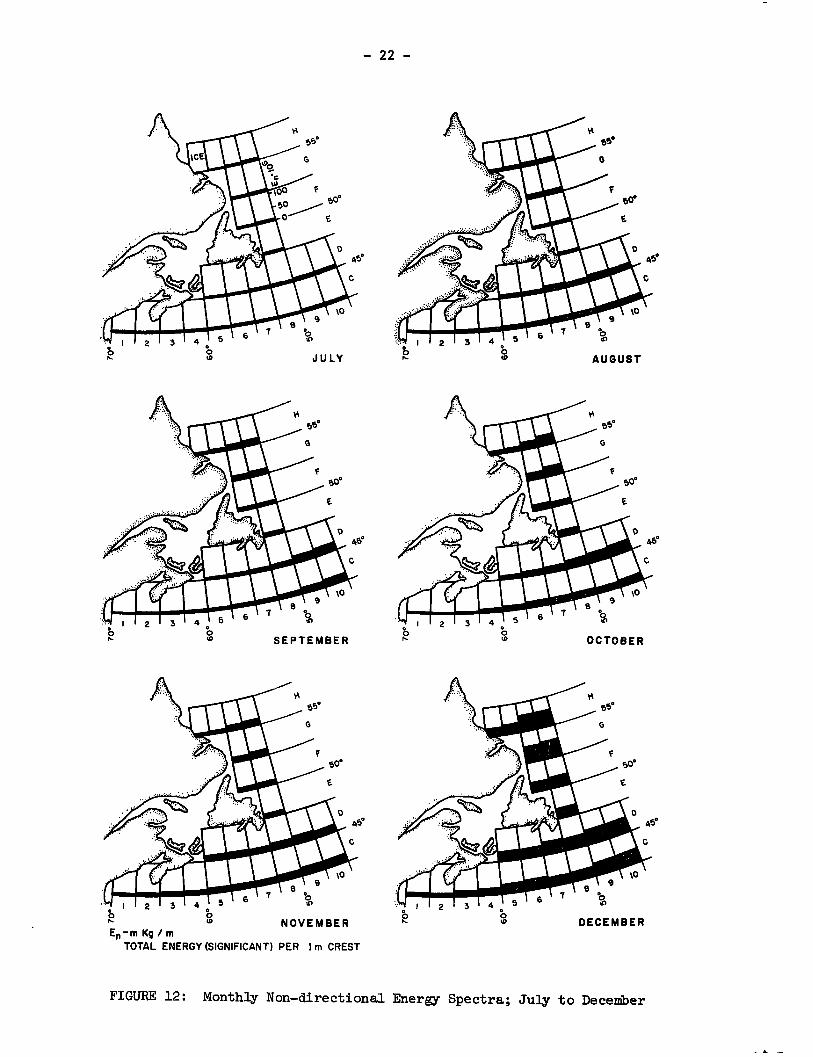
5.1 Monthly Non-Directional Energy Distribution
The monthly total significant wave energy per metre of
wave crest for each block is shown in Fig. 11 and 12. The shaded areas
indicate the energy concentrations. The actual values in mkg/m can be
obtained from the scale attached to one of the blocks.
From this presentation, it can be seen immediately that
the wave energy along the Canadian Atlantic coast varies greatly with
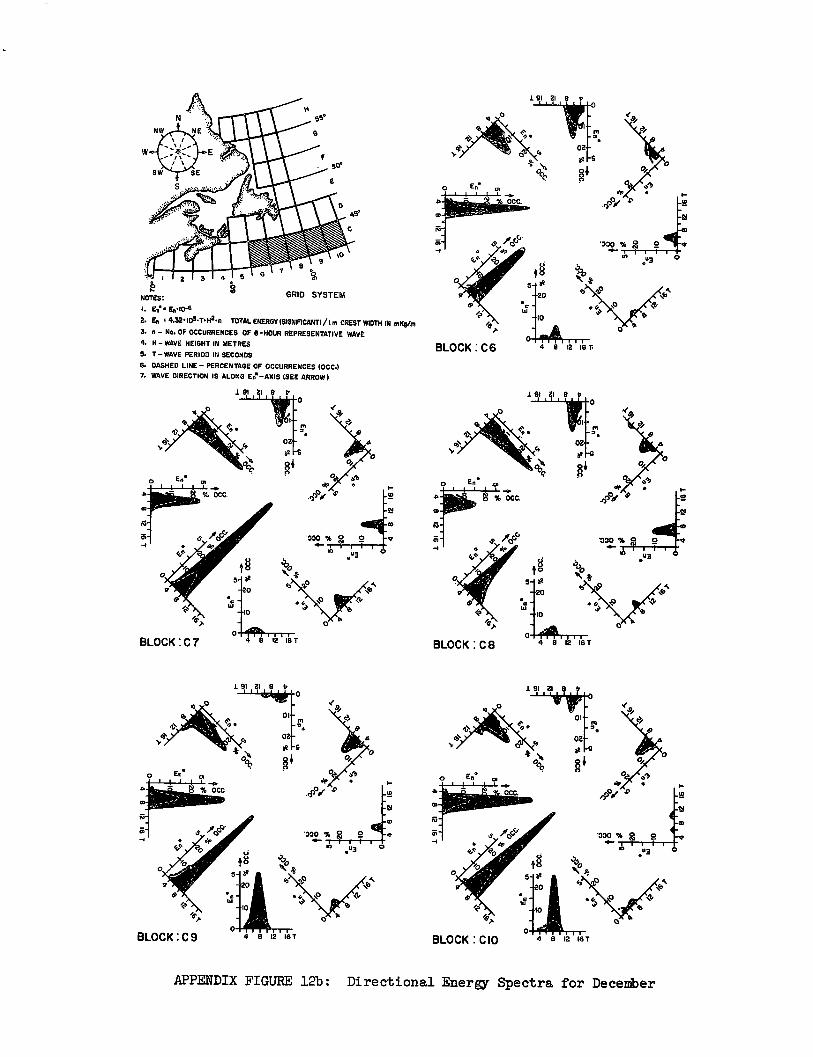
time and location. As expected, the greatest energy concentrations
occurred during the winter months, January and December, and were,
particularly in the Grand Banks region, five to six times larger than
during the summer month of July. Thus, the energy density variation
is in good agreement and in phase with the weather and wind pattern.
More significant than the variation with season, however,
is the variation with location. With the exception of the summer months,
the energy concentration along the coast of Labrador and over the Grand
Banks was three to four times greater than over the Scotian Shelf. The
lowest energy density occurred in the Gulf of Maine. This is quite
surprising since it is known that severe damage has occurred to coastal
structures in the Yarmouth region. The reason for this may lie in
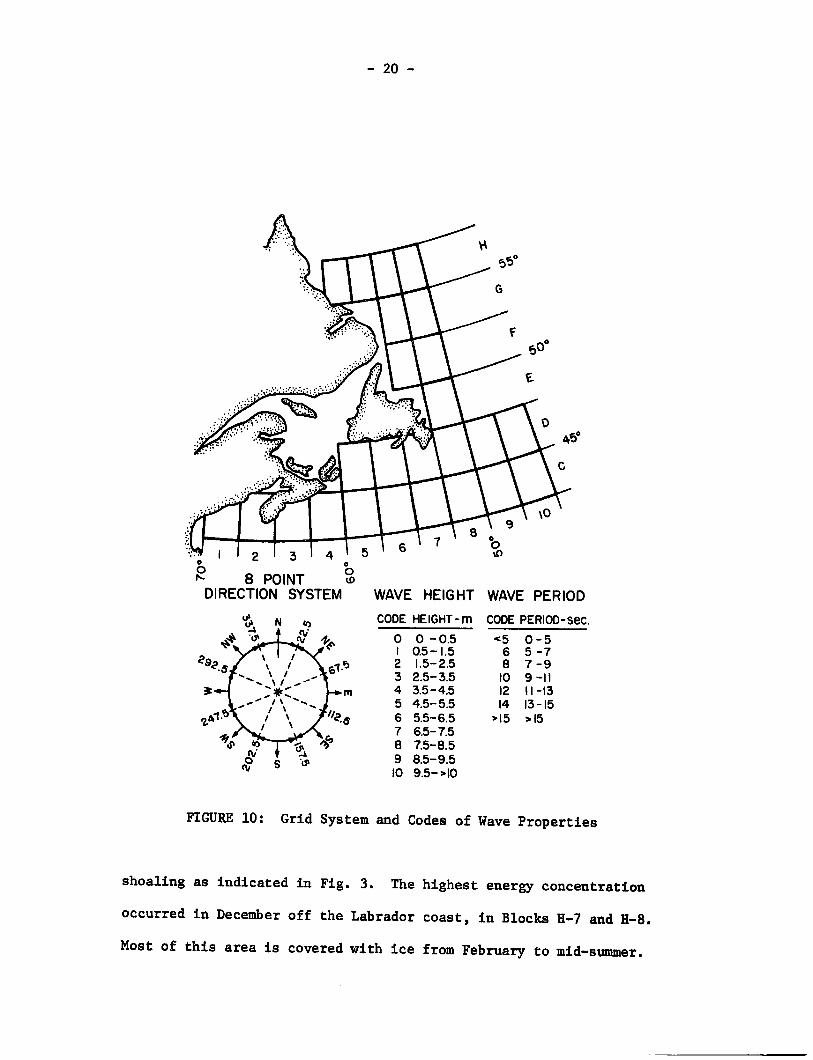
.c. I 2 3 O a0
8 POINT to DIRECTION SYSTEM WAVE HEIGHT
CODE HEIGHT - m
WAVE PERIOD
CODE PERIOD-sec.
0 0 - 0.5 <5 0 - 5 0.5-1.5 6 5 -7
2 1.5- 2.5 8 7 -9 3 2.5-3.5 10 9 -II 4 3.5-4.5 12 I I -13 5 4.5-5.5 14 13 -15 6 5.5-6.5 >15 >15 7 6.5-7.5 8 7.5-8.5 9 8.5-9.5 I0 9.5- >10
FIGURE 10: Grid System and Codes of Wave Properties
shoaling as indicated in Fig. 3. The highest energy concentration
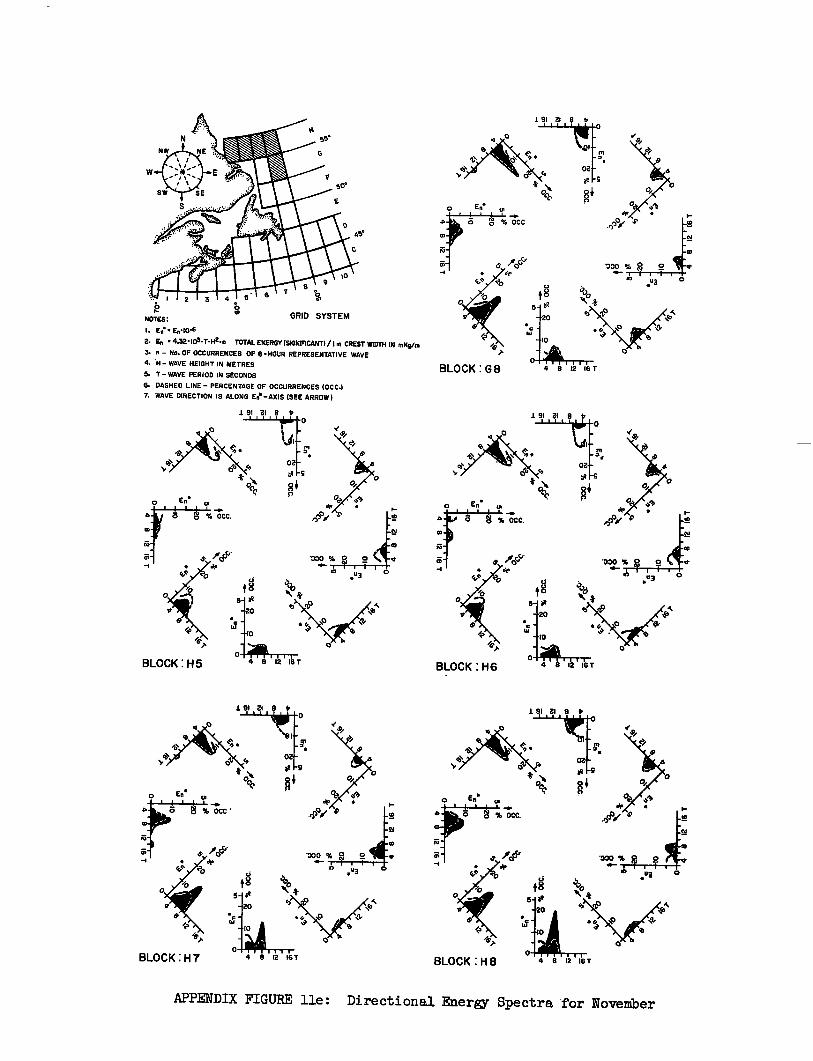
occurred in December off the Labr ador coast, in Blocks H-7 and H-8.
Most of this area is covered with ice from February to mid-summer.
2 S r, MAY
En —m Kg / m
TOTAL ENERGY (SIGNIFICANT) PER 1 m CREST
- 21 -
FIGURE 11: Monthly Non-directional Energy Spectra; January to June
-22-
0 0 to
En —m Kg / m NOVEMBER
TOTAL ENERGY (SIGNIFICANT) PER I m CREST
FIGURE 12: Monthly Non-directional Energy Spectra; July to December
-23-
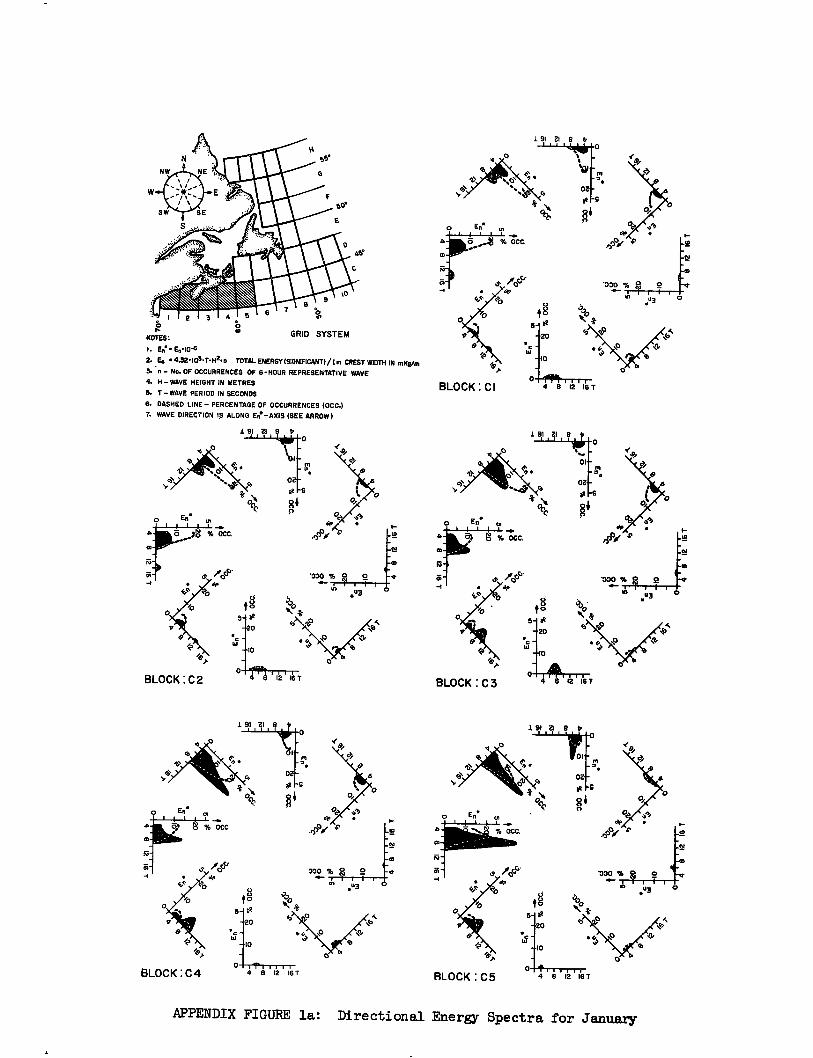
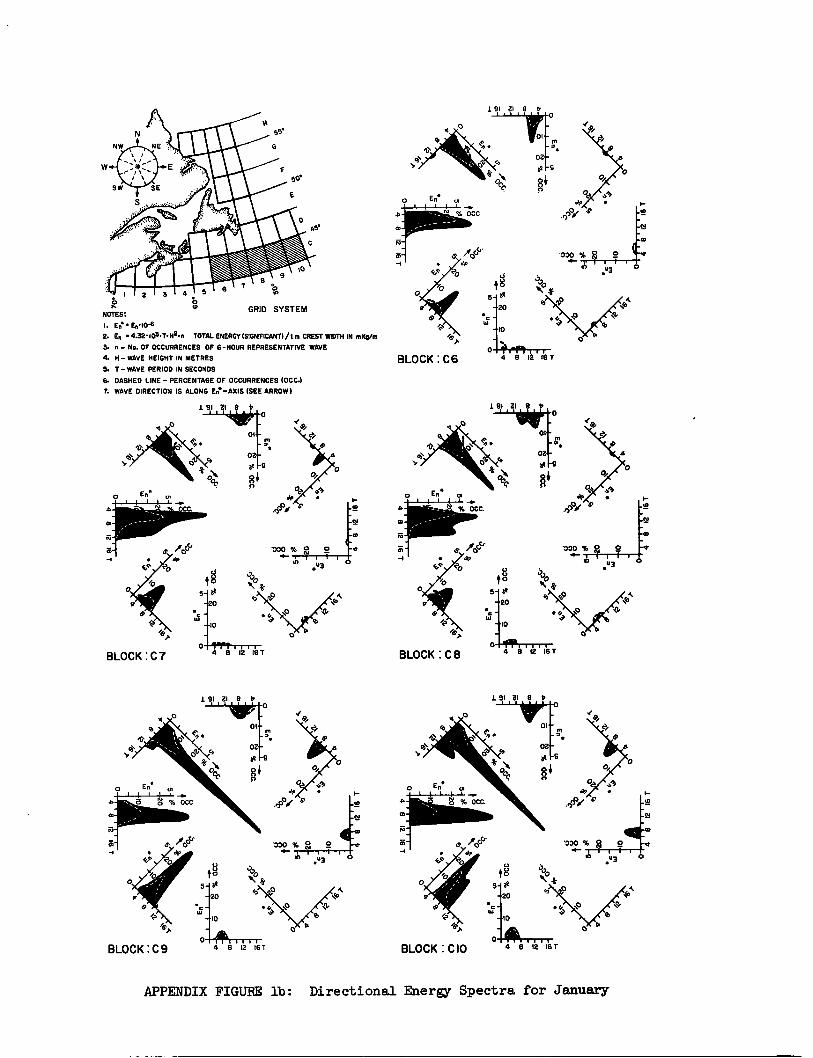
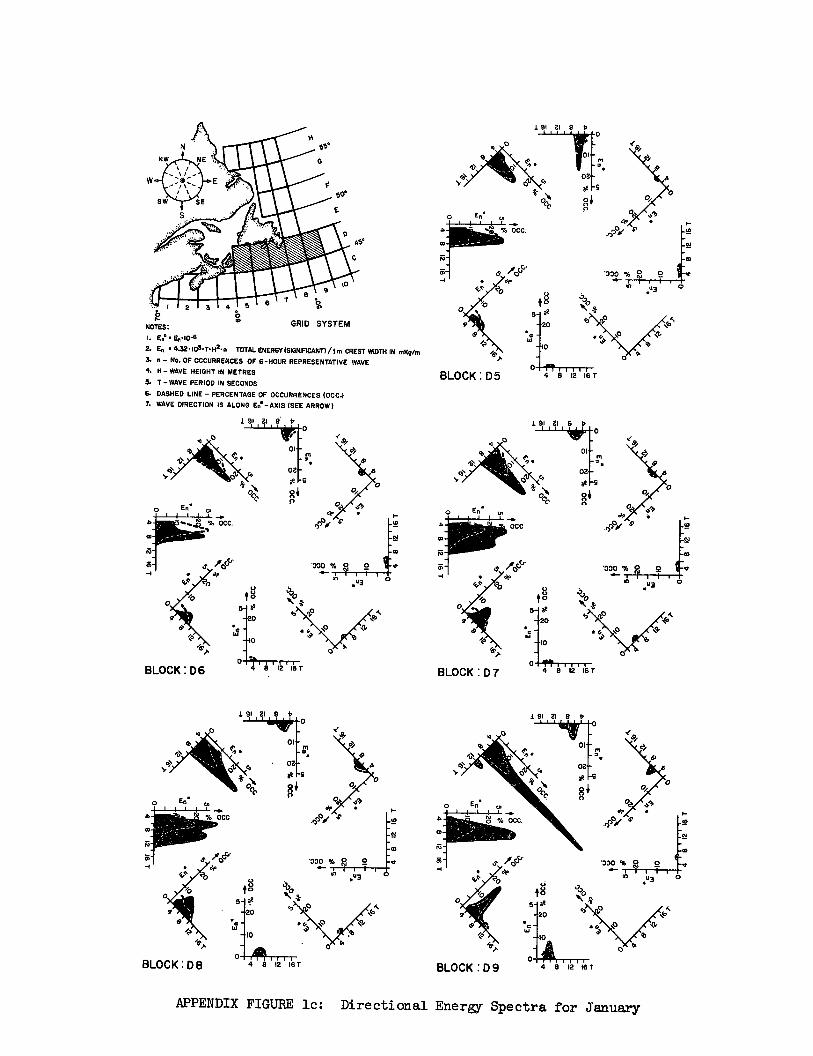
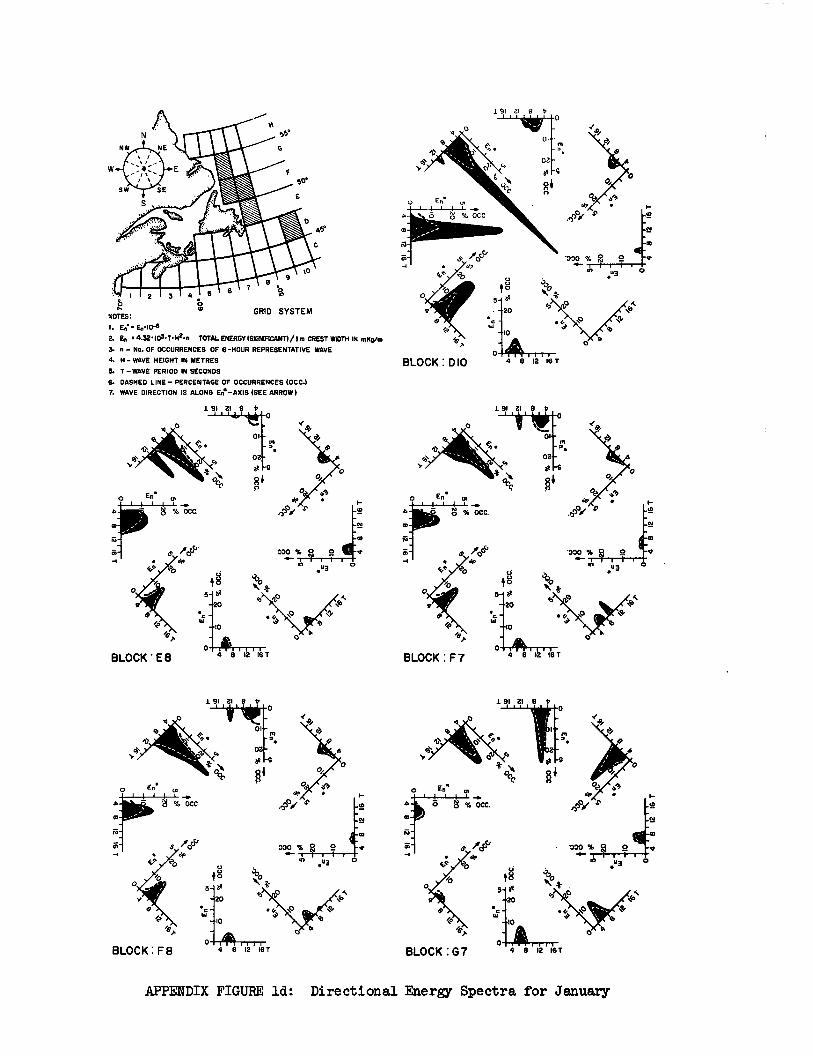
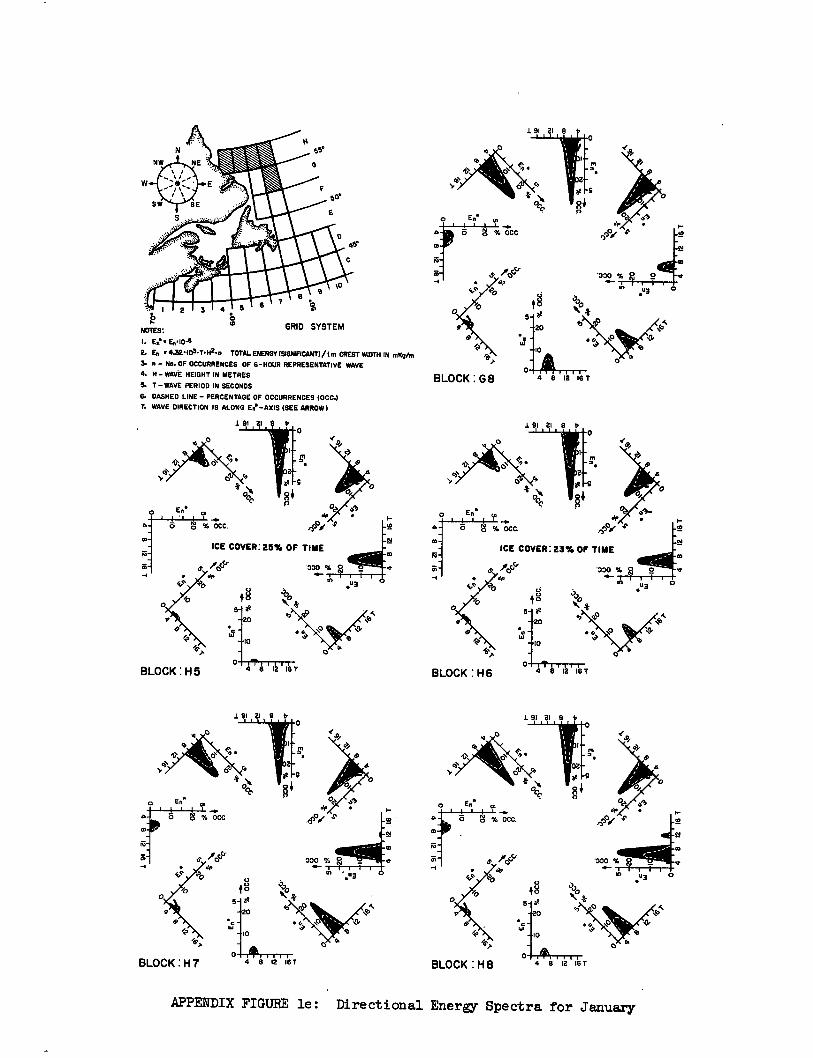
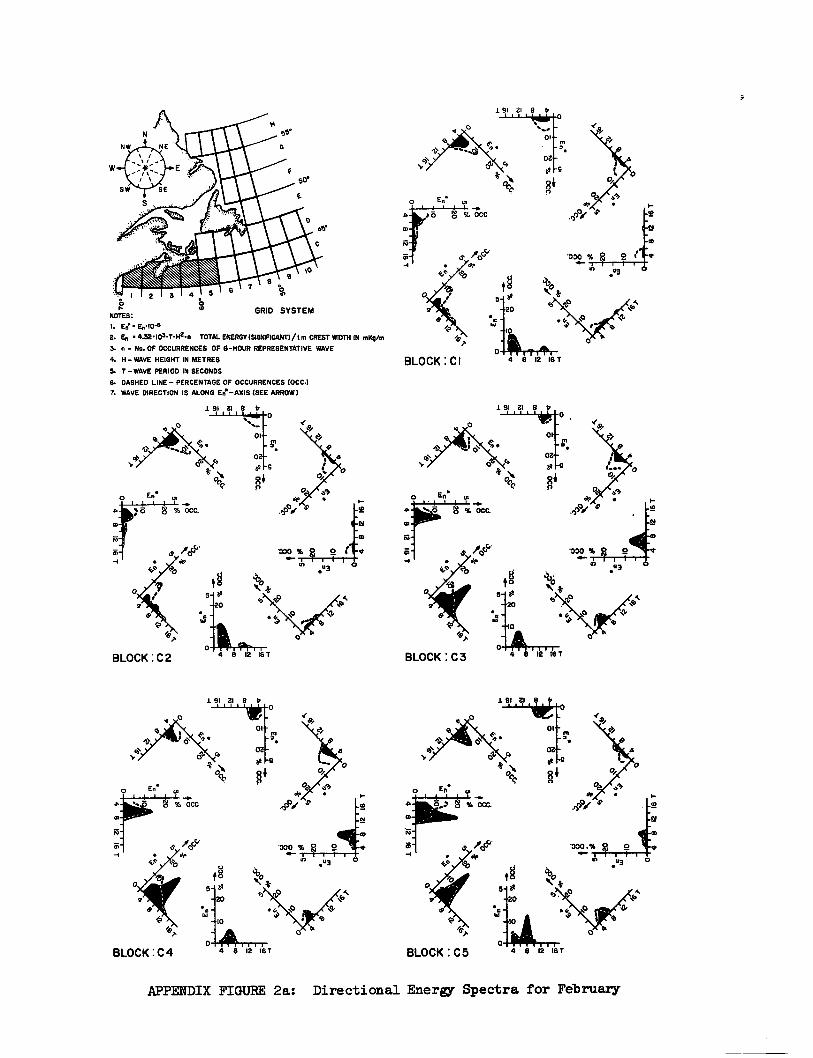
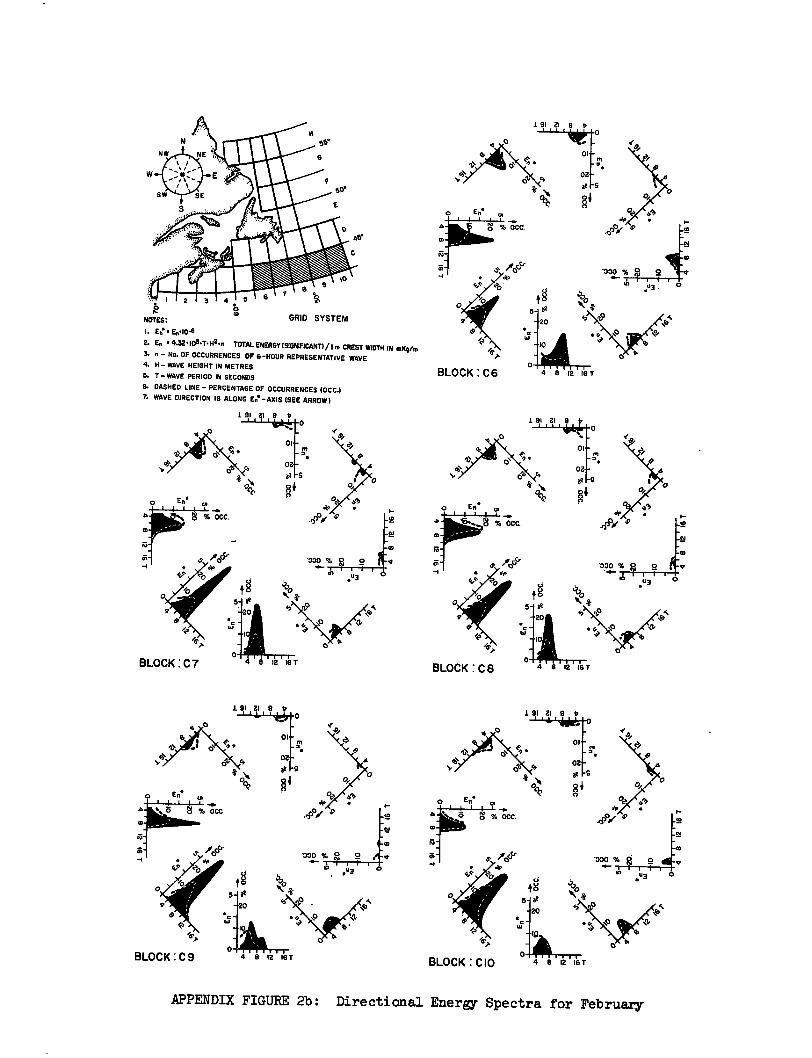
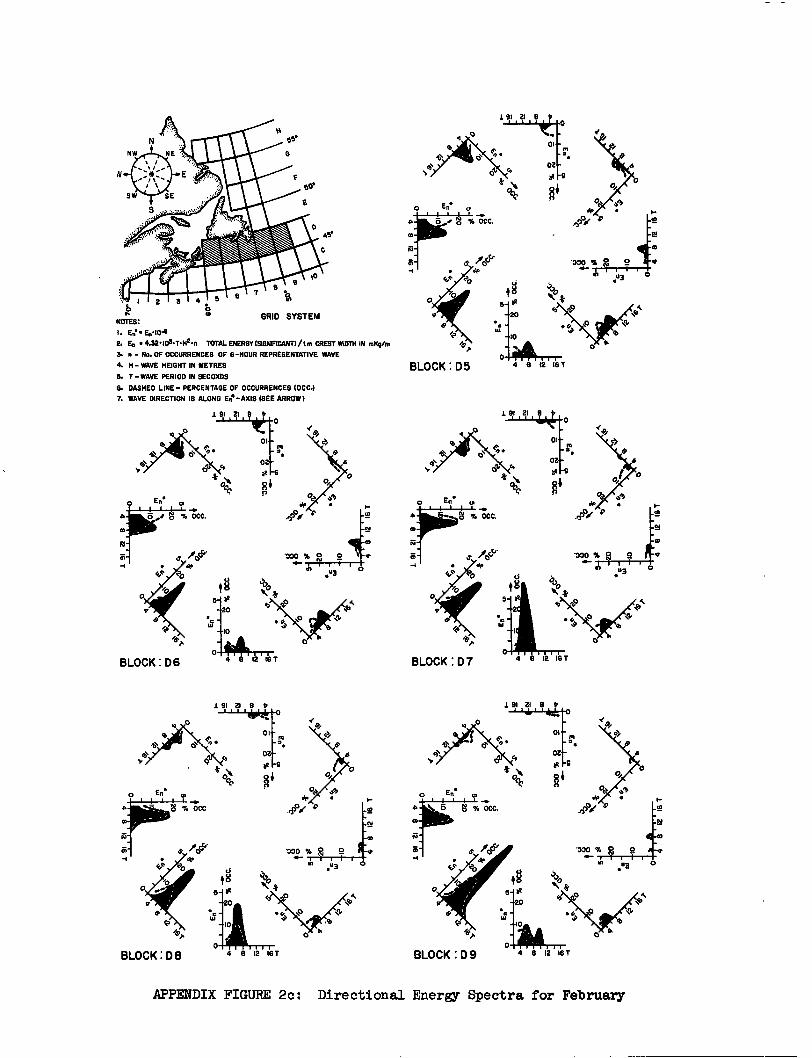
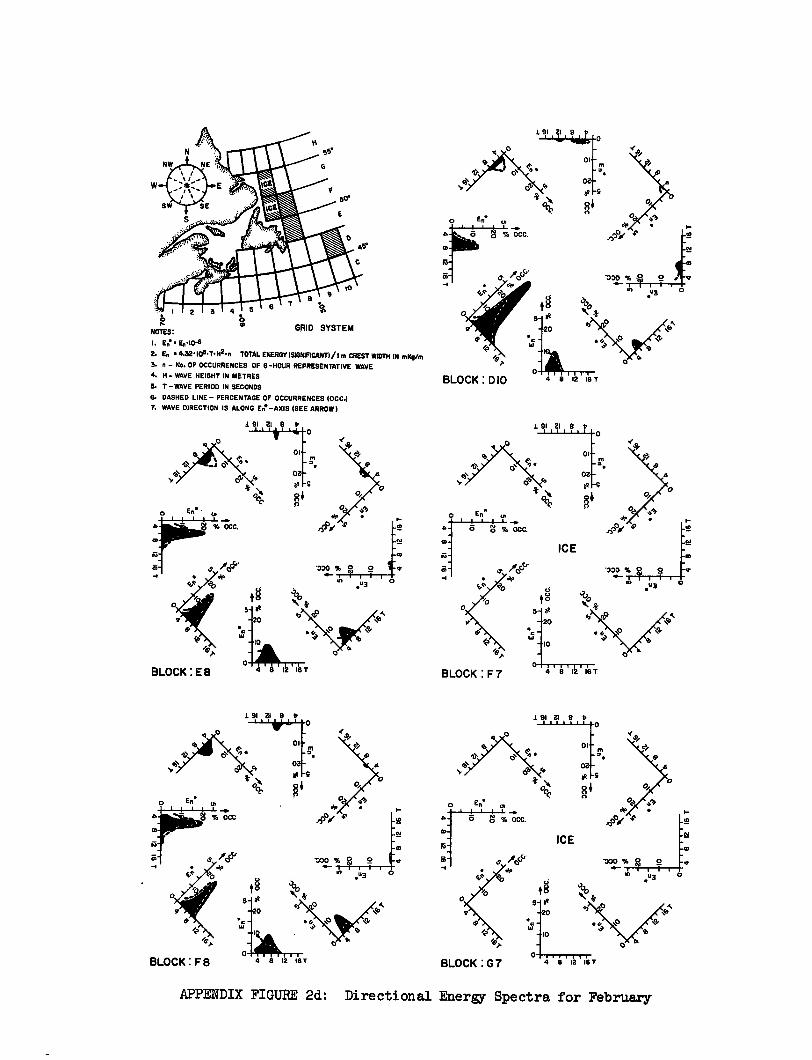
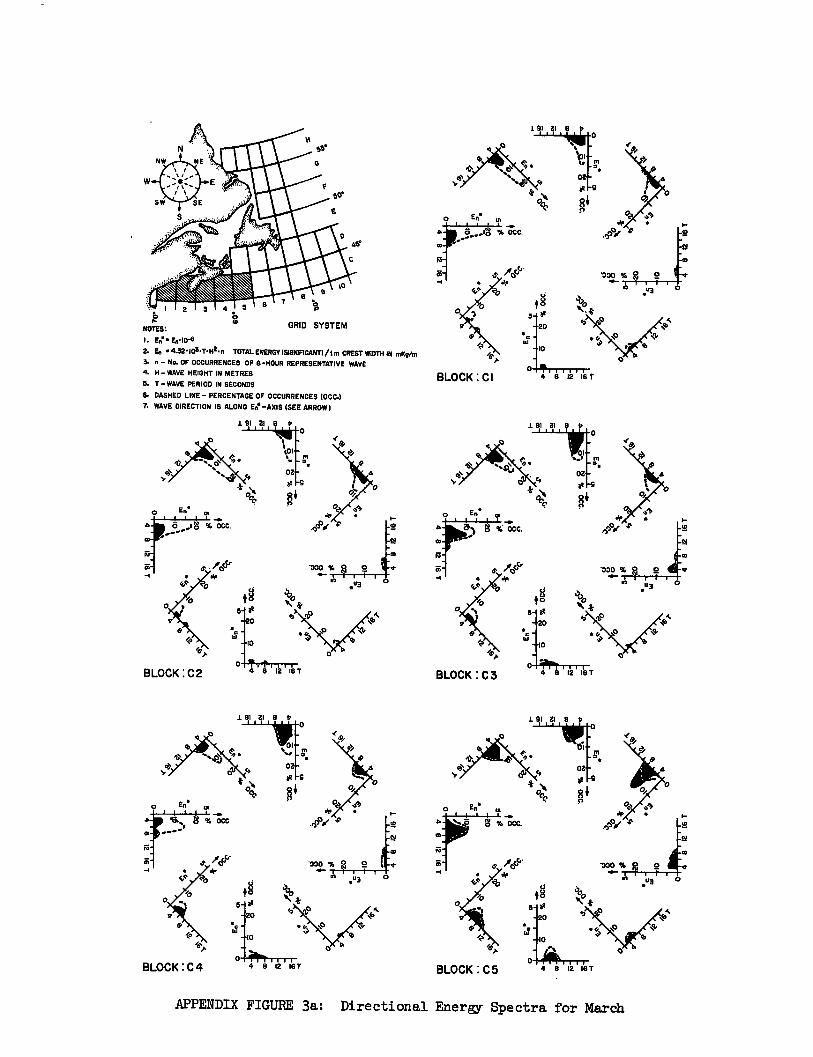
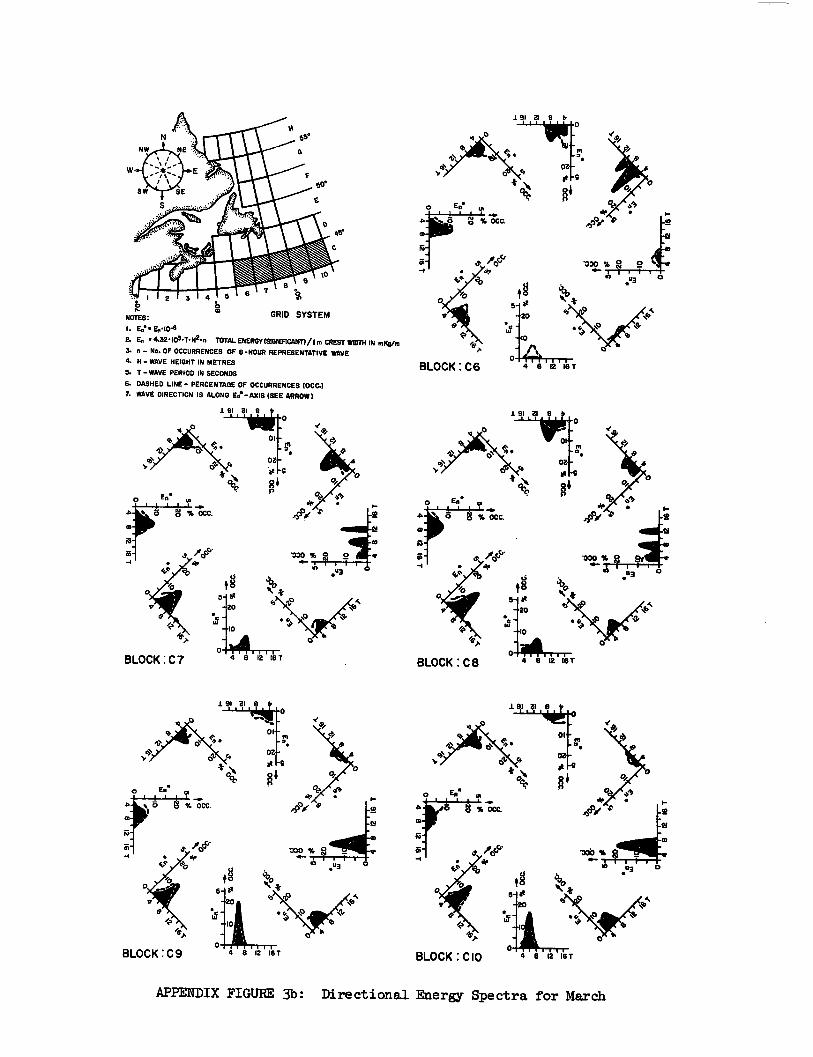
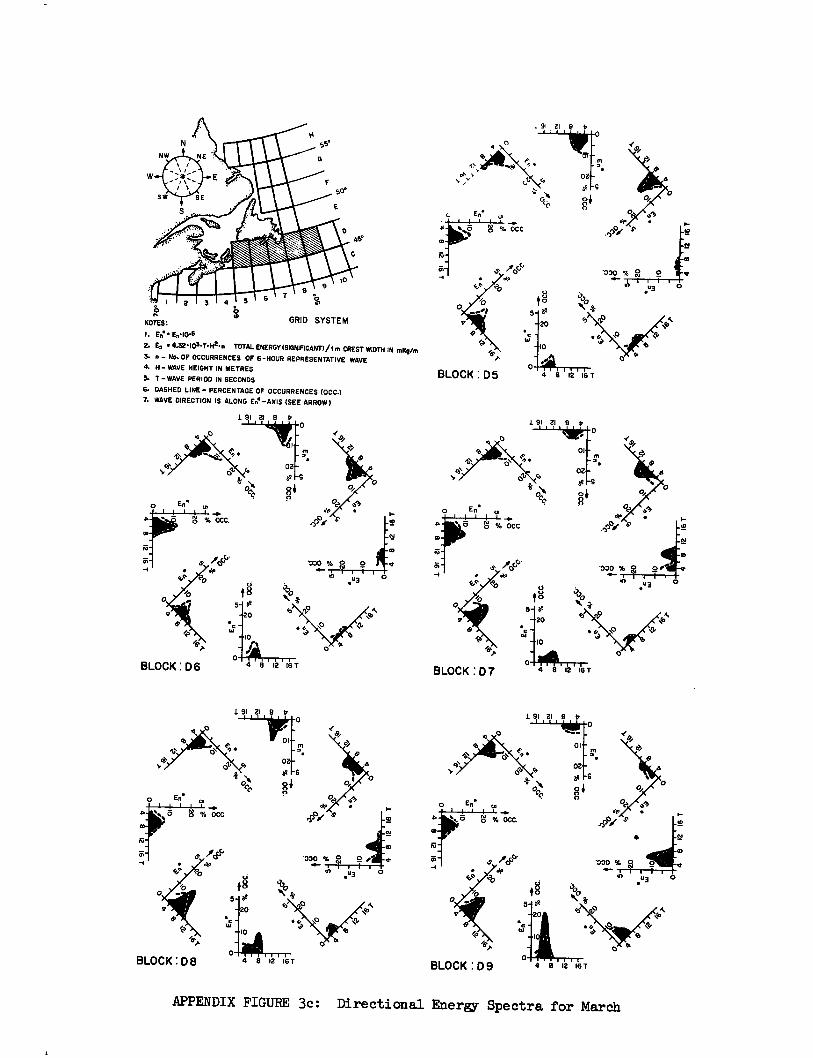
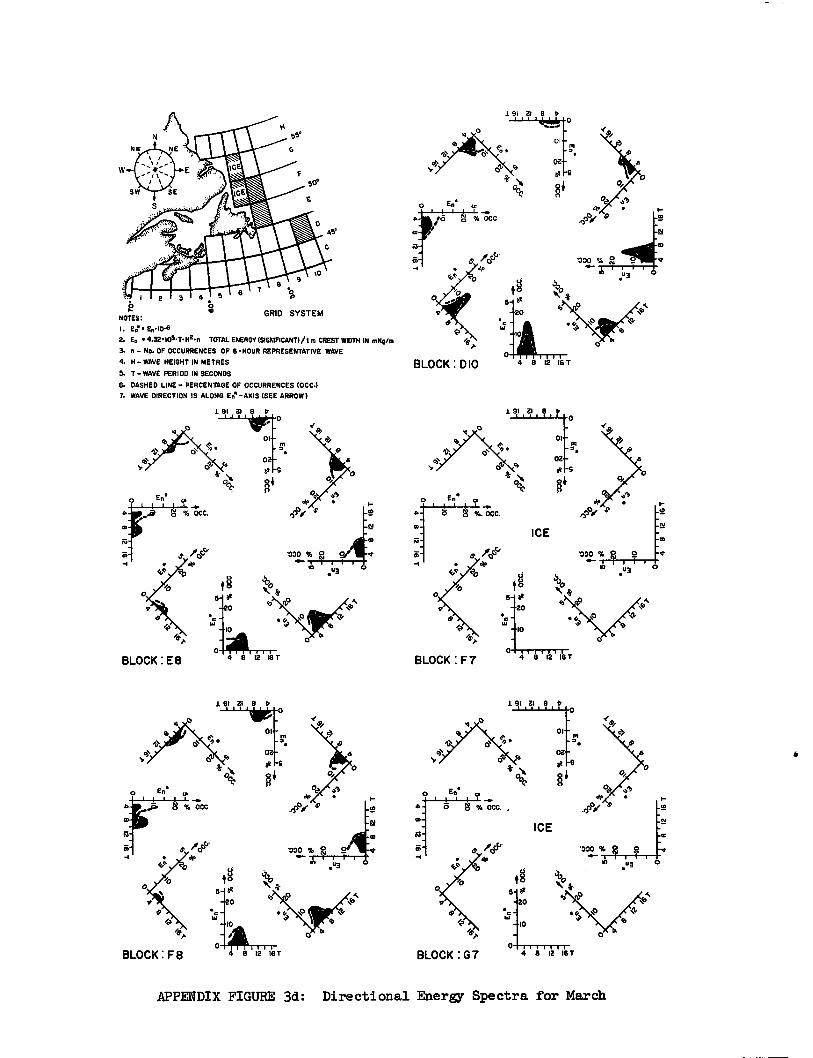
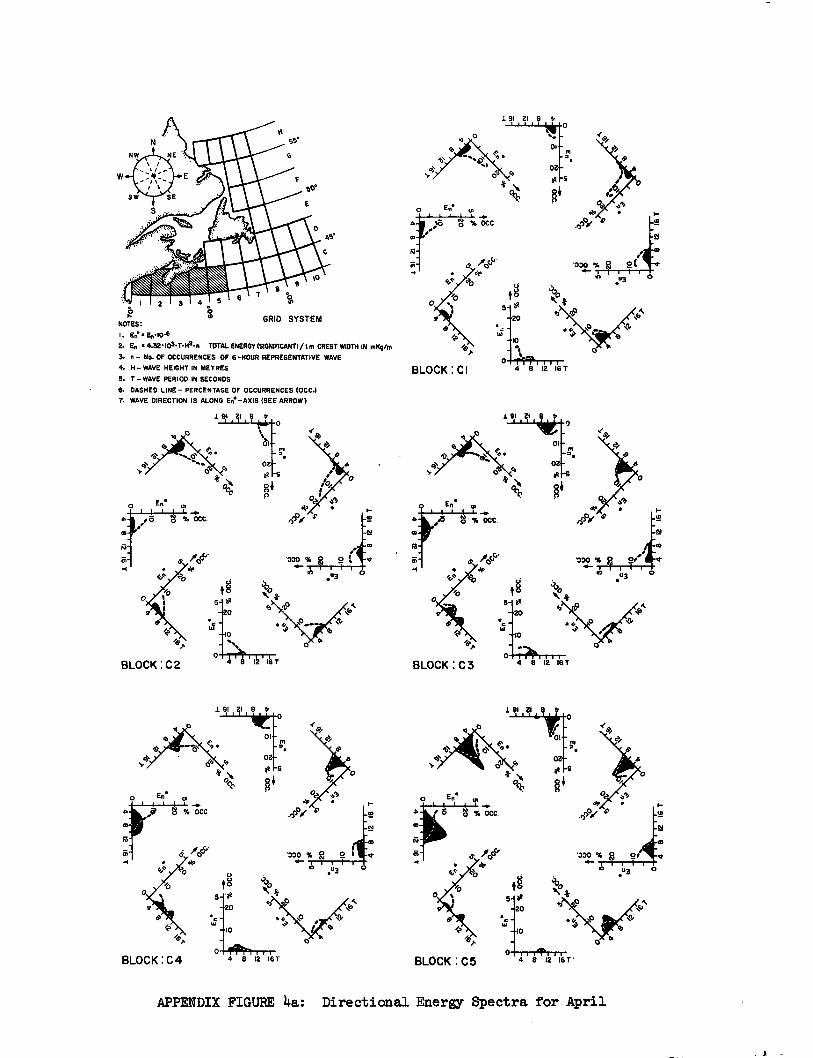
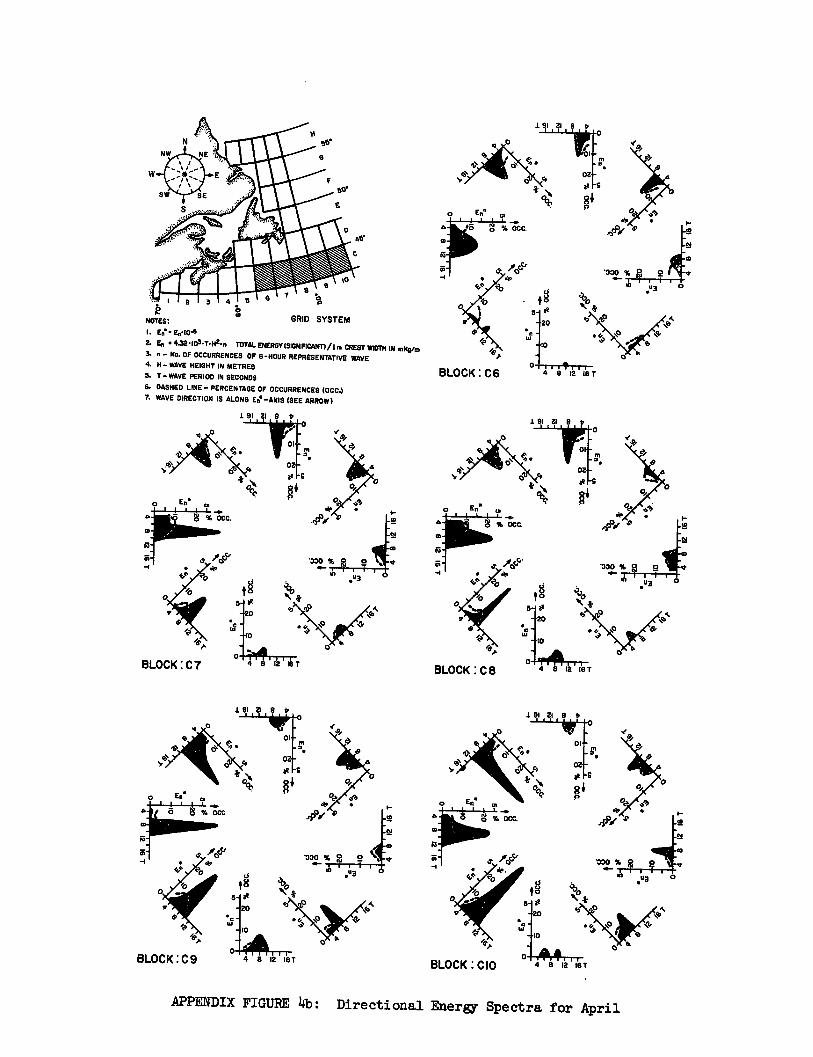
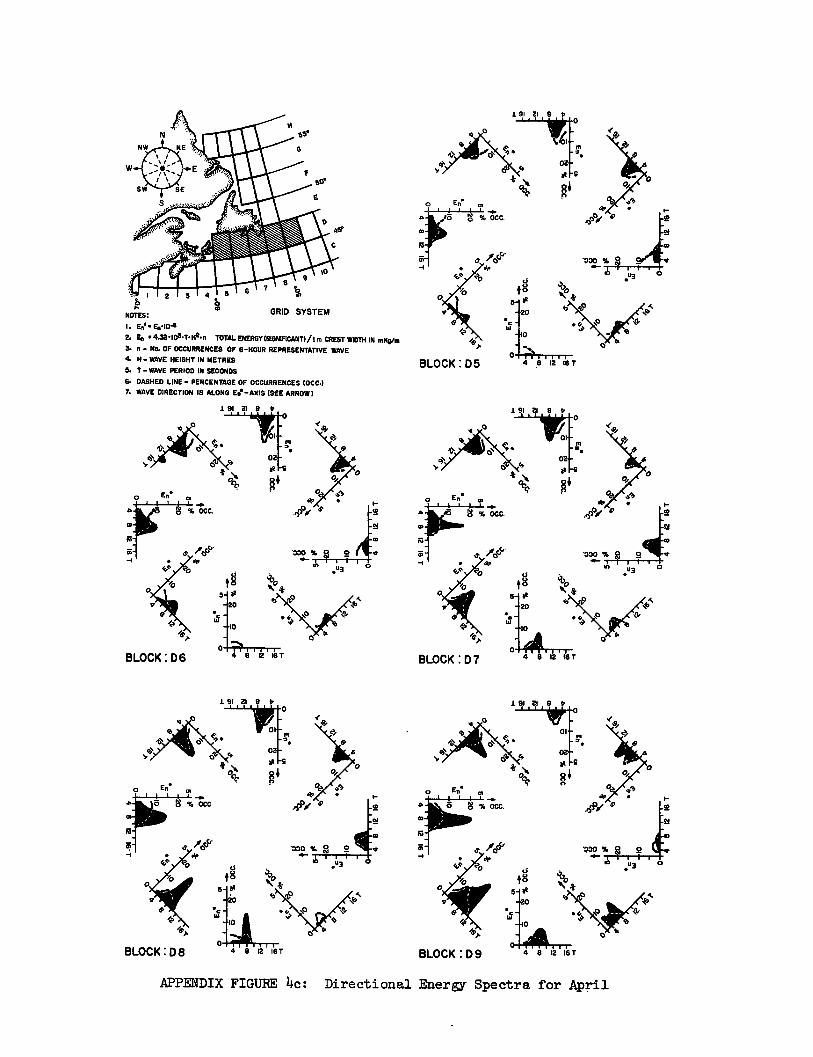
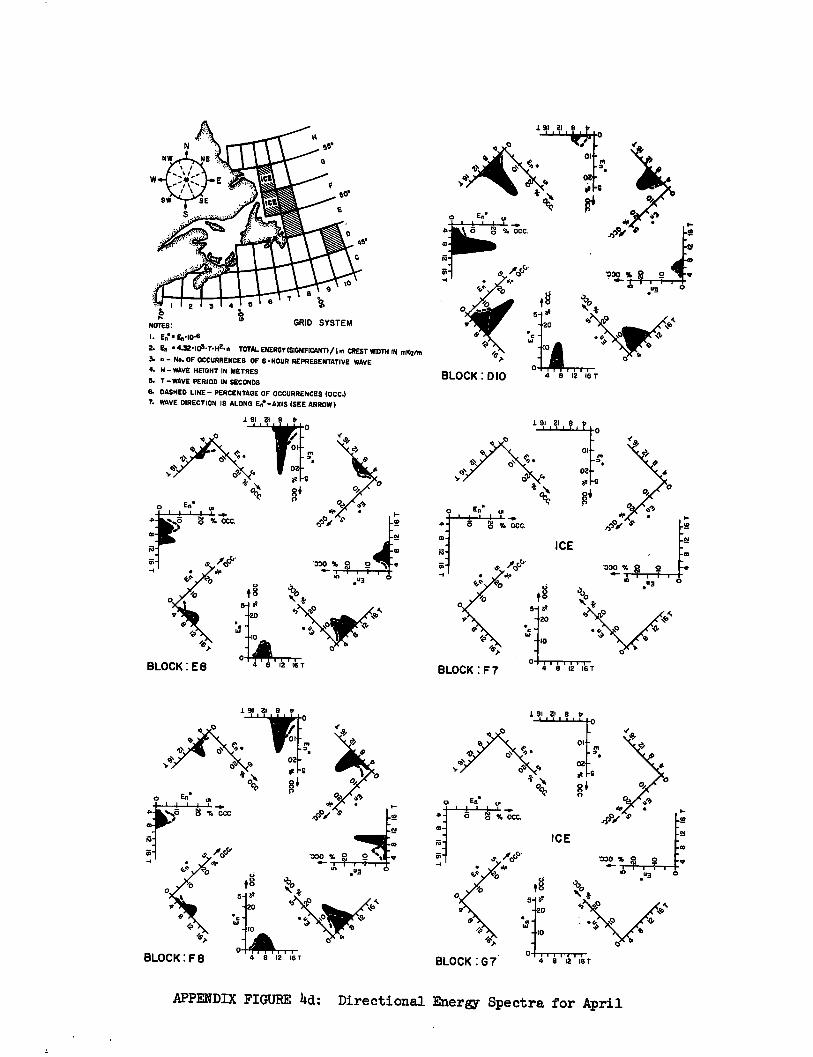
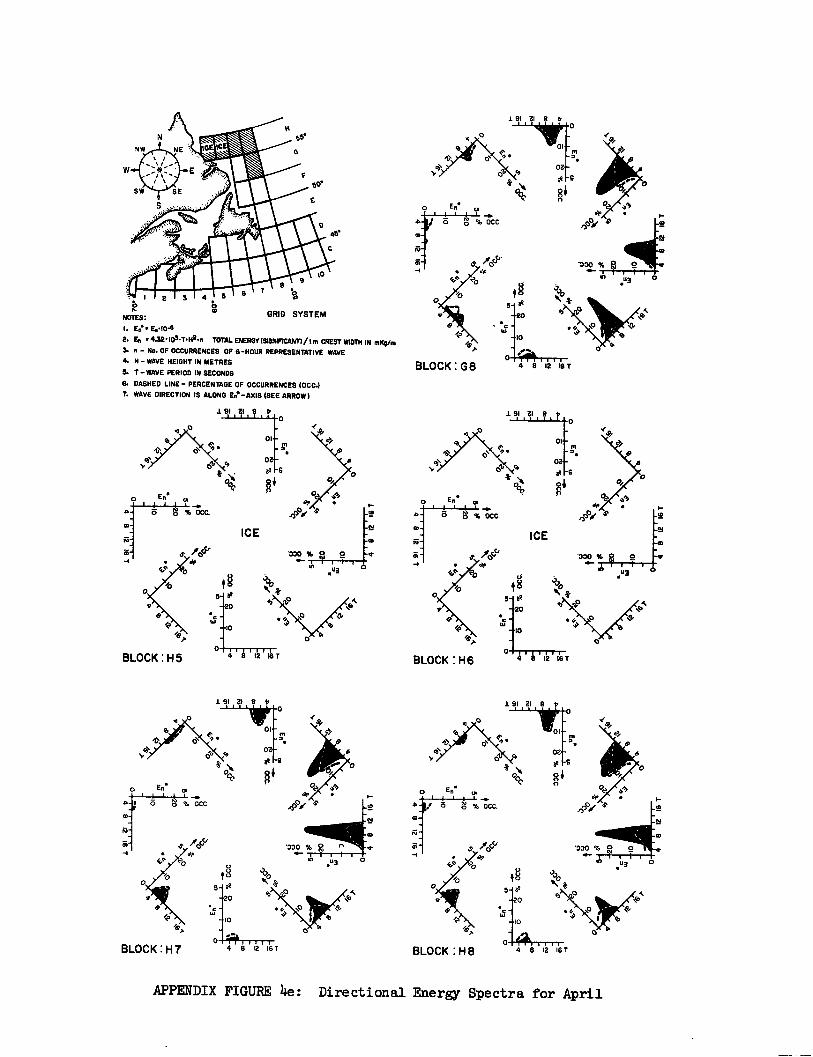
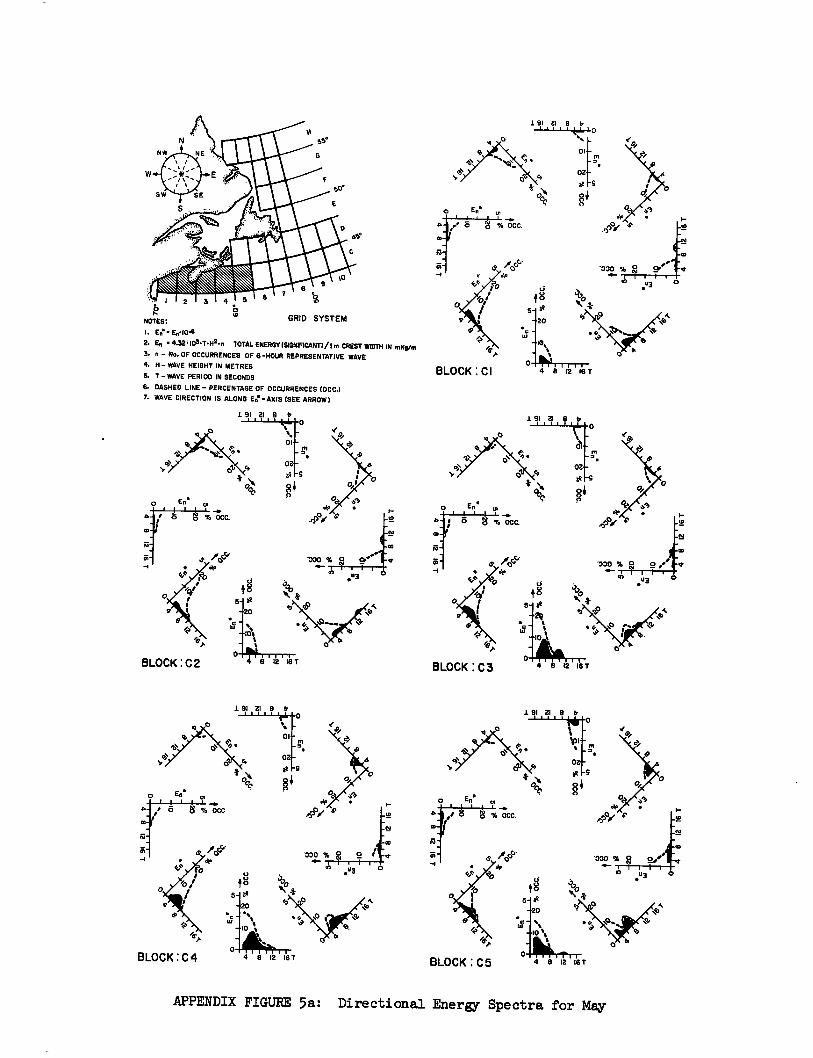
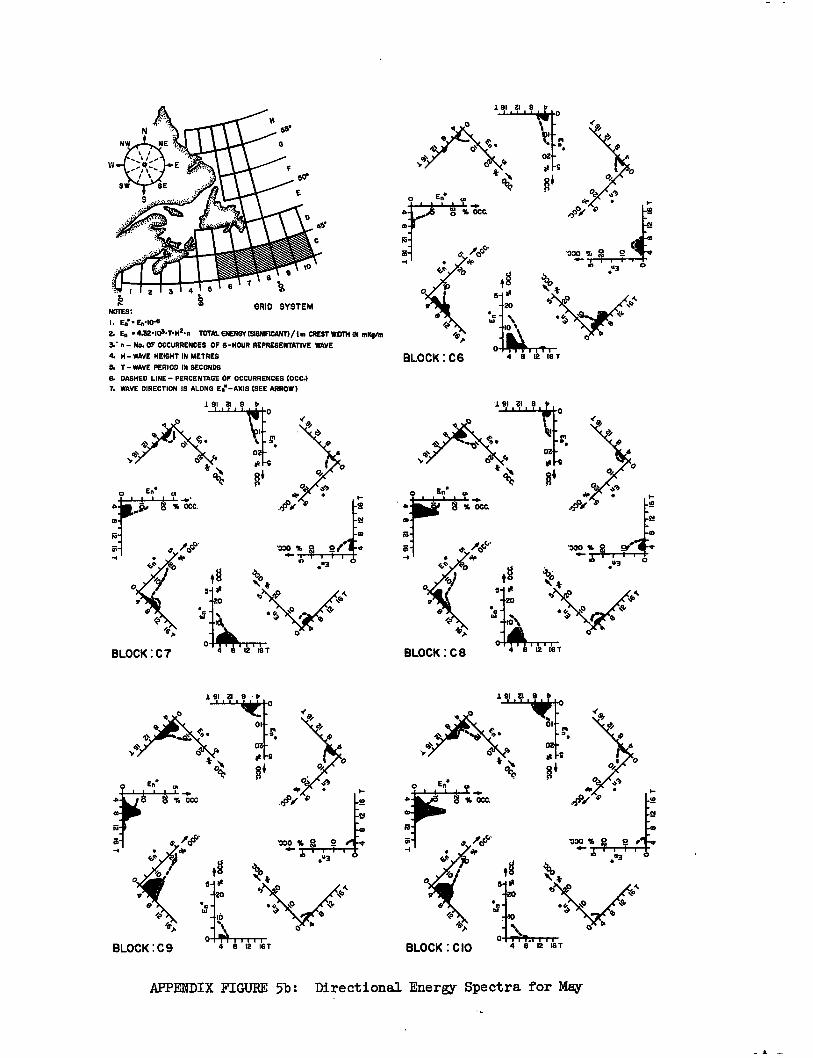
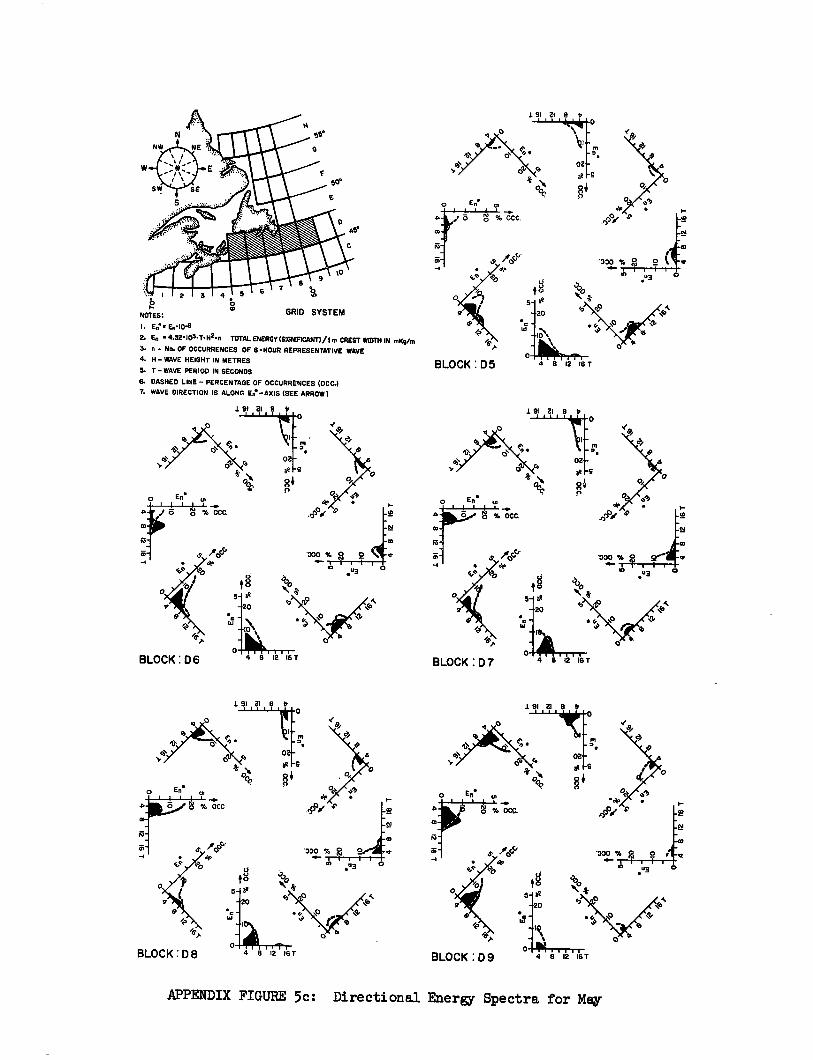
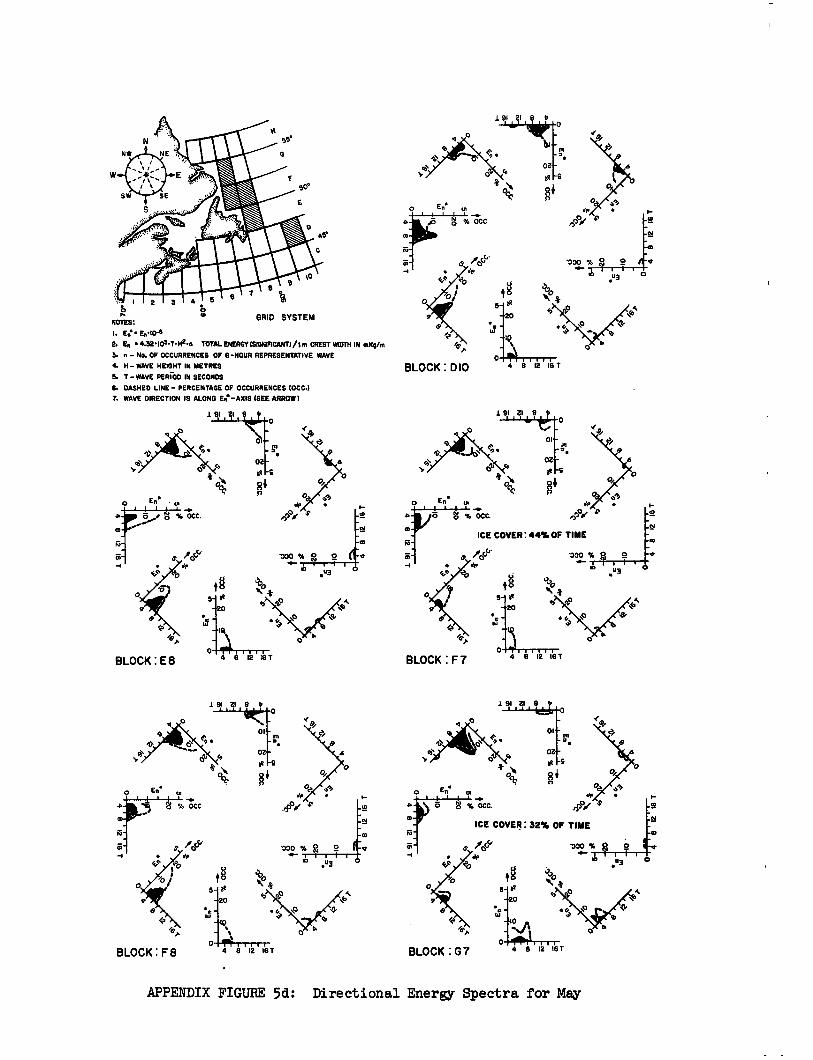
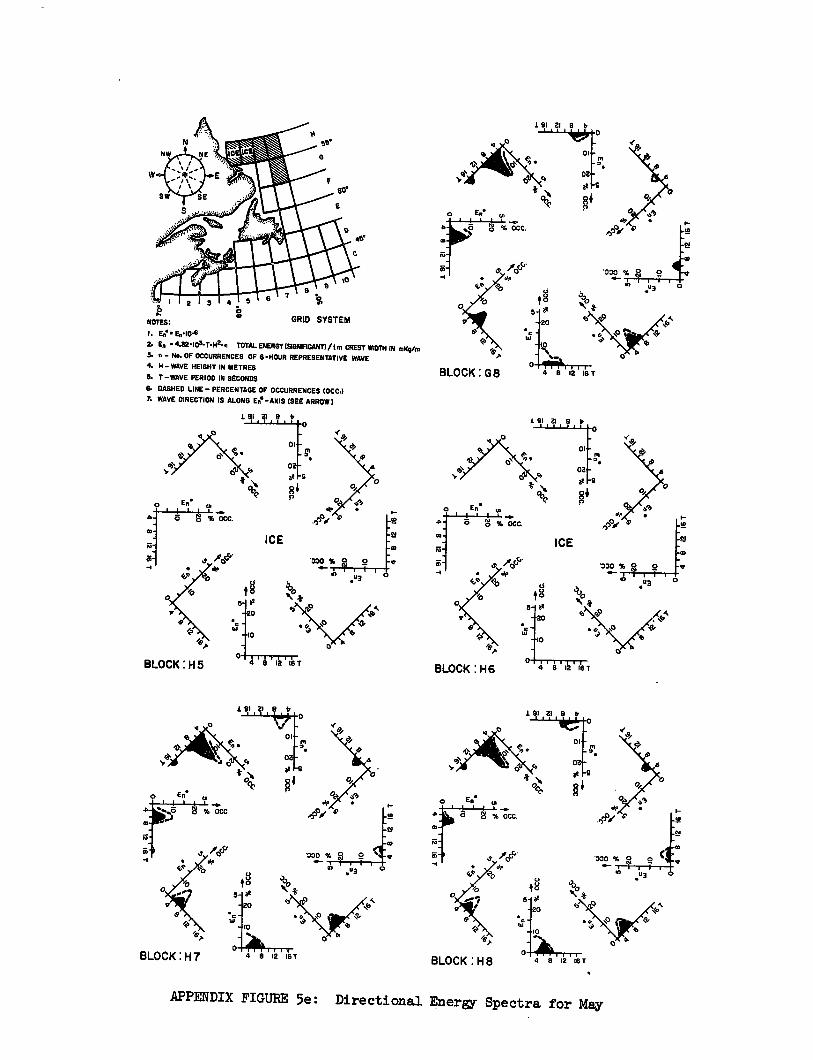
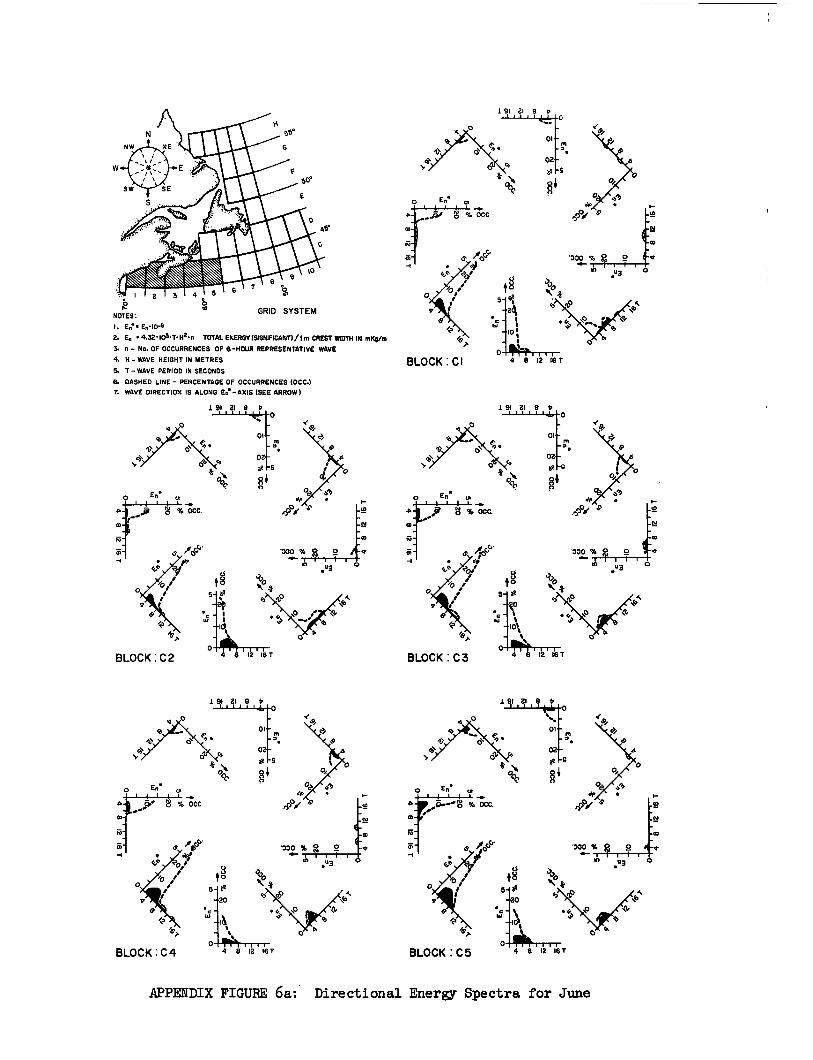
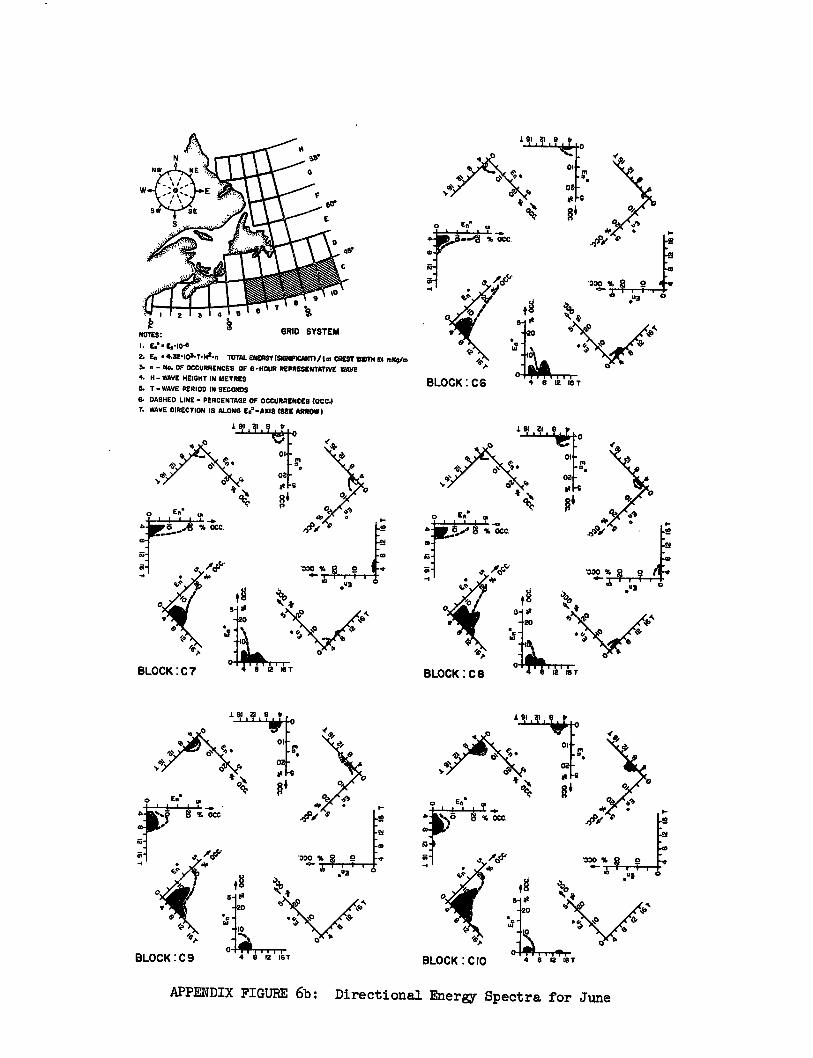
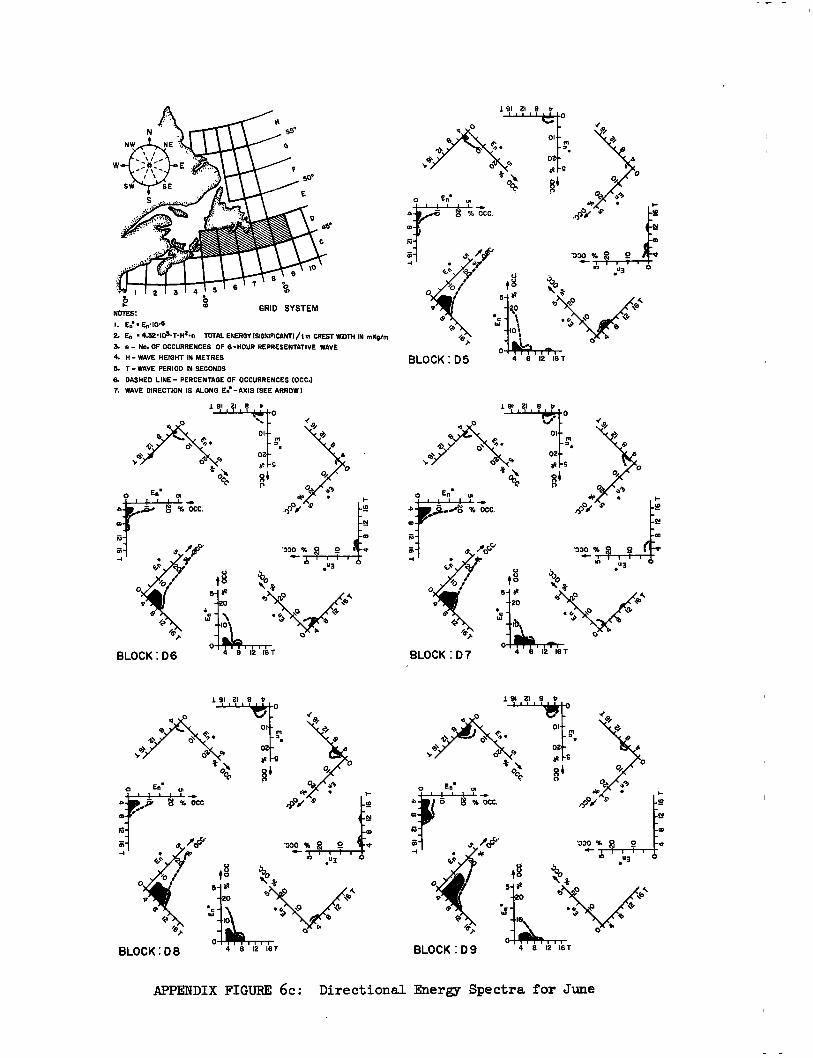
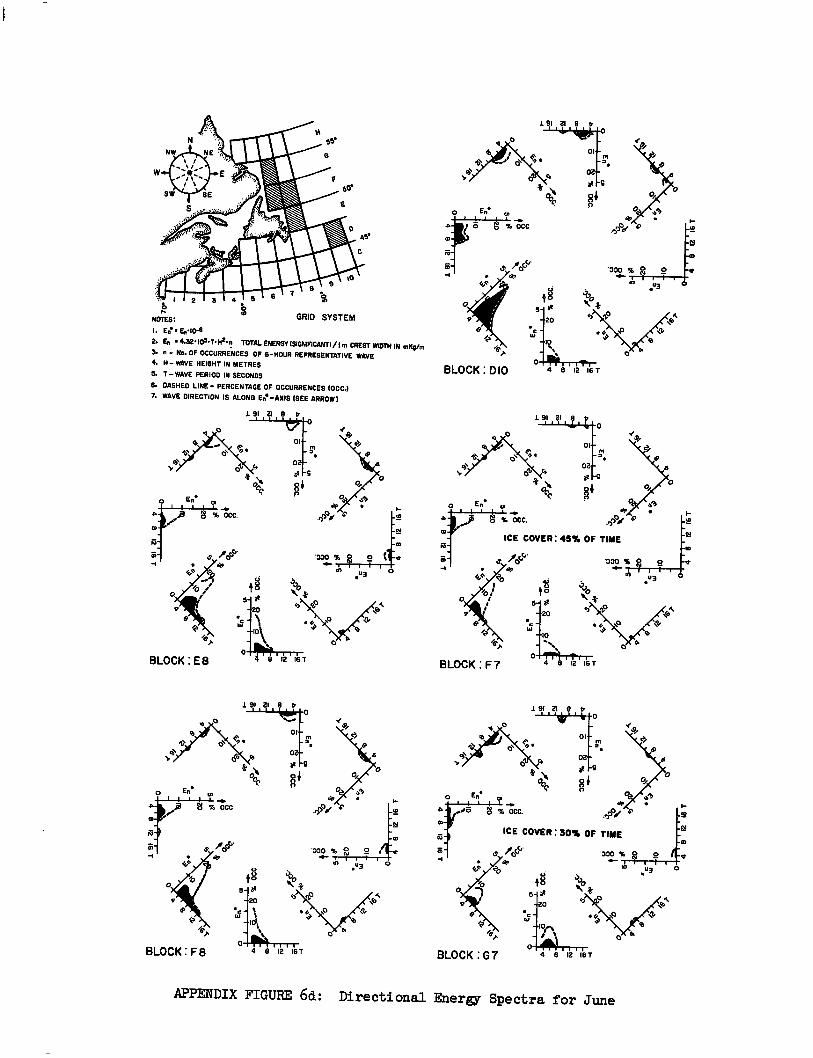
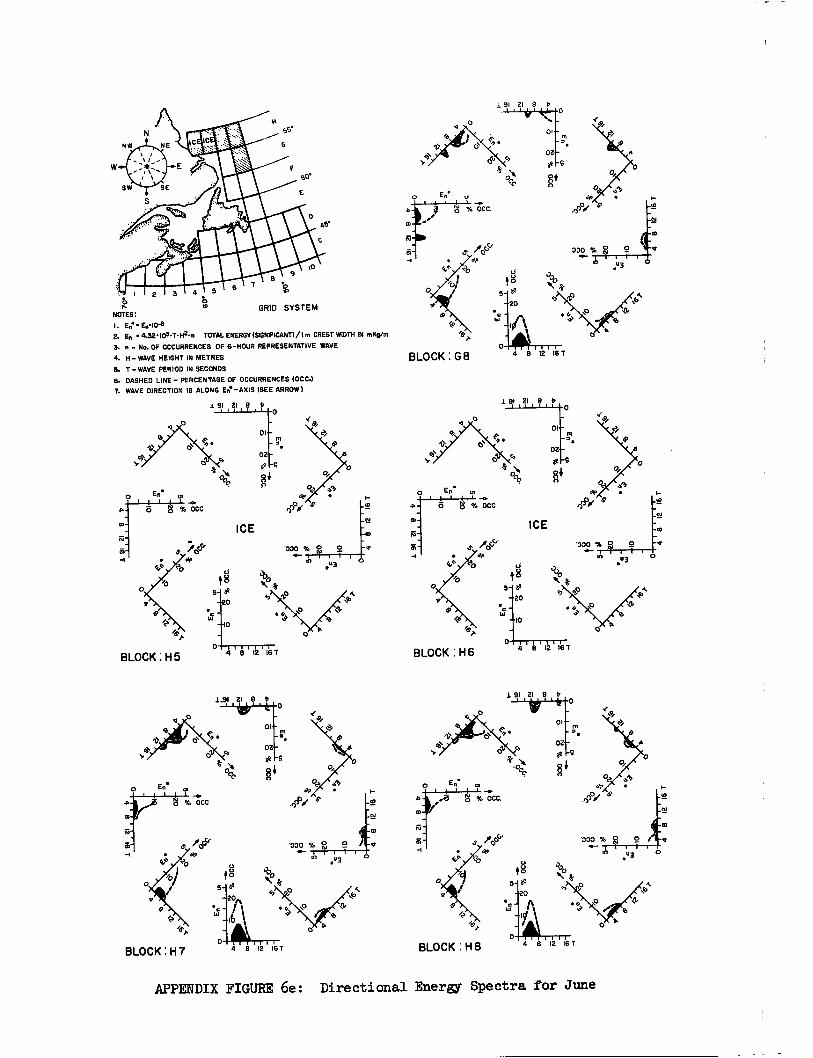
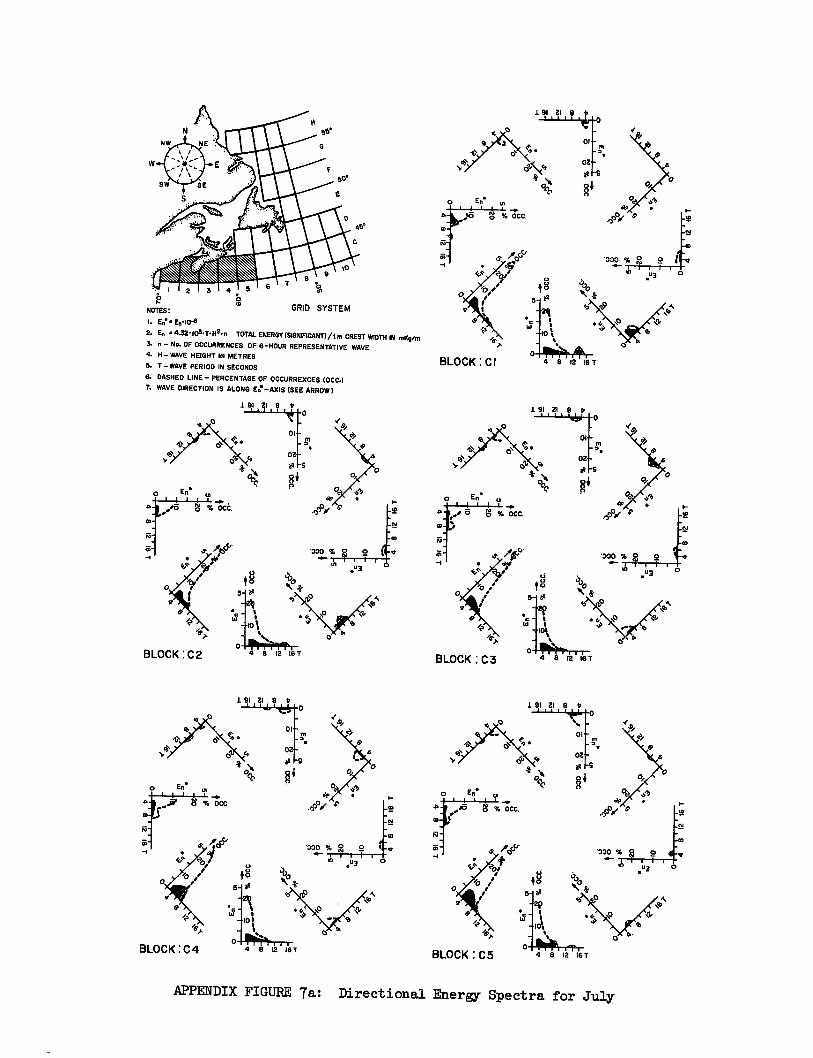
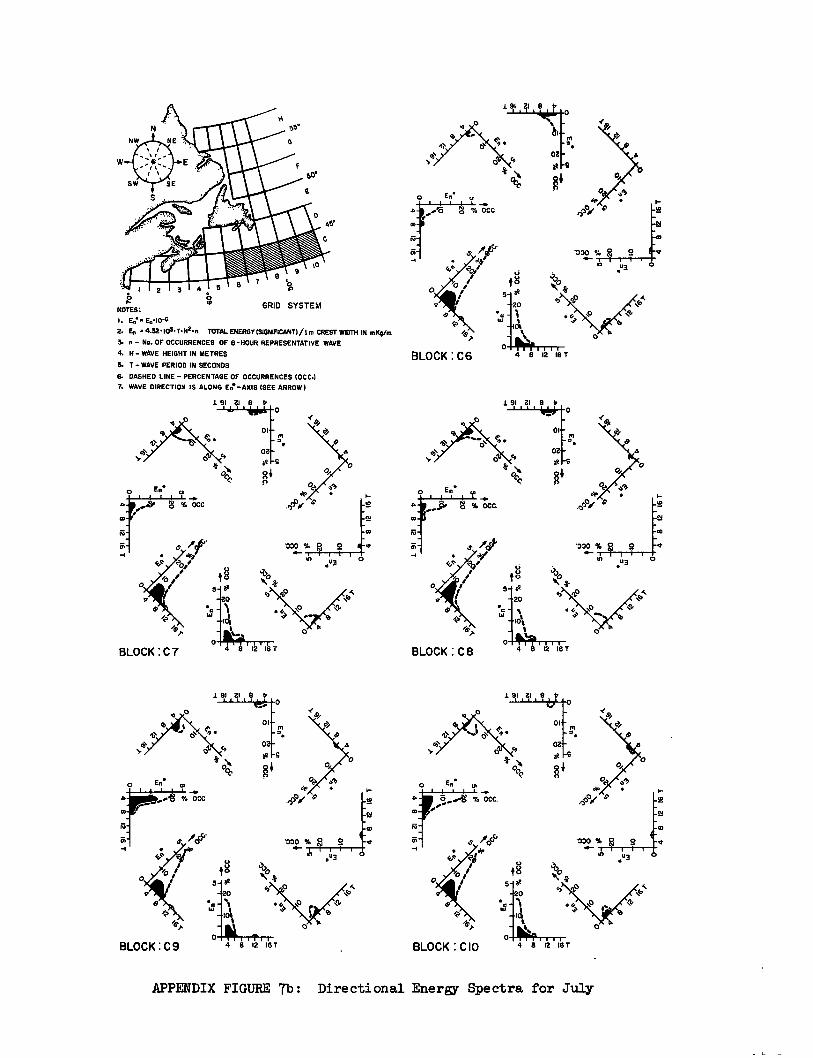
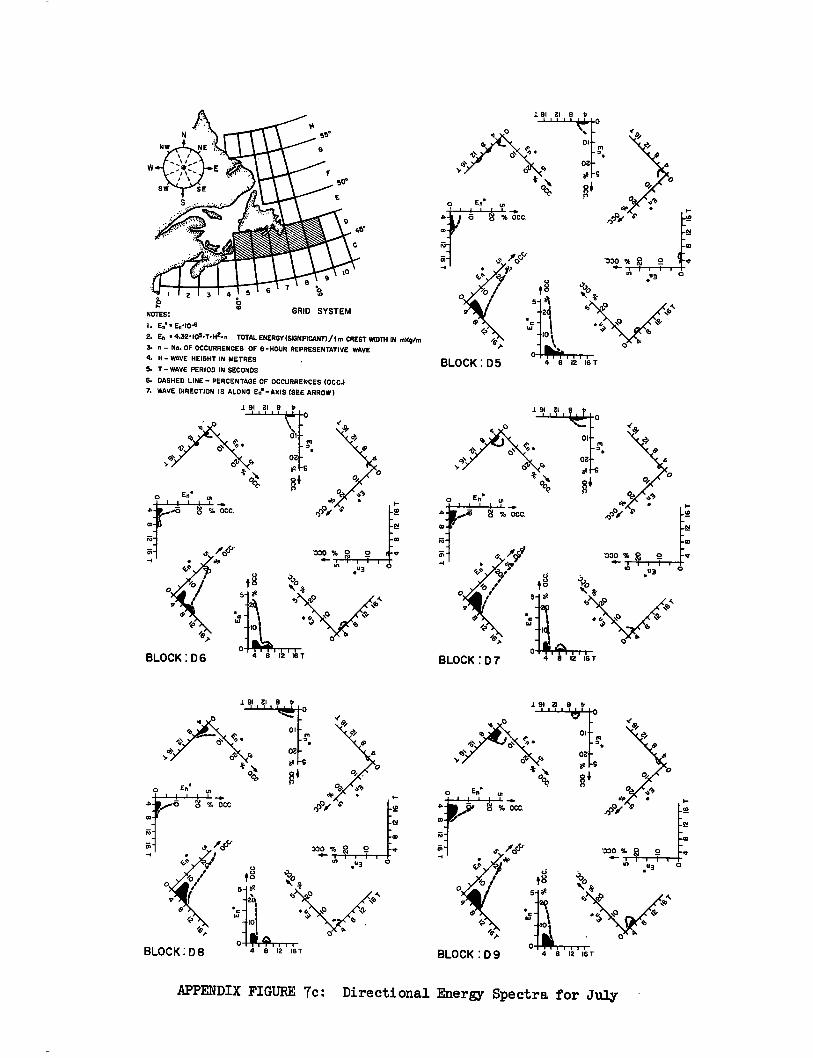
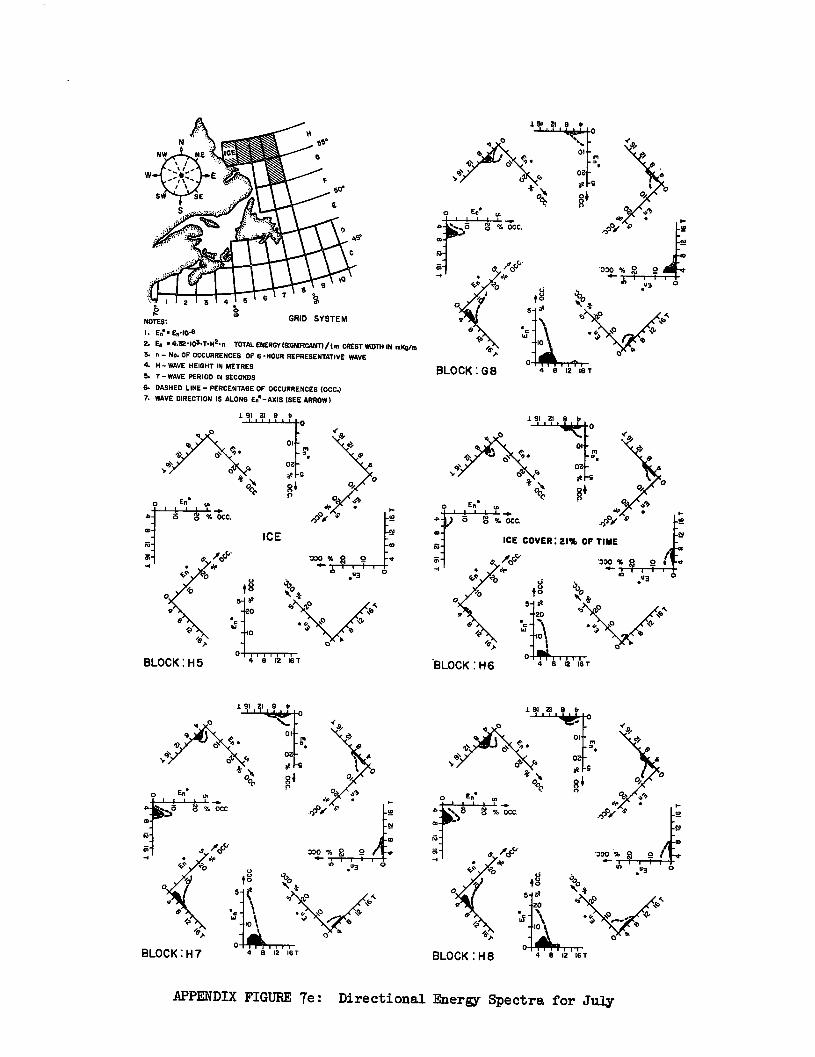
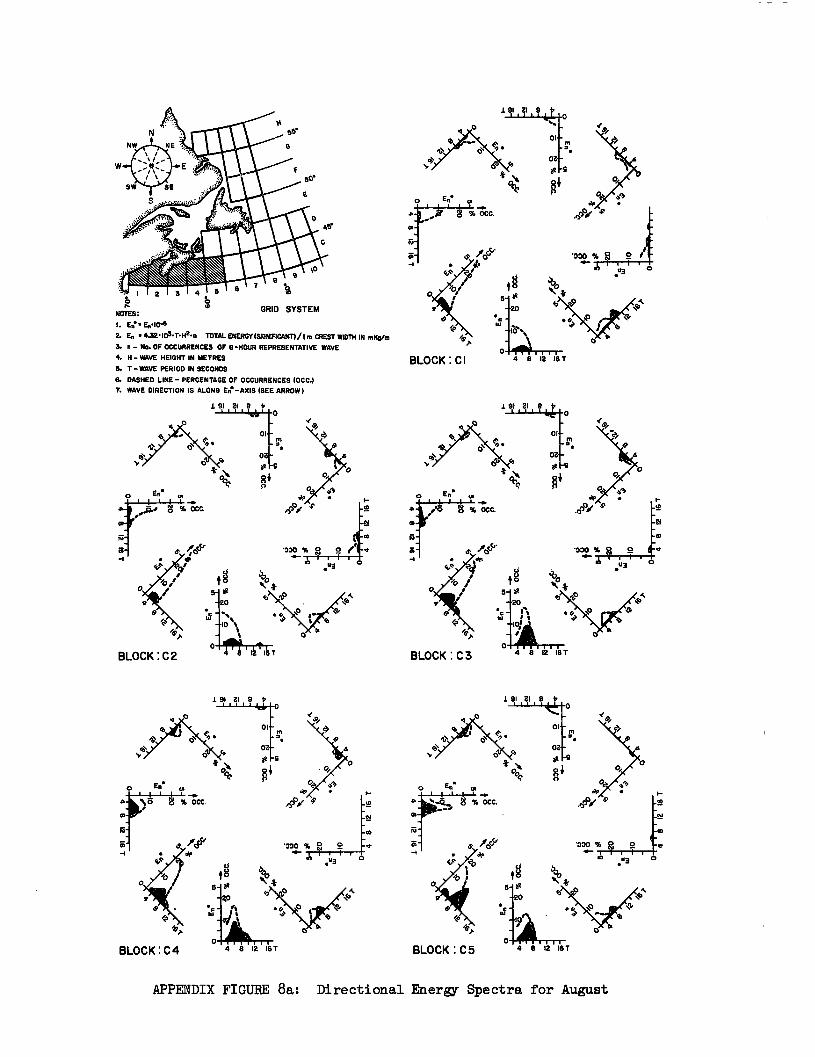
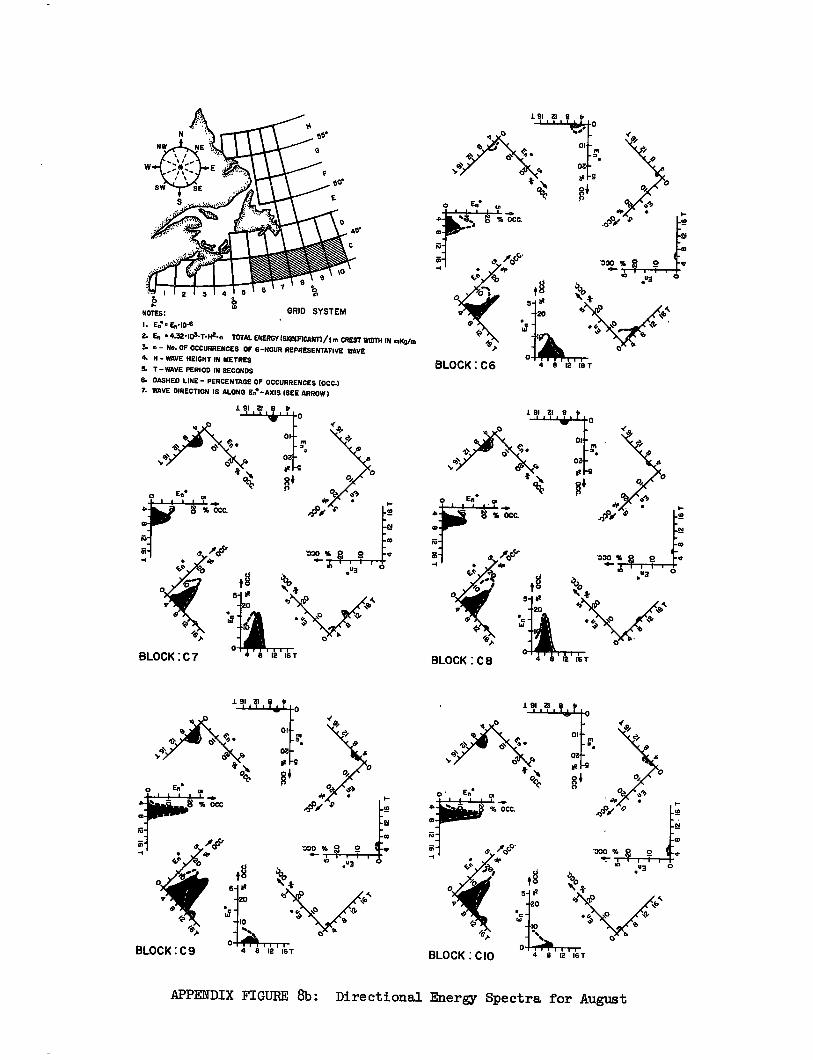
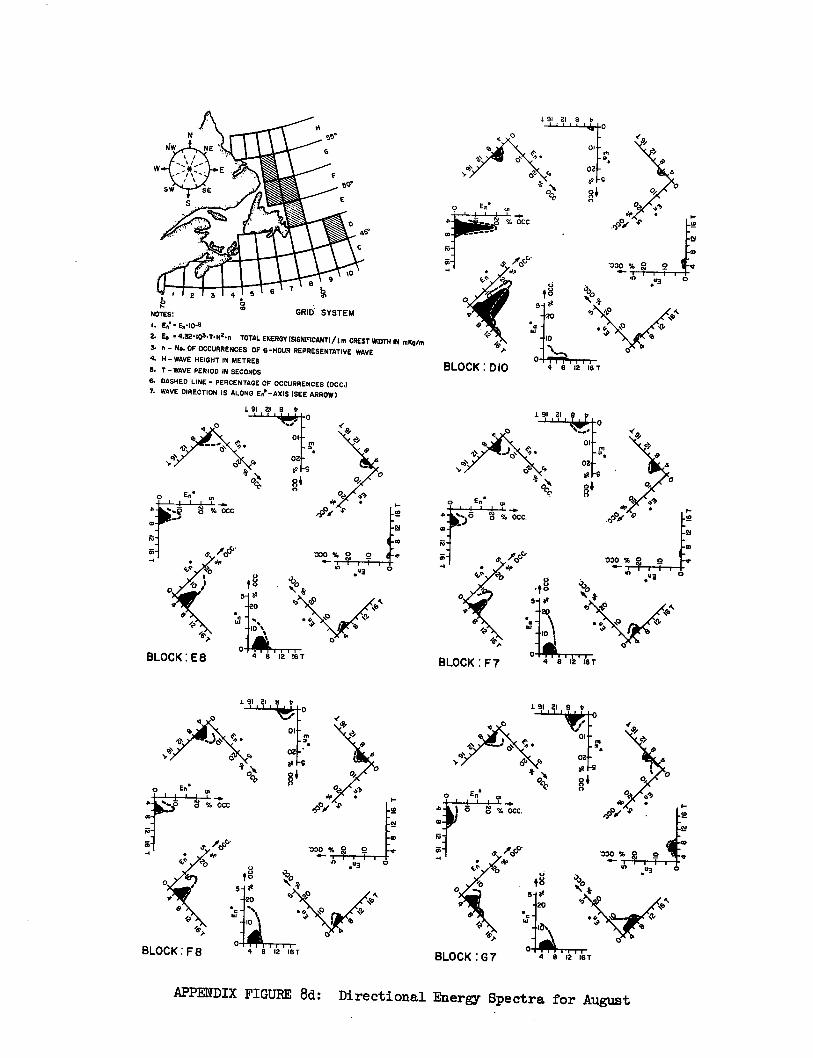
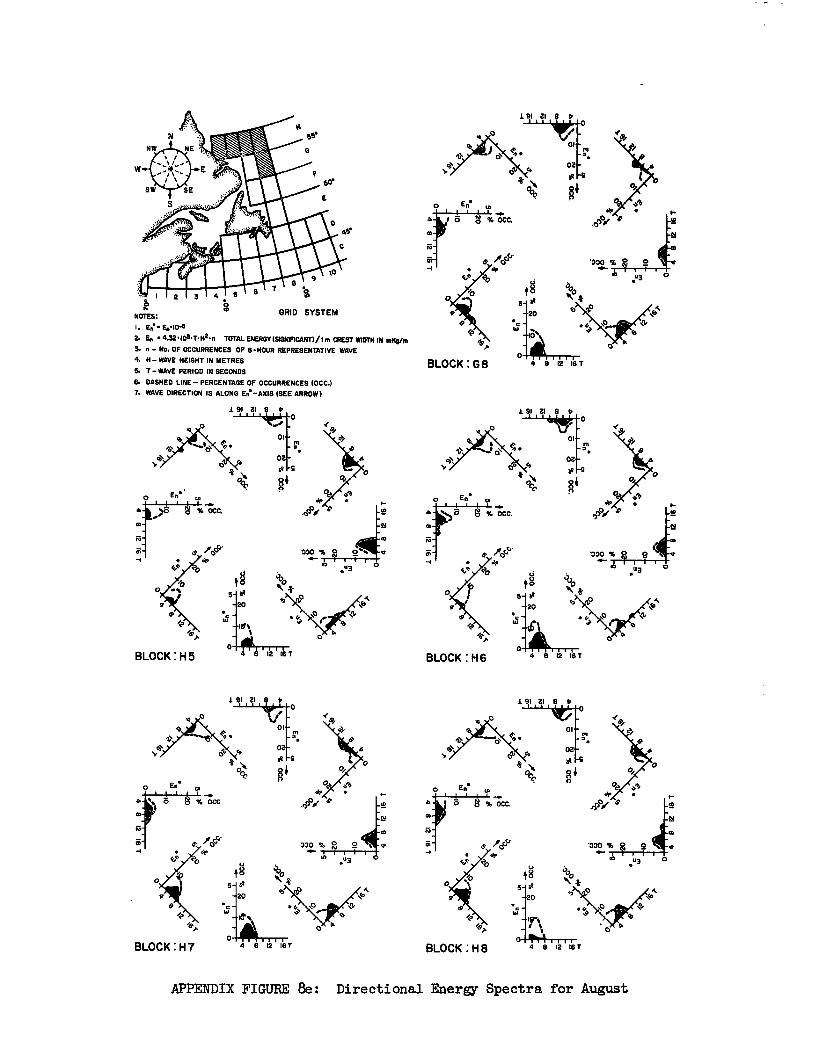
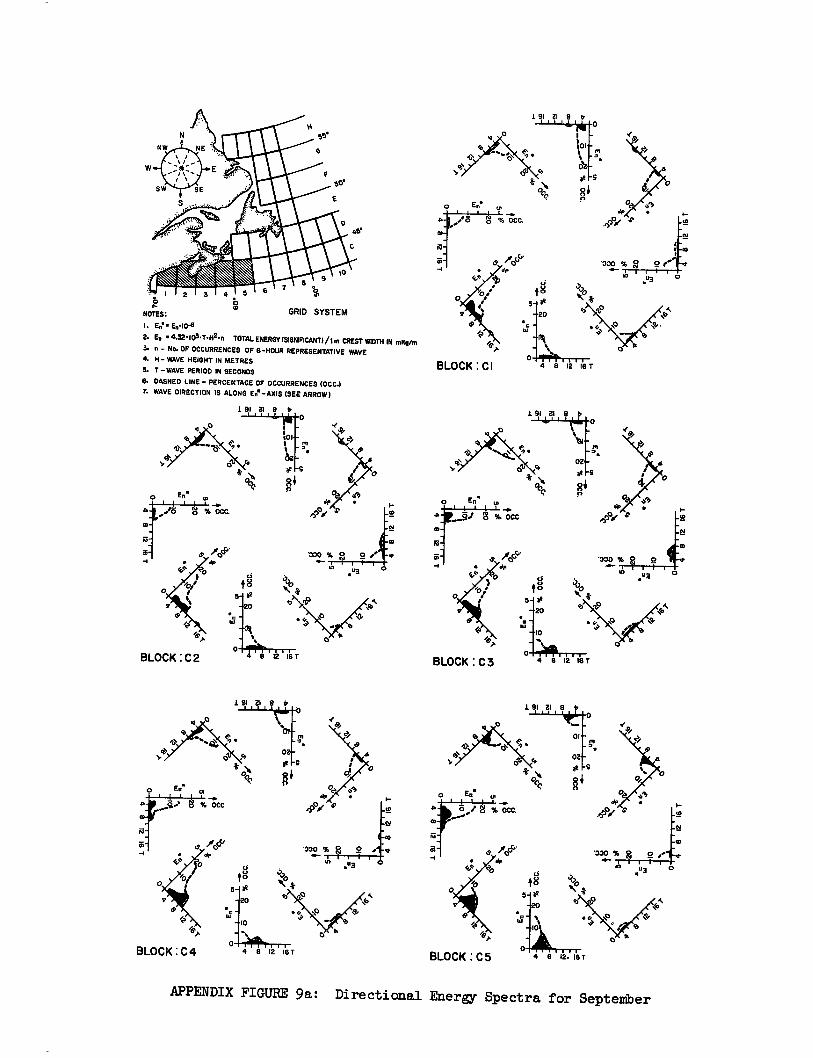
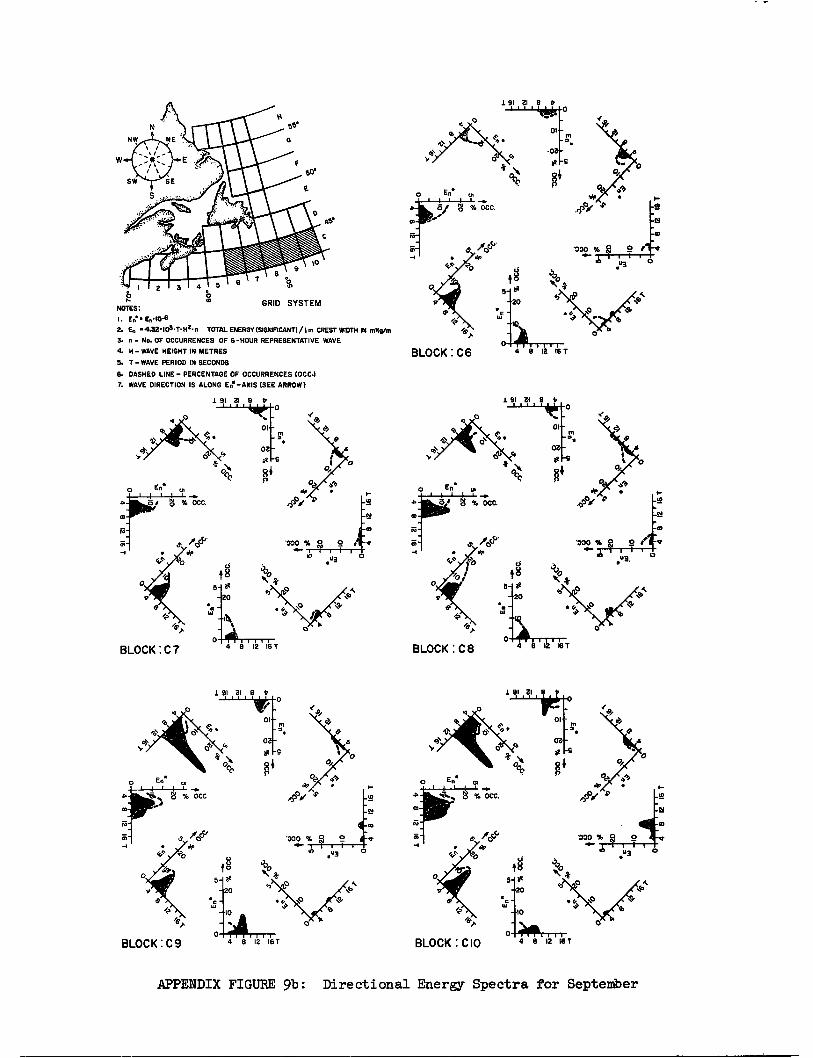
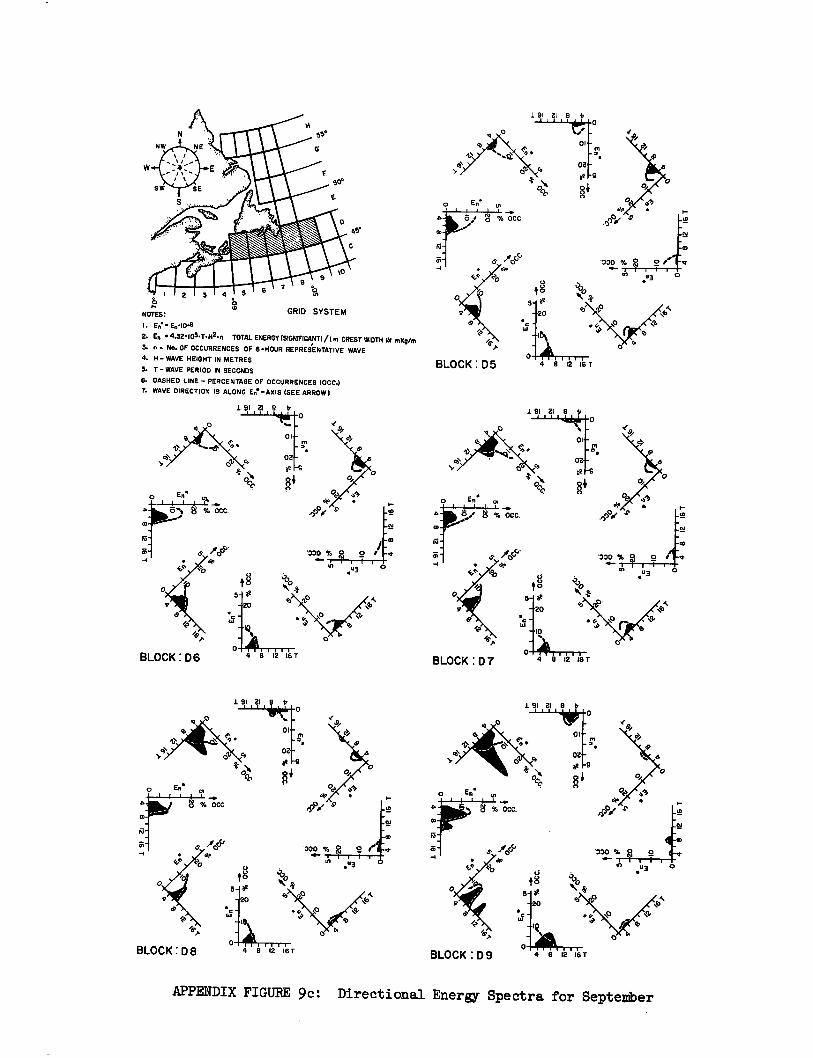
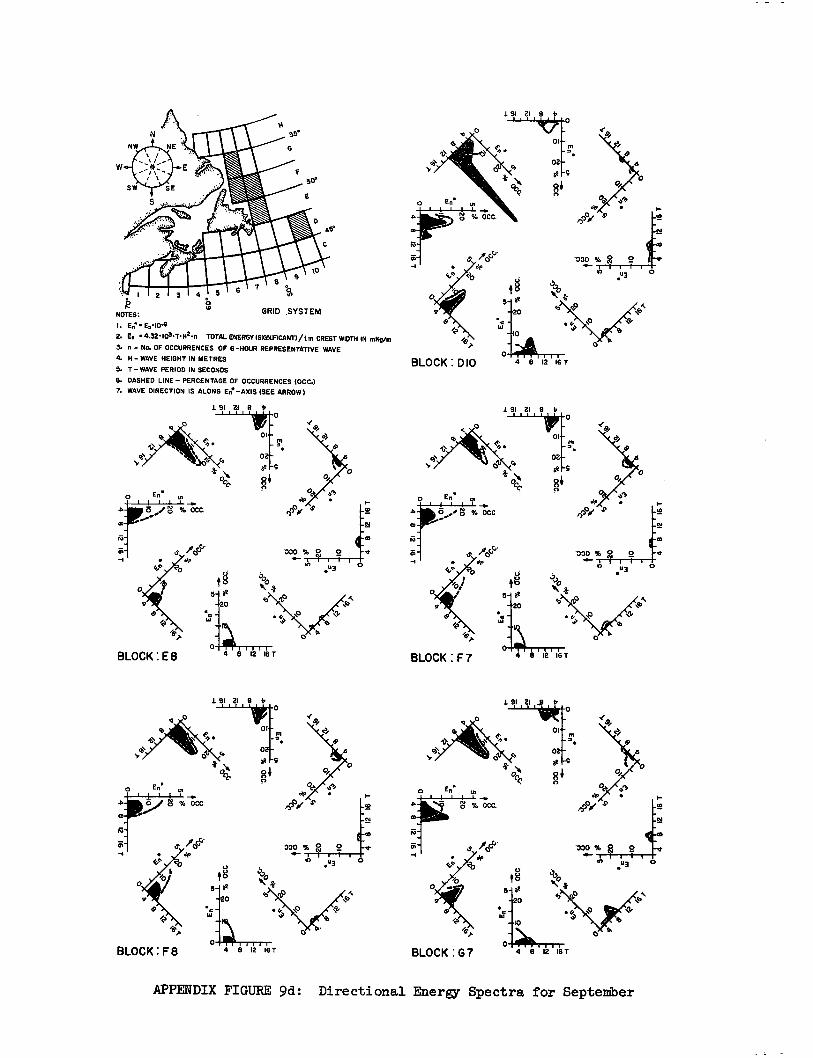
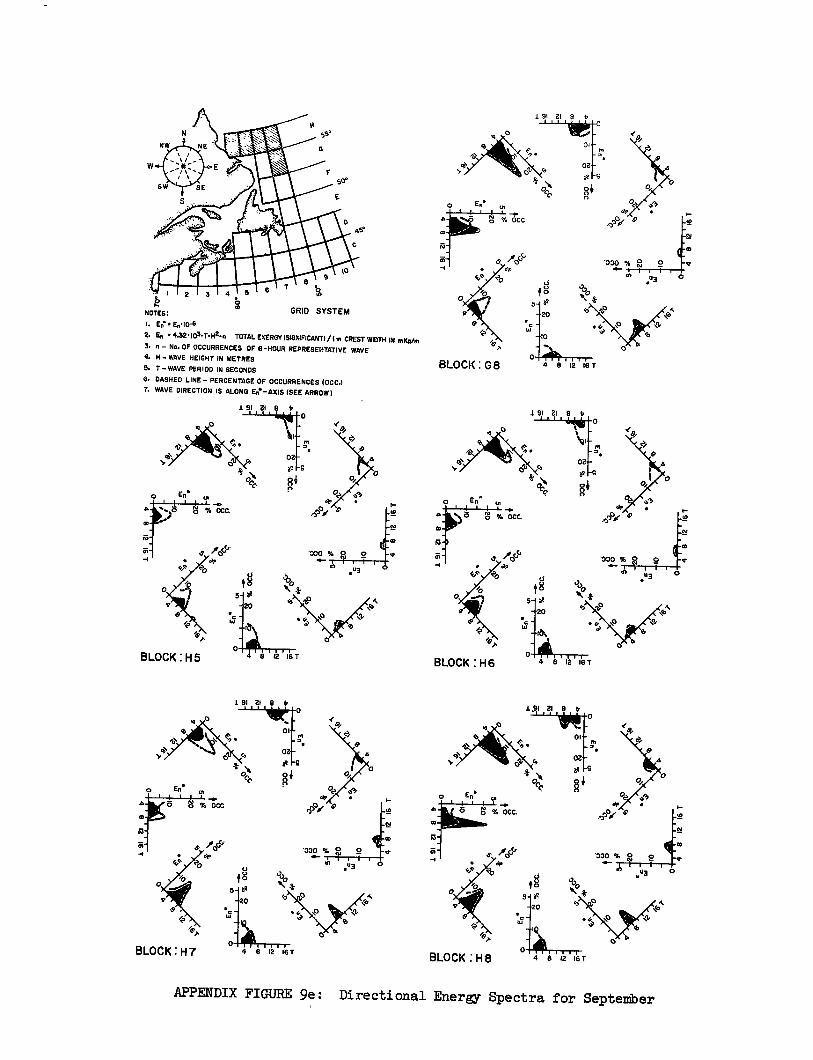
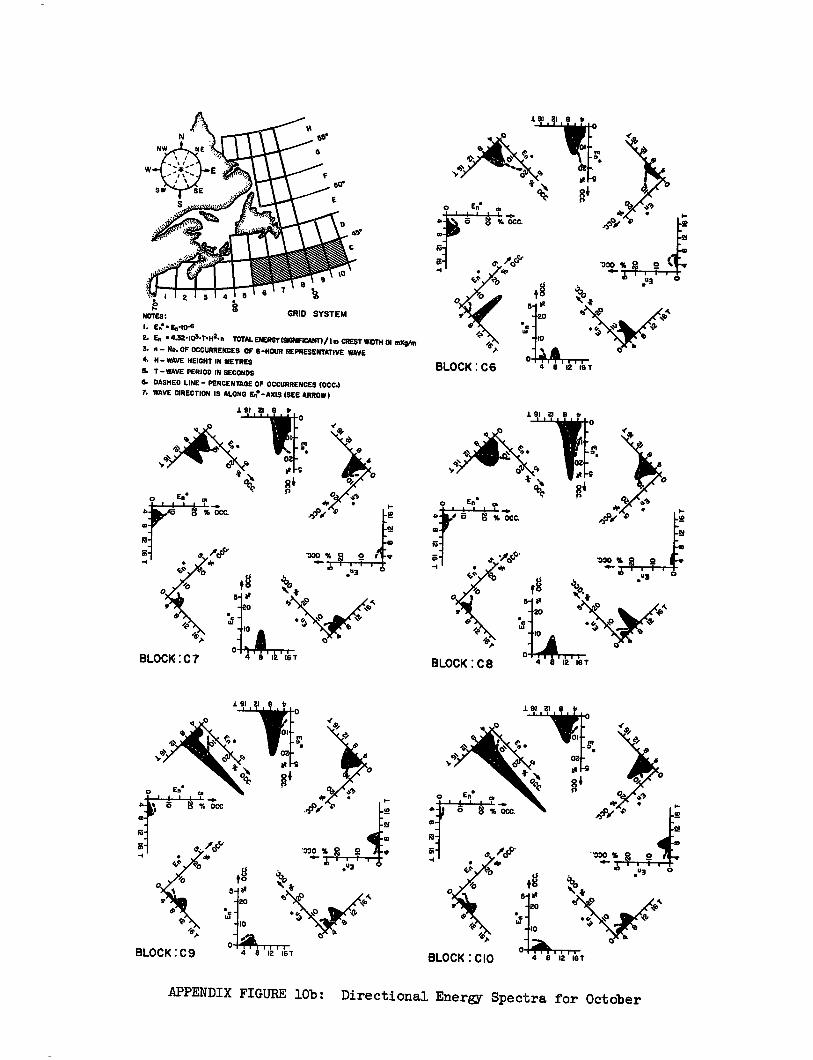
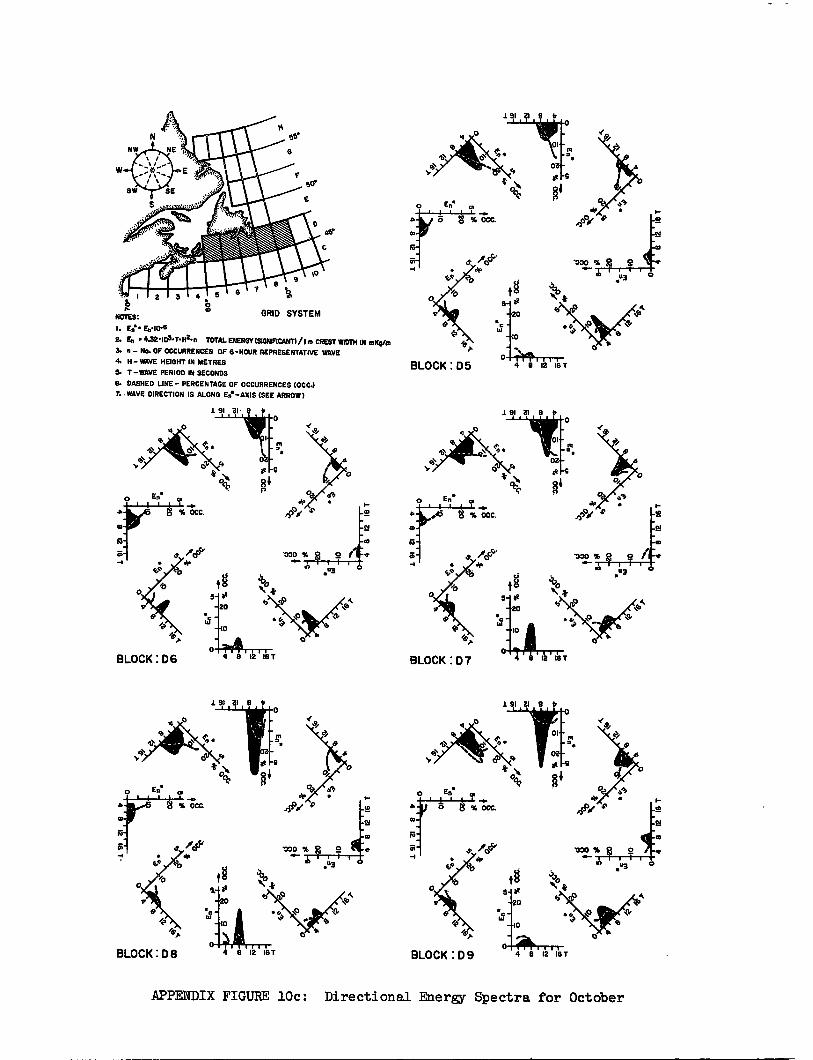
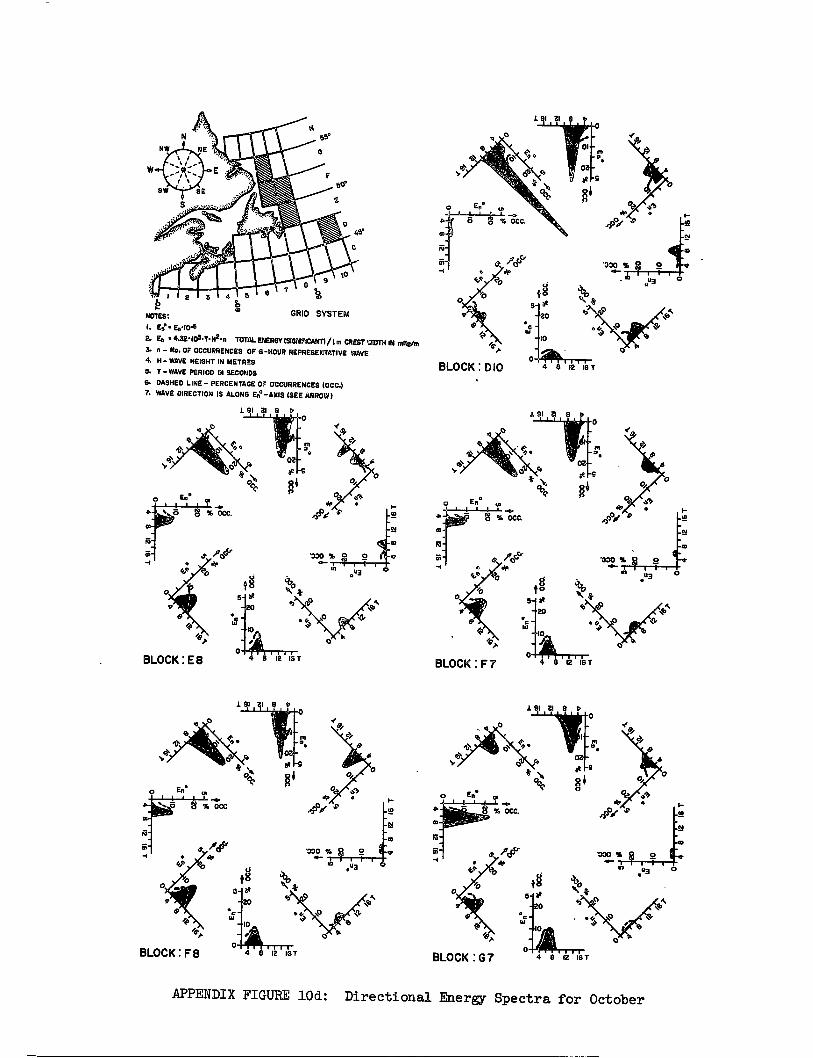
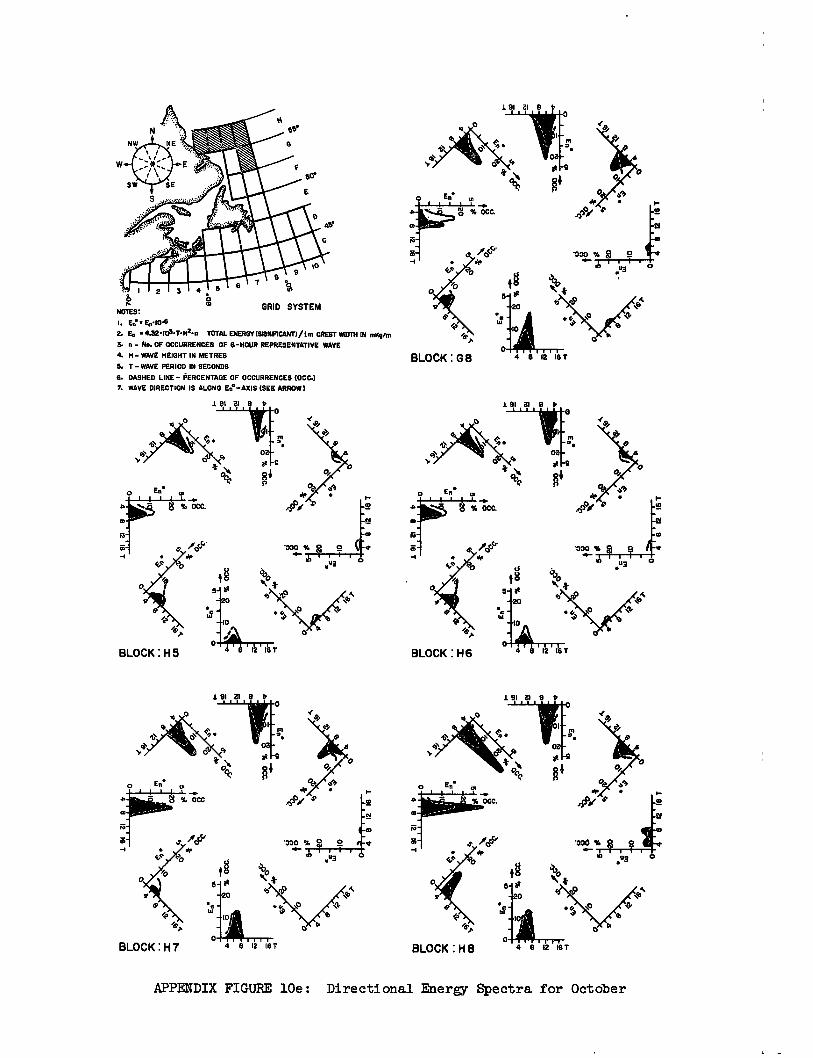
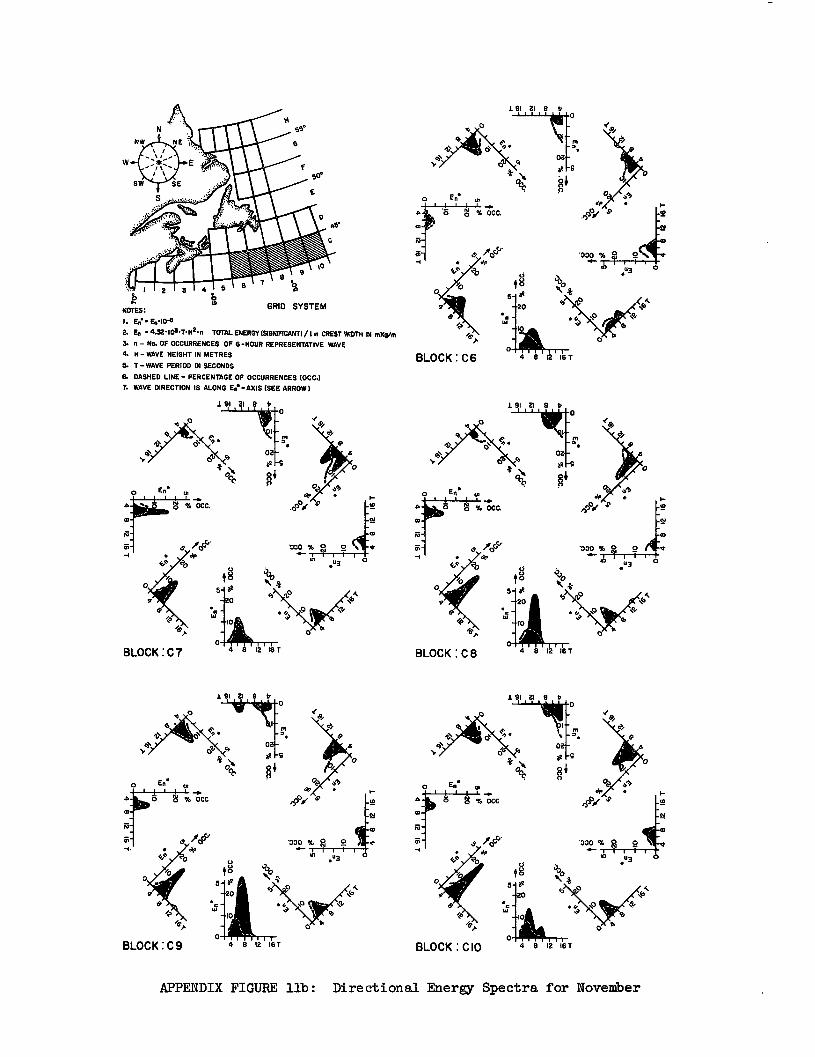
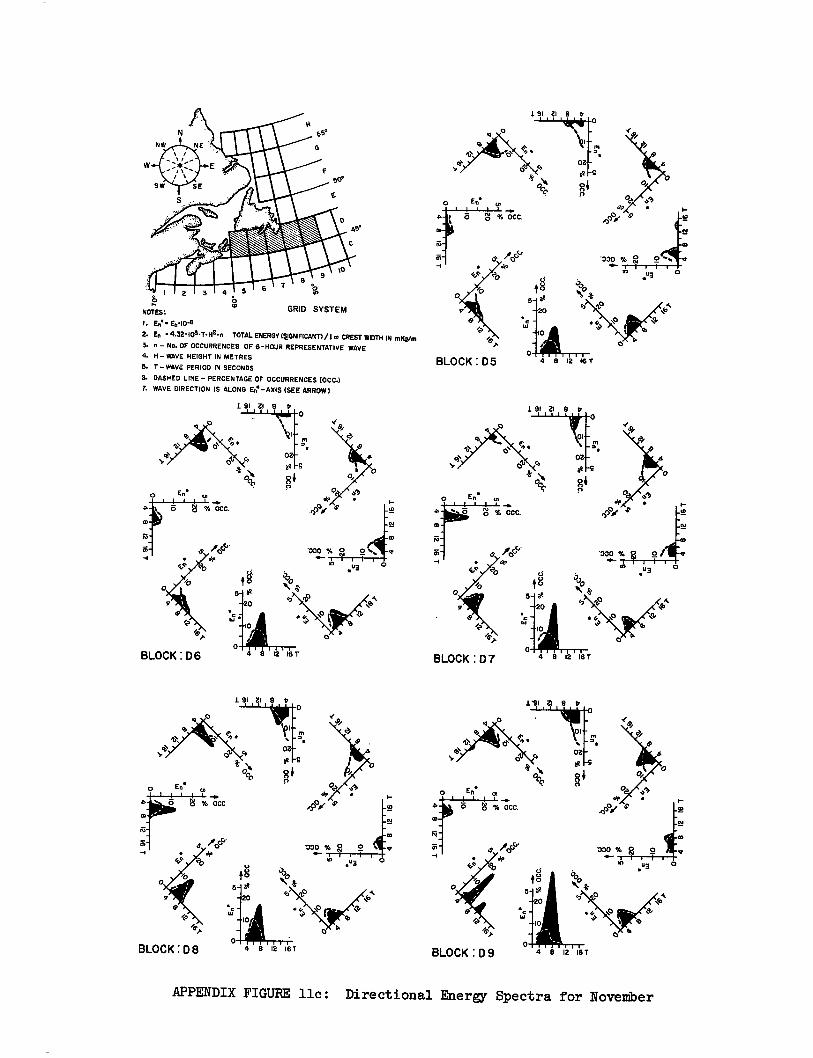
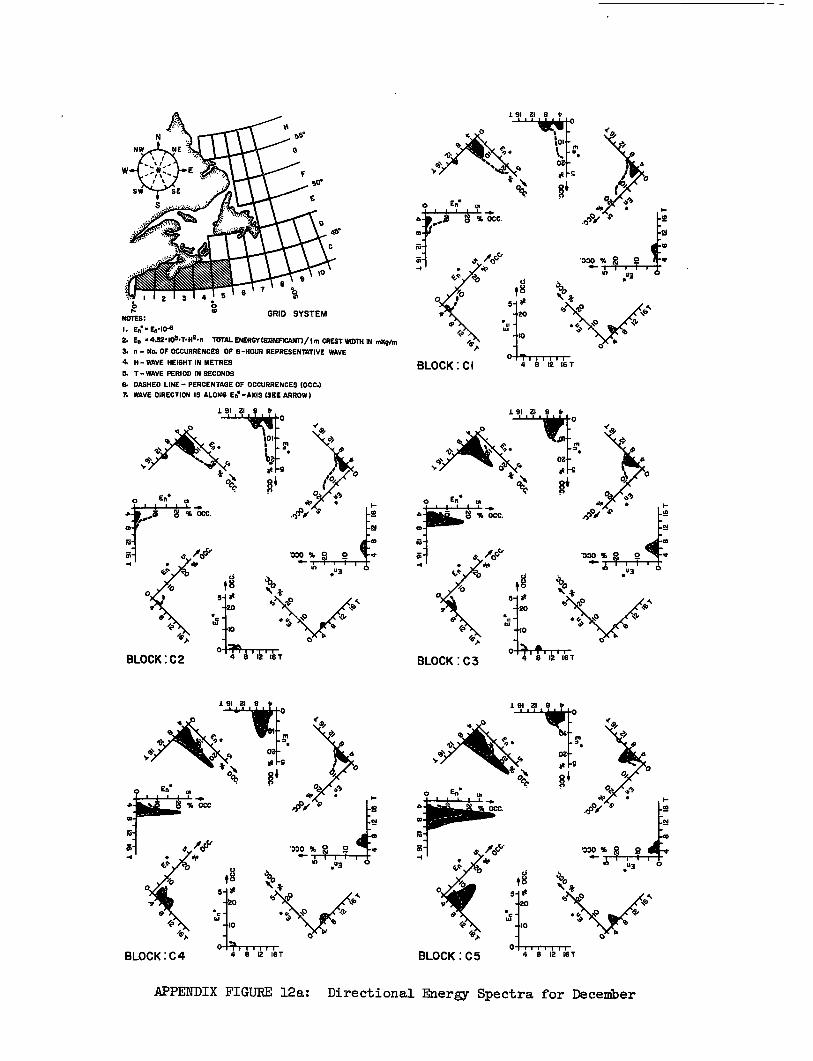
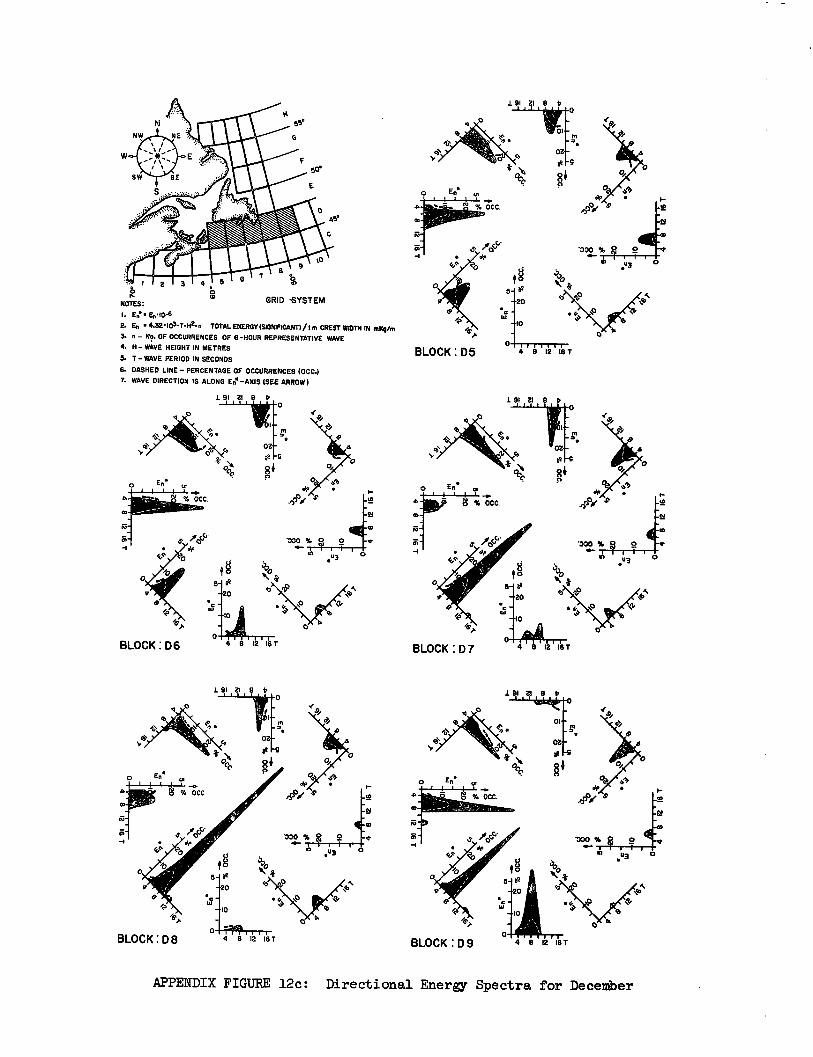
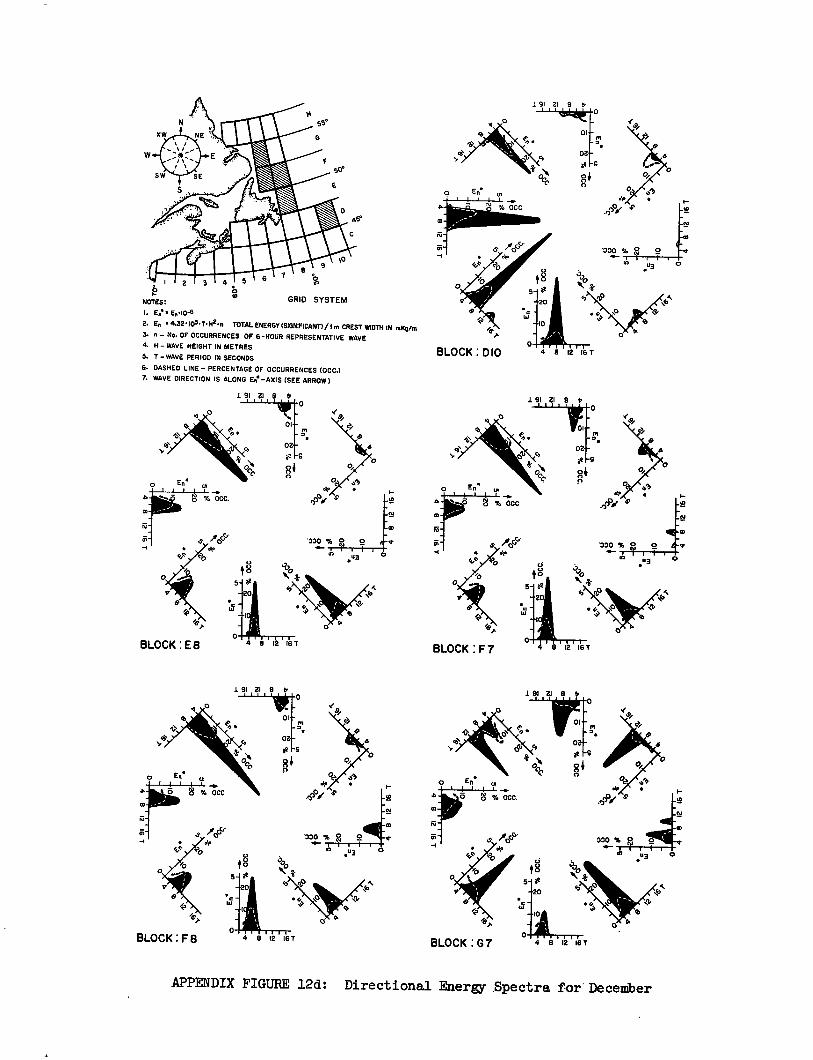
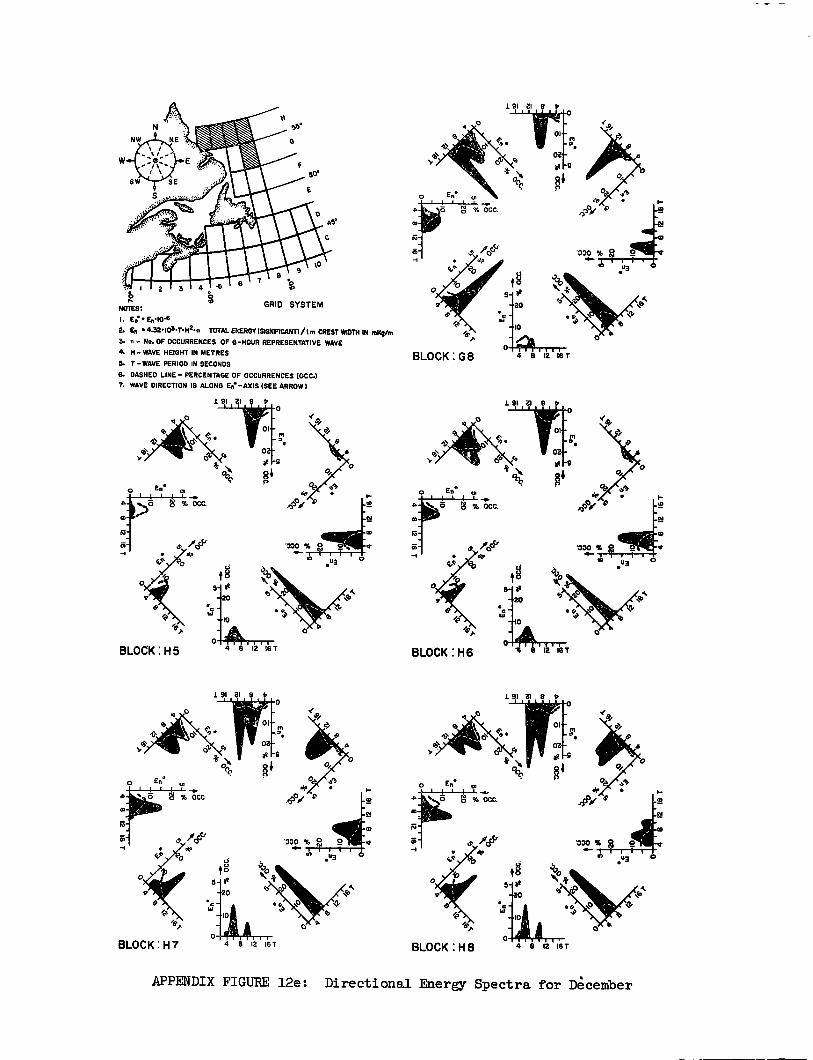
5.2 Monthly Directional Energy Spectra
These spectra are presented in the Appendix, in App. Fig. 1
to App. Fig. 12. They are plotted in groups of five blocks per page.
The energy of each block is divided into the eight point system, each
point representing the energy of the respective 45 degree sector.
The energy is plotted along the vertical axis and the wave periods
normal to it. The direction of wave propagation is along the E;1-axis
as indicated by the arrow. The periods (T), to which these energies
refer, are grouped in two-second intervals. The shaded area is the
integrated significant wave energy for each metre of wave crest. In
addition, the occurrence of these energies with respect to percentage
of time per month, is included.
The data cannot be discussed in detail because of their volume
but must be studied individually in the areas of interest.
A brief review, however, reveals the following general picture
for 1970. As already demonstrated by the non-directional energy
presentation, the energy level in January was extremely high, with peaks
primarily from the north-west and west; an exception being Labrador,
where energy came from the north and east. February and March show an
appreciable decrease, with more waves from the west and south-west.
In contrast, the following month, Aprillshowed an increase in energy
level which was experienced during the oil recovery operation from
the tanker Arrow in Chedabucto Bay (Neu7). The wave energy during this
7 NEU, H. A. "The hydrodynamics of Chedabucto Bay and its influences on the Arrow oil disaster." AOL Report 1970-6, Dartmouth, N.S.
-24-
period was primarily from the west and southwest. In the following
months, the waves decreased considerably; their direction being more
from the southwest. In the fall, the energy level started to increase
again, and in December was up to the level of January with waves from
the northwest, west and southwest along the southern seaboard and Grand
Banks. The energy from the southwesterly direction appears to be gen-
erated primarily through short but intense storms associated with
rapidly occurring weather disturbances.
In all these results, a remarkable agreement is displayed
between the state of the sea, on the one hand, and the wind strength,
direction and fetch, on the other. Where the winds are predominantly
offshore, it is not surprising that, on the average, relatively little
wave energy is transferred from the open Atlantic towards the Canadian
seaboard. Only swell with reduced energy and waves of severe weather
disturbances are usually able to enter the Continental Shelf region.
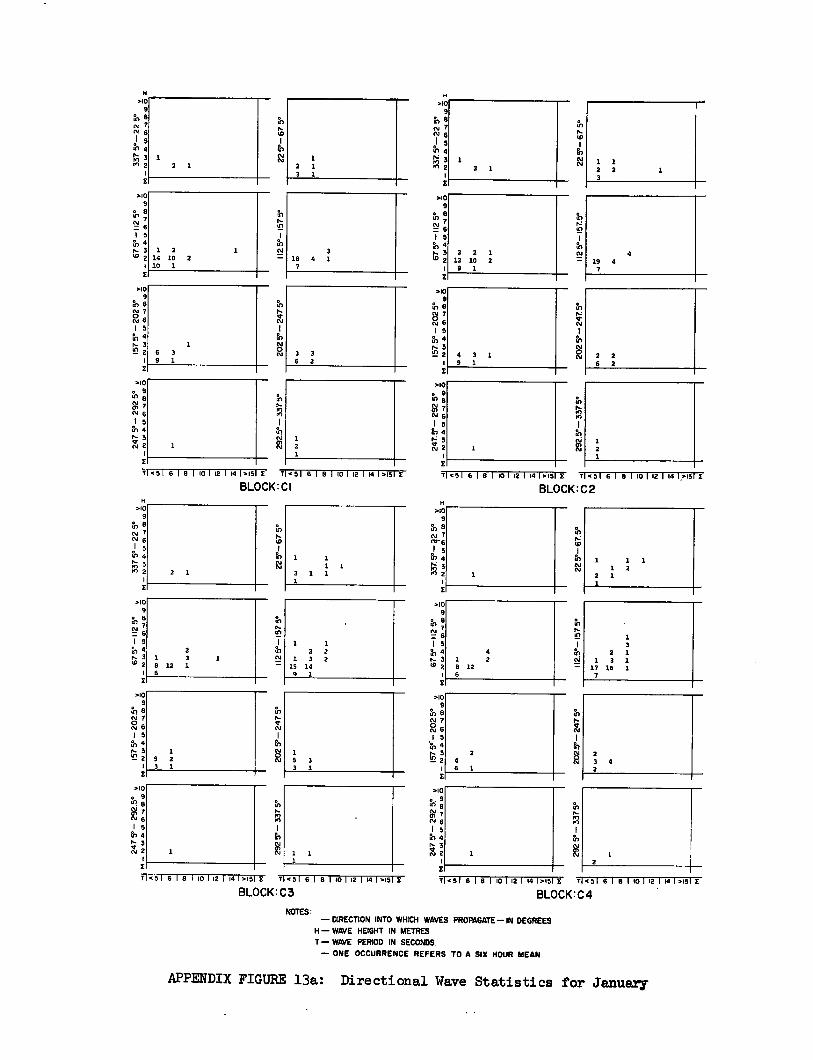
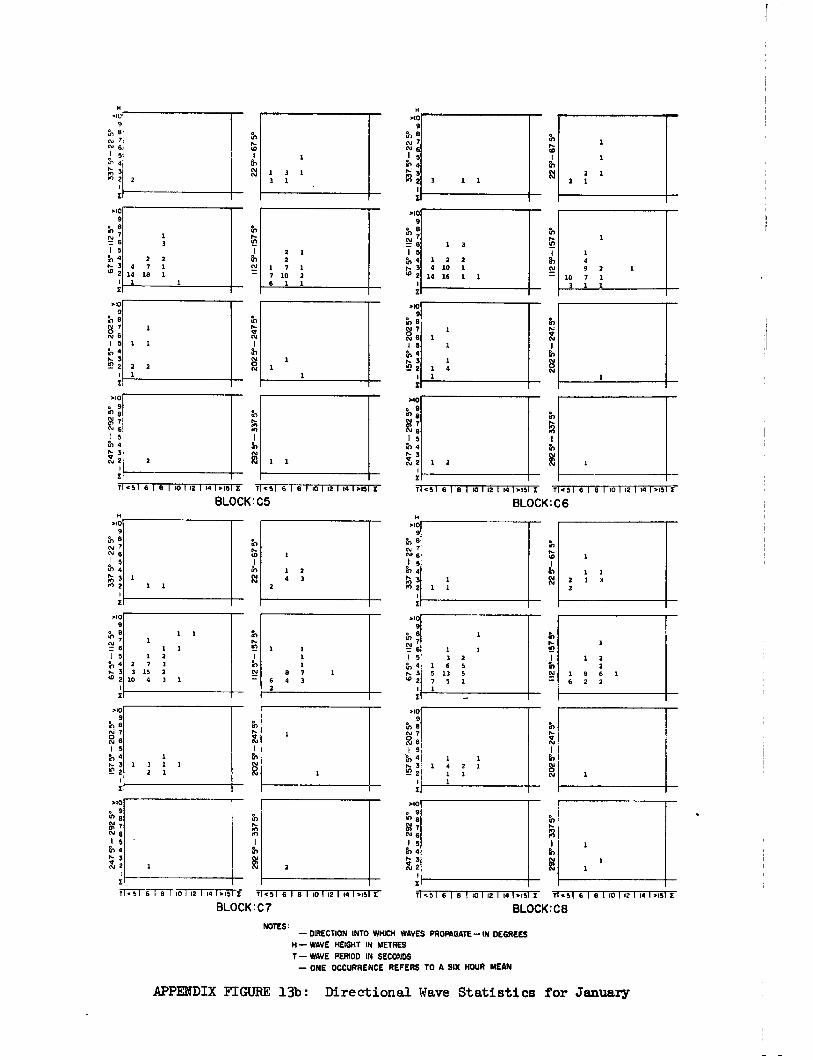
5.3 Monthly Directional Wave Statistics
The statistical analysis is also presented in the Appendix
and gives the most complete information on the sea state. Each block
contains 1460 individual wave data, each representing the 'significant'
sea state for a period of six hours. This information is grouped in
months, directions, heights, and 2-second period intervals. The number
of occurrences of a particular wave type is given numerically at the
intersection of the wave height and wave period.
The wave results of the analysis are given in App. Fig. 13
to 24.
-25-
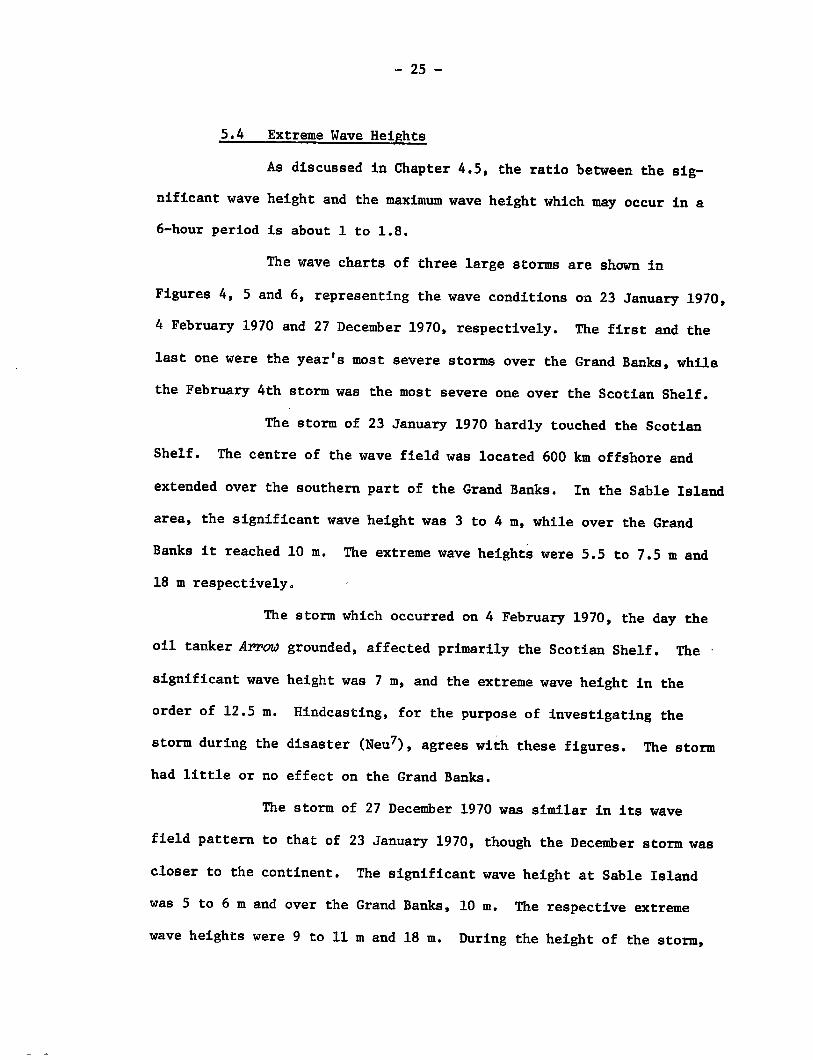
5.4 Extreme Wave Heights
As discussed in Chapter 4.5, the ratio between the sig-
nificant wave height and the maximum wave height which may occur in a
6-hour period is about 1 to 1.8.
The wave charts of three large storms are shown in
Figures 4, 5 and 6, representing the wave conditions on 23 January 1970,
4 February 1970 and 27 December 1970, respectively. The first and the
last one were the year's most severe storms over the Grand Banks, while
the February 4th storm was the most severe one over the Scotian Shelf.
The storm of 23 January 1970 hardly touched the Scotian
Shelf. The centre of the wave field was located 600 km offshore and
extended over the southern part of the Grand Banks. In the Sable Island
area, the significant wave height was 3 to 4 m, while over the Grand
Banks it reached 10 m. The extreme wave heights were 5.5 to 7.5 m and
18 m respectively.
The storm which occurred on 4 February 1970, the day the
oil tanker Arrow grounded, affected primarily the Scotian Shelf. The
significant wave height was 7 m, and the extreme wave height in the
order of 12.5 m. Hindcasting, for the purpose of investigating the
storm during the disaster (Neu7), agrees with these figures. The storm
had little or no effect on the Grand Banks.
The storm of 27 December 1970 was similar in its wave
field pattern to that of 23 January 1970, though the December storm was
closer to the continent. The significant wave height at Sable Island
was 5 to 6 m and over the Grand Banks, 10 m. The respective extreme
wave heights were 9 to 11 m and 18 m. During the height of the storm,
-26-
an oil exploration platform near Sable Island experienced a maximum
wave height of 12 m. This is ten percent higher than reported herein
and may be caused by refraction. From these three storms, it can be
concluded that in 1970 the maximum wave height over the Scotian Shelf
was of the order of 12.5 m, while over the Grand Banks it was 18 m.
Shoaling could have caused still higher waves.
6. CONCLUSIONS
All three presentations, the non-directional energy distributions,
the directional energy spectra and the wave statistics, clearly demon-
strate the variation of the sea state along the Canadian Atlantic coast
and over the Continental Shelf with respect to time, location and
direction.
The most outstanding features are that during the winter, the
wave energy was five to six times greater than during the summer, and
the energy concentration on the Grand Banks and along the coast of
Labrador was three to four times that over the Scotian Shelf. This
latter fact indicates that the wave heights east of Newfoundland and
over the Grand Banks were, generally, nearly twice as high as those
in the Sable Island area. This ratio is also approximately indicated
by the comparision of the extreme wave heights which were 12.5 m and
18 m, respectively.
1970 was not apparently an exceptionally stormy year and it must
be assumed that a 100-year wave would be much higher, according to
probability statistics, of the order of 1;i while the wave energy would
increase by more than 2. The effect of shoaling is not taken into
consideration.
-27-
From this, it must be concluded that a structure such as an
oil drilling rig, which has been built for a design wave of 20 m, may
successfully withstand the sea conditions near Sable Island, but would
probably fail over the Grand Banks or off the Labrador coast.
Design concepts, safety standards and planning of off-shore
operations must therefore be reviewed carefully in the light of the
information submitted herewith.
7. ACKNOWLEDGEMENT
The author gratefully acknowledges the contribution of the
Maritime Forces Weather Centre and particularly that of M. R. Morgan,
the Officer in Charge. Without relinquishing the data and approving
their publication, this investigation would not have been possible.
Special mention is made of R. Walker for his untiring effort
in processing the data and preparing them for publication. I also
thank P. Vandall Jr. and others for their contributions to the project,
and E. S. Turner of the National Research Council for reviewing the paper.
11 It
ft I/
/I
It It
App. Fig. 14 a to g
App. Fig. 15 a to g
App. Fig. 16 a to g
App. Fig. 17 a to g
App. Fig. 18 a to g
App. Fig. 19 a to g
App. Fig. 20 a to g
App. Fig. 21 a to g
App. Fig. 22 a to g
App. Fig. 23 a to g
App. Fig. 24 a to g
" February
" March
" April
" May
" June
" July
" August
" September
" October
" November
" December
-28-
8. APPENDIX
The monthly directional energy spectra and the wave statistics
are given in this chapter. They are grouped as follows:
App. Fig. 1 a to e Directional Energy Spectra for January
App. Fig. 2 a to e
" February
App. Fig. 3 a to e It
" March
App. Fig. 4 a to e
I/
" April
App. Fig. 5 a to e
It
" May
App. Fig. 6 a to e
11
It
" June
App. Fig. 7 a to e
" July
App. Fig. 8 a to e
It
" August
App. Fig. 9 a to e
It
" September
App. Fig. 10 a to e
It
" October
App. Fig. 11 a to e
/I
11
" November
App. Fig. 12 a to e
" December
App. Fig. 13 a to g Directional Wave Statistics for January
0
NOTES:
I. E. • E..10-6
2. E. • 4.32•103.1,He•n TOTAL ENERGY(SIGNIFICANT)/(m CREST WIDTH IN mKgirn
3. n - No. OF OCCURRENCES OF 6-HOUR REPRESENTATIVE WAVE 4. H -*WE HEIGHT IN METRES 0. T - WAVE PERIOD IN SECONDS
6. DASHED LINE - PERCENTAGE OF OCCURRENCES (OCC.) 7. WAVE DIRECTION 18 ALONG En -AXIS (SEE ARROW)
1. 91 21 El 0
1 91 CI 8 b
4 8 a la T
1 81 CI
71)
GRID SYSTEM
O
BLOCK:C2
to
s'o r
0
BLOCK:C4 4 R 12 16 T
APPENDIX FIGURE la: Directional Energy Spectra for January
1 91 Z1 8 b
N
NW
SW
55°
G
F 50°
45°
C
91 21 B
0
BLOCK:C8 4 8 12 18 T
BLOCK :C9 4 El a 16T
NOTES: GRID SYSTEM
I. Ed'• E,•10-6 2. E, • 4.32•103.7.H2.n TOTAL ENERGY(SIGNIFICANT)/1m CREST WIDTH IN mK9/m 3. n — No. OF OCCURRENCES OF 8-HOUR REPRESENTATIVE WAVE 4. H— WAVE HEIGHT IN METRES
5. T —WAVE PERIOD IN SECONDS
8. DASHED LINE — PERCENTAGE OF OCCURRENCES (OCC.) 7. WAVE DIRECTION IS ALONG En.—AXIS (SEE ARROW)
APPENDIX FIGURE lb: Directional Energy Spectra for January
1 91 21
.L 91 8 21
NOTES: GRID SYSTEM
I. En° • En•10•e
2. En • 4.32.103•T•H2•n TOTAL ENERGY (SIGNIFICANT)/tm CREST WIDTH IN mKg/m
3. n — No. OF OCCURRENCES OF 6-HOUR REPRESENTATIVE WAVE 4. H — WAVE HEIGHT IN METRES
5. T — WAVE PERIOD IN SECONDS
6. DASHED LINE — PERCENTAGE OF OCCURRENCES (OCC.) 7. WAVE DIRECTION IS ALONG En" —AXIS (SEE ARROW )
APPENDIX FIGURE lc: Directional Energy Spectra for January
1 91 Zi 9 9
5
rS! NOTES:
GRID SYSTEM
I. En • En.106 2. En • 4.32.103.T.H2.n TOTAL EAERGY(sioancamn/t m CREST WIDTH IN mKg/m 3. n - No. OF OCCURRENCES OF 8-HOUR REPRESENTATIVE WAVE 4. H- WAVE HEIGHT IN METRES 5. T - WAvE PERIOD IN SECONDS 8. DASHED LINE - PERCENTAGE OF OCCURRENCES (OCC.) 7. WAVE DIRECTION IS ALONG En.-AXIS (SEE ARROW)
BLOCK*E8
4 8 12 IS T
BLOCK : F7
4 8 12 IS T
1 91 21 8
APPENDIX FIGURE ld: Directional Energy Spectra for January
BLOCK: G8
4 8 a 16T
9
ICE COVER:23% OF TIME
5 sT 20
BLOCK: H7 4 8 12 18 T
I 2 3 4 5
NOTES' GRID SYSTEM
I. En • En010-8 2. En • 4.32•103.T•H2.n TOTAL ENERGY (SIONFICANT) m CREST WIDTH IN mKg/m
3. n - No. OF OCCURRENCES OF 8-HOUR REPRESENTATIVE WAVE
4. H- WAVE HEIGHT IN METRES 5. T -WAVE PERIOD IN SECONDS 8. DASHED LINE - PERCENTAGE OF OCCURRENCES (OCC.) 7. WAVE DIRECTION IS ALONG En -AXIS (SEE ARROW)
19.1 l 71 8
co- ICE COVER:25% OF TIME
En- • 4.
0
BLOCK : H 5 4 8 12 161
APPENDIX FIGURE le: Directional Energy Spectra for January
45
• al'
oc
0
5 0 % OCC.
4
S- o0 0
0
BLOCK :C2
4, 49
4 0
191 21 B 17
8 12 16 T BLOCK:C4
(ib 4
% OCC
*
5 20
10
4 4
0
NOTES: GRID SYSTEM
I. En • En.10-6 2. E. • 4.32.103•T412.n TOTAL ENERGYISSINIFICANT)/1m CREST WIDTH IN mKg/m
3. n - No. OF OCCURRENCES OF 6-HOUR REPRESENTATIVE WAVE
4. H- WAVE HEIGHT IN METRES
5. T -WAVE PERIOD IN SECONDS
6. DASHED LINE - PERCENTAGE OF OCCURRENCES (OCC.) T. WAVE DIRECTION IS ALONG 0-AXIS (SEE ARROW)
191 El 8
APPENDIX FIGURE 2a: Directional Energy Spectra for February
1 91 31 8 V 1 91 31
191 SI S
7 I 2 3 4 5
NOTES: GRID SYSTEM
I. Eo.• E••10-
2. E. • 4.52•103.7.1.12.n TOTAL ENERGY (SIGNIFICANT) /1m CREST WIDTH IN mKo/m 3. n - No. OF OCCURRENCES OF 6-HOUR REPRESENTATIVE WAVE 4. H- WAVE HEIGHT IN METRES
T -WAVE PERIOD IN SECONDS 6. DASHED LINE - PERCENTAGE OF OCCURRENCES (OCC.) 7. WAVE DIRECTION IS ALONG Eo.-AXIS (SEE ARROW)
191 SI 8
APPENDIX FIGURE 2b: Directional Energy Spectra for February
NOTES:
1. En • En•104 E. En • 4.32••O3•T•HE•n TOTAL ENERGY (SIGNIFICANT)/Im CREST WIDTH IN mKg/m 3. n - No. OF OCCURRENCES OF 11-HOUR REPRESENTATIVE WAVE 4. 11- WAVE HEIGHT IN METRES
5. 1-WAVE PERIOD IN SECONDS
8. DASHED LINE - PERCENTAGE OF OCCURRENCES (OCC.) 7. WAVE DIRECTION IS ALONG En.-AXIS (SEE ARROW)
APPENDIX FIGURE 2c: Directional Energy Spectra for February
8
191 El 9
9 0
10: ICE
4 8 12 18 T
0
0 BLOCK:G7
o 4. . • ••■
A- 6 8 % occ.
,o(?. •
c'o
5- zo
10
8
3 4 5
S: GRID SYSTEM
NOTE
I. En'• 2. E,, • 4.32.103.1,H2.n TOTAL ENERGY ISIONIFICANT)/t m CREST WIDTH IN mKg/m 3. n - No. OF OCCURRENCES OF 6-HOUR REPRESENTATIVE WAVE 4. H - WAVE HEIGHT IN METRES e. T -WAvE PERIOD IN SECONDS 6. DASHED LINE- PERCENTAGE OF OCCURRENCES (OCC.) T. WAVE DIRECTION IS ALONG En.-AXIS (SEE ARROW)
APPENDIX FIGURE 2d: Directional Energy Spectra for February
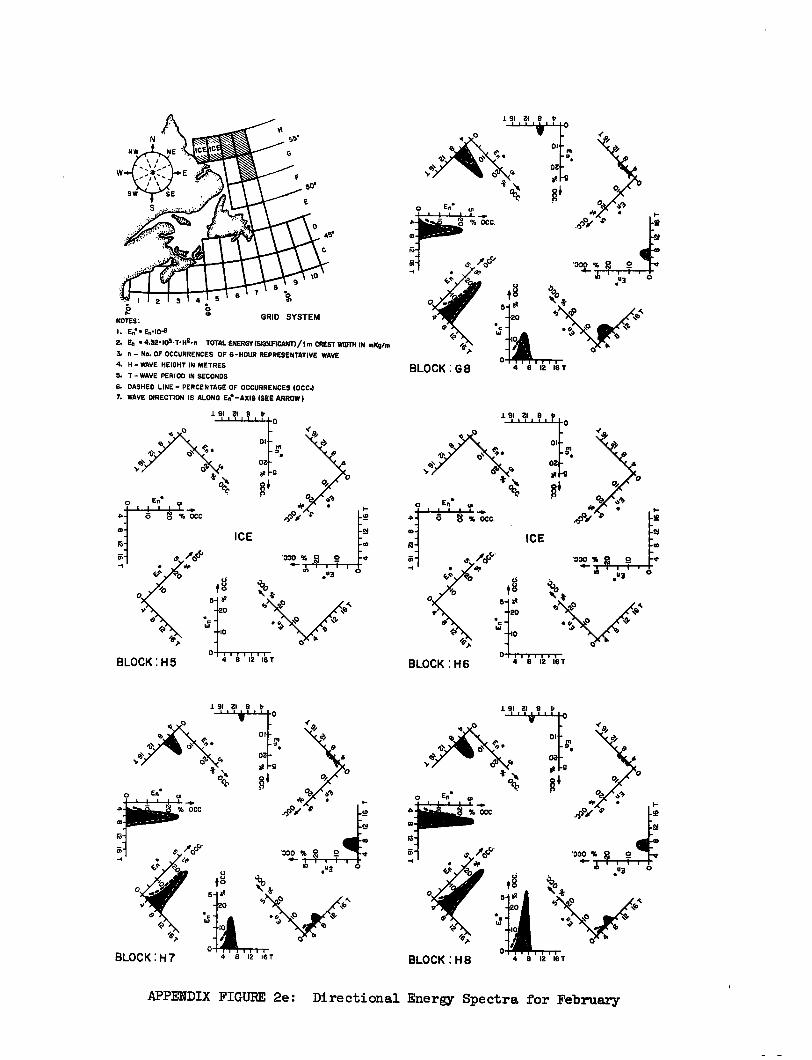
APPENDIX FIGURE 2e: Directional Energy Spectra for February
O
NOTES: GRID SYSTEM
I. E•*• En.10-8 2. Fe • 4.32•103.1,H2.n TOTAL ENERGY (SIGNIFICANT)/1m CREST WIDTH IN mK9/m 3 n- No. OF OCCURRENCES OF 6-HOUR REPRESENTATIVE WAVE 4. H- WAVE HEIGHT IN METRES
T -WAVE PERIOD IN SECONDS
6. DASHED LINE - PERCENTAGE OF OCCURRENCES (OCC.) 7. WAVE DIRECTION IS ALONG En -AXIS (SEE ARROW)
1 91 21 8
0
A
ICE
5- et —20
—ID
0 4 8 12 16
1 91 21 8
•
4 8 12 16 T
0 1 91 V 8 b
1 91 21 9
NOTES:
I. En.• E1010-8 2. E• • 4.32•I03•T•H2•n TOTAL ENERGY (SIGNIFICANT)/1m CREST WIDTH IN mkg/m
3. n - No. OF OCCURRENCES OF 6-HOUR REPRESENTATIVE WAVE 4. H - WAVE HEIGHT IN METRES
S. T - WAVE PERIOD IN SECONDS
6. DASHED LINE - PERCENTAGE OF OCCURRENCES (OCC.) T. WAVE DIRECTION IS ALONG Ea.-AXIS (SEE ARROW)
APPENDIX FIGURE 3a: Directional Energy Spectra for March
5
BLOCK: C6
V
.3. ire • An
Cfr PO
. 20
• •
0 4.4 4 6
I 12 16T
f§ 51*
10
•
0
Ee o 4 06 % occ. r
8 1 , 1 .
IV
40
o
Mm
-33b % ,031"
ZS ,1/40
V
(./
BLOCK : C 10
6- -20 *
0 4 e isr
191 21 8 b
a
0
10 *
NOTES: GRID SYSTEM
I. 2.• • 200-6 2. E. • 4.32.103.7412.n TOTAL ENERGY (SIGNIFICANT) /1 m CREST WIDTH IN mKg/m 3. n - No. OF OCCURRENCES OF 6 -HOUR REPRESENTATIVE WAVE 4. H - WAVE HEIGHT IN METRES 6. T -WAVE PERIOD IN SECONDS 6. DASHED LINE - PERCENTAGE OF OCCURRENCES (OCC.) 7. WAVE DIRECTION IS ALONG fn.-AXIS (SEE ARROW)
o En° VI
AS°
‘■, % OCC. I
OZ 0
g
§4
APPENDIX FIGURE 3b: Directional Energy Spectra for March
%
NOTES: GRID SYSTEM
I. En • En.110-6 2. En • 4.32.103.T.H2.n TOTAL ENERGY(SIGNIFICANT)/1 CREST WIDTH IN mKg/m 3. n - No. OF OCCURRENCES OF 6-HOUR REPRESENTATIVE WAVE 4. H- WAVE HEIGHT IN METRES 5. T -WAVE PERIOD IN SECONDS
6. DASHED LINE - PERCENTAGE OF OCCURRENCES (OCC.) 7. WAVE DIRECTION IS ALONG En. -AXIS (SEE ARROW)
co
O
'030 % '2 2 • sr
.u3
6
Li
0 % N * 5- r7
20 e ti0
-
.- . 4. w
001 loll 4 8 12 16T
•4 8 16 T BLOCK:09
1 91 El 8 0
§3
% OCC.
• co
'000 % 2 o
u 0 •,
6. VI"
4; "bo
S- 42 -20 .
t 8
BLOCK:D6 BLOCK:07 fl-rte i4 8 112 1'13 T
O 4 8 M S T
APPENDIX FIGURE 3c: Directional Energy Spectra for March
o En. to
occ ce ,
a Cr
-o • • .0 st.
1. 91 ZI
0 Lit
51* 20
10
BLOCK : D 10 1111
4 8 12 16 T
q.0 •
1 91 ZI 8 0
N
AS'
C
9
•
NOTES: GRID SYSTEM
I • E: • En.1043 2. E. • 4.32.103.7• H2.0 TOTAL ENERGY(SIGNIFICANT)/to CREST WIDTH IN mKgio 3. n - No. OF OCCURRENCES OF 6 -HOUR REPRESENTATIVE WAVE 4. H - WAVE HEIGHT IN METRES S. T -WAVE PERIOD IN SECONDS 6. DASHED LINE - PERCENTAGE OF OCCURRENCES (OCC.) 7. WAVE DIRECTION IS ALONG En. -AXIS (SEE ARROW)
1 91 ZI 9
1 91 ZI 8
APPENDIX FIGURE 3d: Directional Energy Spectra for March
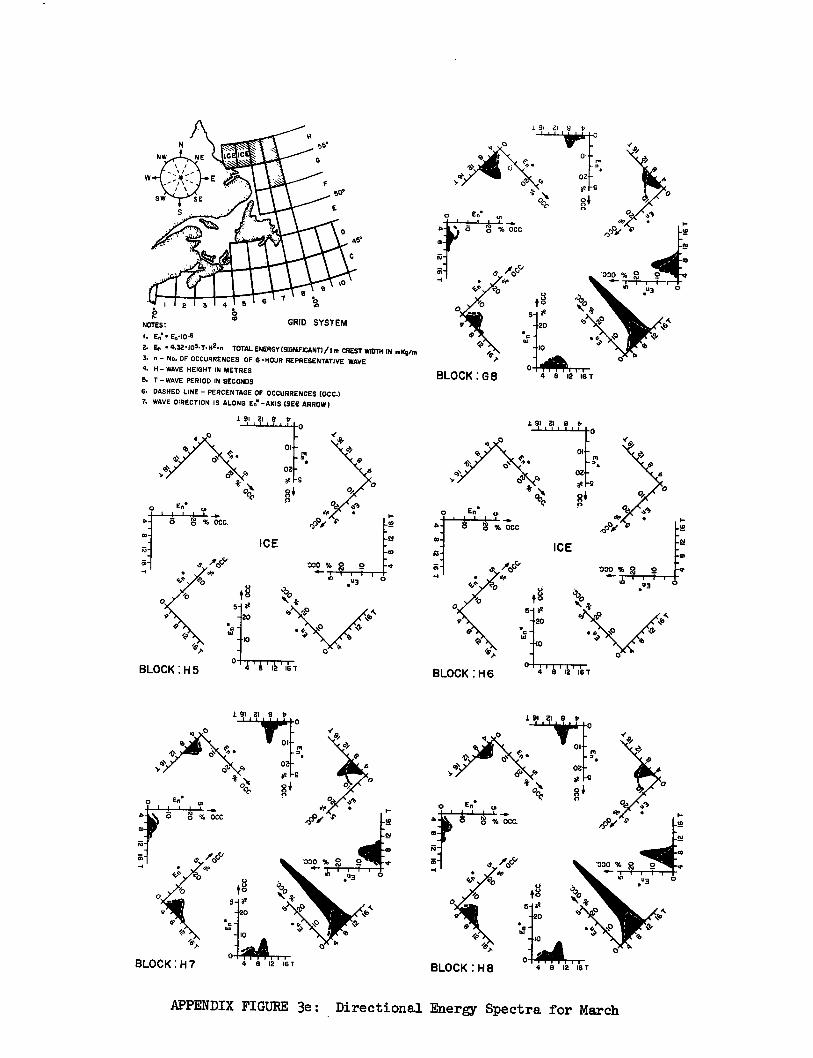
APPENDIX FIGURE 3e: Directional Energy Spectra for March
se
F se
O AS
c
5 0
NOTES: I. En'• En.10-6 2. 5, • 4.32.103.T.H2en TOTAL ENERGY (SIGNIFICANT) /1m CREST WIDTH IN mKg/m 3. n - No. OF OCCURRENCES OF 6-HOUR REPRESENTATIVE WAVE 4. H - WAVE HEIGHT IN METRES
5. T - WAVE PERIOD IN SECONDS
6. DASHED LINE - PERCENTAGE OF OCCURRENCES (OCC.) 7. WAVE DIRECTION IS ALONG En.-AXIS (SEE ARROW)
N
NW
SW
O
GRID SYSTEM
—10
0 014„ 4 8 IS le T
02- 22 g
* N OCC
191 ZI 9 0
O
t g 5-0
—20
EA°
4 8 12 16 T BLOCK:H7
1 91 ZI 9
0 S
0
0).
BLOCK:GB
0
uU O aP
20
• 0
4414 4 8 I. I IA T
rs
43 IP
APPENDIX FIGURE 4a: Directional Energy Spectra for April
b 1. 91 21 8
0I
02
#
4; • 6L
w
0
NOTES: GRID SYSTEM
1. En • E,,•10-6 2. En • 4.32•101.7.142.n TOTAL ENERGY ISIGNIFICANT1/1 m CREST WIDTH IN mKg/m 3. n - No. OF OCCURRENCES OF 8-HOUR REPRESENTATIVE WAVE 4. H - WAVE HEIGHT IN METRES
5. T - WAVE PERIOD IN SECONDS
8. DASHED LINE - PERCENTAGE OF OCCURRENCES (OCC.) 7. WAVE DIRECTION IS ALONG En" -AXIS (SEE ARROW)
12 18 T
W • 0D
O ti t 8
5
20
10
0 4 8
El 8 b
01
02 Qv v
N,
0
a
0
0 0
4,
BLOCK : C3
4 8 12 18 T
91 El 8
BLOCK:C4 4 8 12 181
5, ••••■
,30
0 :3 0
f§ 5 _I#
o E0
,
NOTES: GRID SYSTEM
I. Ea.• En.10-0 2. E. • 4.32.103.7442.n TOTAL ENERGY (SIGNIFICANT)/1 m CREST WIDTH IN mKg/m 3. n — No. OF OCCURRENCES OF 8-HOUR REPRESENTATIVE WAVE 4. H— WAVE HEIGHT IN METRES 8. T—WAVE PERIOD IN SECONDS S. DASHED LINE — PERCENTAGE OF OCCURRENCES (OCC.) 7. WAVE DIRECTION IS ALONG En.—AXIS (SEE ARROW)
4 8 12 18 T
APPENDIX FIGURE lb: Directional Energy Spectra for April
91 El 8
NOTES: GRID SYSTEM
I. En. • En•104
2. En • 4.32.1034,142.n TOTAL ENERGY(SIGNIFICANT)/lm CREST WIDTH IN mKg/m 3. n - No. OF OCCURRENCES OF 5-HOUR REPRESENTATIVE WAVE 4. H - WAVE HEIGHT IN METRES
5. T -WAVE PERIOD IN SECONDS
0. DASHED LINE - PERCENTAGE OF OCCURRENCES (OCC.) 7. WAVE DIRECTION IS ALONG En.-AXIS (SEE ARROW)
APPENDIX FIGURE 4c: Directional Energy Spectra for April
.3 O
01,
ID
ive
0 SS -g 84
0 A
"bo i■
tl
S 8 5 *
20
O
ICA
4 8 12 14 T
1 91 El 9
t8
1. 91 21 8 0
O
0 •
al 8
0
„pa/ .
•
P 8 8 % occ. co
CD CT,
S - • 40 0
ICE
41.
8
A
,
BLOCK : F 8 BLOCK : G 4 8 12 18 T
970 % 0
...3
%
NOTES: GRID SYSTEM
I. En • Ea.104
2. E. • 4.32.1133.7.H2.n TOTAL ENERGY (SIGNIFICANNI m CREST WIDTH IN m8g/m 3. n - No. OF OCCURRENCES OF 8-HOUR REPRESENTATIVE WAVE 0. H- WAVE HEIGHT IN METRES 6. T -WAVE PERIOD IN SECONDS 6. DASHED LINE - PERCENTAGE OF OCCURRENCES (OCC.) 7. WAVE DIRECTION IS ALONG E:-AXIS (SEE ARROW)
1 81 21
104
0 BLOCK : E 8 4 8 12 1sT BLOCK:F7
4 8 12 18
5- * 20
APPENDIX FIGURE 4d: Directional Energy Spectra for April
5
BLOCK : H6 4 8 12 18 T
0
191 SI B 1 91 El B
BLOCK:H8 4 8 12 16 T
GRID SYSTEM NOTES: I. En • En.10-0
2. En • 4.32•I03•T•H2•n TOTAL ENERGY (SIGNIFICANT/it m CREST WIDTH IN mKq/m
3. n - No. OF OCCURRENCES OF 6-HOUR REPRESENTATIVE WAVE 4. H - WAVE HEIGHT IN METRES 5. 7-WAVE PERIOD IN SECONDS
8. DASHED LINE - PERCENTAGE OF OCCURRENCES (OCC.) 7. WAVE DIRECTION IS ALONG Ed.-AXIS (SEE ARROW )
191 SI 8 1 91 al B 0
APPENDIX FIGURE 4e: Directional Energy Spectra for April
kT
I 2 3 5
1 91 71 8
1 91 21 8 0
1 91 21 8
GRID SYSTEM NOTES: i. En' • E,,•10-3 2. E,, • 4.32.103.T.H2.n TOTAL ENF-FIGY(SIGNIFICANT)/1m CREST WIDTH IN mKg/m 3. n — No. OF OCCURRENCES OF 8-HOUR REPRESENTATIVE WAVE 4. H — WAVE HEIGHT IN METRES 5. T — WAVE PERIOD IN SECONDS
8. DASHED LINE — PERCENTAGE OF OCCURRENCES (OCC.) 7. WAVE DIRECTION IS ALONG En.—AX1S (SEE ARROW)
APPENDIX FIGURE 5a: Directional Energy Spectra for May
'GM % 41.
0
191 21 8 V
50.
0 .0 • Ee * % Exc. 400,
45° to
3 5
GRID SYSTEM NOTES: I. Err • 410-5 2. E. • 4.32.103.7-H2.n TOTAL ENERGY (SRUBFICANT)/I m CREST WIDTH IN mKg/m 3.* n — No. OF OCCURRENCES OF 8-HOUR REPRESENTATIVE WAVE 4. H — NAVE HEIGHT IN METRES 0. T —WAVE PERIOD IN SECONDS 8. DASHED LINE — PERCENTAGE OF OCCURRENCES (OCC-) 7. WAVE DIRECTION IS ALONG En.—AXIS (SEE ARROW)
_ S ,4P. • A* V t
-,
4!7 510
* v zo
4:0
t ,6)
O 17 • 4 1
1.0 's?,14 ev
BLOCK:CB 0
4 8 ' IA 18T
APPENDIX FIGURE 5b: Directional Energy Spectra for May
1.91 31 8 O
BLOCK:06 4 8 12 M T
I 4 5 .9•
NO S: GRID SYSTEM TE I. E,P• E„.1o6 2. E. • 4.32-103.T.H2.n TOTAL ENERGY (SIGMFICANT)/1(11 CREST WIDTH IN mKg/m 3. n - No. OF OCCURRENCES OF 8-HOUR REPRESENTATIVE WAVE 4. H - WAVE HEIGHT IN METRES 5. T -WAVE PERIOD IN SECONDS 6. DASHED LINE - PERCENTAGE OF OCCURRENCES (OCC.) 7. WAVE DIRECTION IS ALONG En -AXIS (SEE ARROW)
1 91 31 8
1 91 31 B
APPENDIX FIGURE 5c: Directional Energy Spectra for May
GRID SYSTEM
.. I 2 3 4 5
NOTES:
I. E:• 2. E. • 4.32.105.7442.n TOTAL ENERGY (SIGNIFLCANT1/1m CREST WIDTH IN mKg/m
3. n - No. OF OCCURRENCES OF 8-HOUR REPRESENTATIVE WAVE 4. H - WAVE HEIGHT IN METRES 5. T -WAVE PERIOD IN SECONDS 8. DASHED LINE - PERCENTAGE OF OCCURRENCES (OCC.) 7. WAVE DIRECTION IS ALONG Ea.-AXIS (SEE ARROW)
APPENDIX FIGURE 5d: Directional Energy Spectra for May
'DO % 0 0
BLOCK:F7 4 12 18 T
1 91 21 8
BLOCK : G 7 4 8 12 181
ICE COVER: 44%0F TIME
0
0 % OCC, .40,
ICE COVER : 32% OF TIME
\ 6
8 5 $
20
Ov O
BLOCK: E8 4 8 12 18 T
191 I 8 b
N
NW
SW
O
Y e
0
o Le 0,
4. Ye °CC.
46° CO
C N
' se '030 %
O •
4".
st)
5
GRID SYSTEM NERF_S: I. En • E..10$ 2. E, • 4.32.105.1,142.n TOTAL ENERGY (SIGNIFICANTI/Im CREST WIDTH IN mK9/m 3. it - No. OF OCCURRENCES OF 6-HOUR REPRESENTATIVE WAVE 4. H - %WE HEIGHT IN METRES 0. T -WAVE PERIOD IN SECONDS 6. DASHED LINE - PERCENTAGE OF OCCURRENCES MCC.) 7. WAVE DIRECTION IS ALONG me-AXIS (SEE ARROW)
0 0
4,
BLOCK:G8 4 8 12 16T
1 91
8
1.91 El 8
91 21 8 0
1 91 21 8 17
APPENDIX FIGURE 5e: Directional Energy Spectra for May
N 5D° H
F 50°
SW
95°
c
5
NW
NOTES: GRID SYSTEM
I. En• • En.10-13 2. E. • 4.32.1133.7•H2.n TOTAL ENERGY (SIGNIFICANT) /1 m CREST WIDTH IN mKg/m 3. n — No. OF OCCURRENCES OF 6-HOUR REPRESENTATIVE WAVE 4. H — WAVE HEIGHT IN METRES
5. T— WAVE PERIOD IN SECONDS
6. DASHED LINE — PERCENTAGE OF OCCURRENCES (OCC.) 7. WAVE DIRECTION IS ALONG Ed.—AXIS (SEE ARROW)
01
0 0
BLOCK:C3 4 B 12 167
1 91 El 1 91 El 9 t
•
o En 0
02
B 01, §e 00„
V fg 'bo
11/4 5 Se
•
e 0
99
4 8 12 16 T BLOCK:C2
Cl.
191 21 B
BLOCK : C 4 4 8 a 16 T
APPENDIX FIGURE 6a: Directional Energy Spectra for June
BLOCK:C9 4 51 12 167
NOTES: GRID SYSTEM
I. Ee • 4.10-e 2. E. • 4.32. 1031,142. n TOTAL ENERGY (SIONIP1CANT)/1m CREST WIDTH IN re143/m 5. n - No. OF OCCURRENCES OF 13 -HOUR REPRESENTATIVE WAVE 4. M - WAVE HEIGHT IN METRES
5. T - WAVE PERIOD IN SECONDS 6. DASHED LINE - PERCENTAGE OF OCCURRENCES (OCC.) 7. WAVE DIRECTION IS ALONG E.° -AXIS (SEE ARROW)
APPENDIX FIGURE Directional Energy Spectra for June
BLOCK:D6 4 8 12 18 7
1 91 21 9 tr
BLOCK: D5 4 8 12 16
NW
SW
gdersili NOTES:
GRID SYSTEM
I. En • Eo.10-8
2. En • 4.32.104.T.H2.n TOTAL ENERGY (SIGNIFICANT)/ m CREST WIDTH IN mKgim 3. n — No. OF OCCURRENCES OF 6-HOUR REPRESENTATIVE WAVE 4. H— WAVE HEIGHT IN METRES
5. 7 —WAVE PERIOD IN SECONDS 6. DASHED LINE — PERCENTAGE OF OCCURRENCES (OCC.) 7. WAVE DIRECTION IS ALONG En.-AXIS (SEE ARROW)
191 21 13 0
4
m •
• aY
En
'000 leo 0
8 432
5 42 e
V
8
• Y0\
01' C'
(b4,
0 En.
IV
V el 8
- •
0 5- at
e ry0 20 •
er-, BLOCK D7
•
4 8 1 12 18 7
91 21 9 0
00
BLOCK:D8 4 8 12 M T BLOCK:D9 4 8 12 18 7
4
I>
0 4
APPENDIX FIGURE 6c: Directional Energy Spectra for June
N
NW
SW
5
so• 0
4
* 007
0
5 04
20 .
10
0 4 8 12 16 T
N
133 S if, .74.
BLOCK: DIO
.L 91 El 8 O
01
02
191 21 9 0
ICE COVER : 45% OF TIME
030 % 0 0 4-4111. en
°
En. In
4
111.11 I ?eit 0
✓ ° 01
• 02-
g
o . 8 %licc
BLOCK:F8
8- 0
-20 •'c
-10%
• Trt 1 o 4 8 12 M T
*" OBI
8 1 91 El
0
oo • e**
cf
• )
;.
0
02 * S
ICE COVER : 30% OF TIME
4 8 12 1ST
45°
NOTES: GRID SYSTEM
I. En'• En•10-6 2. 2, • 4.52.103.7.142.9 TOTAL ENERGY (SIGARFICANT)/1m CREST WIDTH IN rnM;gm 3. n - No. OF OCCURRENCES OF 6-HOUR REPRESENTATIVE WAVE 4. H- WAVE HEIGHT IN METRES S. T -WAVE PERIOD IN SECONDS
6. DASHED LINE - PERCENTAGE OF OCCURRENCES (OCC.) 7. WAVE DIRECTION IS ALONG En.-AXIS (SEE ARROW)
APPENDIX FIGURE 6d: Directional Energy Spectra for June
0
a oho
U
6
BLOCK: G8
\ 5- 44
20
1.11
I I
■■■■ 4 8 12 M T
If
8 1 911 2,1 I' 0 1 91 Z1
.L.9I 21 8 P
BLOCK:H8 4 8 12 16 T
o I 3 4 5 CI)
NOTES: GRID SYSTEM
I. Eo.• En'10-6 2. En • 4.32.105.T.H2.n TOTAL ENERGY (SIGNIFICANT)/1 m CREST WIDTH IN mKgim 3. n - No. OF OCCURRENCES OF 6-HOUR REPRESENTATIVE WAVE 4. H - WAVE HEIGHT IN METRES
5. T - WAVE PERIOD IN SECONDS 6. DASHED LINE - PERCENTAGE OF OCCURRENCES (OCC.) 7. WAVE DIRECTION IS ALONG En. -AXIS (SEE ARROW)
APPENDIX FIGURE 6e: Directional Energy Spectra for June
O .u3
Oa
de G
84
IV
1VOCP. •
5 al
BLOCK : C 2
191 al 9
0
0? ▪ S
50' SW
E. 4.. •I -41.
45" m 0.1
C N a)
-I,- , , co * ...1906. '030 % 8 2 •zr ,.. , -,.:.
• nTii '4-11 ■ 1 '0
4..P 0/ 0 .u3
4 5 l O 15,0 1 t§
9 *
ll o 4.
b 4, 5
•- • NOTES:
I. En'• En.10-5 2. En • 4.32.103.T.H2.n TOTAL ENERGY(SIGNIFICANT)/(m CREST WIDTH IN ml4a/m 3. n - No. OF OCCURRENCES OF 8-HOUR REPRESENTATIVE WAVE 4. H - WAVE HEIGHT IN METRES
BLOCK: CI
5. T - WAVE PERIOD IN SECONDS
8. DASHED LINE - PERCENTAGE OF OCCURRENCES (OCC.) 7. WAVE DIRECTION IS ALONG En.-AXIS (SEE ARROW )
O
GRID SYSTEM ati
to
APPENDIX FIGURE 7a: Directional Energy Spectra for July
NOTES: I. E.`• 2. E. • 4-32.103.7-H2.n TOTAL ENERGY (SIGNIFICANT)/Im CREST WIDTH IN mKg/m 3. n - No. OF OCCURRENCES OF 6-HOUR REPRESENTATIVE WAVE 4. H - WAVE HEIGHT IN METRES
5. T - WAVE PERIOD IN SECONDS 6. DASHED LINE - PERCENTAGE OF OCCURRENCES (OCC.) 7. WAVE DIRECTION IS ALONG En.-AXIS (SEE ARROW)
GRID SYSTEM
4 8 12 M T BLOCK:C7
8 91 El
1 91 21 8
0.> O
o En•
g % %cc
/. ti •
5
•W
O
a32- 96, • .ug
§
•
1 91 21
1 91 ZI 8
APPENDIX FIGURE 7b: Directional Energy Spectra for July
191 21 B 0
BLOCK:C6 4 8 12 113 T
43,
ay % \
S 0 0 so # • ._ .'001 .P _to
..0.1
-0 '030 % 0 2
to 0 3
590 N
0 En°
% OCC. A
07
• it
BLOCK : D7 4 8 12 16
BLOCK:D9 4 8 12 16 T
4 5
NOTES: GRID SYSTEM
I. E:• En.10-0
2. En • 4.32•103.T.H2.n TOTAL ENERGY(SIGNIFICANT)/1m CREST WIDTH IN mKgirn 3. n - No. OF OCCURRENCES OF 6-HOUR REPRESENTATIVE WAVE 4. H - WAVE HEIGHT IN METRES 5. T -WAVE PERIOD IN SECONDS
6. DASHED LINE - PERCENTAGE OF OCCURRENCES (OCC.) 7. WAVE DIRECTION IS ALONG En.-AXIS (SEE ARROW)
1 91 El 9
BLOCK: D6
4 8 12 18 T
APPENDIX FIGURE 7c: Directional Energy Spectra for July
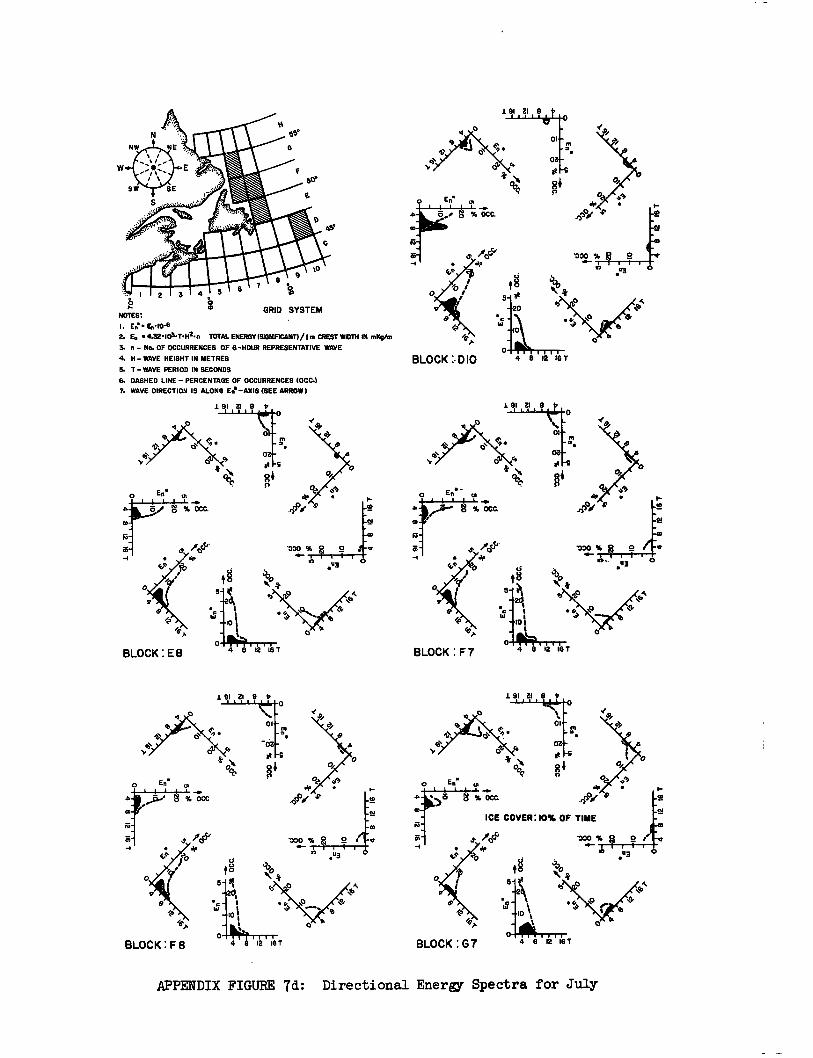
APPENDIX FIGURE 7d: Directional Energy Spectra for July
GRID SYSTEM NOTES: I. En.• En.10-6 2. E. • 4.32.1011,142.n TOTAL ENERGY (SIONIFICANT)/1 m CREST WIDTH IN enKo/en 3. n - No. OF OCCURRENCES OF 6-HOUR REPRESENTATIVE WAVE 4. H- WAVE HEIGHT IN METRES
5. T -WAVE PERIOD IN SECONDS
6. DASHED LINE - PERCENTAGE OF OCCURRENCES (OCC.) T. WAVE DIRECTION IS ALONG En-AXIS (SEE ARROW)
191 21 9
J. 91 El 9 b
ICE COVER:IO% OF TIME
0 12 16 T
191 21 9
•
BLOCK : F7
to F.5
APPENDIX FIGURE 7e: Directional Energy Spectra for July
GRID SYSTEM
1 2 3 4 5
NOTES:
I. En.• E.•10-6 2. E. • 4.32•103•T• H2. n TOTAL ENERGY ISIGNIFICANNI m CREST WIDTH IN mKg/m 3. n - No. OF OCCURRENCES OF 6-HOUR REPRESENTATIVE WAVE 4. H- WAVE HEIGHT IN METRES 3. T -WAVE PERIOD IN SECONDS
8. DASHED LINE - PERCENTAGE OF OCCURRENCES (OCC.) 7. WAVE DIRECTION IS ALONG EA.-AXIS (SEE ARROW)
8 1 91 21
0 .113
(1,
8 6 8 1 91 21
1 91 21 8 6
ICE
VQ
e
t 8 5 *
20
0
BLOCK: H5
lop% O o AA-
3
8 12 18
167 12 4 8 4 IS T 12 a BLOCK: H7 BLOCK:H8
AD 0 % OCC. 9,
ICE COVER:21S OF TIME
d• 46. '300 % O 0
5- it q.°
0
—10
O 1TI IIII
4 8 12 10 T
8 ;lb 4,1/4
/91 El 9
-•11c:
1,\ 3 4 5
0
0 * Oct..
4
O
at 9
0
BLOCK:C4 1
4 8 121 18 T
91 El 8 0
01 • •
/ 91 21 9 b
.14 % occ.
BLOCK:C5 4 8 12 18 T
5 20
A
sr
NOTES: GRID SYSTEM
I. En"• En.10-0
2. En • 4.32•103.1,H2.n TOTAL ENERGY (SIONIFICANT)/Im CREST WIDTH IN niKa/m 3. n — No. OF OCCURRENCES OF I3-HOUR REPRESENTATIVE WAVE 4. H — WAVE HEIGHT IN METRES 5. T — WAVE PERIOD IN SECONDS
8. DASHED LINE — PERCENTAGE OF OCCURRENCES (OCC.) 7. WAVE DIRECTION IS ALONG Er-AXIS (SEE ARROW)
APPENDIX FIGURE 8a: Directional Energy Spectra for August
NOTES: I. E..• En•106 2. E. • 4.32.103•T•H2•n TOTAL ENERGY(SIGNIFICANT)/)m CREST WIDTH IN mKo/m 3. n - No. OF OCCURRENCES OF 8-HOUR REPRESENTATIVE WAVE 4. H - WAVE HEIGHT IN METRES 3. T -WAVE PERIOD IN SECONDS 8. DASHED LINE - PERCENTAGE OF OCCURRENCES (OCC.) 7. WAVE DIRECTION IS ALONG 0-AXIS (SEE ARROW)
GRID SYSTEM
APPENDIX FIGURE 8b: Directional Energy Spectra for August

APPENDIX FIGURE 8c: Directional Energy Spectra for August
N
NW
SW
46°
C
5
NOTES:
I. E.'• E.•10.6 2. E. • 4.32.105.7,112.n TOTAL ENERGY (SOMFICANT)/1m CREST WIDTH IN mKg/m 3. n — No. OF OCCURRENCES OF 6-HOUR REPRESENTATIVE WAVE 4. H— WAVE HEIGHT IN METRES
5. T — WAVE PERIOD IN SECONDS
6. DASHED LINE — PERCENTAGE OF OCCURRENCES (OCC.) 7. WAVE DIRECTION IS ALONG En. —AXIS (SEE ARROW )
*it
GRID SYSTEM
to°
50°
01
OS-t-G
8
1 911 0
_ ,(
'000 % 0 0
BLOOK:D6
0
BLOCK:D8 4 8 12 16 T
1 91 DI 8
01
02
a2
0 0
% OCC • 5C1
u
0 8
.330 % .111-
0
0
ci? NOTES:
GRID SYSTEM
5- 0 20
I. En" • En.10-6
2. En • 4.32.105.7.1(2.n TOTAL ENERGY (SIGNIFICANT)/ I m CREST WIDTH IN mKp/m 3. n - No. OF OCCURRENCES OF 6-HOUR REPRESENTATIVE WAVE 4. H - WAVE HEIGHT IN METRES BLOCK: DIO 4 8 12 5. T - WAVE PERIOD IN SECONDS 6. DASHED LINE- PERCENTAGE OF OCCURRENCES (OCC.) 7. WAVE DIRECTION IS ALONG En.-AXIS (SEE ARROW)
3 4
16 T
BLOCK:ES 4 8 12 T
% OCC. N
N
C' l'OC'
*.;
0 „ „ 4 8 12 16 T
APPENDIX FIGURE 8d: Directional Energy Spectra for August
APPENDIX FIGURE 8e: Directional Energy Spectra for August
GRID SYSTEM NOTES:
I. En.• E••10-6 2. E• • 4.52.104•T• HG. n TOTAL ENERGY (SIGNIFICANT) /1 m CREST WIDTH IN mKg/m 3. n — No. OF OCCURRENCES OF 8-HOUR REPRESENTATIVE WAVE 4. H — WAVE HEIGHT IN METRES
S. T —WAVE PERIOD IN SECONDS
8. DASHED LINE — PERCENTAGE OF OCCURRENCES (OCC.) 7. WAVE DIRECTION IS ALONG 0—AXIS (SEE ARROW)
BLOCK : H 5 4 8 12 16 T
BLOCK: H7 0
4 8 12 I6 T
• •
1 91 21 9
5- )2
-20
4'. 4-
•
g 4'0 0 1\ 4. ,t5'
0 04 4
▪
G
8+ 0/
P 0 .og •
.45),
0
1 91 21 8 V
1 91 21 8
1 91 21 9
En. o
5
NOTES: GRID SYSTEM
I. En.• 4.1045
2. E. • 4.32.103.7.112on TOTAL ENERGY (S1ONIFICANT)/tm CREST WIDTH IN mKo/m 3. n — No. OF OCCURRENCES OF 6-HOUR REPRESENTATIVE WAVE 4. H — WAVE HEIGHT IN METRES 5. T —WAVE PERIOD IN SECONDS
6. DASHED LINE — PERCENTAGE OF OCCURRENCES (OCCJ 7. WAVE DIRECTION IS ALONG En1—AXIS (SEE ARROW)
•
5 20
0
0 BLOCK:CI 4 8 12 16 T
1 91 1
/ 81 8 1 91 al 8
APPENDIX FIGURE 9a: Directional Energy Spectra for September
NOTES: 10 GRID SYSTEM
I. En•• En'1043 2. En .4.32•103.T.H2-n TOTAL ENF-RGY(SIGNIFICANT)/Im CREST WIDTH IN map/rn 3. n - No. OF OCCURRENCES OF 6-HOUR REPRESENTATIVE WAVE 4. H- WAVE HEIGHT IN METRES
6. T -WAVE PERIOD IN SECONDS
6. DASHED LINE - PERCENTAGE OF OCCURRENCES (OCC.) 7. WAVE DIRECTION IS ALONG En.-AXIS (SEE ARROW)
o o % ••■•
O
BLOCK:C7 4 6 12 16
91 al 9
4 8 12 18T
1 91 Z1 8 ty
•
BLOCK:C8
/C1C5' -I • 41,
0'
BLOCK:C9 1111
4 8 12 16 T
APPENDIX FIGURE 9b: Directional Energy Spectra for September
5- -20
0
BLOCK:DS 4 8 12 16 T
8 V 191 El
8 5-# -20 17 _
411k. , 4 8 12 ~ I6T
0
•
0
GRID SYSTEM
E0 • E0•10-6 E,, • 4.32.103.T.H2•11 TOTAL ENERGY (SIGNIFICANT) /1 m CREST WIDTH IN mKohn
3. n - No. OF OCCURRENCES OF 6-HOUR REPRESENTATIVE WAVE 4. H- WAVE HEIGHT IN METRES 5. T - WAVE PERIOD IN SECONDS 6. DASHED LINE - PERCENTAGE OF OCCURRENCES (OCC.) 7. WAVE DIRECTION IS ALONG En.-AXIS (SEE ARROW)
4 8 12 M T
APPENDIX FIGURE 9c: Directional Energy Spectra for September
1 2 3
oids1111100
95.
50°
qS
C
N
NW
SW
BLOCK : DIO
4 8 12 18 T
1 91 21 8
BLOCK:F8 4 8 12 le
p.
NOTES: GRID SYSTEM
I. En.• En.10-0
2. En • 4.32.103.7442.n TOTAL ENERGY (SIGNIFICANT)/1 in CREST WIDTH IN mKq/m 3. n - No. OF OCCURRENCES OF 8-HOUR REPRESENTATIVE WAVE 4. H - WAVE HEIGHT IN METRES 3. T - WAVE PERIOD IN SECONDS 8. DASHED LINE - PERCENTAGE OF OCCURRENCES (OCC.) 1. WAVE DIRECTION IS ALONG En -AXIS (SEE ARROW )
1 91 El 8
APPENDIX FIGURE 9d: Directional Energy Spectra for September
191 ZI 8
0
"330 % °
.o3
qb
a020 V
16?
BLOCK:88
<1,
0 0
4 8 12 16 T
l'oc-'" ol•
8 4 12 161' BLOCK:H7 BLOCK:H8 4 8 12 16 T
NOTES: GRID SYSTEM
I. En • En.10-6 2. En • 4.32•103•T•H2.n TOTAL ENERGY ISIGMFICANN m CREST WIDTH IN mKg/m 3. n — No. OF OCCURRENCES OF 6 -HOUR REPRESENTATIVE WAVE 4. H — WAVE HEIGHT IN METRES
5. T — WAVE PERIOD IN SECONDS
6. DASHED LINE — PERCENTAGE OF OCCURRENCES (OCC.) 7. WAVE DIRECTION IS ALONG Er:LANUS (SEE ARROW)
BLOCK:H5
4 8 12 M T
BLOCK : H6
4 8 12 16 T
APPENDIX FIGURE 9e: Directional Energy Spectra for September
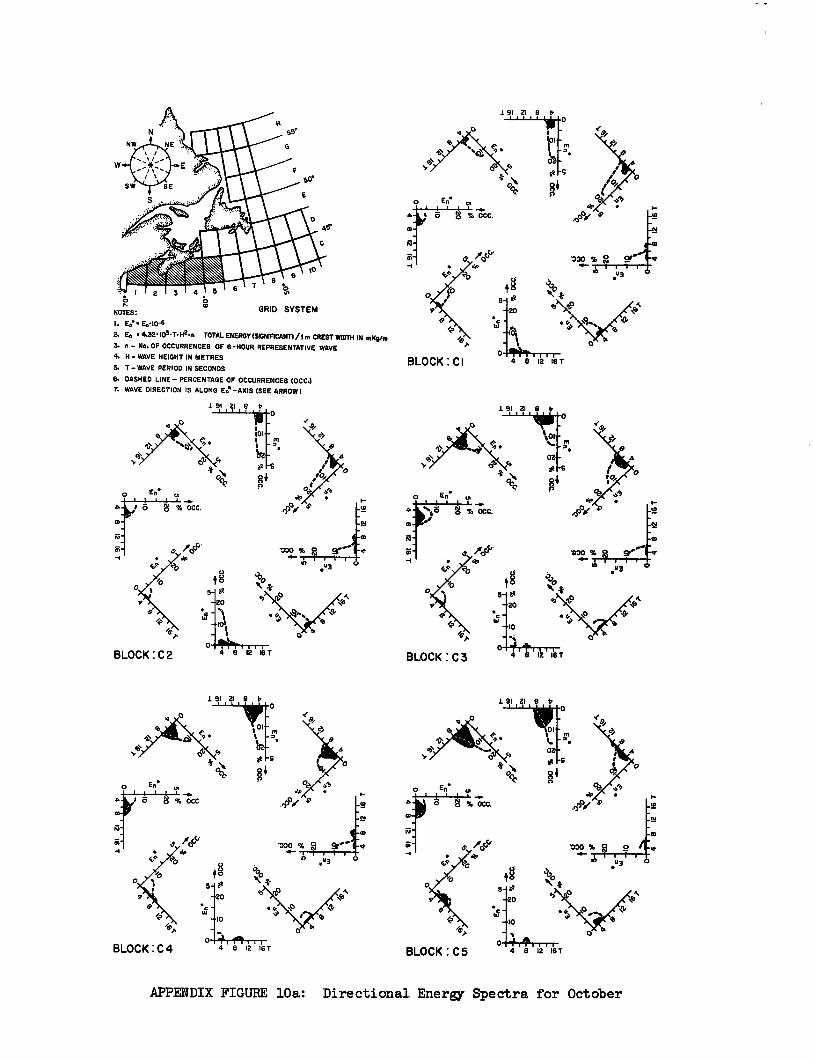
APPENDIX FIGURE 10a: Directional Energy Spectra for October
GRID SYSTEM NOTES:
I. En'• En.10-5 2. En • 4.32•103.T.H2*(1 TOTAL ENERGYISIGNIFICANTI/Im CREST WIDTH IN mKg/m 3. n - No. OF OCCURRENCES OF 6-HOUR REPRESENTATIVE WAVE 4. H - WAVE HEIGHT IN METRES
5. T -WAVE PERIOD IN SECONDS
6. DASHED LINE - PERCENTAGE OF OCCURRENCES (OCC.) 7. WAVE DIRECTION IS ALONG En.-AXIS (SEE ARROW)
191 21 0
4 12 167 BLOCK:C4
s'o '3
% 0CC.
5 0
V 20 0 RP
• IY
• 10 ti
BLOCK:C3 0
4 S 12 16 T
4 8 12 16 T
000 %
t§
5 0 0) w
0 0
191 21 H
•03
g 1lb 5 * 0
20
4 8 12 16T
I 2 3 4
BLOCK:C9 4 8 12 16T
GRID SYSTEM NOTES:
I. E: • E. 2. En • 4.32.1034.0.n TOTAL ENERGICSIGNIFICAMTVIrn CREST WIDTH IN 014/0
3. n - Ne. OF OCCURRENCES OF 6-HOUR REPRESENTATIVE WAVE 4. H - WAVE HEIGHT IN METRES
5. T - WAVE PERIOD IN SECONDS
G. DASHED LINE - PERCENTAGE OF OCCURRENCES (OCC.) T. WAVE DIRECTION IS ALONG Ee -AXIS (SEE ARROW )
APPENDIX FIGURE 10b: Directional Energy Spectra for October
J. 91
1 9
F. NOTES: I. E:• En•10-0 2. E. • 4.32.105•T•10.n TOTAL EMERGY(SIONFICANT)/Im CREST WIDTH IN rnSg/n) 3. n — No. OF OCCURRENCES OF 6-HOUR REPRESENTATIVE WAVE 4. H — WAVE HEIGHT IN METRES 5. T —WAVE PERIOD IN SECONDS 6. DASHED LINE — PERCENTAGE OF OCCURRENCES (OCC.) T.. WAVE DIRECTION IS ALONG E..—AXIS (SEE ARROW)
GRID SYSTEM
APPENDIX FIGURE 10c: Directional Energy Spectra for October
BLOCK:ES
91 I 8 4
• 0
BLOCK : F7
NOTES: GRID SYSTEM
1. En • En•106 2. En • 4.32•103.T.H2.n TOTAL ENERGY tmaric.Altrn /1 m CREST WIDTH IN mIto/m 3. n - No. OF OCCURRENCES OF 8-HOUR REPRESENTATIVE WAVE 4. H - WAVE HEIGHT IN METRES 5. 7 -WAVE PERIOD IN SECONDS 8. DASHED LINE - PERCENTAGE OF OCCURRENCES (OCC.) 7. WAVE DIRECTION IS ALONG En° -AXIS (SEE ARROW)
APPENDIX FIGURE 10d: Directional Energy Spectra for October
.T+
NOTES: GRID SYSTEM
I. En'• En•I0-6 2. E. • 4.32•IOO•T•H2•n TOTAL EKRI3Y(SIONIFICANTIhm CREST WIDTH IN mKg/rn 3. n — No. OF OCCURRENCES OF 0-HOUR REPRESENTATIVE WAVE 4. H — WAVE HEIGHT IN METRES S. T — WAVE PERIOD IN SECONDS
13. DASHED LINE — PERCENTAGE OF OCCURRENCES (OCC.) 7. WAVE DIRECTION IS ALONG Ee—AXIS (SEE ARROW)
BLOCK:He 4 8 12 1:17
APPENDIX FIGURE 10e: Directional Energy Spectra for October
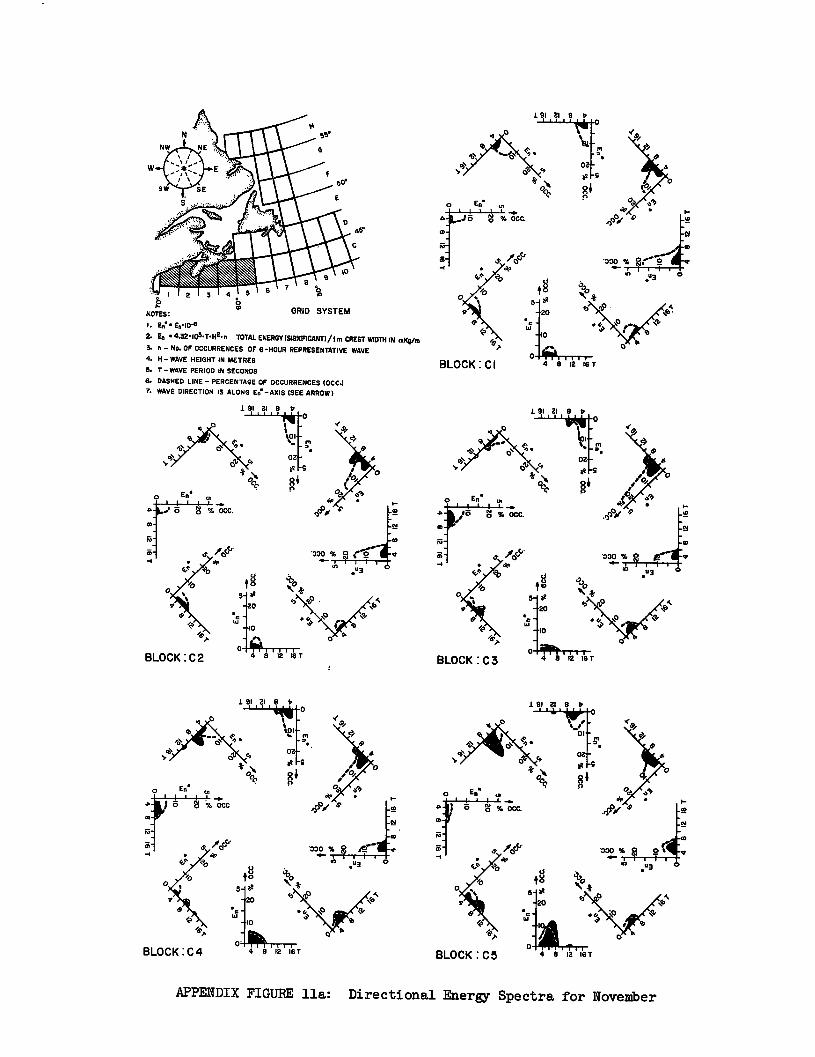
APPENDIX FIGURE lla: Directional Energy Spectra for November
GRID SYSTEM NOTES:
1. En.• 4•10-8
2. En • 4.32•103.7412.n TOTAL ENERGY (SIGNIFICANT)/fm CREST WIDTH IN mKo/m 3. n - No. OF OCCURRENCES OF 8-HOUR REPRESENTATIVE WAVE 4. H - WAVE HEIGHT IN METRES 5. T -WAVE PERIOD IN SECONDS 8. DASHED LINE - PERCENTAGE OF OCCURRENCES (OCC.) 7. WAVE DIRECTION IS ALONG Ed.-AXIS (SEE ARROW)
8 1 91 al
••■••
% OC C . A
B
4 8 12 18 T BLOCK:C3
N NW
SW
%0
4
BLOCK :C2 4 8 12 M T
0
4 01
•
00 on
* 0c,
N
990 % ° 5... 4-
191
0
o E0 u,
oz • a ot
.r,",
0
.000 •
(0•
O °'2.2 N
5 at
20 V
/ 91 21 8 0
co
1 91 21 8
,tetr
5- * t .12 20
•
4 8 12 18 T
4 8 12 16 T
191 2.1 9 0 MI 0
02•
g
01,
1 91 El 8
BLOCK:C9 4 8 12 16 T
1 91 21 B
• 02 e1-9
0
% OCC. .413,
*030 % 2
10 .03
NOTES: GRID SYSTEM
I. E. E,..10-6 2. 8, • 4.32•101.T.H2.4 TOTAL ENERGY ISIONIFICANT)/1 m CREST WIDTH IN mKpAn
3. n - No. OF OCCURRENCES OF 8-HOUR REPRESENTATIVE WAVE
4. H - WAVE HEIGHT IN METRES
0. T -WAVE PERIOD IN SECONDS
6. DASHED LINE - PERCENTAGE OF OCCURRENCES (OCC.)
T WAVE DIRECTION IS ALONG En -AXIS (SEE ARROW)
BLOCK: C6
APPENDIX FIGURE llb: Directional Energy Spectra for November
0 I
NOTES: I. En' • En'10-6 2. En • 4.32.103.T.H2.n TOTAL ENERGY (ZIONIFICANT) /I m CREST WIDTH IN mKp/m S. n — No. OF OCCURRENCES OF 6-HOUR REPRESENTATIVE WAVE 4. H— WAVE HEIGHT IN METRES 5. T —WAVE PERIOD IN SECONDS S. DASHED LINE — PERCENTAGE OF OCCURRENCES (OCC.) 7. WAVE DIRECTION IS ALONG En.— AXIS (SEE ARROW 1
1.> 0
S_ 0
20 • u;
4 8 ' 12 161
1 91 21 8 4
44> •
„p0,
/106'. '030 % nh.
.u3
So
BLOCK:D7
ti
N
NW
SW
H 55'
G
F 50°
49°
C
5
GRID SYSTEM
0
0 8 37
20
10
4 8 12 16 T BLOCK:D8 0
5-
1'91 21 8 a
APPENDIX FIGURE 11c: Directional Energy Spectra for November

APPENDIX FIGURE lld: Directional Energy Spectra for November
GRID SYSTEM NOTES: I. En.• 2. En • 4.52.103•T• H2. n TOTAL ENERGY (SIGNIFIcANT)/ m CREST WIDTH IN m14/0 3. n — No. OF OCCURRENCES OF 6-HOUR REPRESENTATIVE WAVE 4. H — WAVE HEIGHT IN METRES
T — WAVE PERIOD IN SECONDS 6. DASHED LINE— PERCENTAGE OF OCCURRENCES (OGG.) 7. WAVE DIRECTION IS ALONG En•—AX1S (SEE ARROW)
BLOCK: ES 4 6 12 16 T
0
0
O 0
el SI 9
a • 0
•
O, 02
# • 5 % °c
-
c
V
BLOCK: F8
OS C, §
▪
4 .• , • .430,
ei
53
Er+ o 104 '000 %
0
0 •
BLOCK : F7 4 '1'2 ' IST
• 20
1 91 21 8
1 91 21 8 1r
BLOCK: H7 4 8 12 16 T
"DO %
DI
kru3
• 0
0 C' tt 4 )4
P3 0,
7
NOTES: GRID SYSTEM
I. E. Ele1043 2. E. • 4.32•103.T.H2.n TOTAL ENERGY(SIGNIFICANT)/fm CREST WIDTH IN mKg/m 3. n — No. OF OCCURRENCES OF 6-HOUR REPRESENTATIVE WAVE 4. 41 - WAVE HEIGHT IN METRES
S. T - WAVE PERIOD IN SECONDS 6. DASHED LINE - PERCENTAGE OF OCCURRENCES (OCC.) 7. WAVE DIRECTION IS ALONG Ee-AXIS (SEE ARROW)
APPENDIX FIGURE lle: Directional Energy Spectra for November
0 En.
1 91 ZI 14) 0
101 m 4:ro sn
02 Nq... 4
* G O_N4
fie
0
0
t),
BLOCK:CI
5
BLOCK : C5 4 8 12 18T
NOTES: S: GRID SYSTEM
I. En • En.10-6 2. En • 4.32•103.T.H2.n TOTAL ENERGY(SIGNIFICANT)/1m CREST WIDTH IN mKg/m 3. n - No. OF OCCURRENCES OF 6-HOUR REPRESENTATIVE WAVE 4. H - WAVE HEIGHT IN METRES 5. T -WAVE PERIOD IN SECONDS 6. DASHED LINE - PERCENTAGE OF OCCURRENCES (OCC.) 7. WAVE DIRECTION IS ALONG En.-AXIS (SEE ARROW)
APPENDIX FIGURE 12a: Directional Energy Spectra for December
BLOCK:C6 4 8 I2 18 17,
NOTES: GRID SYSTEM
I. En • En•10-G 2. En • 4.32•I03•T•H2•n TOTAL ENERGY (SIGNIFICANT)/1 m CREST WIDTH IN mlio/m
3. n - No. OF OCCURRENCES OF 8-HOUR REPRESENTATIVE WAVE
4. H - WAVE HEIGHT IN METRES
T - WAVE PERIOD IN SECONDS
8. DASHED LINE - PERCENTAGE OF OCCURRENCES (OCC.) 7. WAVE DIRECTION IS ALONG a-AXIS (SEE ARROW)
BLOCK:C7
4 8 12 113
BLOCK:C8
4 8 12 18 T
APPENDIX FIGURE 12b: Directional Energy Spectra for December
191 21 8 4 1 0
01
OS -
se c 8i
fat at N
20 •
4 8 12 18 T
191 21 8
.43 0
0
191 21 8
GRID -SYSTEM
I. NOTES:
E:• E..10-9 2. E. • 4.32.105.7412.n TOTAL EKTERGY (SIGNIFICANT) / m CREST WIDTH IN mKg/m 3. n - No. OF OCCURRENCES OF -HOUR REPRESENTATIVE WAVE 4. H- WAVE HEIGHT IN METRES
T -WAVE PERIOD IN SECONDS
G. DASHED LINE - PERCENTAGE OF OCCURRENCES (OCC.) 7. WAVE DIRECTION IS ALONG En.-AXIS (SEE ARROW)
191 21 9 P 0
4
Se
0 61, 4
4- G oil
'550 % 0
to
BLOCK: D6
APPENDIX FIGURE 12c: Directional Energy Spectra for December
S 50°
E
NW
J1011*- 0441000
C
191 SI 9 t,
NOTES: GRID SYSTEM
I. E.' • E..10-8 2. E. • 4.32.103.7.H2.n TOTAL ENERGY (SIGNIFICANT) /1 m CREST WIDTH IN mKg/m 3. n - No. OF OCCURRENCES OF 6-HOUR REPRESENTATIVE WAVE 4. H- WAVE HEIGHT IN METRES
S. -WAVE PERIOD IN SECONDS
6. DASHED LINE - PERCENTAGE OF OCCURRENCES (OCC.) 7. WAVE DIRECTION IS ALONG Er-AXIS (SEE ARROW
APPENDIX FIGURE 12d: Directional Energy Spectra for December
/e,
BLOCK : H6
BLOCK:H7 4 8 12 16 T
NOTES: GRID SYSTEM
I. En' • En•10-8 2. E. • 4.32•103.T.H2.• TOTAL ENERGY (SIGMFICANT1/1 m CREST WIDTH IN mKg/m
3. n — No. OF OCCURRENCES OF 6-HOUR REPRESENTATIVE WAVE
4. H— WAVE HEIGHT IN METRES
6. T —WAVE PERIOD IN SECONDS
G. DASHED LINE — PERCENTAGE OF OCCURRENCES (OCC.)
7. WAVE DIRECTION IS ALONG En.—AXIS (SEE ARROW)
$ . .i
(b` OZ
N, cb C. * -g
* Nk 4 CE■
4' P
o En* cr. A• • I c'e 6'6
A
443, ° 0 ••• 8 % occ.
1000 '330 % 8 1111111.111W • dp al 1.0 .113
APPENDIX FIGURE 12e: Directional Energy Spectra for December
1 2 1
4
a 12
NOTES: — DIRECTION INTO WHICH WAVES PROPAGATE — IN DEGREES
H— WAVE HEIGHT IN METRES
T— WAVE PERIOD IN SECONDS.
— ONE OCCURRENCE REFERS TO A SIX HOUR MEAN
APPENDIX FIGURE 13a: Directional Wave Statistics for January
T <51 6 I 8 1 10 1 12 1 14 1>15 I 7 <5 1 6 1 8 I 10 I 12 I 14 1 >151 E
BLOCK: CI
H >10
9
tr) 8 N 7 N 1 5 ▪ 4 • 3 PI 2
>10 9
in 6
V 76 1 5
'en 4 r. 3 A 2
>10 9 8
0 cm 7 N 6 1 5 N 4 p- 3 52z
>10 • 9
8 Prit 7 N 6 I 5 in 4
71<5 1 6 1 6 I 10 1 12 1 14 I>i5 E 7 <5 1 6 1 8 I 10 1 12 1 141 >151 I
BLOCK: C3
T <S1 6 1 8 1 10 1 12 I A 1.15 E T <51 6 1 8 1101 12 1141>151 £
BLOCK: C 2
H >10
9 N 8 N (8- I 5 in 4
2
>10 9
fi) 8
1 5 'en 4 • 3 83 2
>10 9
to N 7
IS 'en 4 r- 3 D. 2
>10
fri 7
N 6 1 5 514
rci
745 1 6 18 1 101 12 1 141>15 E T<5I 6 I 8 I ioliz I t41>i5IE
BLOCK : C 4
N.
to
ro
112 5
° -1
57 5°
20
2 5°
- 24
7 5°
8,
9
g.) N
H
9 al a N 7 N 6 I 5
1,3 en 2
1
>10 9
1 5 N N, 4 o- 3 W 2 11
2 5°
-157
5°
20
2 5°
- 24
7 5°
4 3 1 9 1
1 1 2 2 3
1
22 5°
- 67
5°
112 5
° -1
57.5
° 29
2.5°
- 3
375°
2 2 1 12 10 2 9 1
1 2 1
1 2 1
4 19 4
7
2 2 6 2
in N 7
Lr) 4
N
J 5
A 32
>10 9
rs1 6 1 5
en 4 1, 3 (8 2
>10 9
in 6
N 7 6 I 5 N 4 r■ 3 5' 2
>10 o 9 ▪ B f7g, N 6 1 5
en 4 is:; gi 2
1
>10 9
in 8
0 N 7 N 1 5 N 4
3 52 2
>10 • 9
6
Pi 7 N 6 1 5
to 4
1 2 14 10 2 10 1
1 6 3 9 1
1 2 1
3 3 6 2
1 2 1 3 1
3 18 4 1
7
2
112.5
°-157
5°
202.
5°- 24
7 5°
2
5°- 33
7 5
2 64 1
1 1 1 1 2
2 1 1
1 3
2 1 1 3 1
17 16 1 7
23 4
2
2 1
1 1 1 1
3 1 1 1
2 1 3 1 8 12 1 6
1 1 2 2
1 3 2 15 14 9 1
1 5 2 3 1
1 5 3 3 1
1 1
2 2 1
NOTES: — DIRECTION INTO WHICH WAVES PROPAGATE—IN DEGREES
H— WAVE HEIGHT IN METRES T— WAVE PERIOD IN SECONDS
— ONE OCCURRENCE REFERS TO A SIX HOUR MEAN
APPENDIX FIGURE 13b: Directional Wave Statistics for January
71451 6 1 8 1 10 1 1 14 1.15 E 1' 451 61e110I12lKI.IME
BLOCK C5 TI45I oils 1 10I1214I.1512 71 4 51 6181101121141,151E
BLOCK: C6
1 3 1 3 1
22 5°-
67
5°
112 5
°-
i57
5°
202 5°
- 24
7 5°
rt-
112
50-1
57
5°
202
5°- 24
7 5°
H5
>10 9
N 8 N 7 ni I 5 in 4 ft: 3 2 2
I
SO 9
I 5 N 4 t- 3 ta 2
9
N7 2 6 1 5 th 4
4.) 3 2
>40 ▪ 9 w 8
7 1 5
4
Ft, :
H >10
9 ■11 8 C9 7
1
5 en 3
s0 9
N ;
(2.1 6 5
tn 4 4,3 tO 2
>10
9 ■n N 7 2 6 15
an
▪
2
9 al a
7 N 6 1 5
in 4
cri
1 3
2 2 4 7 1
14 18 1 1
2
2 1 2
1 7 1 7 10 2 6 1 1
3 1 1
1
2 1 2 1
1 2
1 3
1 2 2 4 10 1
14 16 1 1
1 4 9 2
10 7 1 3 1 1
1 2 2
1 9 6 1 6 2 2
22
5°- 67
5°
NO
N 7
1 5 tr, 4 r■ 3 u.2 2
NO • 9 ,n 8 N7 N 1 5
Fn 4
ri7-q
fr.-Tcr-i-rErr 10 1 12 1 14 >i 5 E 74516181101121141.151E
BLOCI< : C7
2 3 3
112 5
° - 1
57 5°
20
2 5°
- 24
7 5°
1
1 3 2
1 6 5 5 13 5 7 5 1 1
1 1 1 4 2 1
1 1 1
TI451 6181101121141.1511 r<51616101121141•IsIr
BLOCK C8
112
50-1
57 5°
390 9
N8 N C9 6 1 5 '64 I% 3 M2
>10 9
N8 N N. 6 1 5
1.11 4
2 32
>10 9
; 6
1 5 4
r, 3 2
s0 9
N 8 N 7
6 1 5
'N 4 1.- 3 _ 2
340 • 9 en 8
N6 I S in 4 n. 3
202
5°- 24
7 5°
1 2 4 3
2
2
1 1 1 1
8 7 1 6 4 3 2
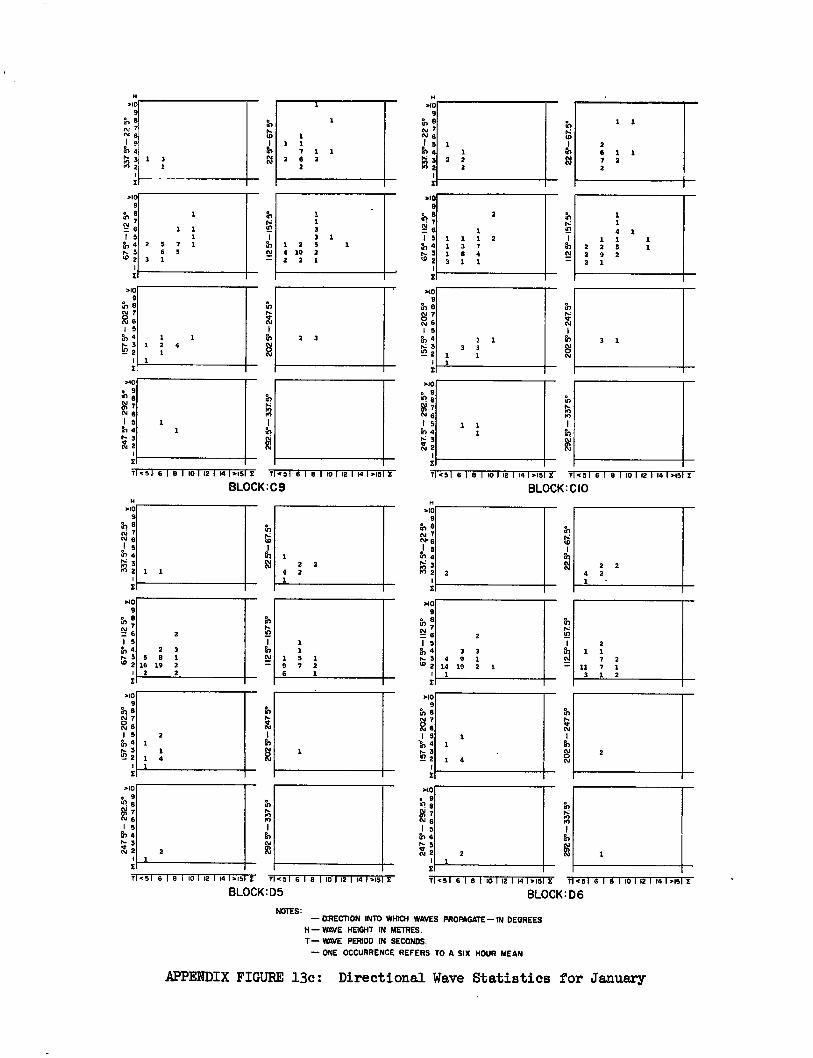
2 1
NOTES: — DIRECTION INTO WHICH WAVES PROPAGATE—IN DEGREES
H— WAVE HEIGHT IN METRES. T— WAVE PERIOD IN SECONDS.
— ONE OCCURRENCE REFERS TO A SIX HOUR MEAN
APPENDIX FIGURE 13c: Directional Wave Statistics for January
T 451.6191101121141.49 I 11<5161e1101121141.191s
BLOCK: C 9
T1<51 6 1 8 1 10 1 12 1 14 1,15 E T <S1 6 1 8 110 1 12 1 14 1.151 E
BLOCK: CIO
.10 9
NI 6 2 1 1 5 1 to 4 3 3
1 9
5 7
1 2 t-3 10 2
4 14
9 19
1 2 1
6 1 1
2 1 1
7 2 11 7 1
3 1 2
I12.
5°-1
57 5°
2
H .10
9 rn 8 N 7 cs.6
.1 5 gn 4 K 3 M 2
1125
°-157
.5°
H .10
9 al 8 N 7 Al 1
rg', 4 N 3 2 2
.10 9
3,
1 5 N 4 N 3 (5 2
T <5T 6 1 8 1 10 1 12 1 14 1.15 Tl<5 1 6 1 8 1 10 1 12 1 14 1.151E
BLOCK : D5
11.516161 101 121 141.15Z 1451 612110112 1 141.1512:
BLOCK: D6
H .10
9 3, 8 rs, 7
6
1 5 11/ 4
3 M 2
1 1 1
7 1 1 2 6
.10 9
• 1
.10 9
2
N 1 1 3 1 1 5 1 3 1 1 5 1 1 1 2 N 4 2 S 7 1 1 2 5 1 N 4 1 3 7 N 3 6 5 4 10 2 N 3 1 8 4 to 2 3 1 2 2 1 19 2 3 1 1
.10 9
N 6 8 7 N 6 1 5 to 4 N 3 '8 2
I
H2
5°-
157
5°
202 W-
247
5°
112 W
-157
.W
.10 • 9 41 8 g
6 I 5
in 4 3
rg 2
1 1 4 1
1 1 2 2 5 2 9 2 2 1
N 4 N 3 ul 2
.10 • 9
M 7 N 6 1 5 in 4
1 1 1 2 4
1 1
2 3
1
3 1
t•-•
.10 9
in 8 cm 7
cv 1 5 1
-a, 4 1 pN 1 N 3
N 2 1 4 1
202 5°- 24
7 5°
.10 9 8
N7 s
1 5 to 4 N
2
E
M 7 6 1 5
tn 4
.10 • 9 go. 8
2 1
1 1 4 1
In
.10 • 9 0. 8
6 1 5
31, 4 r■ 3 N 2
1 1 2
1 2 2
4 2 1
2 2 4 2 I -
2
2 3 5 8 1
16 19 2 2 2
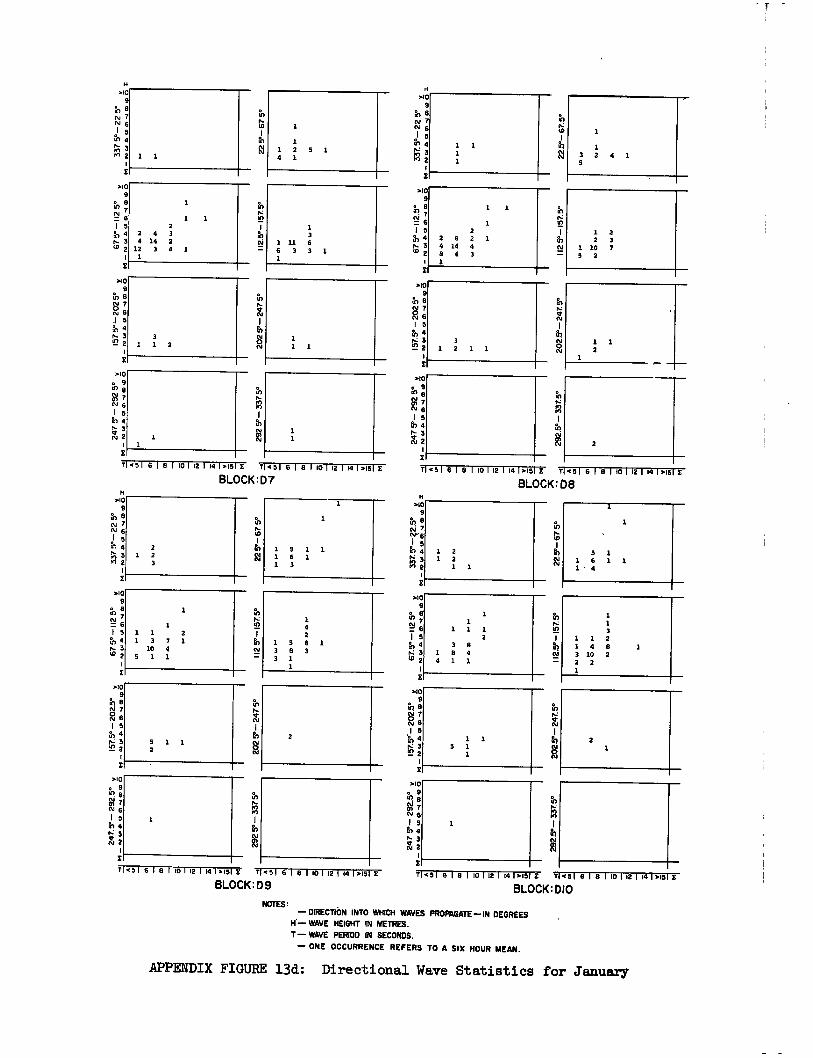
1 1 2 5 1 4 1
1
1 3 2 4 1
>10 9
(7.1 6 1 5
in 4 r.,;) 3 0) 2
E
H 010
9 to N 7 N 6 1 5
rn 4 0z 3 M 2
20
2.5°- 24
7.5
°
202 5°- 247 5°
cm cm
112
.5°-
157.
5°
010 9
8
N 1 5
4 0. 3 <3 2
E
>10 9
U.) 71
.1 5 4
.10 • 9 07
ru 6
6 1 5
3 c3Z 2
010 9
rn N7
26 1 5 N 4
3 1.1 2
1
010 O 9 e
I, 3 cl• N 2
1 1 2
2 4 3 4 14 2 12 3 4 1 1
1 1 2 3
1 2 1 1
2
010 9
112
5° -
15
7. 5°
1 11
6 3 1
1 3 6 3 1
N fV ;
1 5 4
0. 3 2 1
2 4 8 1
6 14
4
2 2 4 3
1
1
1
1
1 5
1 2 2 3
10 7 2
• 1 5 1 1 1 6 1 1 3
11
2 5° -
15
7. 5°
2 1
1
5 1 1 6 1 1 1 • 4
112.5°-1
57.5
°
1.4
(N
▪
I
ppI
Nf
1 1 3
1 1 2 1 4 8 1 3 10 2 2 2 1
1
1 1 1
2 3 8
1 8 4 4 1 1
010 • 9 <1 8 V7 N g 1 5
En 4 3
ro 2
010 9
N 8 N ".6
5 in 4 r■ 3
010 9
1 5 N 4 0: 3 t02
010 9
th a
: 5
1, 4
010 9
1 1 5
th 4 1 1
1 3 7
10 4 : 5 1 1
010 9
rft a N 2 6 1 5
4
4) 3
V 7 6
1 5 4
N 3 N 2
>10 • 9
8
202 5°- 247 5
°
H .10
9 e
N 7
r! 5 in 4
(71 6
2
41
2 1 9 8 1 3 8 3 3 1
1
2 5 1 1
H
TI•c51 6 1 8 1 10 112 1 14 1015 E T <51 6 1 8 I io 1 12 1 14 1.151 E
BLOCK :D7 T <51 6 1 8 1 10 1 12 1 14 1015 E T <51 6 1 8 1 10 112 1 14 1 0151E
BLOCK: D8
71.051 6 1 8 1 10 r12 1 14 1015 E r.516151151121141,4511
BLOCK : D9 T<516181101121141015 E 71.516181101121141015 E
BLOCK: DIO
NOTES: ' — DIRECTION INTO WHICH WAVES PROPAGATE—IN DEGREES
H— WAVE HEIGHT IN METRES.
T— WAVE PERIOD IN SECONDS.
— ONE OCCURRENCE REFERS TO A SIX HOUR MEAN.
APPENDIX FIGURE 13d.: Directional Wave Statistics for January
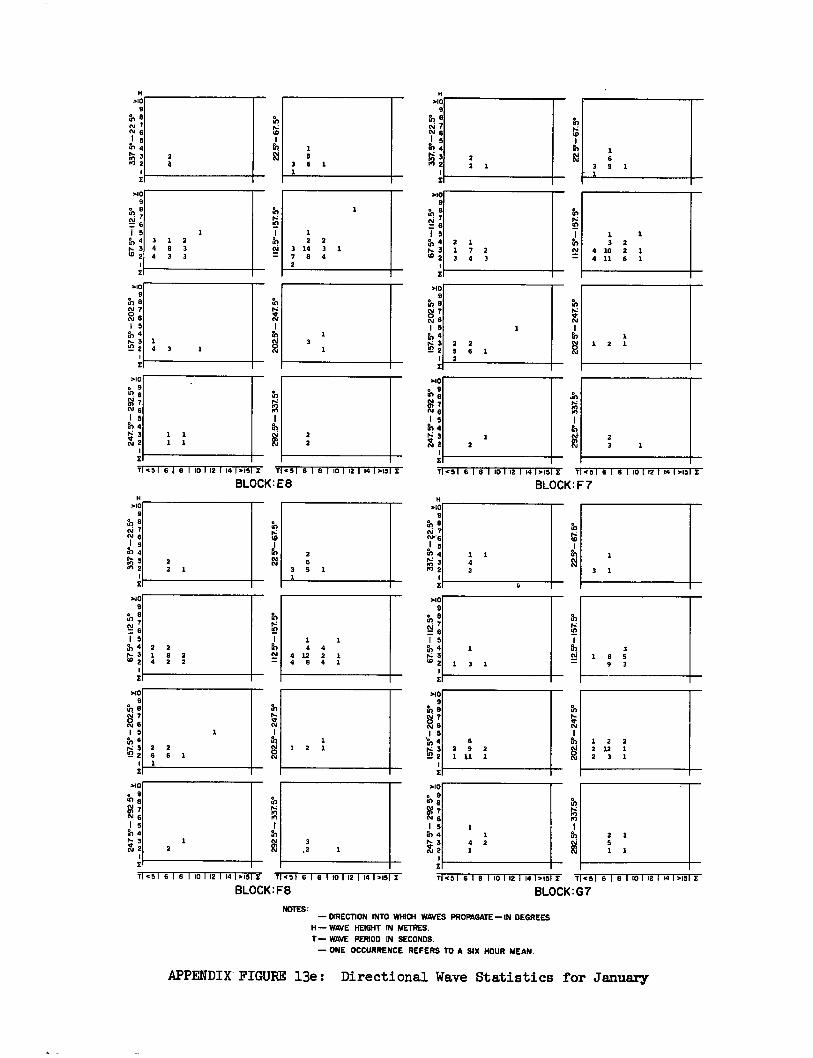
20
2.5
- 2
4 7.5
°
H .10
9 th
1 5
N 61 6
u+4 7- 3
6,
.10 9
Ili 6 15 1 1 N 4 3 1 2 2 7- 3 4 8 3 3 14 (.5 2 4 3 3 7 8
2 11
2.5° -
15
7.5°
T <51 6 .1 8 1 10 1 12 1 14 1415 E T <51 615101121141.151E
BLOCK:E8
2 3 1 4
.10 9
th N 7 gl 1 5 N 4 r- 3 c' 2
410 o 9
I s Fr) 4
1"-.. 3 N 2
1 4 3 1
3
2 1 5
3 6 1 1
22
1 1 2 1
2 3 1
H .10
9 tn 8 NI 7
l'a! ( 71 7.11 6
I 5 rn 4 N 3
2 1
N 5 5
16 4 IS: 3 n
.10 9
112
5° -
157
.5°
410
e
E 7 I 5
rn 4 7., 3 6.1 2
1
T<51 6181 101 121 141.151 11451 6181 101 121 141.151X
BLOCK:F7
202 5°- 2
47.5
°
.10 9
7 N 6 1 5
'15 4 3 2 1
3 2 4 10 2 1 4 11 6 1
2 1 1 7 2 3 4 3
2
2 2 5 6 1 2
112
.5° - 15
7. 5°
T <51 6 I 8 I to 1 12 1 14 1415 E T € 5 I 6 1 8 110 1 12 1 14 I>151 I
BLOCK: F8
1
3 1
2
T <51 6 1 8 1 10 1 12 1 14 1.15 X Tic 51 6 1 8 1 10 1 12 1 14 1.151 X
BLOCK:G7
•
01
N
20
2.5°- 2
47
5°
H .10
9
'111 a N 67.6
5 tn 4
1
410 8
° lV; I 5 N 4 7: 3 t5 2
.10 9
th 8
: I 5
164
1
1 1
4 2 1
410
m6 g 7 N 6 15 514
1C1: 3 N 2
1 1 4
2
1 3 1
3 1 8
9 3
6 2 9 2 1 1/ 1
1 2 2 2 12 1 2 3 1
NOTES: — DIRECTION INTO WHICH WAVES PROPAGATE—IN DEGREES
H— WAVE HEIGHT IN METRES. T— WAVE PERIOD IN SECONDS.
— ONE OCCURRENCE REFERS TO A SIX HOUR MEAN.
APPENDIX FIGURE 13e: Directional Wave Statistics for January
2 2 1 8 2 4 2 2
1 2 2 6 6 1 1
2 2 1
410 9
1 5 4
r-3 2
>10 9
fit a 01 7 61 6 1 5
'2 2
tn 4 7: 3
H .10
9
th a N 7 N 6
M 32
410 o 9 51 8
7 N6 I 5 e,) 4
2
2 6
3 5 1
1 1 4 4
4 12 2 1 4 8 4 1
1 2 I
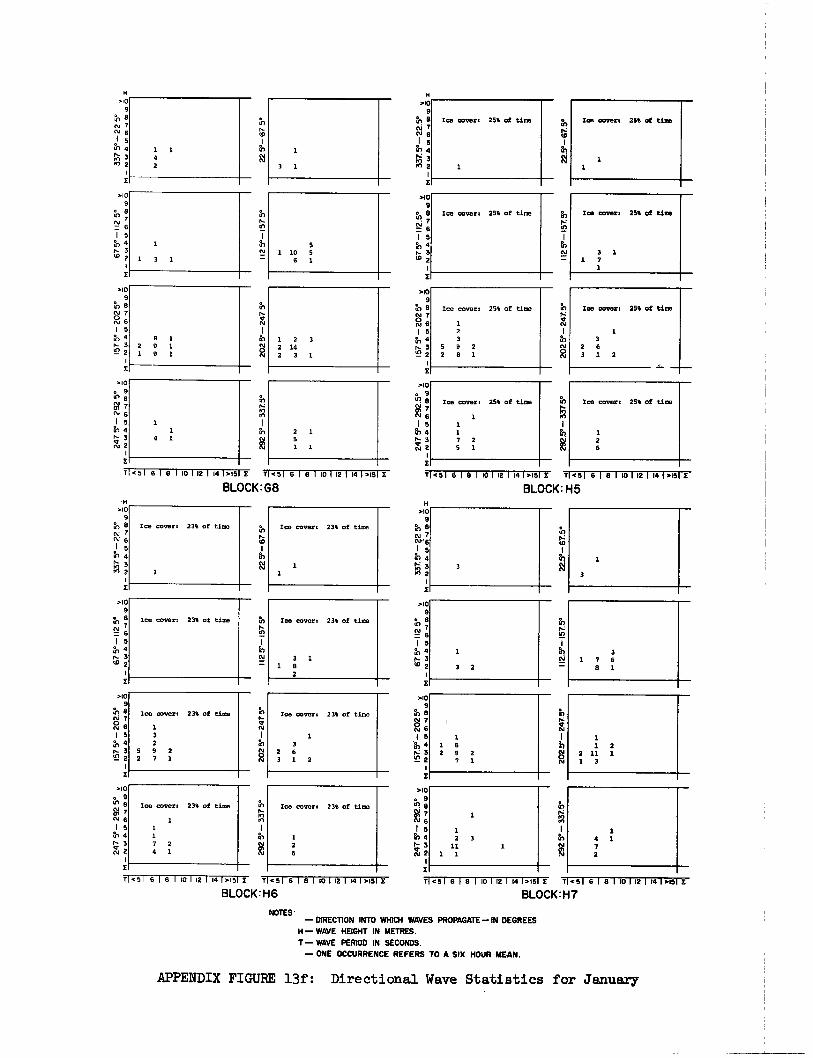
1
3
NOTES' — DIRECTION INTO WHICH WAVES PROPAGATE—IN DEGREES
H— WAVE HEIGHT IN METRES.
T— WAVE PERIOD IN SECONDS.
— ONE OCCURRENCE REFERS TO A SIX HOUR MEAN.
APPENDIX FIGURE 13f: Directional Wave Statistics for January
>10 9
ft') N 7
Ice covert
cc:. 6 1 1 1 5 2
8 1 1 2 3 fi) 4 3 9 1 2 14 e- 3 5 9 2 9 1 2 3 1 e2 2 8 1
1
258 of time t.: Ice covert 25% of time
1 en 3 NN 2 6
3 1 2
Tic 9 1 6 I 8 1 10 1 12 1 141>15 E T <sl 6 1 8 1 10 1 12 I 14 1 >151
BLOCK : G8 110 5 1 6 1 8 1 101 12 1 14 1 >15 E T <51 6 1 8 110 1 12 1 14 I >151 E
BLOCK: H5
Ti<51 618 1 101 12 1141>15 I 1o51 61 81101121141>1511
BLOCK: H6 11451 6 1 8 1 10 1 12 I 14 1.15 X T 451 6 1 8 1 10 1 12 1 14 1.151 I
BLOCK: H7
292
Y-3
37.
5°
ro
H >10
8 Ice covert 25% of time
1
Ice covers
1
25% of time
Ice covers 25% of time Ice cover.
3 1 1 7
1
25% of time
E
I 5 4
N 3 Lo 2 11
25°-
15
7.5°
22
V-6
75°
112 5°
-15
7 5°
fr? N 7 N 6
el 5 In 4 N 3
2
x
H .10
9 N 8 N 7 N6
01 4 1 1 4 2 3 1
1 3 1
5 1 10 5
6 1
48 7 N 6
1
N
▪
3 '2 2
2 1
Ice covert 23% of time
1
tD
112.5°- I5
7.5°
20
2.5°
- 24
7 5°
2
Ice covert 23% of time
1 1 7 2 4 1
Ice covert 23% of time
1
Ice covers 23% of time
3 1 1 8
2
Ice cover. 23% of time
1 3
2 6 3 1 2
Ice covert 23% of time
1 2 6
•H >10
9 to 8 N CV 6 .1 5 u") 4
1.0 23
>10 9
in 8 N
67 1 5 tr, 4 N 3
2 112
5° -1
57 V
20
2 5°
- 24
7 V
29
2 5°
- 3
375°
H >10 9
111 8 N7 mr.6
5 0 4 N3 P2
I
tj 6 1 5 th 4 e- 3 • 2
>10 9
:I
N 616 15
N3 e2
I
>10
.1
• 9
1 M 7 N 6 1 5
en 4 N 3 7,, 2
>10 e 9
8
M 7 N 6 I 5 to 4 Is- 3 V N2
I
Ice covers 238 of time
23% of time
.10 9
(1 N
Ice covert
R 6 1 I 5 3 f,4 2 N 3 5 9 2 El 2 2 7 1
3
1 2 3 11
1 1
3 2
1 1 6 2 9 2
7 1
1 4 1 7 2
3 1 7 6
8 1
1 1 2
2 11 1 1 3
>10 • 9 0. N N 6 1 5
Pr) 4 N 3 61. 2
010 c 9
8
N 6 I 5
11-, 4
ri 1 4 1
2 1
Ice covert 25% of time
1 1 7 2 5 1
Ice cover, 25% of time
1 2 6
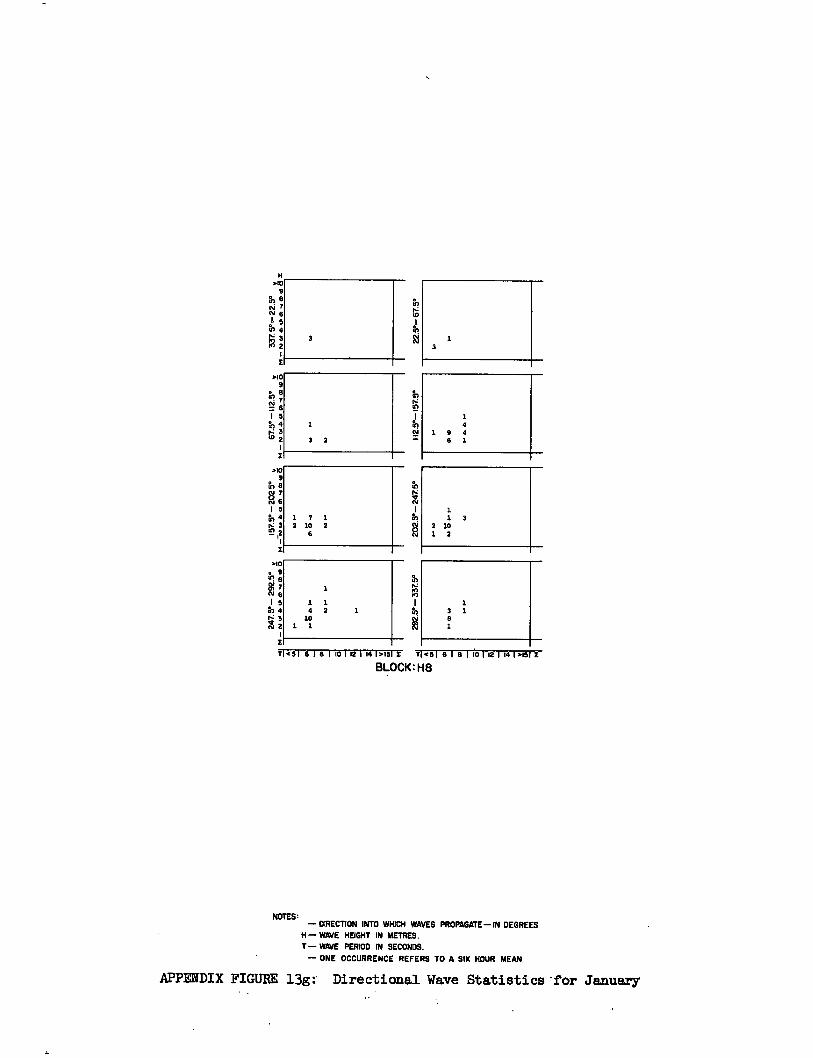
3
3 2
1 4
1 9 4 6 1
340 9
I. 5 1174 9.: 3 M 2
610 9
e N 76 I 5 to 4 9: 3 (9 2
H
610 9
in U) Ni 7 19 8
5 1 to 4 1 7 1 5) 1 3 N... 3 2 10 2 lV 2 10 "" 2 it
6 1 2
>40
T 1 0,1 6 I 5 1 1 1 »4 4 2 rn 3 1
1.43
10 8 ni 2 1 1 1
I
T <5] 6 I 8 I 10 1 12 I 14 I >13 I Tc5I8I81101 12 1 1416151 1
BLOCK:H8
NOTES: — DIRECTION INTO WHICH WAVES PROPAGATE— IN DEGREES
H — WAVE HEIGHT IN METRES. T— WAVE PERIOD IN SECONDS.
— ONE OCCURRENCE REFERS TO A SIX HOUR MEAN
APPENDIX FIGURE 13g: Directional Wave Statistics'for January
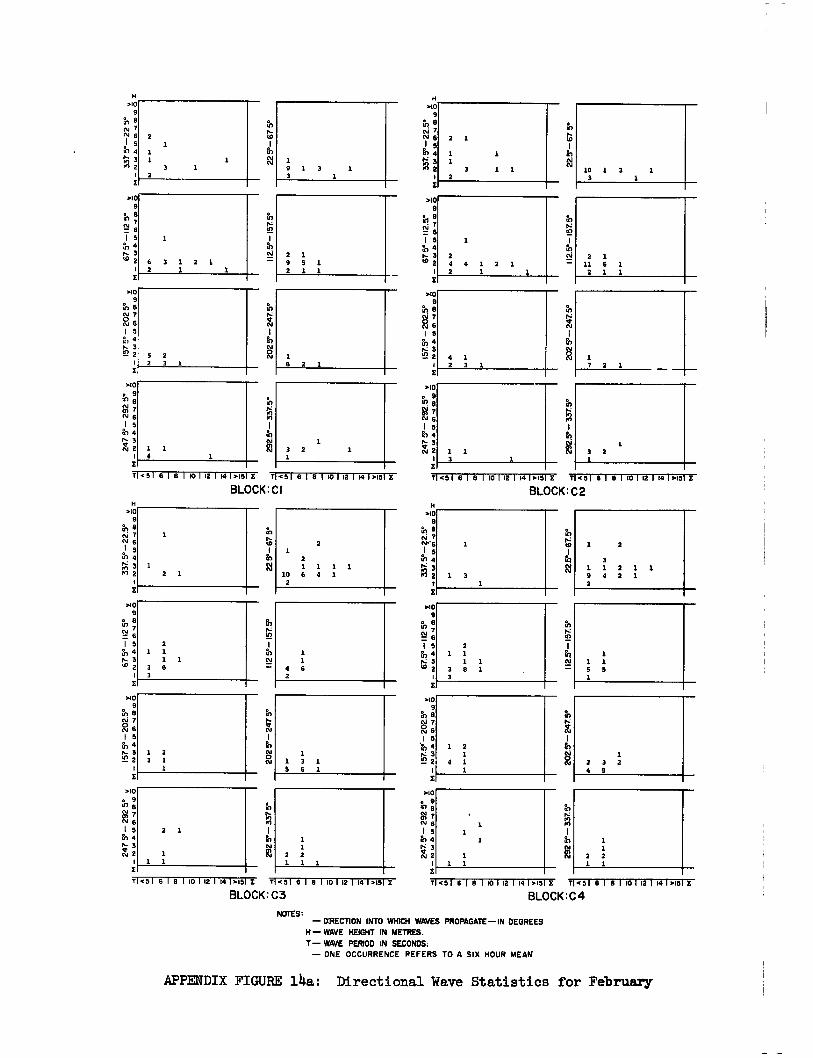
5 2 2 3 1
1 1 4
.51 6 1 8 1 101 121 141>15 14518181 101 121 141.151 z
H
BLOCK: C2
"2
2
2 1 1 1 1 6 4 1
>10 9
tai N..6 1 5
N 4
1
1
3
1
1 9 2
2
3 1 2 1 1 4 2 1
6
>10 9
6 7 V 6
1 5 rr? 4
w 2
1
3 3
2 1 1 8
1 1
1 S 1
1 1
T .51 6181101121141.191 T1 4 51 6 1 8 1 101 12 1 141.151E
BLOCK: C3 Ti35' 6 1 8 1 10 1 12 1 141.15 E 7 .51 6 1 13 1 10 1 12 1 14 1.151 Z
BLOCK : C 4
>10 9
tfr a
M: NN 1 5 1
1, 4 1 2 1 N 3 1 1
1 3 1 2 4 1 2 2 3 2 S 6 1 1 4 5
>10 9 e
M tv
'err.1 2
1 5 1 en 4 1 6 1 1 N. 3
2 2 N 2 2 2 1 1 1 1 1
202 5°
- 247
5°
>10 9
tile csi 7 (9 6 1 5 fr, 4 N. 3 • 2
>10 • 9 to 31 7
6 1 5
rn 4 3
it 2 1
1 2 3 1
1
2 1
1 1
NOTES: — DIRECTION INTO WHICH WAVES PROPAGATE—IN DEGREES
H— WAVE HEIGHT IN METRES. T— WAVE PERIOD IN SECONDS:
— ONE OCCURRENCE REFERS TO A SIX HOUR MEAN
APPENDIX FIGURE 14a: Directional Wave Statistics for February
Tl<5 1 6 1 8 1 10 1 12 1 14 1>15 E 71.51 6 1 8 1 10 1 12 1 14 1.151
BLOCK: CI
112. 5
°-15
7.5°
H >10
9 tr) N1 7 0.1 1 rn 4
1 3 9 1 3 1 2 2 3 1
PA
112.5
° - 1
57. 5
°
e40 9
e lV
76 1 5 a, 4 N 3 tO 2
4 1 2 3 1
0 N
Pn
.10 e 9 In 8 31 7 6.1 6 1 5
Po 4 N. 3 cr N 2
.10 9 e
1 5 a, 4 N 3 9. 2
1
1 1 3 1
7 2 1
1 3 2 1
010 9
1 5 'er, 4 N. 3 ° 2
H >10
9 to N 7 N 6 1
fr, 4 N 3 2 2
1
to
112. 5
°-1
57.
5°
>10 9
°/ I 5 a, 4
3 '2 2
>10 a 9 tr,
IA 7 (..1 6 1 5 fn 4
if 3 N 2 1
2 1
1 1 1
3 1 1 2
10 1 3 1 3 1
2 4 4 1 2 1 2 1 1
2 1 11 6 1 2 1 1
2
1 1
2 3
6 3 1 2 1 2 1 1
1 3 2
2 1 9 5 1 2 1 1
: 2 1
ro 3
.10 9
6 8 ;
1 5 in 4 • 3 tO 2
al 8 N C\I 6 1
H >10
9
2
112
50-1
57.
5°
6 10
1 2 1
2 1 1
1 1 3 6 3
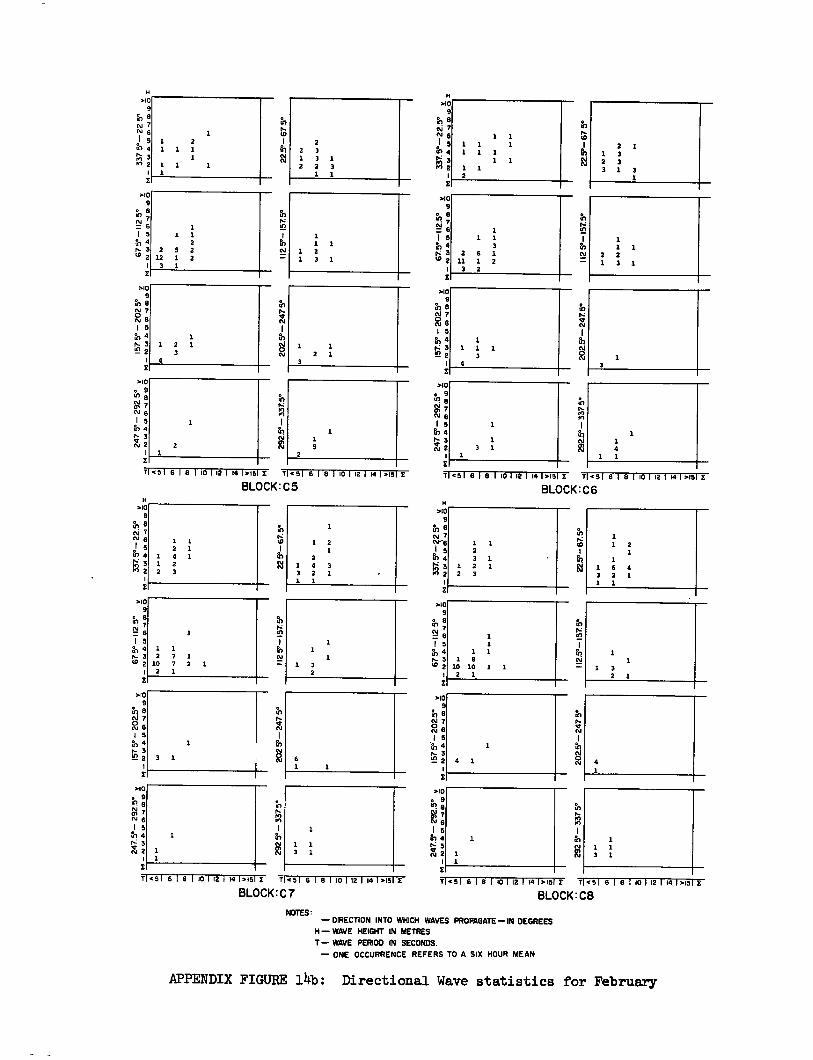
>10 9
i,8 N 7 in N 1 1 tO
2 1 5 1 1 1 2 1 2 3 N 4 1 1 1 1 3 1 3 1 r3 1 1 2 3 2 2 3 M 2 3 1 3
1 1 2
7409
e 1
1 1 5 1 1 1 1 1 g,4 3 1 1
1 2
1 3 1 r3 t02
2 11
6 1
1 2
2 1
2 3 1
3 2
112 5
°-1
57.
5°
0 9
to 8 N 7 N6 10 1 5
.1) 4 1 1 1
2 1
1 111
3 1 rn 2 1 1
>10 9
in 78 N 1 5 to 4 N 3 W 2
1
1 1 1
1 2 5 2
12 1 2 3 1
112 5
°-1
57.5
°
1 1 2 1
3 4
202.
5°-
247 5°
1 1 2 1
3
2 2
1 1 1 1
3 4
202.5°-
24
75 °
3
1 1. 3
1 1 4
1 1
>10 o 9 'n 8 N 7 cy 6 1 5
in 4 N 3
2 1
>109
toe N 7
6 1 5 to 4 n. 3
>10 9 8
0 N 1 5
4 r 3 e 2
>10 e 9 W1 8
7 N 6 1 5 tit 4 r3 ns 2
>109
N7 N 1 5 to 4 N
>10 o 9 41 8 01 7 1N1 6 1 5 in 4 1.4 3 it1 2
T<516181 101 121 141.15 E 7.516161 101 121 141>151£
BLOCK:C7 7 <5 1 6 1 8 1 10 1 12 1 14 1>15 .5 1 8 1 8 1 10 1 12 1- 14 1,151
BLOCK:C8
202
.5°- 24
7 5°
8,
1
202
5°- 24
7 5°
29
2 5°
- 33
75°
1 to 8 N 1
1 2 1 1 to 1 2 1 1 5 2 1
2 th 4 3 1 1 1 4 3 1 2 1 1 6 4 3 2 1 2 3 3 2 1 1 1 1 1
SO 9
; 1
1 1 5 in 4 1 1
1 8 1 ; 10 10 1 1 1 3
2 1 2 1
112.5
°-1
57.5
°
112 Y
- 15
7.W
H >10
9
H >10
9
h 8 N 7 N 6 I 5
in 4 'or*" 3 id 2
>10 9
• 8
11.1 8
1 5 to 4 h 3 10 2
1
1 1 2 1
1 4 1 1 2 2 3
1 1 2 7 1 10 7 2 1 2 1
>10 9
it ;8 N 7
1 5 11%, 4 r, E' 2
9 1.0 8
g 7 N 6 Is
Pit 4
'4 3 N 2
3 1 6 4 1 4
1 1 1 3 1
1
1 1
1
1 1
H
Tl<5 1 6 1 8 1 10 1 12 1 14 1.15 E T .51 8 1 8 1 10 1 12 1 14 1.151
BLOCK: C5 71<51 6 1 8 1 10 1 12 1 14 1).15 I 7 .5 1 8 1 8 1 10 1 12 1 14 1>151
BLOCK:C6
NOTES: — DIRECTION INTO WHICH WAVES PROPAGATE— IN DEGREES
H— WAVE HEIGHT IN METRES.
T— WAVE PERIOD IN SECONDS. — ONE OCCURRENCE REFERS TO A SIX HOUR MEAN
APPENDIX FIGURE 14b: Directional Wave statistics for February
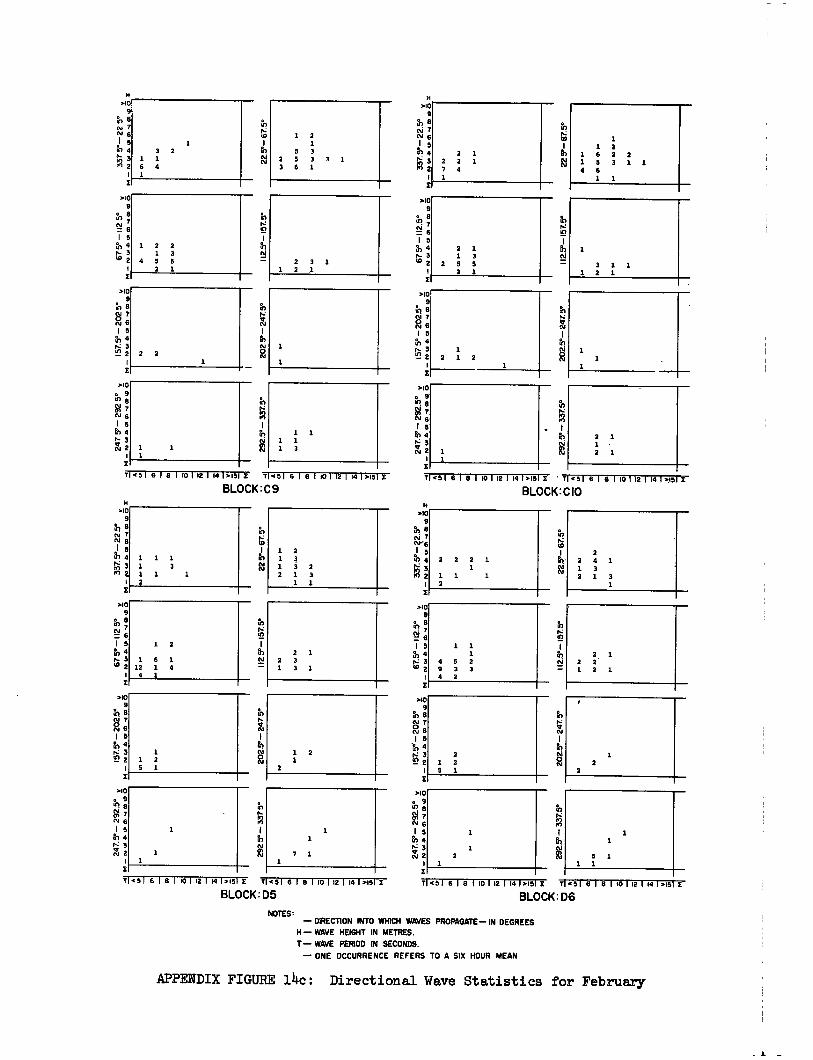
1
7 1
2 2 1
$0 9
N 76
1 5 Er, 4 • 3 t5 2
1
s0
M 7 N 6 I 5 85 4 N it 2
2
$0 9
to 8
M N 6 1 5 N 4 pz 3 N 2
1 2 2 1 3
4 S 5 2 1
1 1
71.51 6 1 8 1 101 12 1 14 1.15 E 7 .51 6 1 8 1 10 1 12 1 14 1.151 2
BLOCK : C 9
.10 9
h
ON : 1 5
20
2.5°-2
47.
5°
a., 4
47 3 2 2 1 2
2 1 1 1 3 5 5 3 1 1 2 1 1 2 3.
112.5°
- 1
57.
5°
810 9
tV e
1 5 N 4 P 3 co 2 2
810 o 9 r 8
M 7 Ng 1 5
2
2 1 1 • 2 1
7145 1 6 1 8 1 10 1 12 1 14 1815 I T <51 8 1 8 110 1 12 1 14 18151E
BLOCK: C 10
V
1
2
112.5°
- 1
5 7. 5
.
H 810
9
h cv 7 0
2 N 1 1 5 3 &I 4 2 1 en 1 3 3 1 .nr.4 3 2 2 1 1 1 id 2 7 4 4
1
1 1 3 6 2 2 5 3 1 1 6 1 1
340 9
N N 7 N 6
5 `6)4 N 3 2 2
2 3 1 1 2 1
3 2 1 1 6 4 1
1
5 2 5 3 6
71< 5 1 6 1 8 1 10 1 12 1 14 1.15 E 7 <51 6 1 8 1 10 1 12 1 14 18151 2
BLOCK: D5
1 2
2
to
N
I 2
02
.5°-2
47. 5
°
74518181 101 121 141.151 74516181 101 121 141815
BLOCK: D6
810 9
52 6 1 5 N 4
N
4)
H 810
9
h N7 oe5 15 N 4 P.: 3 2 2
$0
e N 7 RI 8 1 5
*a., 4
4.3 3 2
1
$0 e 9
8
7 I 5 85 4 N 3 N 2
1
2 2 2 1 1
1 1 1 2
2 2 4 1 1 3 2 1
2 1 2 5 1
1 1 1
4 5 2 9 3 3 4 3
21 2 1
2
1 1
5 1
1 2
1 6 1 12 1 4 4 1
810 9
.7? 8 M 7 CV 6 1 5 854 N
2
810 9
1 5 Er', 4
3 .5 2
>10 9 8
M: 1 5 fk, 4
in 3 2
1 1 1 3 1
1 1 3. 2
H 340
9
h N 7 N
5 In 4 .' 3
2 z
1 1 2 5 1
1 2 1 1 3 2 2 1 3
1 1
2 1 2 3 1 3 1
1 2 1
2
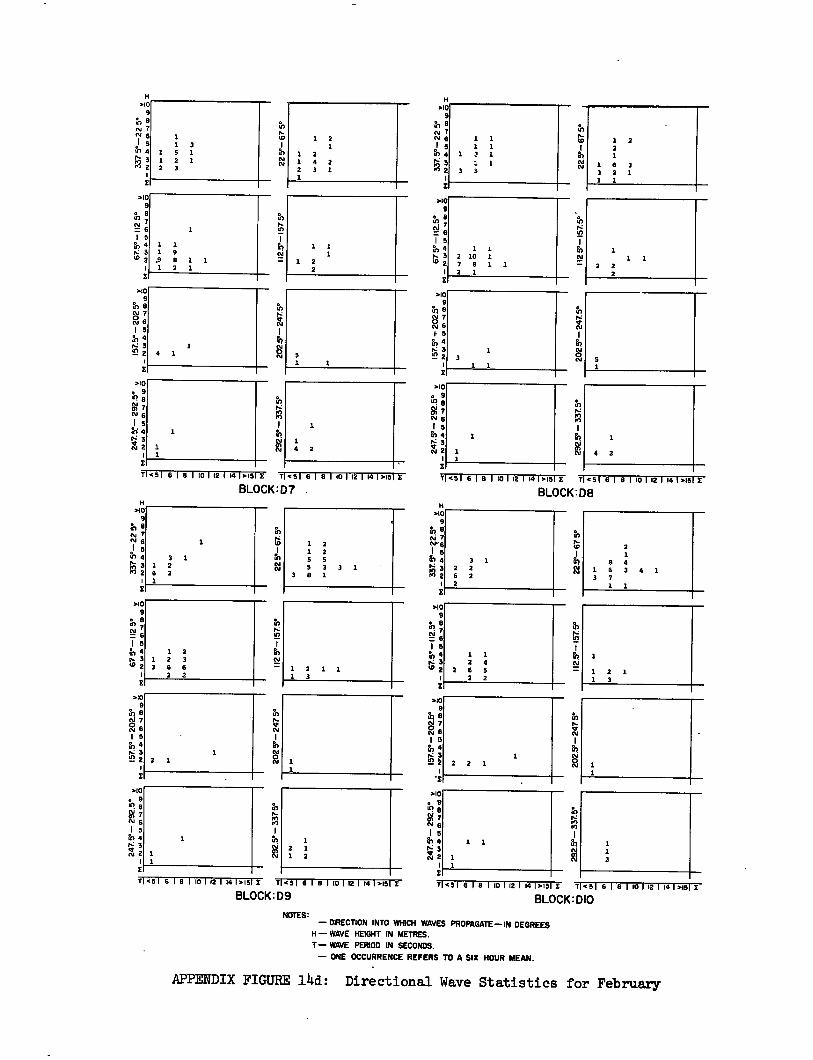
fi.5161el101121141.15x 1.45161810112110,w2
BLOCK:D7 . T <5 1 8 1 8 1 10 1 12 1 14 1).15 I T <51 6 1 8 1 10 1 12 1 14 1.151 E
BLOCK:D8
>40 9
if) 8
; 1 5 N4
>10 e 9
N 7 N 6 I s No
v 3 N 2
H
>10 9
. 0,
11 1 5 N 4 >: 3
>10 9
N8 N 7 5, 1 5
Fr) 4 3
0 2
21
1 1 1 9 .9 8 1 1 1 2 1
1 4 1
1
1 1
1 1 3
1 5 1 1 2 1 2 3
20
2.5°- 2475°
I 12
5°-
157
5°
0 2
5 1
1 2 1
1 2 1 4 2 2 3 1 1
1 22
H >10
9 N 8 N N 1 5
1114
2 2
1 1 1 1
1 3 1 3 1
3 3
>10 9
N 8
Pi 76 1.5 N 4 H: 3 tn 2
.10 e 9 1,1 8 g 7
I s 4
612
>10 9
e 8
'(.1
1 5 fr', 4
2
1 1 2 10 1 7 8 1 1 2 1
99 R.
— a
7 11
2 5°
- 15
7.5°'
1 2 2 1
1 6 3 3 2 1 1 1
1 1 1
2 2 2
4 2
1
1 2 1 1 3
29
2.5°- 337
5°
Pn
112
5°-1
57. 5
°
pN
1 12
.5°-
15
75°
20
2Y
-247
5°
H 3.10
9
rn CM 7
5 <7 4
>10 o 9 51 V 7 N6 1 5
4
:
>10 9
15 N 4
3
1
>1Cs:
6 1 3 N 4
*2
1 2 1 1 2
1 1
1 1
1 2
1 2 1 2 5 5 5 3 3 1
3 8 1
3 1 2 2 6 2
2 1
8 4 1 6 3 4 1 3 7
1 1
1 2 1 1 1 3
1 1 2 4
2 6 5 2
2 2 1
1
3 1 1 2 6 2 1
1 2 1
>10 9
.en a
N ; I 5 N4 1 2
1 2 3 V: 3 6 6
2 2
>10 9
N 7 2 6 1 5 N4
3 51 2
>10 e 9 10 e V 7 N 6 1 5 704
3 N2
H NO
9 5
ni 7 N 6
5 <1 4
10 3 2
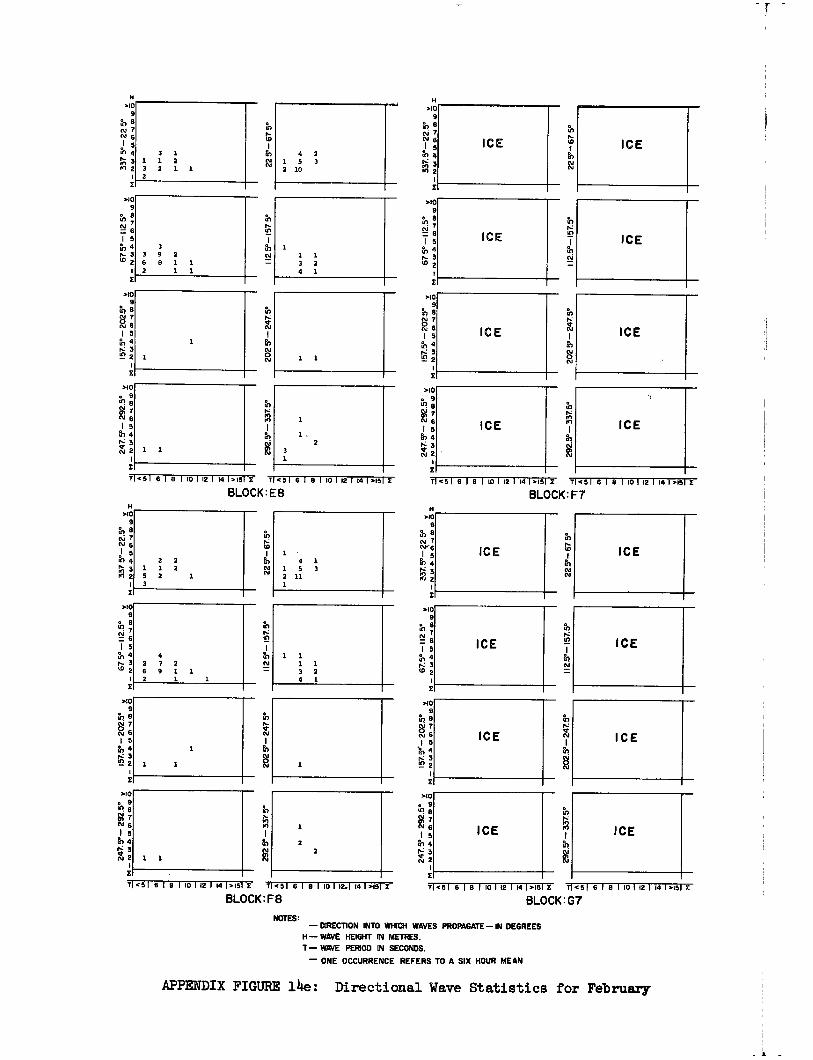
4,
71451 6 1 8 1 101 12 1 141 >15 X r<51 6 1 8 1 101 12 1 141.1513:
BLOCK:E8
112 5°
- 15
7 5°
202 5°
- 247
.5°
N 6 1 5
rn 4 >. 3 2 2
x
H .10
9 to N 7
.i0 o 9 ,11
NI5 5,4 1.■ 3 NI 2
410 9
rn 8 N ; I 5
11- 4
3 to 2
410 9
in
1 5 fr., 4 rt.: 3 522
1 E
4 2 1 5 3 2 10
3 3 9 2 6 8 1 1
1 1
1 1 1 3 2 4 1
1
3 1 1 1 2 3 2 1 1 2
T1.51 6 I 9 110 1 12 114 1.15 X T .451 6 18 1 10 1 12 114 1 >151 E BLOCK:F7
11 45 1 6 1 8 I 10 1 12 1 14 1415 X T <51 6 1 8 1 10 1 12 1 14 1 4151
BLOCK:G7
T1<51 6 1 8 1 10 1 12 1 14 1.15 X 11151 6 1 9 1 10 1 124 14 1.151 Z
BLOCK: F8
112.5°
- 1
57.
5°
H .10
9
In
to
A
.10 9
th 21 CV 6 1 5
'5, 4 Nz 3 e 2
>10 e 9
9 gi N 6 15
En 4
cs7,:
410 9
ai 6 1 5 g,4
2
N 7
j 5 trt 4
ICE ICE
ICE ICE
ICE ICE
ICE ICE
N 1
81
112 5°
- 1
57.
5°
225°
- 6
7.5
°
H .10
9 al 8 tse 7 N 6
5 to 4
5 >1 2
El
.109
• e ul
1 5 tn 4 It- 3 10 2
.109
roe '8 0.1 6 15 th 4 >: 3 to 2
.10 e 9 ‘r! e NT
6 1 5
Po 4
ti 32
1
2 2
1 4 1
1 5 3 2 11 1
1 1 1 1 3 2 4 1
2 2 1 1 2 5 2 3
4 2 7 2 6 9 1 1 2 1 1
NOTES: — DIRECTION INTO WHICH WAVES PROPAGATE—IN DEGREES
H— WAVE HEIGHT IN METRES. T— WAVE PERIOD IN SECONDS.
— ONE OCCURRENCE REFERS TO A SIX HOUR MEAN
Pn
APPENDIX FIGURE 14e: Directional Wave Statistics for February
1 5 en 4 ti 3 • 2
.10 9
>10
410 o 9 07 9 Pi 7 N 1 5
Pn 4 rt.: 3 V cy 2
ICE
ICE
ICE
20
2 5°-
24
7.5°
112.5°
- 1
57.
5°
ICE
ICE
ICE
ICE
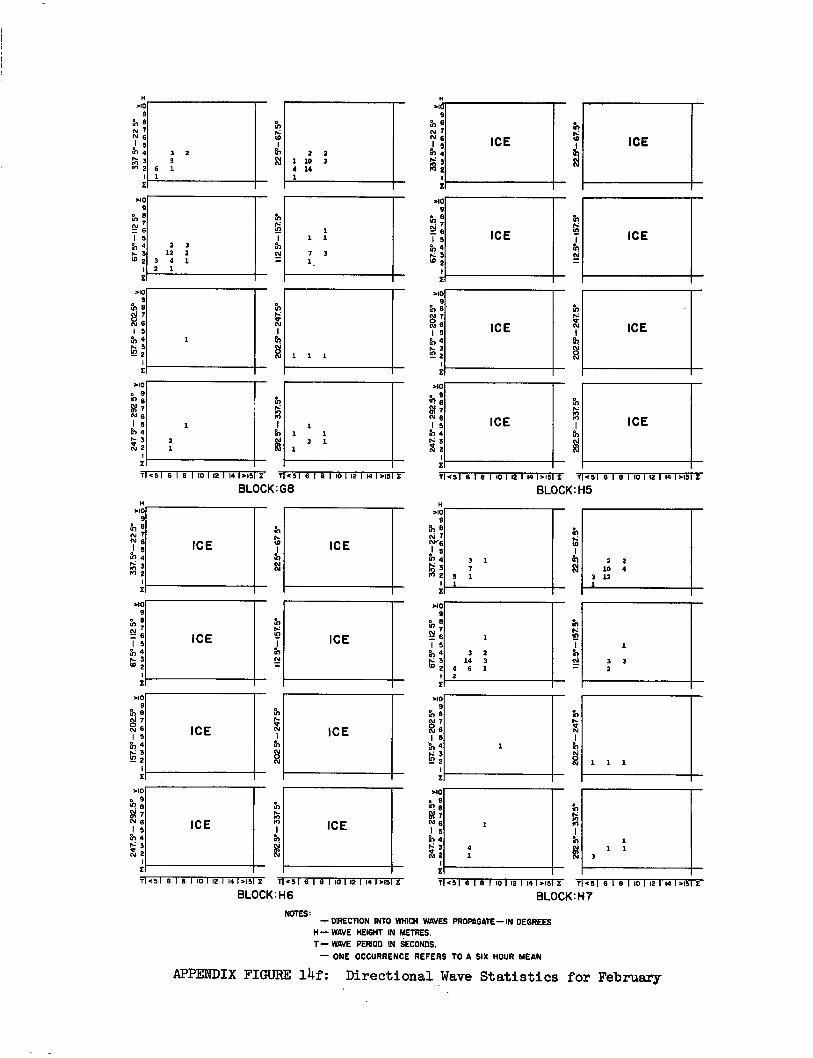
•
N
k
Pr)
2 2 1 10 3 4 14 1
ICE
.10 9
to 87
1
N
ICE c=i 6 15
of 4
15 3 2
.10 e 9 d! 8 g 7 0, 6 1 5 to 4 N 5 isit 2
>10 9
e
1 5 en 4
in 3 2
1 1 1
2 1 1
1 1 1
7 3 1
1 1 1
ICE
ICE ICE
ICE
ICE
H >IC
9
e N ? 0.1 6 1 5
in 4 r. 3 2 2
U)
112
5°-1
57. 5
° 20
2.5°-
24
7. 5°
U)
N 76
ti 3 N 2
>10
9 ; 6
1 5 in 4 N 3 6' 2
.10 9
in N 7
6 1 5
en 4
:
3 2
6 1 1
2 3 12 2
3 4 1 2 1
1
2
U) to V)
112
5° -1
57. 5
° 20
2 5'-
247 5
°
H .i0
9 81 8 N 7 N 1 5 <I 4 N 3 2 2
>10
9
1 5 a, 4 r— 3 (5 2
>10
e N 7 2 6 1 5 rn 4 N 3 N 2
.10 9
7 N 6 1 5 th 4 N N 2
ICE ICE
ICE
ICE
ICE
ICE
ICE
ICE
H .10
9 tr1 e tv
‘1 5 In 4
.10 9
o 8
1 5 4
:
.109
e .e ( 1 5
11,4 N 3 8.) 2
112
.5° - 15
7.5°
202.5
°- 2
47
5°
IAf
N
.10
: g 7 N 6 1 5
11 4
4: 3 N 2
3 1 7
5 1 1
3 2 14 3
4 6 1 2
4 3 1 I
1 1 1
2 2 10 4
3 12 1
1
3 3 2
T1<51 6 1 8 1 10 1 12 1 14 1.15 1 T <51 6 1 8 1 10 1 12 1141>I51 I
BLOCK:G8 T <51 6 1 8 110 1 12 1 14 1.15 T <51 6 1 8 I 10 1 12 1 14 1.151 Z
BLOCK:H5
T <51 6 1 8 1 10 1 12 1 14 1.15 I T <51 6 18 110 1 12 1 14 1.151
BLOCK: H6 T <51 6 18 1 101 12 1 14 1.15 I 71451 8 1 8 1101 12 1141,151 1
BLOCK: H7 NOTES:
— DIRECTION INTO WHICH WAVES PROPAGATE—IN DEGREES H — WAVE HEIGHT IN METRES. T— WAVE PERIOD IN SECONDS.
— ONE OCCURRENCE REFERS TO A SIX HOUR MEAN
APPENDIX FIGURE 14f: Directional Wave Statistics for February
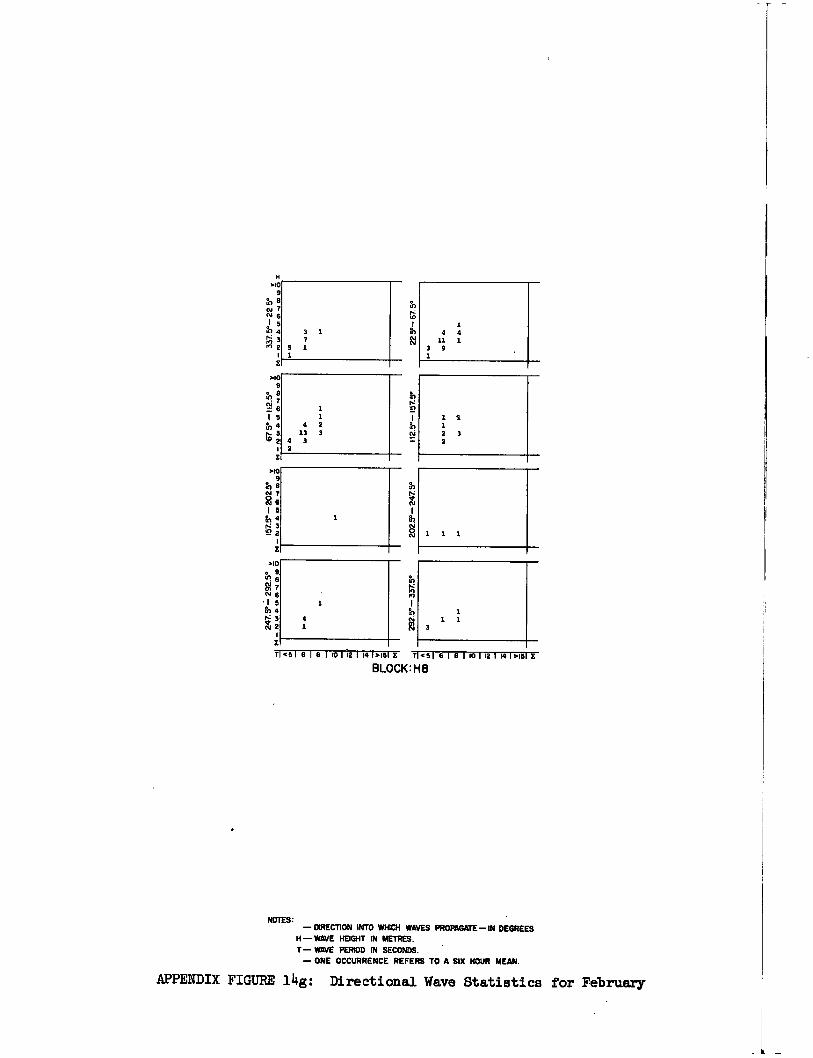
N 6
5 .11 4
3 en 2
3 1 7
5 1 1
to to
?r)
E
8 7 cm I 5
4 3 2
XI
>10 • 9 ▪ 8 gl7 N • I 5 b4
N2 2
in N
N
NN
4
>83 9
en e 8
6 7 .•.! 6
I 5 fr.,4 r-40
3 2
E
1 3 1 1
1 1
4 2 13 3
4 3
1
1
1
1 1 1
4 4 11 1
3 9 1
1 .1 1 2 3 2
7 451 13191101121141,15 E T14518181i01121141,451E
BLOCK: H8
NOTES: — DIRECTION INTO WHICH WAVES PROPAGATE— IN DEGREES
H— WAVE HEIGHT IN METRES.
T— WAVE PERIOD IN SECONDS.
— ONE OCCURRENCE REFERS TO A SIX HOUR MEAN.
APPENDIX FIGURE 14g: Directional Wave Statistics for February
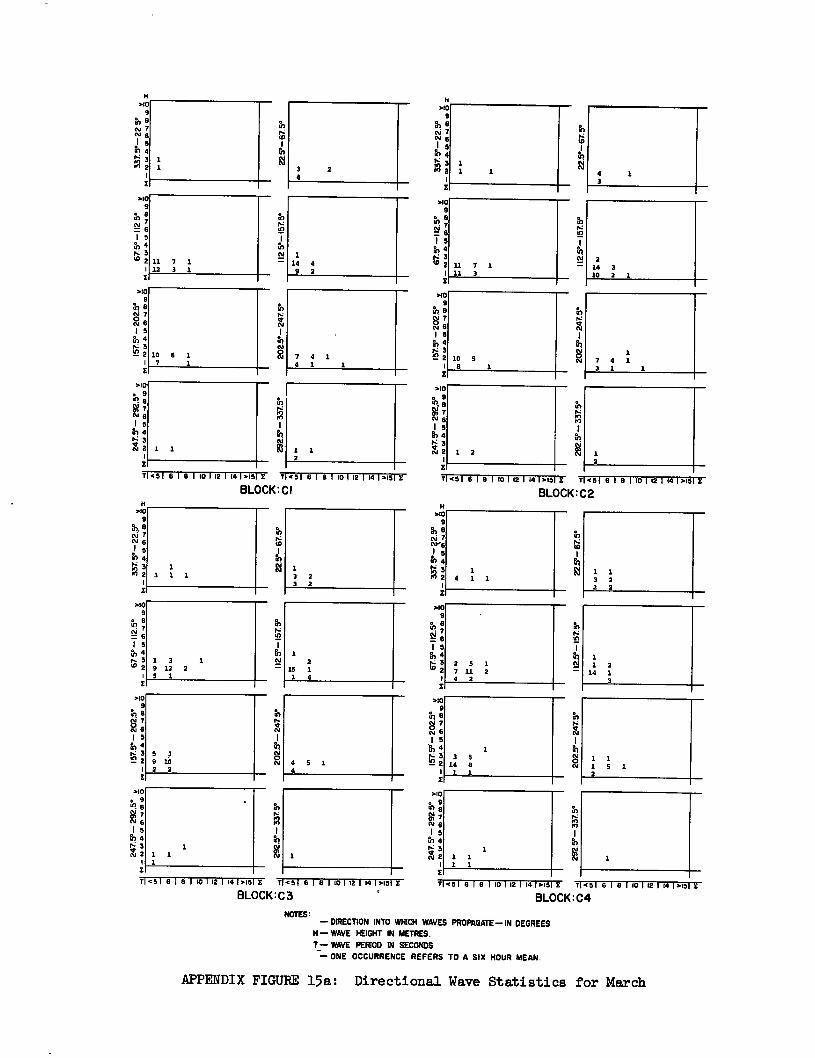
3 2 4
2
1 14 4 9 2
7 4 1 O 1
112 5°-1
57.5
°
H 5110
9
IN N 6 I 5
in 4 ▪ 3
2 4 1 3
rn
H
AO 9
trt ° N 7 N 6
3 id 2
11 7 1 11 3
tr! N 6
5 N 4 N 3 co 2
AO 9
0 N 7 N 6 I 5 N4 N3
>10 e 9 qe g 7 01 I 5 I74 N 3 N 2
112 5° - 15
7.5°
rn
Pn
1 2
10 9 8 1
>10 9
1
2
2 14 3 10 2 1
1 7 4 1 3 1
5110
9
N 7
I 5 N 4 IN 3 Ia 2
>10 9 a
0 N 7 N 6 I 5 N 4 .„N 3
2
11 7 1 12 3 1
10 6 1 7 1
8) 8)
to
112.5° - 15
7. 5°
H 210
9
e N 7 N I 5
3 pH 2
H >10
9
en 8 N
I 5 to 4
1 3 1 1
1 3 9 12 2 5 1
1 / 2 3 2
>I0 9
,a0 III 6
I 5 rt, 4 1
2 N 3 2 5 1 1 2 1 1° 2 7 11 2 14 1 4 4 2 3
112.5°
- 15
Z 5°
1 4 1 1
1 1 3 2 2 2
P I 5 GI 0 N 3 N 2
rksi 81811011211415115 E T <51 8181101(21141.(51x
BLOCK:C3 T45 18! 6 1101121141,15 E T451 818110112 114IA51E
BLOCK: C4
5110
e 9 .0 9 g 7 0.1 6 I 5
4 N 3 ct 2
>10 9
c2 a 0
61 6 V
I 5 "r5 4 1
0 5 1 IN 3 ‘..) 2
3 14
5 8
8 1 1
1 5 1
4 1 1 2
>10 9
tt 6
'8' 7 N 6 I 5
ft., 4 3 2
1 1 1 1
1 1
1 1 1 1
5 3 9 1.13 2 2
T 45 I 6 1 13 I 10 1 12 I 14 1>15 E T 4 51 6 I 9 1 10 I 12 I Hi I >151 E
BLOCK:CI 11<s 16161MI 12 IMIA5E 7451 61 almlm104 1>IWE
BLOCK: C2
NOTES: — DIRECTION INTO WHICH WAVES PROPAGATE—IN DEGREES
H — WAVE HEIGHT IN METRES. T_— WAVE PERIOD IN SECONDS
— ONE OCCURRENCE REFERS TO A SIX HOUR MEAN.
APPENDIX FIGURE 15a: Directional Wave Statistics for March
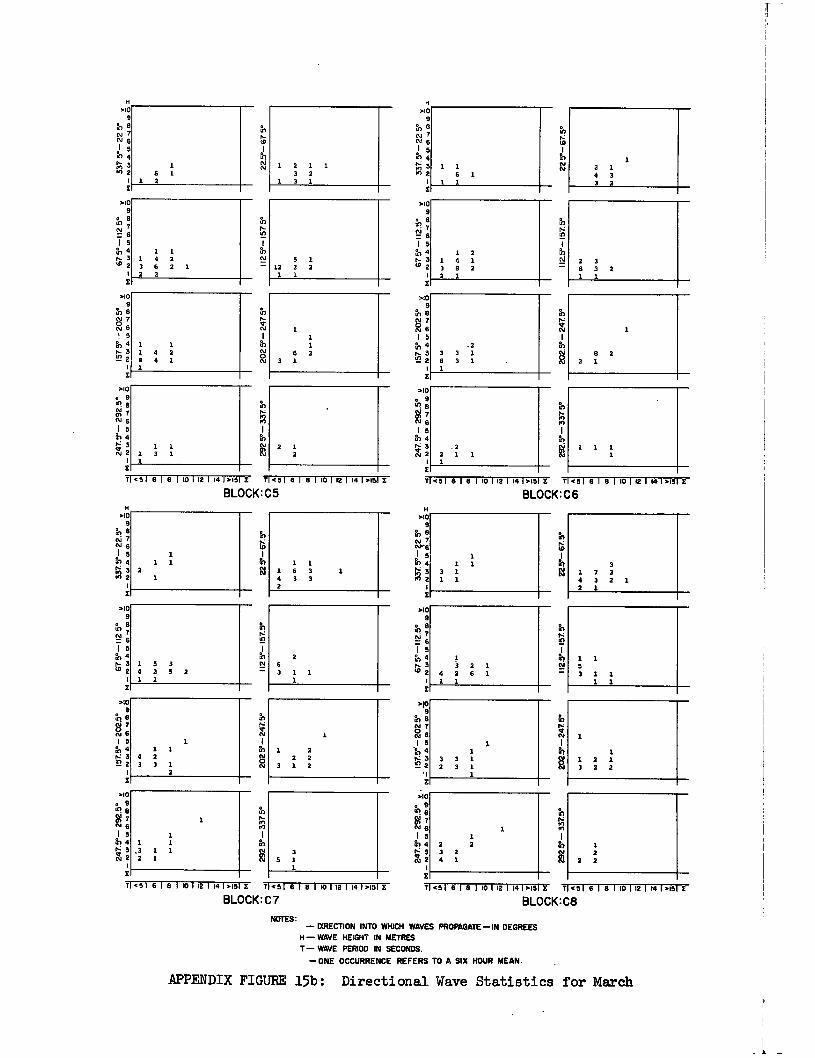
2 1 2
1
1 2 2 2
3 1 2
>10 9
in 8
c0J 76 1 5 N 4 I- 3 'I' 2
>10
cCii N 6 1 5 a) 4
14 3 N 2
X
>10 9
csi)
I 5 rn 4 r, 3 (0 2
H >10
9
I 5
'en 8 cv 1 N 6
in 4 3
K., 2
112
5°-
I57
5°
202.
5°- 2
47 5
°
2
11€51 6181 101 121 141.152 14516181 101 121 101>1512
BLOCK: C5
1 1 1 4 2 3 6 2 1 2 2
1 1 1 3 1 1
1 6 1
1 2
1 1
6 2 3 1
1 2 1 1 3 2
1 3 1
5 1 12 2 2 1 1
292 5°
- 337
5°
ir N
5,
112
5°- 15
7.5°
1 1 1 6 3 1 4 3 3 2
2 6 3 1 1
1
3 5 1
1
T €5 1 6 1 8 1 10 1 12 1 10 1.15 I T €5 1 6 1 8 1 10 1 12 1 14 1>151 I
BLOCK: C7
th
1 1 1 2 1
6 1 0 3 1 1 3 2
112.5
°-157
. 5°
1 5 N 0 r- 3 40 2
1 5
N 8 N 1 N 6
in 4
>10 9
op 8
1 1
3 3 1 2 3 1
1
112.x
-15
7.5°
>10 e 9 ul 8 V7 N 6 Is 0,4
r.4 3 IQ 2
1145 1 8 1 8 1 10 1 12 1 14 1>15 E T 451 6 1 8 1 10 1 12 1 14 1 >151 E
BLOCK: C6
rn 10
rn
H >10
9 8
cv
eI5
in 4 tri 5 id 2
>10
57 8
ck, ; 15
4 3 2 •1
• >10
e 9 10 B7 As 6 1 5
4
:
11 451 6 I 8 110 112 1 14 1>15 E T €51 6 1 8 1 10 I 12 1 14 1 3451 E
BLOCK:CS
>10 9
Es? 6
1 5 tn 4
'13 23 3 2 1
4 2 6 1 1 1
1 1 5
1 1 1
3 1 1 1
3 1 7 3 4 3 2 1 2 1
.2 2 1 1. 1
1 1 1
1 2 2 3 2 4 1
1
2 2 2
1 1 2 1 3 2 2
>10 9
in 6
N 6 1 5 in 4
N 3 ul 2 20
2.5°
- 247
.5°
>10 9
N ;
1 5 a" 4 3
>10 9
06
1 5 N 4 rz3 e 2
H >10
9
N N 1 ,s1 j 5 10 4 .1:;;; 3 id 2
>10 9 e
V7 N 6 1 5
4
0 3 N 2
1 5 3 0 2 5 2 1 1
1 1 4 2 3 3 1
2
1 1 1
2 1
1 1 ,3 1 1 2 1
1 2 1 4 1 3 8 2 2 1
2 3 8 3 2 1 1
8 2 2 1
.2 3 3 1 8 3 1 1
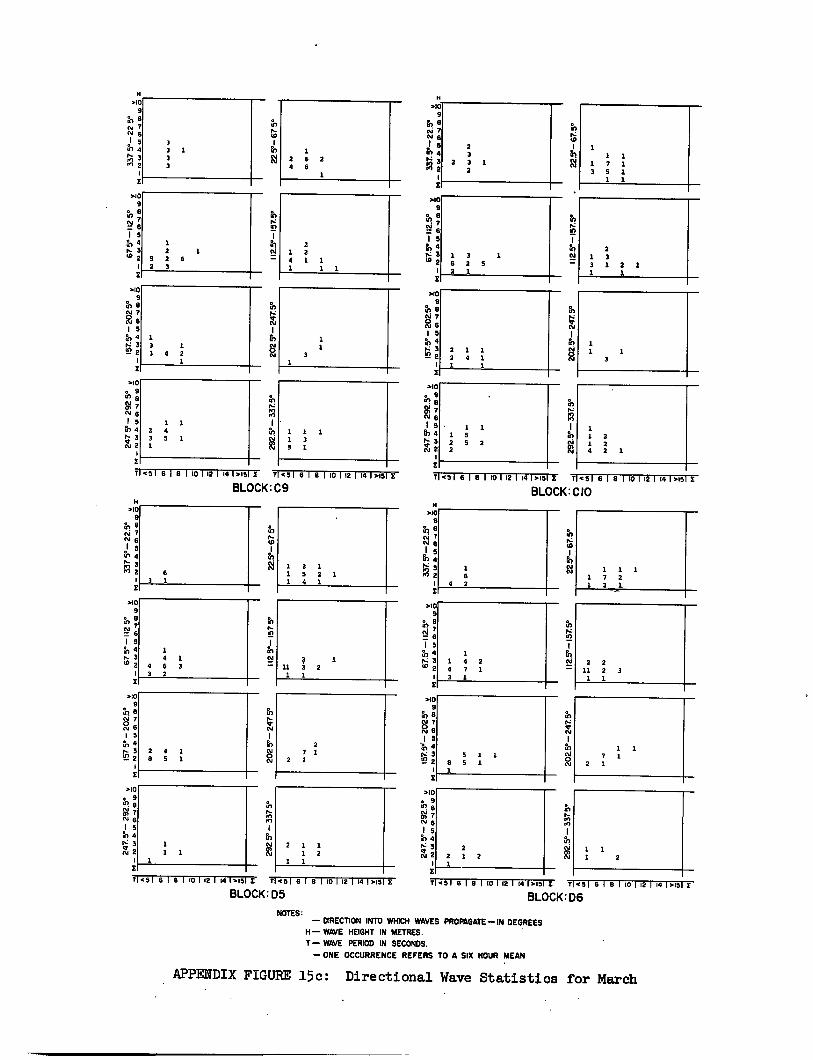
3 1 3 3
H 310
9 In 8 N 7 N 6
2 4
310 9
V. 76
1 5 in 4 m 3 .9 2
1
310 9
in 0 N 7 N 6 1 5 th 4 M 3 • 2
1
>10 e 9 m V7 Ng I 5 rn 4
T<5 181 13 1 101 12 1 141>15 E 7.5 1
BLOCK:C9
H
e
10 1
In
NN N
II,
1
1 6 2 6
1
>10 9
in N 7 N g
5 41 4 IA 3 2 2
2 3
2 3 1 2
1
1 3
1 7 5 1
1 1 1 1
2 1 1
1 1
310 9
1V 7 6
I S th 4 M 3 (5 2
1 3 6 2 5 2 1
1 1 3 1
2 3 1 2
1 1
3 3 1.
310 9
rf? 07 Is fh4 N3 na
2 1 1. 2 4 1 1 1
1 1
3 1
1 1 3 1
>10 e 9 tr! 8 V 7 N I9
274 M 3
1
1 1 1 5 2 5 2 2
1 1 4
2 2 2 1
61810112114 1 ,1511 TI<5I 6 I 8 1 10112 I 10 1.15 x 1.51 61 6 1 0112 1141 3151
BLOCK:CIO 2
rn
1 1 1 5
1 4 1
1125°
-15
7.5°
1 1 2 4 3 5 1 1
112
.5°-1
57.
5°
N
1 2 1
5 2 6 2 3
1 3 1 3 4 2
1
6 3 1
1 11 1
2
2 7 1
2 2
1 2 1 1 5 2 1 1 4 1
H >10
9
e N 7 Ng
J 5 O 4
2
>10 9
1 5 rn 4 M 3 8:1 2
in
11
2 5*
- 15
7 5
*
20
2.5°- 247
5°
29
2.5
°-
337
5°
H 310
9
tr1 a N ? N 6 I 5 04 My P2
In ri
112.5*
-15
7.5°
310 9
••1 N 6 1 5
fr', 4 m 3 62 2
X
>10 9
in N 7 0 6
5 a., 4 N 3 m 2
>10 e 9 tr! e V7 N 6 1 5 of 4
N 3 2
>10 9
al 7
N 15
'3, 4 M 3
2
1 4 1
4 6 3 3 2
2 4 1 8 5 1
11 1
1
6 4 2
1 1 4 2 4 7 1 3 1
5 1 1 8 5 1 1
>10 e 9
e
N 6 1 5 b4 r5 2 N2 2 2 1 2
1 1 2
1 1 7 1
2 1
1 1 1 1 7 2 1 3 -1.
2 2 11 2 3 1 1
1' <5 1 6 1 8 1 10 1 12 1 14 1.15 E 7 .5 1 8 1 8 1 10 1 12 1 14 1.151
BLOCK:D5 11<5 18181M1 12 1 141m5 E T1.5 18181M1*1i41m51
BLOCK:D6
NOTES: — DIRECTION INTO WHICH WAVES PROPAGATE—IN DEGREES
H— WAVE HEIGHT IN METRES.
T— WAVE PERIOD IN SECONDS.
— ONE OCCURRENCE REFERS TO A SIX HOUR MEAN
APPENDIX FIGURE 15c: Directional Wave Statistics for March
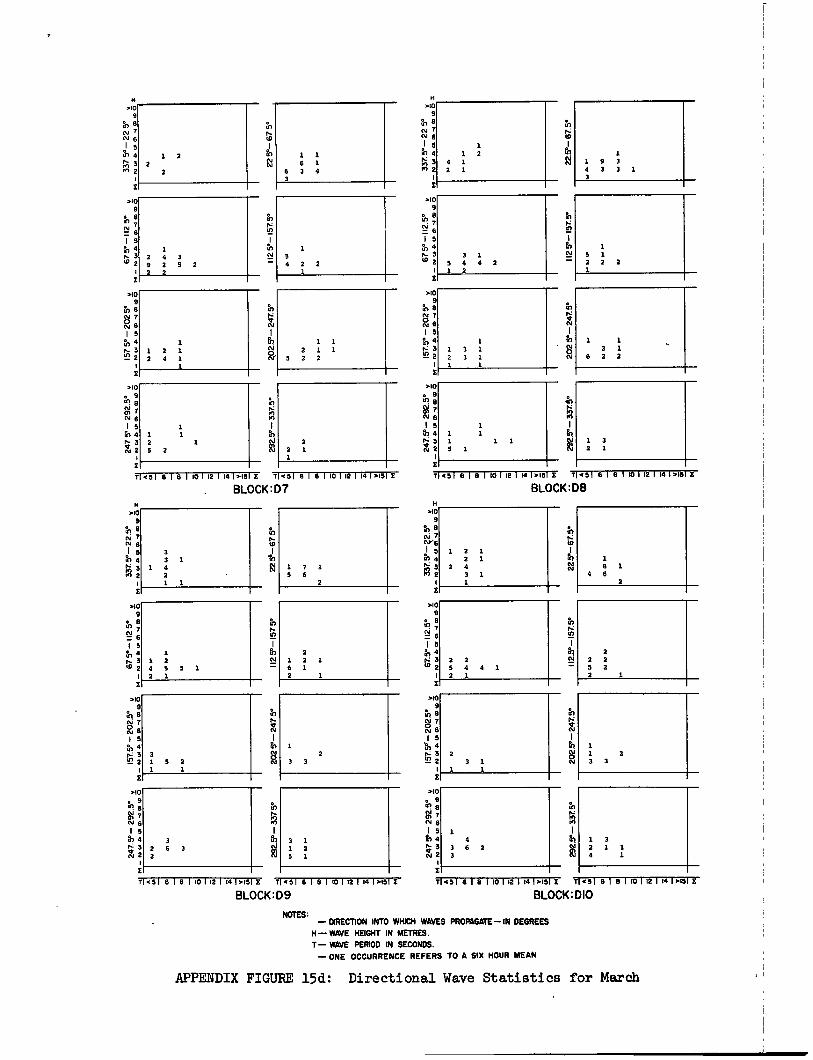
N6 1 5 in 4 en 3 NI 2
1 2 2
2
H 510
9 a, a N
PI7 N 6 Is
4
.10 9
e 8
1 5 to 4 H. 3
>10 9
in Ht 7 2 8 1 5
et, 4 H- 3
2
>10 e 9 In
1 2 4 3 9 2 5 2 2 2
1 1 2 1 2 4 1
1
1 1 1 2 1 5 2
2,0
2.5°- 24
7.5°
r.z 2
1 1 6 1
6 3 4 3
1 5 4 2 2
1 1 2 1 1
5 2 2
2 2 I. 1
N
42
112 5°
-15
7.5°
Fr;
>10 9
to 8 N 2 8 1 5
4 3
'1.3 2 1
H >10
9 al 8 N 7 cv 6 I 5
rn 3 2
510 9
111 6
1 5 et, 4 r. 3
1
410 o 9 N M 7 Hi 6 I5 ft, 4 r3 V cv 2
1 1 3 1 2 3 1 1 1
tr)*
• N 0 N
1 3. 2 1
6 2 2
1 1 2
4 1 2 1
1 1 9 3 4 3 3 1 3
3 1 5 4 4 2 1 2
1 5 1 2 2 2 3.
1 3 2 1
1 5
H >10
9
fh N 7 • 6
to 4 r3 M 2
>10 9
6
1 5 er, 4
,0 2
>10 9
tfl 8 N
8 1 5
et, 4 1.4 3
2 1
410 e 9 ‘11. e
7 N 6 I 5 in 4
r..; 3 . CV 2
3 3 1
1 4 2 1 1
1 1 2 4 5 5 1 2 1
3 1 5 2 1 1
3 2 6 3 2
U)
en
re)
Tn
112 5
° - 15
7 5
°
>10 9
tri a lV ; 1 5 et, 4 H: 3 t0 2 11
25°
- 15
7. 5°
>10 e 9 01 a
7 N 1 5 al a I, 3 V cu 2
In
sr N
202.5
°- 247
.5°
N 7
>10 9
the
N6 1 5
1, 4 t: 3 1.12 2
1 7 1 6
2
1 2 1 2 1
2 4 3 1 1
E
H >10
9
e N 7 HW6
5 43 4
M 2 P.: 3
1 6 1
4 6 2
2 1 2 1 6 1 2 1
2 2 5 4 4 1 2 1
2 2 2 5 2 2 3.
3 1 1 2 5 1
1 4 3 6 2
1 3 2 1 1 4 1
1 2
3 3 2 3 1
1 1 2 3 3
T <5 1 6 1 8 1 10 1 12 1 14 1.15 E 7 .5 1 6 1 8 1 10 1 12 1 14 14151 2
11451 6 1 8 1 101 12 1 141.15 I 7.51 6 I a 1 101 12 1 14 14151E
BLOCK:D7
BLOCK:Da
TI.516161 101 121 14IH15 I 7.516181 101 121 14141512
7 .51 13 1 8 1 10 1 12 1 141415 E 71.51 6 1 8 1 10 1 12 1 14 1>151
TI.516161 101 121 14IH15 I 7.516181 101 121 14141512
7 .51 13 1 8 1 10 1 12 1 141415 E 71.51 6 1 8 1 10 1 12 1 14 1>151
BLOCK:DIO BLOCK: D9
BLOCK:DIO BLOCK: D9
NOTES: NOTES: — DIRECTION INTO WHICH WAVES PROPAGATE—IN DEGREES — DIRECTION INTO WHICH WAVES PROPAGATE—IN DEGREES
H — WAVE HEIGHT IN METRES. H — WAVE HEIGHT IN METRES.
T— WAVE PERIOD IN SECONDS. T— WAVE PERIOD IN SECONDS.
— ONE OCCURRENCE REFERS TO A SIX HOUR MEAN — ONE OCCURRENCE REFERS TO A SIX HOUR MEAN
APPENDIX FIGURE 15d: Directional Wave Statistics for March APPENDIX FIGURE 15d: Directional Wave Statistics for March
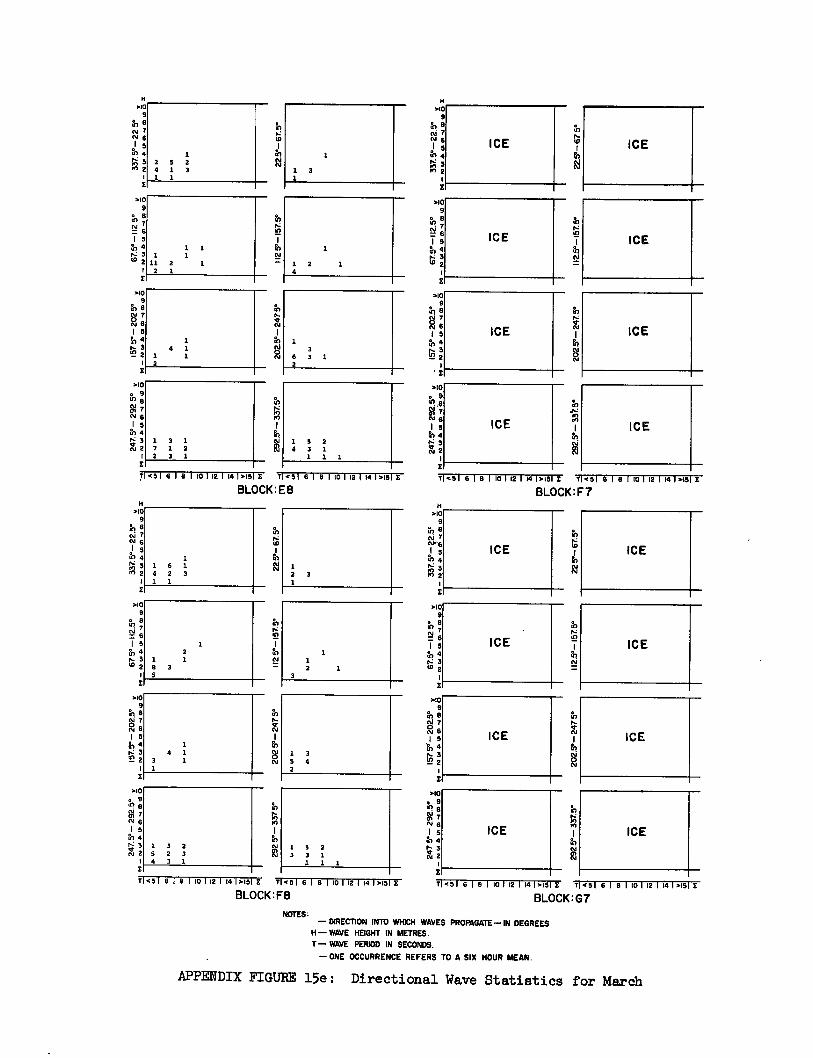
&.! a co 7 N 6 ICE j 5 0 4 N 3 M 2 1 3
1
1
1 2 1 4
N N N 6
1 5 4 1
N 3 2 5 2 M 2 4 1 3
1 1
112
5 °-1
57.5
°
1 5 th 4
El
1 1 1 1
11 2 1 2 1
1 1 4 1 3
1 1 6 3 1 2 2
1 5 2 4 3 1
1 1 1
T <51 6 1 B 110 1 12 1 14 1.151
1 3 1 7 1 2 2 3 1
<51 6 1 8 1 10 1 12 I 14 1.15 E
BLOCK: E8
H >10
9
ICE
>10 9
in a ;
1 5 a, 4 N 3 w 2
>10 9
re/ 5 co 7 0 N 6 1 5 th 4
ICE 5) N
ICE
ICE ICE
l 'E
>10 e 9
411 g N 6 1 5
Pn 4 r: 3 ct 2
I <5 1 6 I B 1 10 I 12 114 1.15 E T <51 6 1 8 1 10 112 1 14 1.151 E
BLOCK: F7
202.
5°- 24
75°
>10 9
ONE 7 N 6
I 5 fr) 4 1,: 3 N 2
El
T
202.
5°-2
47.5
°
>10 9
I 5 ▪ 4 ts 3 0 2
ICE ICE 5,
H
1 2 3 1
>10 9
11? a N 7 1,1'.
5 rn 4 N 3 22
ICE tO ICE
H >10
9
&I a cv 7 csi
5 5) 4 N 3 2 2
1 1 6 1 4 2 3 1 1
>10 9
1 5 ICE ICE l4
1 N 3 2 1 45 2
3
>10 9 e N
N 1 5 ICE NN
ICE 1, 4 5, 1 3 5 4 ul 3 2
1pV
2
112.W
-157
.Y
&I V. 6 I 5
th 4
.10 9
31 9 N 7
6 1 5
fb N 3 `n 2
>10 9
1125°-
157
5°
202
5°- 24
7 5°
1 2
1 1 8 3 5
1 4 1
3 1 1
>10
: 7
N6
1 5 4
I 5 al 4 N 3 .4 2
71<5 1 1 8 1 10 1 12 1 14 1.151 E 7 <5 1 6 1 8 1 10 1 12 1 14 1.15 E 71.51 6 1 8 1 10 1 12 I 14 1.151 I
BLOCK:G7
[Er 3 2 1 5 2 3 3 3 3 1 1
6 1 8 1 10 1 12 1 14 1.15 E 7 451 6
BLOCK:F8
>10 e 9
e 4,
F4 76 I5 ICE ICE
th 4 5,
H
NOTES: — DIRECTION INTO WHICH WAVES PROPAGATE— IN DEGREES
H— WAVE HEIGHT IN METRES.
T— WAVE PERIOD IN SECONDS.
— ONE OCCURRENCE REFERS TO A SIX HOUR MEAN.
APPENDIX FIGURE 15 e : Directional Wave Statistics for March
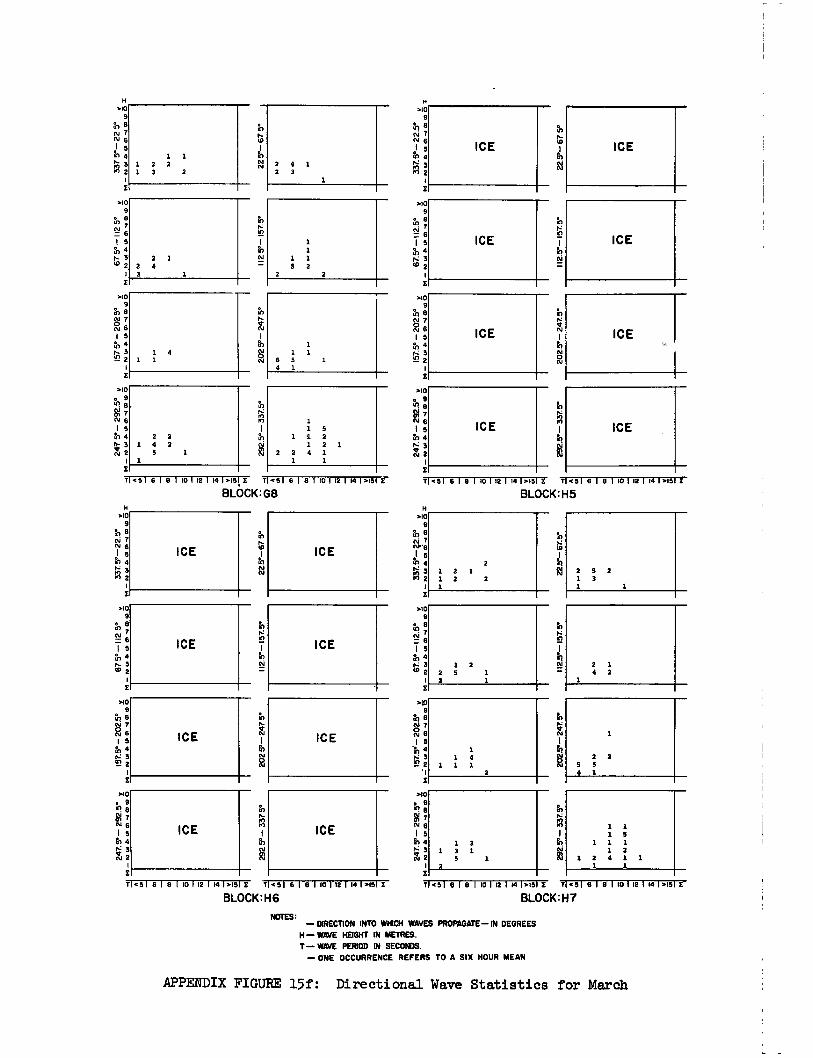
H >10
9 an N 7 N 6 j 5
4 3 2
1 1 1 2 2 1 3 2
610 9
the N 0 N 6 1 5 rn 4
rr;
>10 9
1 5 a, 4 r- 3 tO 2
2 1 2 4 3 1
1 4 1 1
112.5
°-1
57. 5
°
6, to to
1 1
1 1 5 2
2 2
112
5°—
57.
5°
.10 9
8
• 7
tV 6
1 5 rn 4 N._ 3
2
H 610
9
t11 8 N 7
22
5°—
67 5°
eu 4,
tla
N 6 1 5
an 4
23
ICE
1 1 1
6 5 1 4 1
ICE
ICE
ICE
ICE
ICE
>10 9
a? 7 N 6 1 5
en 4 IT 3 N 2
El
71.5 1
1
1
ICE
an
1 trt
1615 E 7 451 6 18 1 10 1 12 1 14 1.151 E
BLOCK: H5
>10 • 9
7 .4 6 I 9
11 4 3
X' 2
to
O'
aA
ICE ICE 1 3
1 3 1 1
2
1 1 1 5
1 1 1 1 2
1 2 4 1 1 1 1
H 610
9
th 8 N N 6
e! 5 0 4 N3 2 2
111 1, 1.1
610
111 :
1 1 5
; 1 5 ICE
2 2 an 1 1 2 tr) 4 4 2 1 2 1 5 1 2 2 4 1 tpH 2
1 1 1
8 1 8 1 10 1 12 I 14 1615 X 7 451 6 1 8 1 10 1 12 1 14 1.15i 114 51 8 1 8 I 10 112 1 14
BLOCK:G8 H
ICE 6,
ICE
610 9
t0 N 7
I
an
co
PR 0 4 2 1 2 1 2 5 2
122 1 2 2 1 3 1 1
>10 9
ICE
rn
an ICE
610 9
&I 1;
1 5 fh 4
V/
1
3 1 2 2 1 '8 2 2 5 1 4 2 1 2 1 1 X
610 9
al em 7
ICE N ICE 1 5 rn a, 4 1 an
1 4 lV 2 2 1 1 1 5 5
• i 2 4 1
>I0 9 8
eq 76 1 5 N 4 N 3 El 2
>10 e 9 0 8
g 1 5
an 4
71 691 8 1 8 1 10 1 12 1 N 1615 491 6 1 8 1 10 112 1 14 16191 X
BLOCK:H6 4516113110112 1 14 1615 714 51 6 I B 1 10 1 12 1 14 1 6191£
BLOCK:H7
NOTES: — DIRECTION INTO WHICH WAVES PROPAGATE— IN DEGREES H— WAVE HEIGHT IN METRES. T— WAVE PERIOD IN SECONDS.
— ONE OCCURRENCE REFERS TO A SIX HOUR MEAN
APPENDIX FIGURE 15 f : Directional Wave Statistics for March
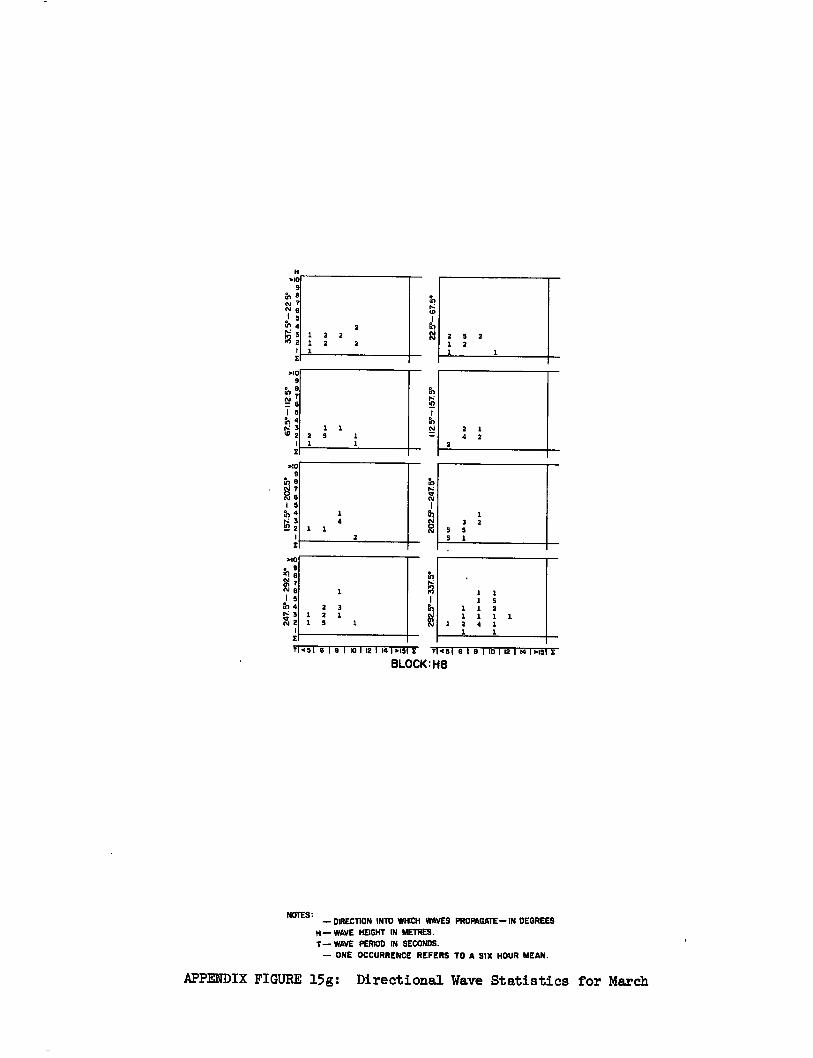
1
1 1
2 3 1 2 1 1 5 1
>10 9
the
1 5 4
N 3 8/ 2
>10
to: N 7 6 1 5
rn 4
01*3
N 2
1 1 1 5
1 1 2 1 1 1 3.
1 2 0 1 1 1
1 3 2
S 5 1
2 5 2 1 2 1 1
2 1 4 2
2
to to
112.5°
- 15
7. V
•
NN
2 1 2 2 1 2 2
>10 9
1'71 tS 6 1 S th 4 N 3 8 2
j 5 18 4
6 /2 2
>10 9
tr) 8 Cm 7 N 6
11.051 sIaItol 12114 1 >15 I 71 m51 6 I 9 110 1 12 1 141>151
BLOCK:H8
NOTES: — DIRECTION INTO WHICH WAVES PROPAGATE—IN DEGREES
H — WAVE HEIGHT IN METRES. T— WAVE PERIOD IN SECONDS.
— ONE OCCURRENCE REFERS TO A SIX HOUR MEAN.
APPENDIX FIGURE 15g: Directional Wave Statistics for March
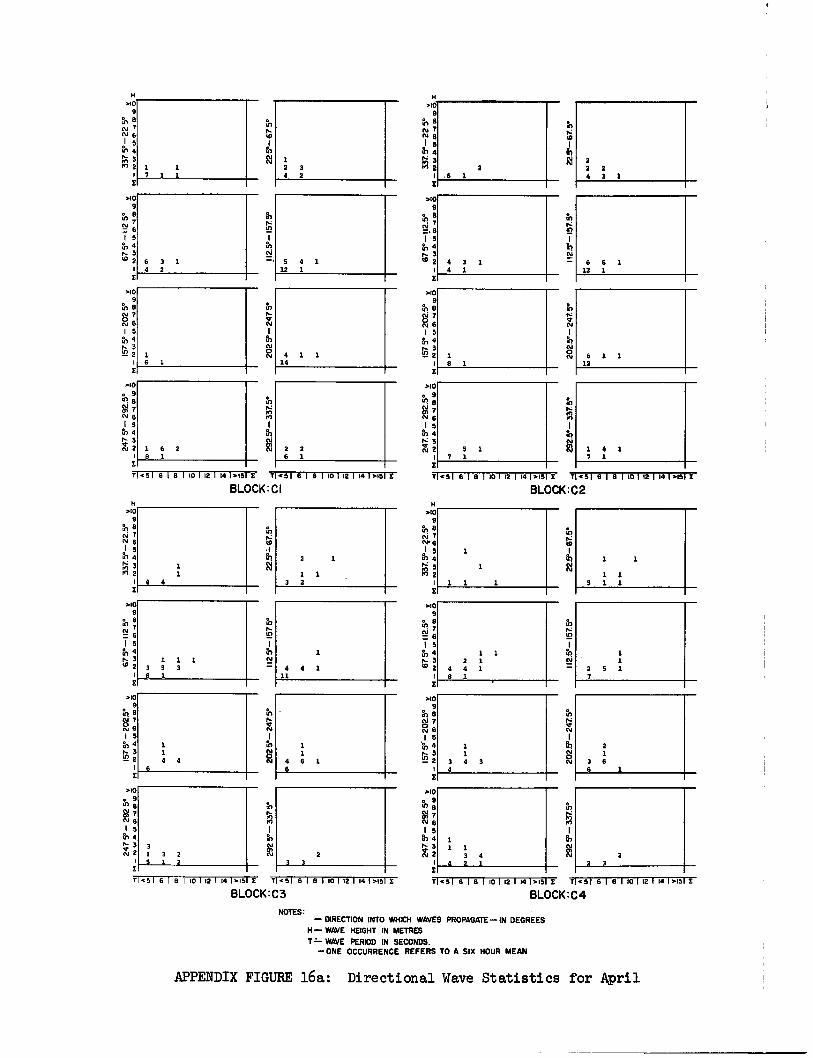
6 1 1 12
1 4 1 7 1
2 .6 1
1 1
4 4
T 45I6181101 121 141015 E 11<51 61 B 1 101 121 141,151E
BLOCK:CI H
>10 9
al N 7
a, 4
M 2 1
112
5°-
15 7
202 5°
- 24
7
71<5 16181 101 121 81 1.15E 74516191 101 12 1 1418151E
BLOCK:C3
11451 8 I B 1 10 1 12 1 14 1015 E 7451 8 1 8 1 10 1 18 1 141.151
BLOCK:C2 H
>10 9
.1 5 117 4 Is: 3
>10 9
1 5 rr, 4 P 3 67 2
N B 1 5
',en 4 N 3 tn 2
>10
al 7 N6 15
4
71 < 5 1 6 I 8 I 10 1 12 1 NI 1.15 E 7 <51 6 1 8 1 10 1 12 1 14 1 0151
BLOCK:C4
>10 9
rfl 8 N 7
Fr1 N 7 N. 6
M 2
NOTES: — DIRECTION INTO WHICH WAVES PROPAGATE—IN DEGREES
H— WE HEIGHT IN METRES
T1- WAVE PERIOD IN SECONDS. — ONE OCCURRENCE REFERS TO A SIX HOUR MEAN
I1 S
APPENDIX FIGURE 16 a : Directional Wave Statistics for April
4 3 1 4 1
H >it)
9 to a N 7
6 3 1 4 2
1 6 2 8 1
1 6 1
4 1 1 14
2 2 6 1
1 2 3 4 2
5 4 1 12 1
112.5
°-15
7.5°
N
rn 2
M
at
in
N
rn
N
al
2
•
r.g
>10 9
51j 6 1 5 th 4 r- 3 W 2
>10
7 K6 1 5 th 4 I- 3 D 2
>10
ft)
Si 7 N 8 I 5
07 4
'4 3 N 2
>10 9
a)
5 N 4
2
0 N 7 N 1 5 a, 4
['A
>10 9
ul 8 01 7 N6 15
en 4
N%1* N O
H >10
9 en 8 N ? N 6 rs1 6
I 5 >1 4
> en 2 7 1 1
6 6 1 12 1
18 1
5 1 7 1
2 2 2 4 3 1
4, trO
112. 5
°-1575°
20
2.7
-24
75°
1 1
2 5 1 7
2 1
3 6 6 1.
2 3 3
1 1
4 6 1 6
2
1 1 3 2
1
1 1 1
1 1 1
3 4 4 2 1
1 1 2 1
4 4 1 8 1
1 1
3 4 3 4
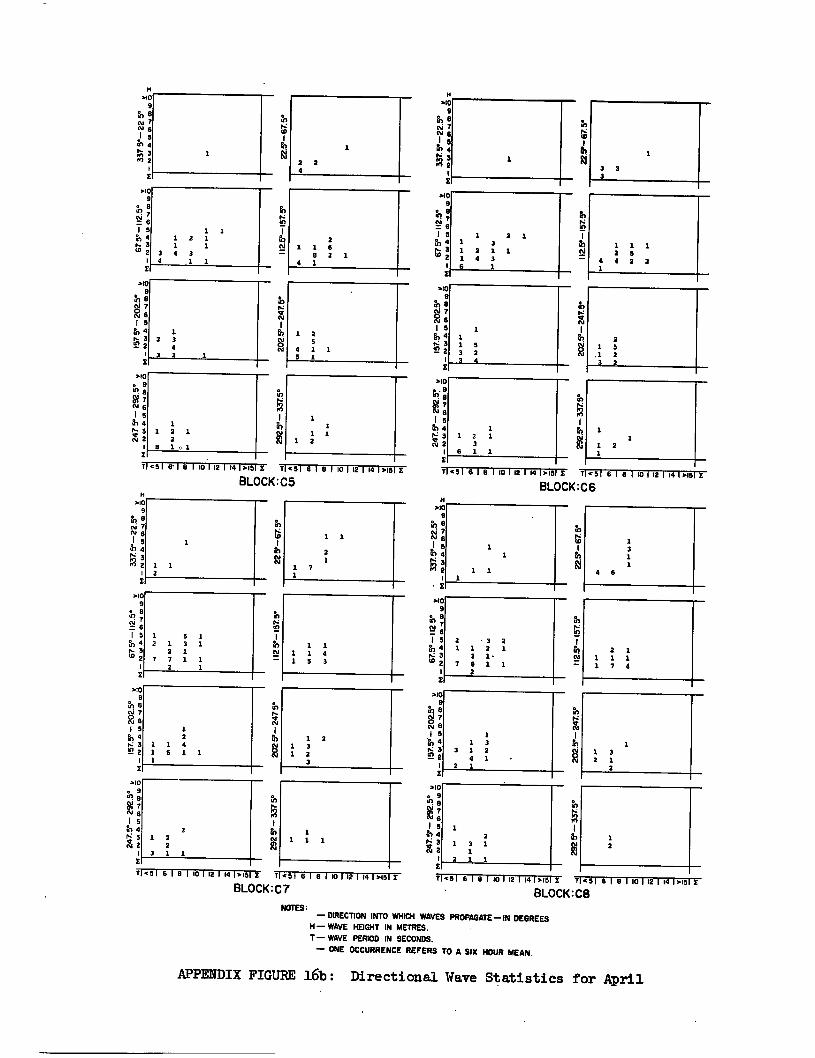
APPENDIX FIGURE 16b: Directional Wave Statistics for April
1 3 1 1
4 6
T 4516' 18 I 101 12 1 14 1.15 I 7 451 61 B 1 10 1 12 I 14 1.15
BLOCK:C5 71451 6 1 8 1 10 112 114 1.15 E 7 4516161 10 1 12 1 14 1 3431
BLOCK:C6
1
1 1 2
I12.
5°-1
57
5°
2
1 7 1
8,
1 2 1 3 1 2
3
1 1 1 1 4 1 S 3
1 1 1
H 3,40
9 h
7 N 6 I ,r) 4
3
2 2
310 9 8 7
1):' I 5 rn 4
t.r3 :
>to 9
o e
7 N 6 1 5 to 4 r: 3 in 2
112
5 °-1
57.
5°
292 5°
- 3
375°
H >10
9 th a
7 N 6
5 61 4
3 2 2
• 310
9 to a (21 ; 1 5
4
3 2
.10 .9
IA
15 1h 4 N: 3 in 2
.10 e 9 ,r! e
tN~ B 1 5
PA 4 3
N 2 1
1 5 1 2 1 3 1
2 1 7 7 1 1
2 1
1 2
1 1 4 1 6 1 1 1
.10
a, p1 7
2 1 5
in 4
a 3 N 2 1 1
2 3 1 1
1 2
1 3 1 1
2 1
3 2 21 1 2 1 3 1
7 8 1 1 2
1 1 3
3 1 2 4 1
2 1
1 2
2 1 1 1 1 1 7 4
1 1 3 2 1
2
71451 6 1 8 1 10 1 12 1 14 1.15 I T 451 6 1 8 1 10 1 12 1 14 1.151 E
BLOCK: C7
NOTES: — DIRECTION INTO WHICH WAVES PROPAGATE—IN DEGREES
H— WAVE HEIGHT IN METRES. T— WAVE PERIOD IN SECONDS.
— ONE OCCURRENCE REFERS TO A SIX HOUR MEAN.
T 451 6181101121141.15E T 451 6 1 6 1 10 1 12 1 10 1.151
BLOCK: C8
1
3 3 3
1
2 2 4
4 1 1 1
2 1 1 6
6 2 1 4 1
1 1
1 1 1 2
H >10
9 111 5 N 7
1
.10 9
in a f. u. ; I5 rn
.10 9
15 in 4
3 ▪ 2
.10
Si 7 N 6
I5 GI 4 r3 N2
IA
112.
5.-
157
5°
a, 4
N 3 'n 2
.10 e 9
V7 N 6
8
I 5 &•) 4 ▪ 9 Xt. 2
1 5 ,n 4
;
>10 9
N
1 5
N 6 1 5
=04
H
9 in 5 N N 6
5 s", PA
2 1
si0 9
111 ; • 6
1 1 1 2 1 1 1
3 4 3 4 1 1
1 2 3
4 3 3 1
1 1 2 1
1 8 1 o 1
1 2 1 1 3 1 2 1 1 1 4 3 6 1
1 1 1 2 5
4 4 2 2
1 1 5 3 2 3 4
1 1 2 1 3
6 1 1
2 1
.1 2 3 2
1 2
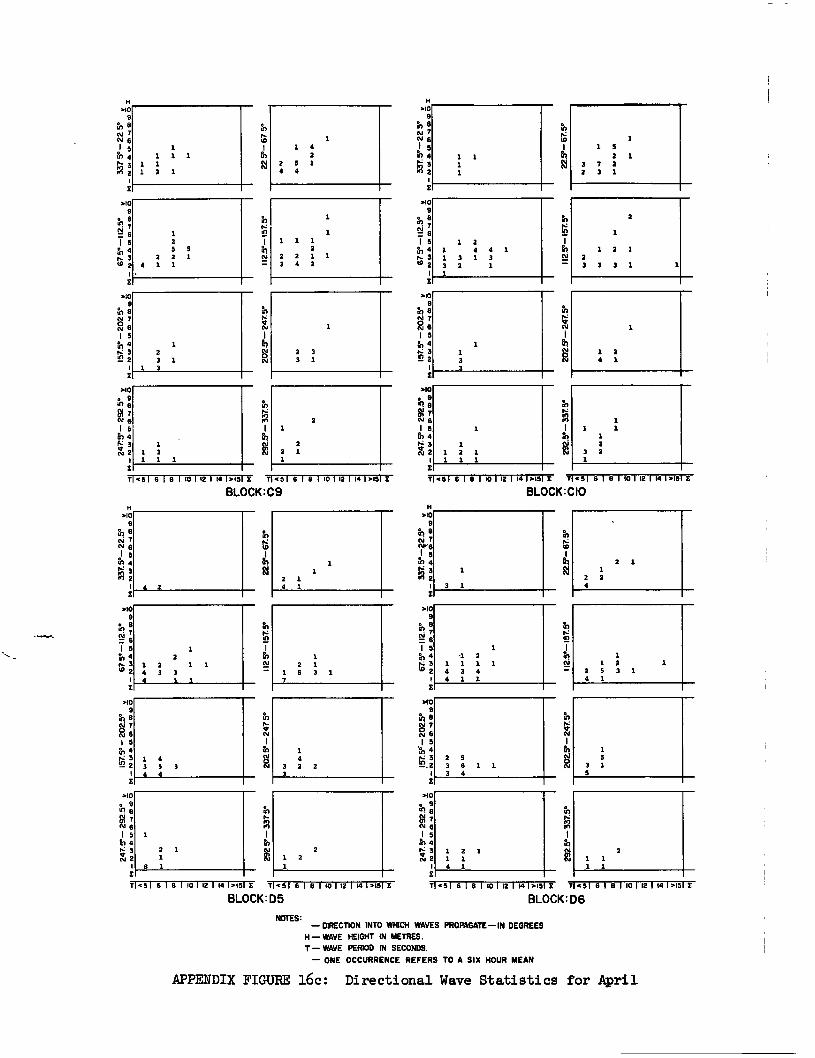
4 3 2 2
x 7 51 6 1 8 1 10 1 12 1 14 1 015 /
BLOCK: C9
010 ▪ 9 81
V 7
I s Pt, 4
2 1
2 2 1
T <51 818 1101121141015
1
1 2 5 5
2 2 1 4 1 1
1
N 2
2 5°
- 67
5°
1 5 Eh 4
H $0
9 in cv 7 N 6
r. 3 2 2
1
NO 9
o8 IV ;
1 5 a, 4
3 tD 2
1
0109
toe N 7 0 NI 6 1 5 th 4
3 2 1
1 2 3 1
1 3
1 1 1 1
1 1 1 2 1
1
2 5
4 4
421
1
1 1
2 4
1
1 1 a 1 1 2
1
2 3 3 1
H 010
9 tr) 8 N 7 cv 6
ol 5 10 4 „.,P4 3 id 2
010 9
al 6 I 5 u, 4 F 3 tD 2
010 9
al 0 cv 7 0.1 6
1 5 ti, 4
in 3 in 2
010 0 el
9
1 5 a, 4 P.; 3 N 2
1 1 1
1
4) to to
3 2
1
7 3
5 2 2 1
1
1
1 1 3
1
3 2
2 4 1
4 3 1
1
In
23 1
3
1
2
3
2
1
1 1
1 3 3
1
trt
V
1 4
2 1
1
1 1
1 2 1
1
1 1
1
3 1
1 2 2
1
71051 6 1 13 1 101 121 141 >15 X 1.51 6 I B 1 101 12 1 14 1.151 /
BLOCK:CIO
T <51 6181 101 121 141015 2 T1451 6 1 61 10T12 1 14 I.151
BLOCK: D5 TI 451 8 1 8 1 10 1 12 1 14 1.15 I T 461 6 1 8 110 1 12 1 14 1.151 I
BLOCK: D6
NOTES: — DIRECTION INTO WHICH WAVES PROPAGATE—IN DEGREES
H — WAVE HEIGHT IN METRES. T— WAVE PERIOD IN SECONDS.
— ONE OCCURRENCE REFERS TO A SIX HOUR MEAN
APPENDIX FIGURE 16c: Directional Wave Statistics for April
rN
1.4
pN
1125-1
57. 5
°
e V7 01 8 1 5
a, 4 3
iru 2
H
1 1
010 9
al cv 7 Nr6
5 to 4 2
1
1 3 1
0109
N 8 IV ;
1 5 1 1 fh 4 1 2
2 1 .1 3 1 1 1 1 5 3 1 ce 2 4 3 4
4 1 1
NO 9
01 N 7 0 N6 1 5
11, 4 .1 3
2
010 o 9
112 5
°-157
. 5°
0109
N 7 Es 15
11,4
>40 9
1 5 A.) 4
3 2
H $0
9 ret N
I s N6
104
2 4
2 1 2
1
2 1 1
2 2 4
1 1 2
2 5 3 1 4 1
1
1 4 3 5 3 4 4
2 1
8 1
1 5
3 1 5
2 5 3 6 1 1 3 4
1 2 1 1 1 4 1
1 7
2
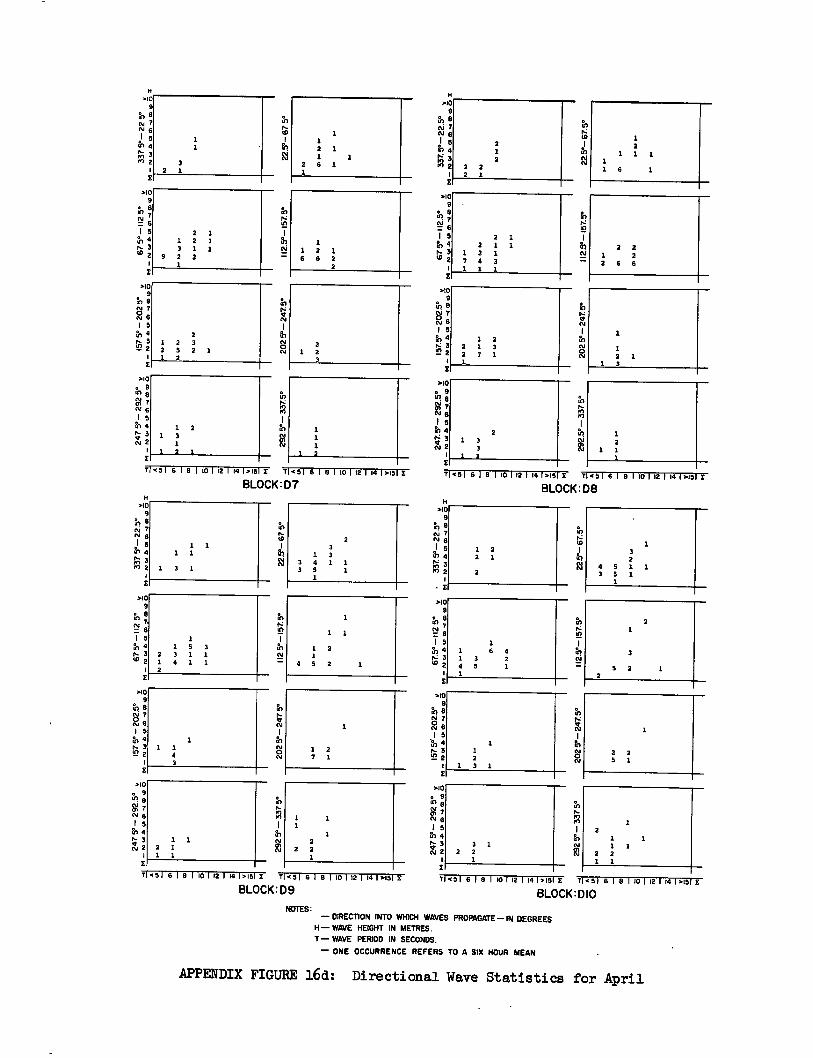
9
;}, 76
1 5 2 1 1 a,4 2 1 1
1 2 1 ti 3 1 2 1 1 6 6 2 ID 2 7 4 3 2
2 1 1 1
112.
V-1
57V
2 2 2
6 6
22.5°- 6
7 5°
11
2.5°-1
57. 5
°
ri tD
N
I
H >10
9 N oi 7 CM 6
j 5 In 4
In3 2 1
>10
1 1 2 1 1 6 1
3 2 1
2 1 1 2 1 3 1 1
9 2 2 1
2 1 2
2 2 2 1
1 2
1 1 1
1 6
3
1 2 1 3
1 1 1
2 1 1 1
3. 2
1 2 2 1 3 2 7 1 1
20
2 V
-24
7.5°
1
1 2 1
1 3
2 1 3
3 3. 1
1 2
1 1 1
20
2 V
- 2475°
>10 e 9 to
PI 7 N 6 I 5
in 4
4- 3 N 2
1 5 tr, 4
3 2
>10 e 9 1n B
I 5 b 4 1.:3 N 2
1
H >10
9
rc? a oi 7 N 6
.1 5 1,1 4
H >10
9
31 8 oi 7
2 ts.i 6 to 1 3 1 5 1 2 3
1 3 31 4 2 1 ro 2 3 4 1 1::-; 3 4 5 1 1 3 5 1 HS 2 2 3 5 1
1
>10 9
1 N 78 2
1 1 N 6 1
1 5 1 2 a, 4
3 1 1 3
6 24
3
4 5 2 tO 2 4 5 1 5 2 1 2
112.
5°-1
57. 5
°
>I0 9
• e , 113 6. I 5 a,4 r- 3 w 2
20
2 5°
- 2
475°
112
5°-1
575°
20
2 V
- 247
V
>10 9
0 N 6 Is
Ir., 4
E' 1 2 7 1
1 1 5 3
2 3 1 1 1 4 1 1 2
>10 9
ff. / N 7 (Csi 6 1 5
4
ri) 23
1 1 1
4 3
2 1 3 1
2 2 5 1
M
>10 e 9 0. B
7 N 6 I 5 in 4
7 <5 I 6 1 8 1 10 1 12 1 141>15 E 1*
>10 t. to 01 7
1 6 1 I 5 2
N 4 1 1 22
2 3
X' 2 2 3 1 2 2
1 2
1
1 1 1
<51 6I s 1 10 1 12 1 14 1.151 T <51 6 I 8 1 10 1 12 1 14 1.15 E T <51 6 1 8 110 1 12 1 14 1,151
292 V- 337
5°
H .10
9
111 5 os 7
22
>10 9
. 8
1 5 4
N 3 1.0 2
71<51 6181 101 121 141.15 / 74516181 10I121 141>1511
BLOCK:D7 71.51 6 1 B 1 10 1 12 I 14 1>15 E 7 <51 6 I B 110 112 I 14 1.151
BLOCK:De
BLOCK:D9
BLOCK:DIO
NOTES: — DIRECTION INTO WHICH WAVES PROPAGATE — IN DEGREES
H— WAVE HEIGHT IN METRES. T— VINE PERIOD IN SECONDS.
— ONE OCCURRENCE REFERS TO A SIX HOUR MEAN
APPENDIX FIGURE 16d: Directional Wave Statistics for April
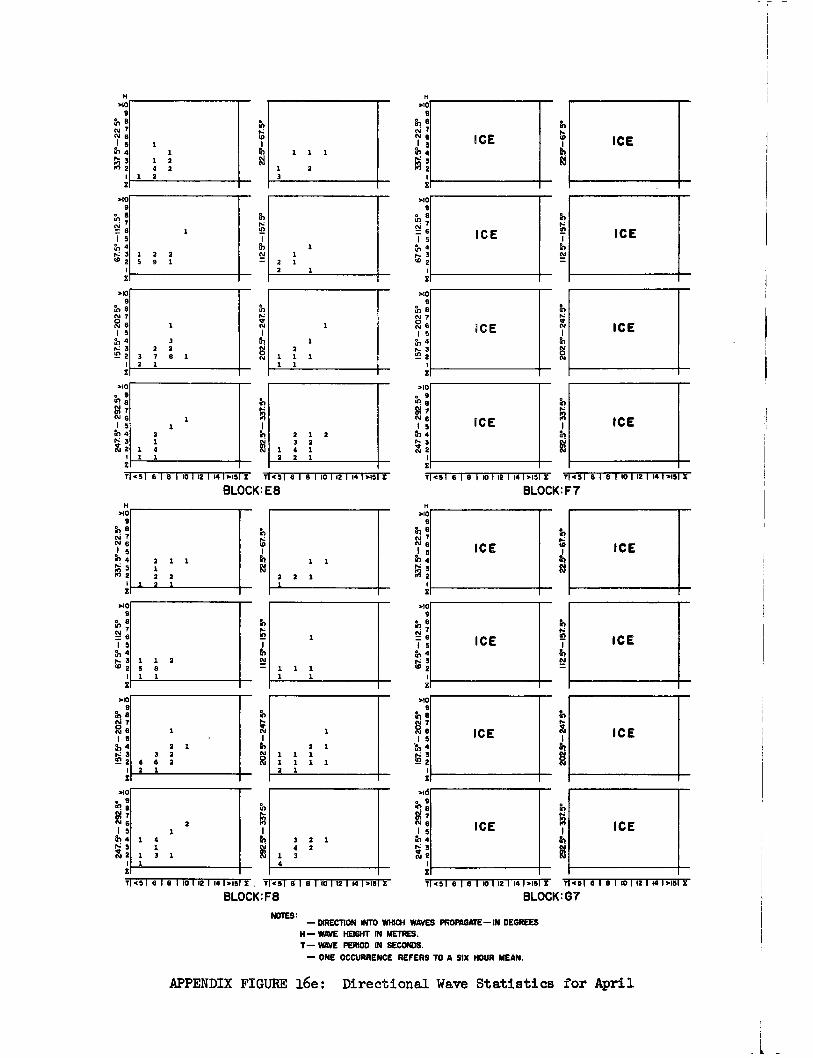
BLOCK:FS BLOCK :G7
NOTES: — DIRECTION INTO WHICH WAVES PROPAGATE—IN DEGREES
H — WAVE HEIGHT IN METRES. T— WAVE PERIOD IN SECONDS.
— ONE OCCURRENCE REFERS TO A SIX HOUR MEAN.
APPENDIX FIGURE 16e: Directional Wave Statistics for April
2
1 4 1
1 3 1 1
240 9
ej 76 1 5
th 4 3
W 2
.10 9
N 7 N 6 I 5
in 4 3
In 2
1 1 1
1 2 3
2 1 2 1
1 NN
112Y
-157
.5°
8 1 10 1 12 1 14 19151 E T1 45 1
1 1
.10 9
in 8 07
13 1 5
en 4 3
tr) 2
a-10 9 8
6 I5
trt 4 3 2
1 1
2 2 1 3 4 1 4 1 2 2
6 I 8 1 10 1 12 1 14 1915 I T 451 6 1
BLOCK: E8
1 2 2 5 9 1
1 1 2 4 2
1 2
3 2 2
3 7 8 1 2 1
1 2 2 1 1
N
T1451 8 1 6 1 10 1 12 1 14 1915 T 4 51 6 1 8 1 10 1 12 1 14 1 9151
BLOCK: F 7 H
910 9
e N 7 N 6 1 5 ICE
p.; 49 ICE
1 1 th 4 r3
2 2 1 2
910 9
in a 1,
1 tt 76 I 5 ICE ICE rr, 4 rz 3
1, N
1 1 1 W 2 1 1 1
toe
N
2 1
ti
3 2 1 1 6 2 1 1 1 2 1
.10 9
en N 7 lN 1 5 a, 4 I,: 3 tv 2 4
2
1
£
3 4
1 3 4
2 2
1
4418
9
al 7 N 6
1 5 1", 4
3 04 2
1
ICE 0'
1,
ICE
451 6 1 8 1 10 1 12 1 14 19151 E 71451 8 I 8 I 10112 114 1915 T 4 51 6 1 8 1 10 1 12 1 14 1 2451
540 9 e
0 N 7 N 6 1 5
4 rte
.3 tr, 2
910 9
'in ;
H .10
9
1°P a N 7 N 6 1 5 ai
T1451 6 1 6 1 10 1 12 1 14 1915 I T
.10 9
N6 Is rn 4
3 N 2
.1a .10
;.1 :
1 5 to 4 rz N2
a-10 9
in a ;
1 5 th 4 P 3 4:0 2
H eqo
9
e N ? N 6
j 5 1v 4 r 3 2 2
1
>to 9 e
KJ), 7. 1 5
4)2 11 4 r■ 3
ICE
ICE
ICE
ICE
ICE
ICE
ICE
ICE
1 1 2 5 8 1 1
2 1 1 1 2 2
1 2 1
ICE ICE
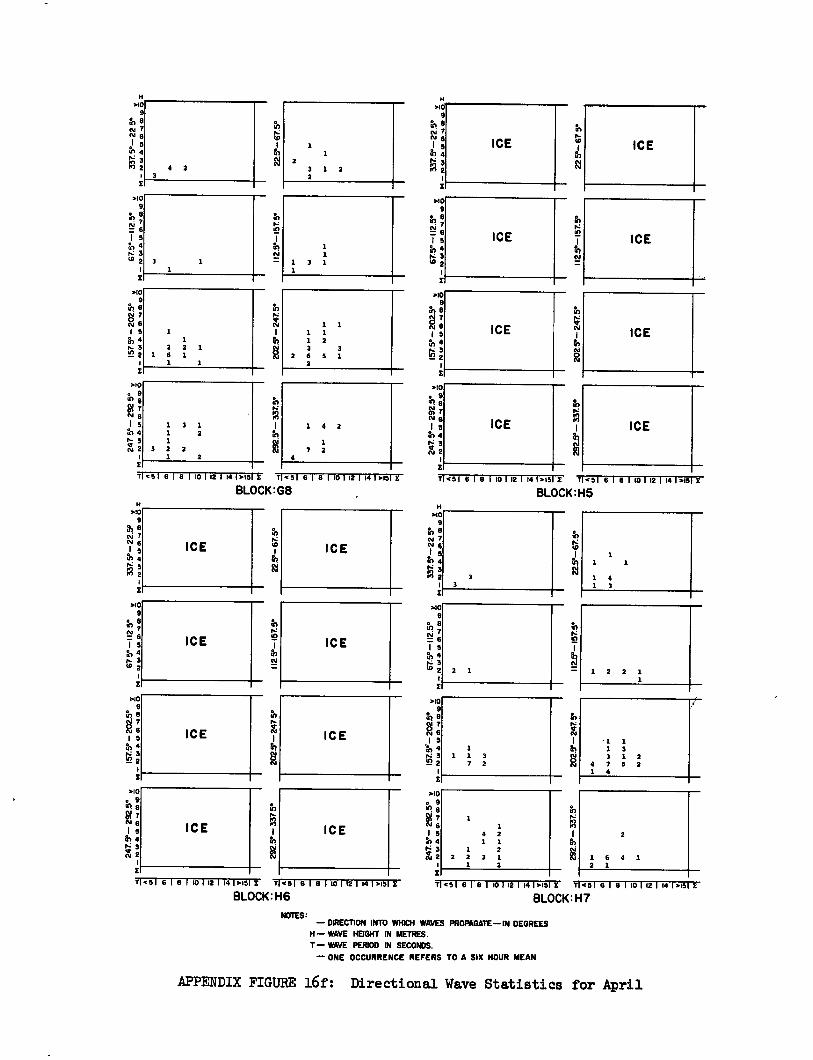
2 3
3 3
H
T <51 6 1 8 I 10 1 12 1 14 1.15 E T <51 6 1 a 1 101 12 1 14 1.151
BLOCK:H5
au) 9
0 a 8
EV 76 1 5 N 4 r- 3 W 2
6,10 9
N 6 1 5 4
>10 ▪ 9 Ins
N 6 1 5 11 4 a 3 N 2
1
H 340
9
13 N 7 N, 6 el 5 0 4
.10 9
Et,. 76 1 5
1.6 4 N 3 w 2
040
9
; 1 5
N3 2
112.5°- 1
57 5°
•
V
in in
Ki rel
U) 5,
010 9
6 I5 574 N3
71.51 6 1 8 1 101 12 1141.15 1 1451 6 1 8 1101121141.151E
BLOCK: H6 7 < 51 816101 121 141.15 Z 7.516181101121141.151E
BLOCK:H7 NOTES:
— DIRECTION INTO WHICH WAVES PROPAGATE—IN DEGREES H— WAVE HEIGHT IN METRES. T— WAVE PERIOD IN SECONDS.
— ONE OCCURRENCE REFERS TO A SIX HOUR MEAN
APPENDIX FIGURE 16f: Directional Wave Statistics for April
3 1 1
1 1
2 3 1 2 2
1 0 2
1 7 2
4
1 1 1 1 1 2 3
2 6 S 2
1 1
1 3 1 1
112.
5°-1
57
5°
>10 • 9
N6 1 5
a, 4
V 3
N 2
04
to N 7 N ,!
16; 3 M 2
.190
11i 16 1 5
in 4 3
W 2 1
.109
Fp 0
N 7 8
I 5 11,4 N in 2
TI .c 5 1 6 1 8 1 10 1 12 1 14 1.15 I T <51 6 1 8 1 10 1 12 1 14 1.151 2
BLOCK:68
H 340
9
1 1
2 2 1 1 8 1
1
1 3 1 1 2 1
3 2 2 1 2
H 240
9 a) cU N I 5 0 4 N 5 IR 2 ty
112
V -
157.V
2
1 6 4 1 2 1
ICE
ICE
ICE
ICE
ICE
1 4 2 1 1
1 2 2 3 1 2
ICE
ICE
ICE
2 1
1 1 1 3
7 2
1 1 1 3 3 1 2
4 7 5 2 1 4
1
1 4 1 3
1 2 2 1 1
ICE
ICE
ICE
ICE
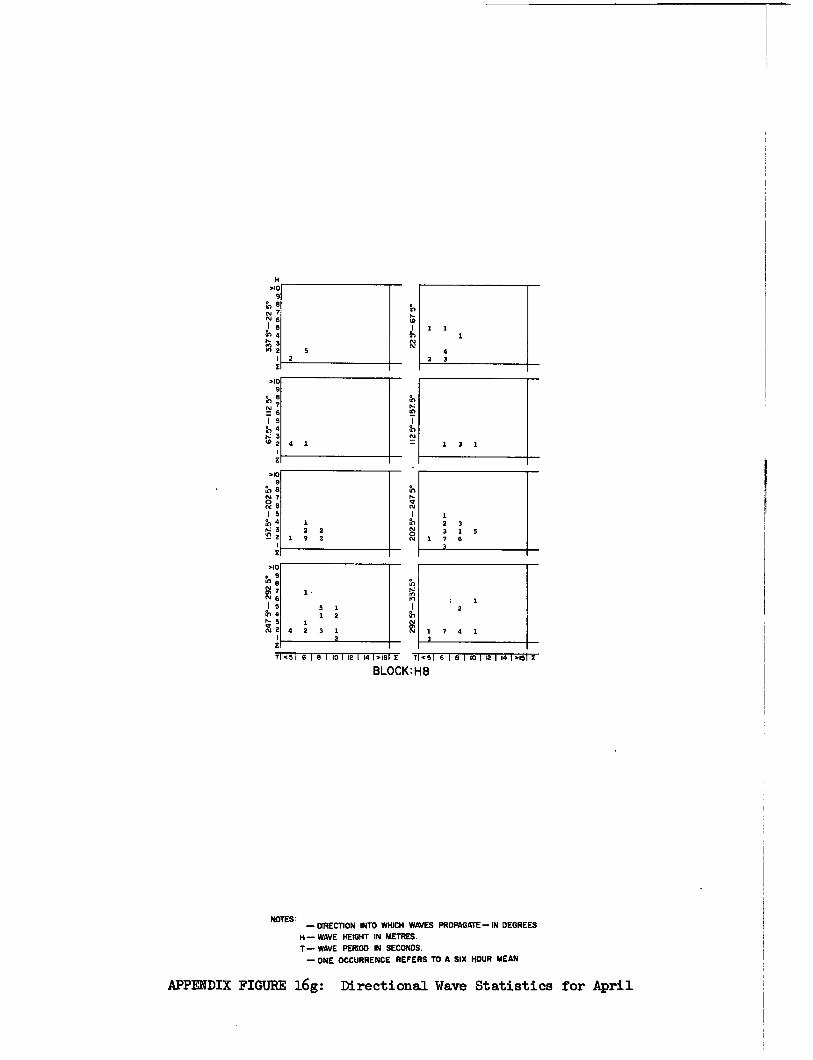
2
4 1
2 2 1 9 2
>10 9 0 a
1 g in 4
:
>10 9
13
1 5 a., 4
X
>10 9
in 9 N 7
6 1 5
fe, 4
trZ;):
>10 • 9 0 6
7 N 6
1 •
1 5 5 1 to 4 1 2
N 3 2 4 1 2 3 1
a
7 <51 6 1 8 1 10 1 12 1 141 >18 E
4 2 3
1 3 1
1 2 3 3 1 5
1 7 6
1
1 7 4 1 3
N N 6
1125
°-1
575°
4,
NN
N
in
ro
71451 6 1 8 1 10 1 12 1 141>131 E
BLOCK: H8
NOTES: — DIRECTION INTO WHICH WAVES PROPAGATE— IN DEGREES
H— WAVE HEIGHT IN METRES. T— WAVE PERIOD IN SECONDS.
— ONE. OCCURRENCE REFERS TO A SIX HOUR MEAN
APPENDIX FIGURE 16g: Directional Wave Statistics for April
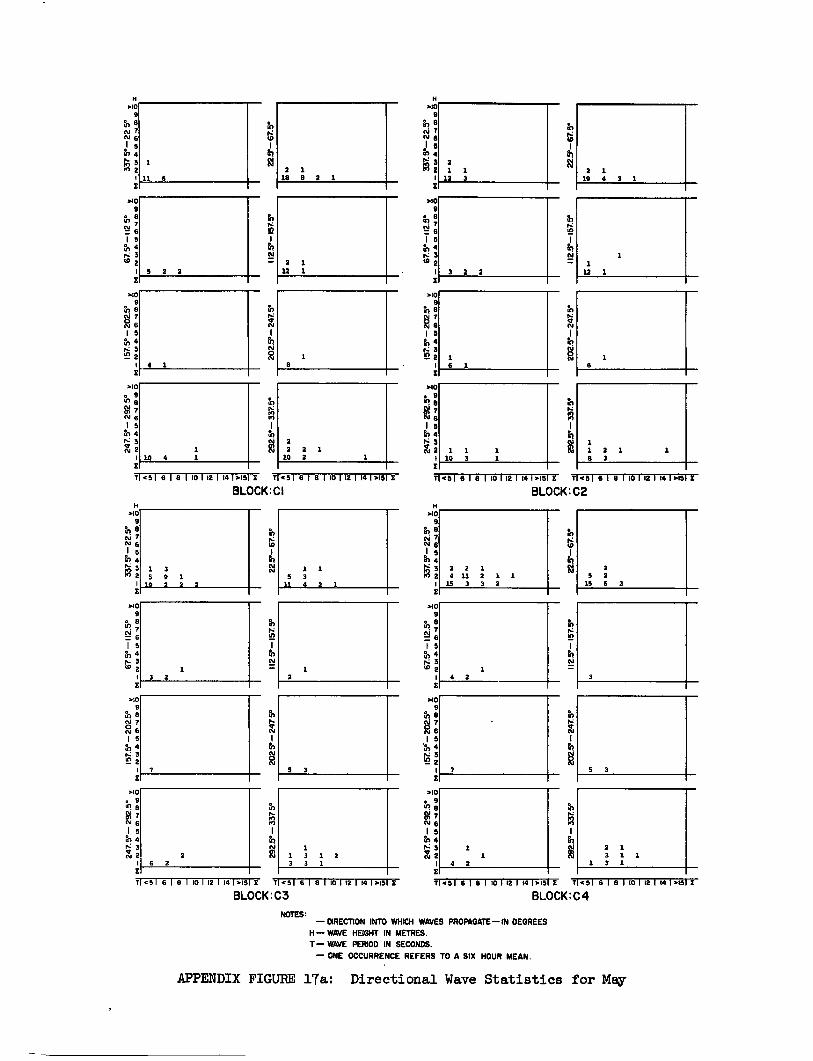
112V
-157
.5°
3 2 2
T5 5, 4 N 3 ■1) 2
110 9
in 8
15 a, 4 N 3 el 2
4 1
110 9
! 1 5
4 N 3 `n 2
: 1
4, N
N
110 e 9 Lc) 8 N7 N 6 1 5
Pn 4 1", 3 N 2
10 4 1 1
U.)
2 2
10 2 2
1
>10 e 9 III N T N 6 I5
Pn 4 N 5 N
1 1
10 3
202.5
- 2
47.
7451 6 1 8 110112 1141.15 I 71<51 6 1 8 110112 11411151 z BLOCK:CI
71.01 8 1 8 1 10 1 12 1 14 1115 E 7 <51 6 1 8 1 10 1 12 1 14 11151
BLOCK:C2
H 110
9 !
Nr
.50 9
I a
M
110 9
in N 7
110 9
N 87 V 6 1 5
in
N
In tO
NOTES: — DIRECTION INTO WHICH WAVES PROPAGATE—IN DEGREES
H— WAVE HEIGHT IN METRES. T— WAVE PERIOD IN SECONDS.
— ONE OCCURRENCE REFERS TO A SIX HOUR MEAN.
APPENDIX FIGURE 17a: Directional Wave Statistics for May
110 9
N 8 fV : 1 5 '- 4 N 3 0, 2
>10 9
fr.> 6 N7 86 1 5 5,4 N3 e2
>10 9
N7 N 6 1 5
N 3
H 110 9
rn N 7 N I 5
1114 N 3
2
E
3 2
7
2 6 2
1 3 5 9 1
19 2 2 2
T <51 6 I9 1 10 112 1 14 1115 E T<51 6 1 8 1 10 112 1 14 11151E
BLOCK:C3
2 1 3 1 1
1 3 1
<51 6 1 8 1 10 112 1 14 1.1511 71.51 6 1 8 1 10 1 12 1 14 1.15 E 7
BLOCK:C4
1 4 2
112.5
° - 15
7.
112 - 1
57. 5
°
fro
H 1(0
9 ih 8 NI 7 N6
1 3 M 2
>10 9
in 8
15 5) 4 N 3 t0 2
.10 9
; I5
4
mo 96 Ein
6 15
1.) 4 N 5 N 2
2 2 1 4 11 2 1 1 15 3 3 2
5 3 7
1 1 3 1 2 3 3 1
1 1
4 2
5 3
2 5 2
15 6 2
3
1
in
2 1 1 2 1
12 3 19 4 3 1
N 6 5
117 4 3
2 2 11 6
5 2 2
2 1 18 9 2 1
2 1 12 1
1 1 2 1
1 8 3
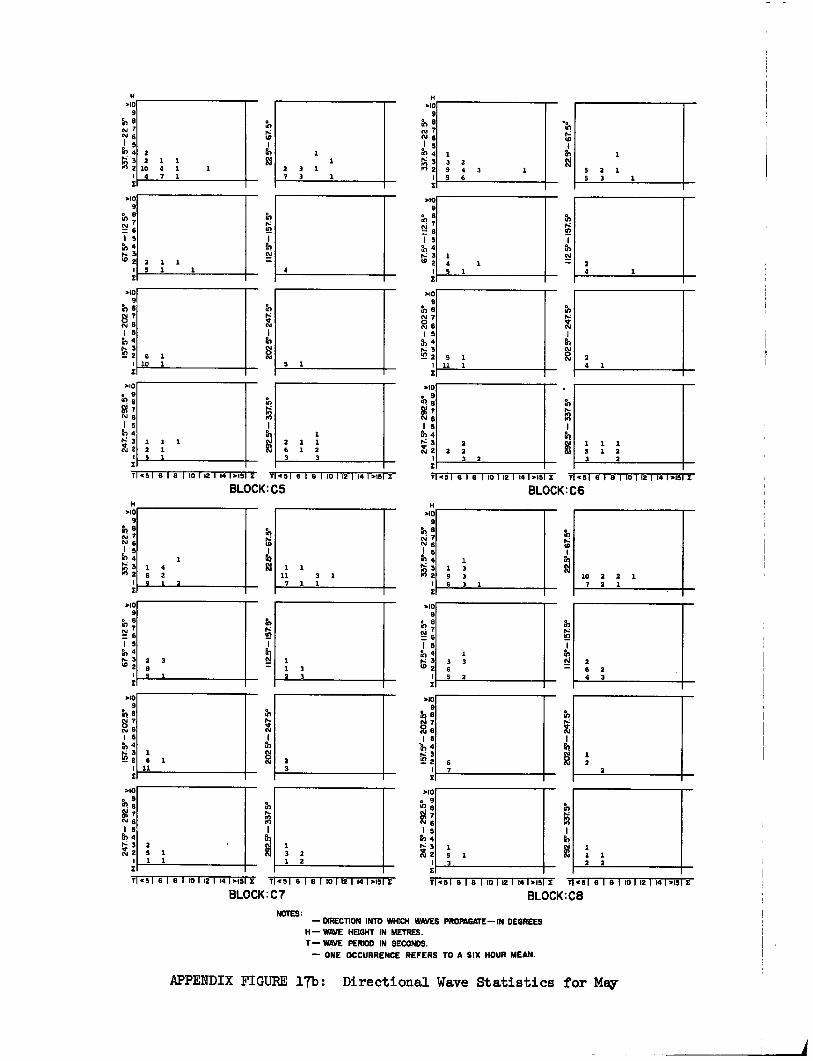
7410
9 to oi 7 .... 1 5 g, 4 r: 3
UI
1 rn
202
5°- 247
.5°
H .10
9 u,8
1 5
N 7 N 6
lb 4 5 2
MO 9
in N 7 0 N 1 5
a, 4 3 2
.10 e 9 4't g N 1 5 al 4 r: 3
2
H
9 fn 8 oi 7 N
M 2
5 .7 4
5
7410
9 ! 6
1 5 a, 4 r- 3 to 2
.10 9 8 117
N 7 gi 6 1 5
I}, 4 3
4' 2
.10 • 9 41 8 M 7 N 6 1 5
4 r: 3 ol 2
1 3 2 9 4 3
6
1 4 1 5 1
5 1
2 2 2
3 2
1 1 1 5 1 2 3 2
24 2
1
5 2 1 5 3 1
24
2 2 1 1
10 4 1 1 4 7 1
1 2 3 7 3 1
1 1 1 2 1. 5 1
2 1 1 5 1 1
6 1 10 1
1 2 1 1 6 1 2
3 3
4
1
ru
tf) 1
N
N
Pn
`0
▪
. yyI
NN
H .10
9 th N 7 N
J 5 5
2 a
7410 9
a ;
1 5 al 4 r-to 2
.10 9
h N 7 N 6 6 1 5
4 N 3 el 2
>10 • 9 6? 8
N
N 8
1 5 814
3
H .10
9
N 7 N 1 al 4
5
5 M 2
7410 9
11? 1 6
I 5 11.) 4
.10 9
7 N 6 15
1, 4
7410 e 9
8
g 15
11 4 1:4•-: 3 ni 2
1 4 6 2 9 1 2
1 1 11 3 1
7 1 1
2 5 1 1 1
2 3 8 S 1
1 3 2 1 2
1 1 3 2 3
2 3
1 1 3 9 3 6 3 1
10 2 2 1 7 2 1.
1 3 3 6 5 2
6 2 4 3
6 7
1 2
2
1 5 1 3
1 1 1 2 2
T 451 6 1 8 110 1 12 114 1.15 E 71451 6 1 8 1 10 1 12 1 14 174151 2
BLOCK: C5 714516181101121141.151 7 4 516181101121141.151E
BLOCK: C6
T 451 6 1 8 1 10 1 12 1 14 17415 X 71451 6 1 8 1 10 1 12 1 14 1.151 X
BLOCK: C7 71 4 5 1 6 1 8 1 10 1 12 1 141.15 I 7 4 51 6 1 13 1 10 1 12 1 14 1.151
BLOCK: C8 NOTES:
— DIRECTION INTO WHICH WAVES PROPAGATE—IN DEGREES H— WAVE HEIGHT IN METRES. T— WAVE PERIOD IN SECONDS.
— ONE OCCURRENCE REFERS TO A SIX HOUR MEAN.
APPENDIX FIGURE 17b: Directional Wave Statistics for MEW
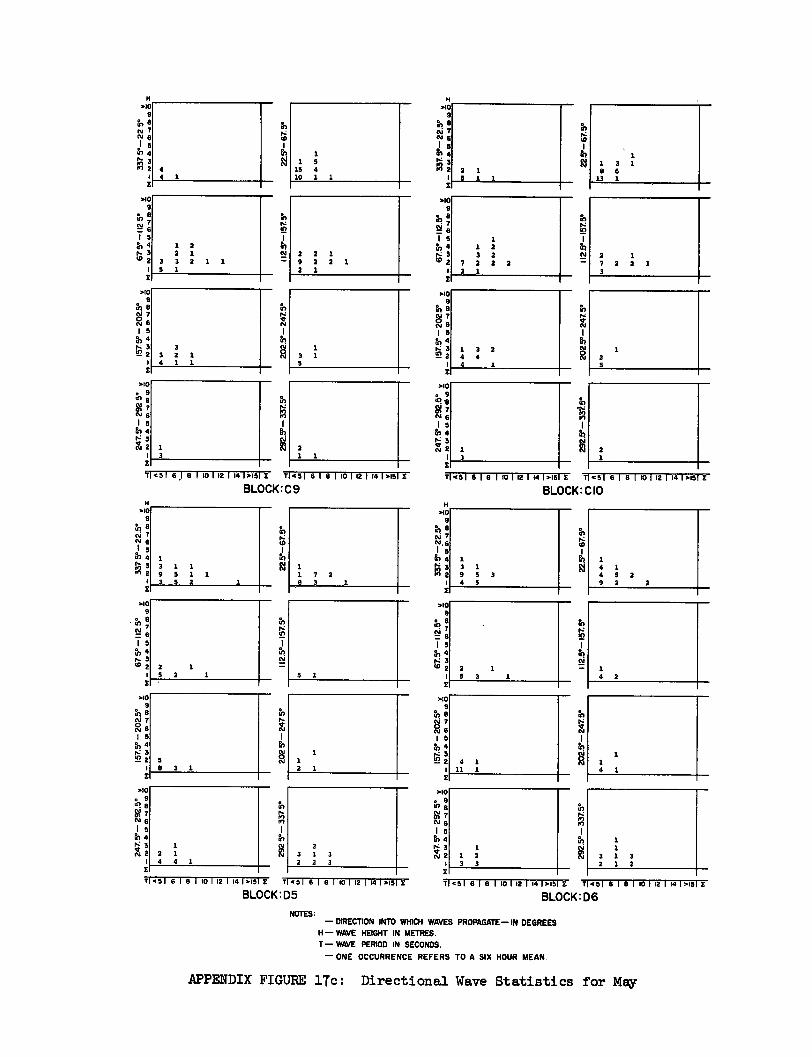
H
9
in
H .10
9
0 7 N N6 tD
I s j 5 N4
1.0 4 1
15
1 3 4
In 4 N 3 2 2 2 1
4 1 10 1 1 5 1 1
,90 .10 9 9
if3 *1 8 7 V 6
15 I s 1 11,4 1 2 IN 4 1 2
2 1 2 2 1 3 3 2 0 2 3 3 2 1 1 9 2 2 1 W2 7 2 2 2
3 1 2 1 1 3 1 I
.10 9
tr1 w 7 2 6
1 5 N 4 N 3 52 2 3
4
3 2 1
1 1
3 5
1 1
.0 9
g* 7 0 6 15 N4 N3 0 2 1
4 4
3 2 4
1
I 12
5' -15
7. 5
°
1 4 1 4 5 2 9 2 2
1 1 3 1 8 6
13 1
2 1 7 2 2 1 3
2
.10 .40 • 9 tn e
g N 6
1.14 V7 0.1 6
I 5 Is GI 4 b4 N 3 3 N 2 1 2 0.12
3 1 1 1 3 2
491 6151101121141,05 E T45I 6151101121141>1512
BLOCK:C9 T195I 8 1 8 1 10 112 1141>15 E T 951 6 I 8 I 10 1 12 I 14 1.151
BLOCK:CIO
112.5*-1
57
5°
qN
H
?s,
,90 9
th 0 7 0 N.6 PA J 5 1
1 3 1 1 7 2 9 5 3 8 3 1 4 5
H .10
9 N6 0 7
6 S
N4 1 3 2
I
1 1
3 1 3 2 1 2
4 2 5 1 2 1 5 3
8,
112.Y
-15
7.W
>10 9
"l 411 6 I 5 N 4 N 3 15 2
1
5 3 1
1 2 1 4 4 1
2 1 5 2 1
'11 6 I 5 N 4 N 3 '5 2
.10 9
h 8
0 N 7 N 6 I 5 N 4 N 3 12 2
.10 • 9 0.
7 N 6 I 5 h 4
v 3 3 0 2
.10 9
• to e7
8 1 2
1
1
110 9 8
15 N 4 N 3 52 2
4 1
11 1
tn
3 2
2 1 2
3 3
510 9
91
V 7 Ng I 5 N 4 9: 3 V cy 2
1
1 1 2 3 3
I
•
V
yyI YS
r•O'
Tpc51 6 I 8 1 101 12 I 14 1,95 I 7 <SI 6 18 I 10 112 1141>151 X
BLOCK:D5 71551 6 18 I 101 12 1 14 1.15 X T 961 6 18 I 10 1 12 I 0 1.01
BLOCK:D6
NOTES: — DIRECTION INTO WHICH WAVES PROPAGATE—IN DEGREES
H — WAVE HEIGHT IN METRES. T— WAVE PERIOD IN SECONDS.
— ONE OCCURRENCE REFERS TO A SIX HOUR MEAN .
APPENDIX FIGURE 17c: Directional Wave Statistics for May
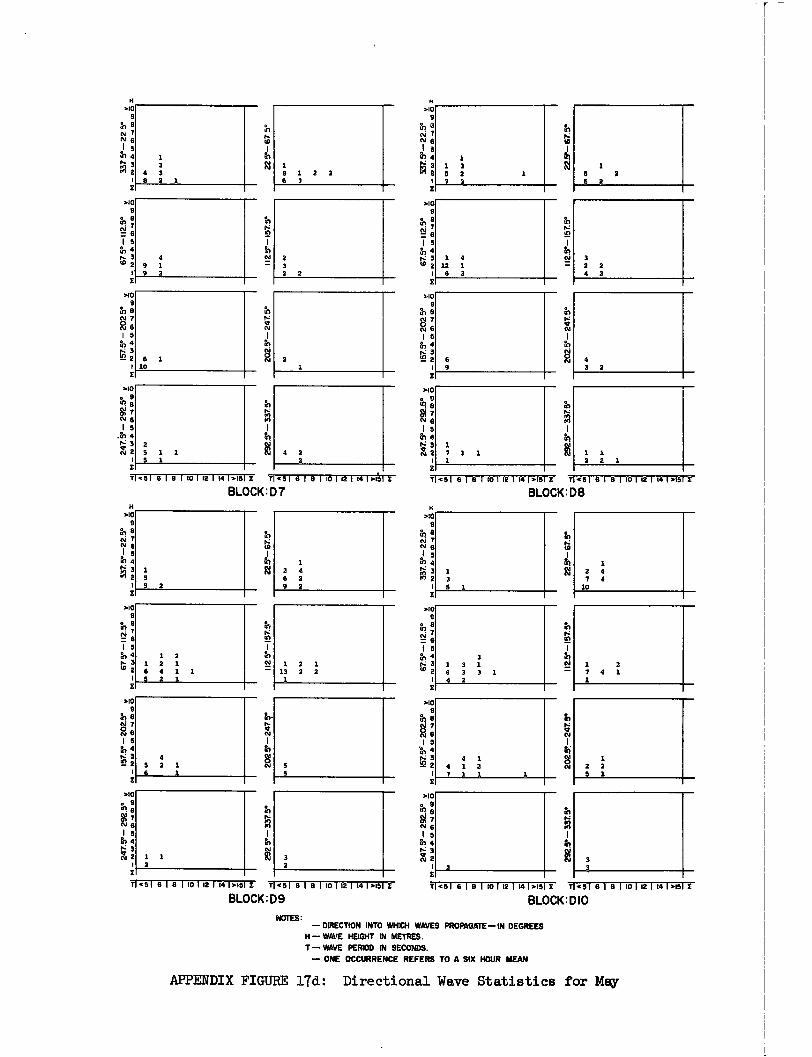
6 6 2
2 2 1
3 2 1 4 2
43 2
1 7 1 1 1
1 4 12 1 6 3
6 9
4 1 4 1 1 7 1 1 1
1 1 2
In to
hI
112.5
° -
157.
5°
202.V
. - 247
5°
3 1 3 1 6 3 3 1 4 2
1
S3 1
4 7 4
10
3 3
1 2 7 4 1 1
1 2 2 5 1
In
PA
112
- 15
7. 5°
H >10
9
al N N 6
h 4 N:3 M 2
>10 9
2i? 67I
I 5 6 4 N. 3 w 2
H .10
9 al N 7 61 6
>10 9
111 6
I 5 fr., 4
>10 9
NI 13 I 5
4
512
Si 7 N 6 '5
11 4
:
j 104 .z 3
g
>10 e 9 e
.10
N 6 1 5
P-, 4
a 3 N 2
1 S 5 2
1 2 4 6 2 9 2
1 2 1 1 1 6 4 1 1 5 2 1
1 2 1 13 1 2 1
3 2
H
V7 N 6 1 5
.h 4 i■ 3 N 2
0 N 7
1 5 64
3 2 2
• 9 'n 6
>10 9
th
,1 5 64
1023
N 7 N6
.10
ti
1
0: 1 3 5 2 7 3
>10 9
et
N
1 5 6 4
.10 9
0 N7 N6 15 N .)
I 5 114 N: 3 N 2
21
>10 9
rc.1,73
112.
5°-1
57.
5°
I 5 to 4 rs w
3 2
4 9 1 9 2
2 3 2 2
1 3
4 3 8 2 1
1 8 1 2 2 6 3
6 1 10
2 1 2025°- 247
5°
2 5 1 1 5 1
4 2
N
202.
5°- 24
7.5°
<S1 13 1 8 1 10 1 12 1 141>15 2 11 4 51 8 1 8 1 10 1 12 1 14 1.151 2
BLOCK:D7 11 4 5 1 6 I 8 r 10 1 12 1 141>15 2 T <51 8 1 6 I 10 1 12 1 141>1311
BLOCK: D8
451 6 1 8 1101 12 1 141>u E 71 4 5 I 6 1 8 1 10 1 12 1 141>151 t
BLOCK: D9 71.51 6 I 6 '10 I 12 I 141.15 E T 451 21211011211413.121
BLOCK:DIO NOTES:
— DIRECTION INTO WHICH WAVES PRORAGATE— IN DEGREES H— WAVE HEIGHT IN METRES. T— WAVE PERIOD IN SECONDS.
— ONE OCCURRENCE REFERS TO A SIX HOUR MEAN
tQ
APPENDIX FIGURE 17d: Directional Wave Statistics for May
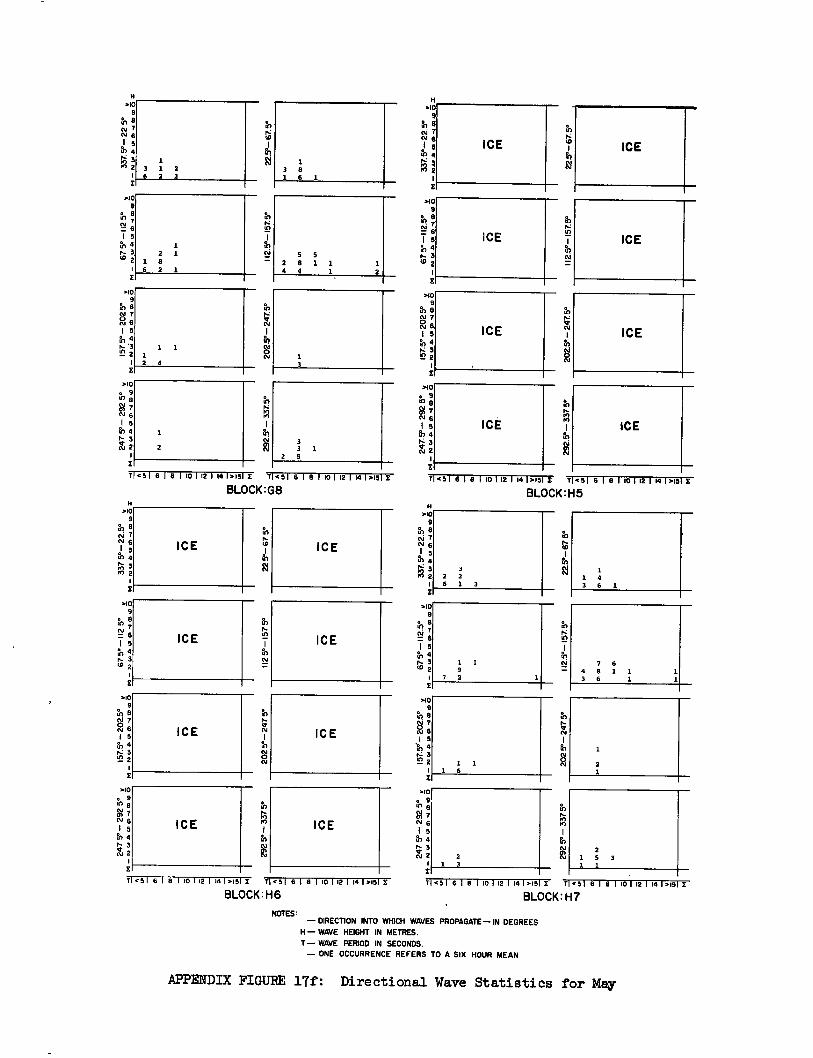
1 3 8 1 6 1
.10 9
6 N 7 oi I 9
1? 4 ICE
5 2 8 4 4
5 1 1
1 1 2
.10 9
rn (71 `4 6 I 5
rb 4 N 3 55 2
ICE
112.5.
-15
7.5°
N
N N
N
>109
• 9
1 2 1
1 8 6 2 1
2
1 1 1 2 4
E3178
1 5 4
r- 3 W2
1
>109
oi 7 N6 I 5 N 4
E
>10 9
9•2 a
N7 N 9 1 5
in 4 1`... 3 V N 2
ICE
112
5°-1
57.5
°
0" N s 1 5 'lb 4 o: 3
2
>10 e 9 rn 8 N7 N 1 5 in 4 o: 3 N 2
ICE
ICE
3
3 3 1
2 5
ICE
ICE
ICE
ICE ICE
>10 9
trI N
1 5 a, 4 7- 3 '5 2
7
1 9
2
1 4 3
7 8 6
6 1 1
1 1
ICE
>10 9 e Ni
RI 6 1 5
N3 "5 2
1 1 6
1
1
2
X
1 1 4 3 6 1
112.5
°-
157
5°
202
5°- 247
5°
>10 • 9 11 9 N7 N 6 I 5 rn 4 dr 32 29
2 5°
- 3
375°
H >10
9 ,n 8 os 7 N 9
5 0 4 .
3 2 2 6 1 3
H .10
9
rfl e N 7
in 4 7- 3
.40 9
• 8
CI' 6 I 5 tr, 4
3 '15 2
N7 N
I 5 rb 4
>10 9
10 8
1 5 to 4 N 3 N 2
I
112
5° -
157
5°
N
N
pN
292
5°- 337 5°
ICE
ICE
1 23 2
1 5 3 1 1
ICE
ICE
ICE
ICE
H
T<5 16181 101 121 141.15X T14516161161121141,451X
BLOCK:GS 11.5 1 6 1 8 110 1 12 1 14 1>15 I T >51 6 1 8 1 10 1 12 1 14 1.151
BLOCK: H5
T <51 6 1 8 I 10 I i2 I 14 1.15 E T1<51 6 I 8 I 10 I 12 1 14 1.151 E
BLOCK: H6 NOTES:
71.51 6 1 8 1 10 I 12 1 14 I 2.15 X T <51 6 1 9 I 10 1 12 1 14 I .15i
BLOCK: H7
— DIRECTION INTO WHICH WAVES PROPAGATE—IN DEGREES
H — WAVE HEIGHT IN METRES.
T— WAVE PERIOD IN SECONDS. — ONE OCCURRENCE REFERS TO A SIX HOUR MEAN
APPENDIX FIGURE 17f: Directional Wave Statistics for May
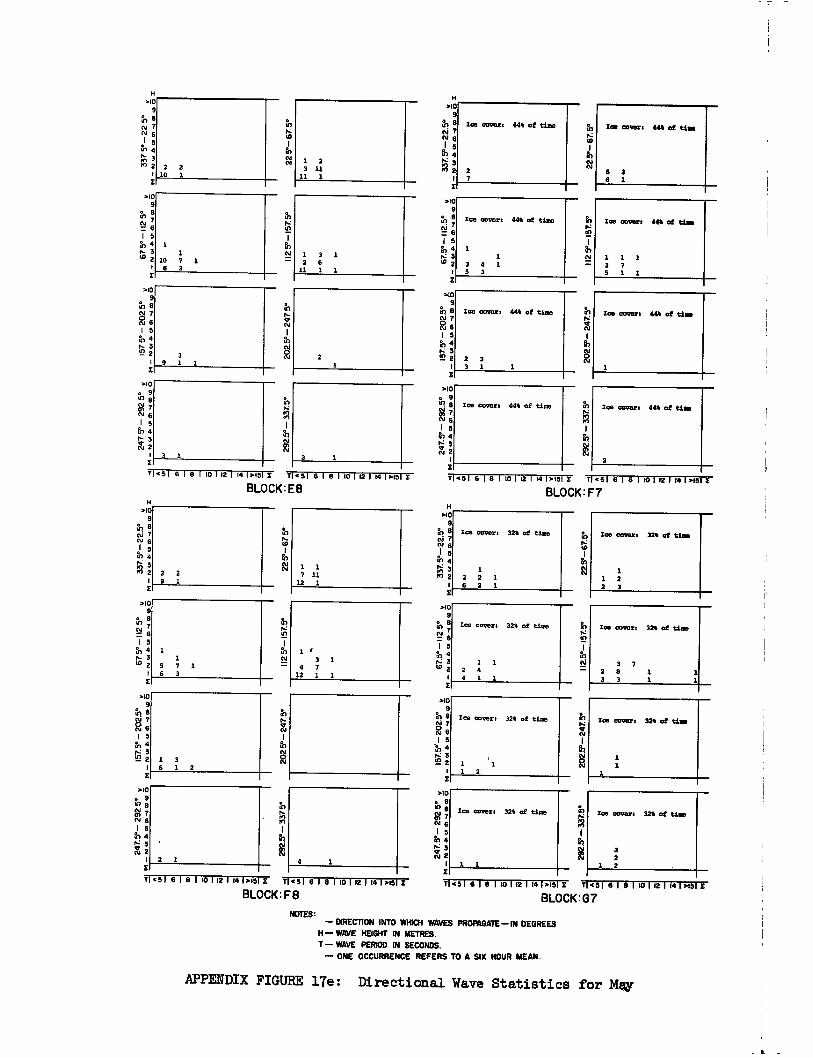
3 9 1 1
>10 9
th
c-v- 67 1 5 N 4 es 3 to 2
>10 • 9 to 9
if+ 7 NI 6 I 5
to 4
'7.7;
>I0 9
to 6 NO 7 N 6 1 5 to 4
3 2
H >10
9 in 8
1 5 111 4
N 7 N 6
tiri 3 01 2
1 1
10 7 1 8 3
3 1
2 2 10 1
20
2.5
°- 247 5°
112.5°
-15
7.5°
22
.5°- 67.
5°
71.51 6 1 8 I 10 112 1 14 1.15 I 71 4 51 6 1 8 1 10 112 1 14 1.151 Z
BLOCK:E8
2
2
1 3 1 2 6
11 1 1
H >10
9 al 8 of 7 ,%1 J 5 47 4 ri 3 id 2
Ice coves. 44% of time
27
Ice covert 44% of tire
1 1
3 4 1 3
>10
>10 9
r e N - 6 1 5 N 4 ez 3 ED 2
gi 6
>40 9
N a N 7
1 5 in 4
"' 3 2
Ice covers 44% of time
2 3 3 1
.11 : e 0
7 tg
6 id I5 I
0) 4 al r.: 3 gri 2
1 E
Ice covers 44% of time Ice clovers 444 of time
2
In ti 10
112 V
-15
7. V
N
Ice covers 44% of time
6 2 6 1
Ice covert 44% of time
1 1 1 3 7 5 1 1
Ice covert 44% of time
NOTES: — DIRECTION INTO WHICH WAVES PROPAGATE—IN DEGREES
H — WAVE HEIGHT IN METRES. T— WAVE PERIOD IN SECONDS.
— ONE OCCURRENCE REFERS TO A SIX HOUR MEAN.
APPENDIX FIGURE 17e: Directional Wave Statistics for May
T 491616 I 10 1 12 1 141>15 I 71 431 6 1 8 1 10 112 1 14 13451 r
BLOCK: F8
Ice covers 32% of time
1 2 2 1 6 2 1
Ice covers 32% of time
1 1 2 4 4 1 1
Ice covers 321 of time
1 1 2 2 3
Ice covers 32% of time
3 7 2 8 1 3 3 1
1 1
Ice covers 32% of time
11 2
Ice covers 32% of time
3 2
1 2
>10 ▪ 9 In 9 to
1 5 I a, 4 ez 3 Nsr 2
1 I
Ice covers 32% of time
In
7.011318 1101121141.15 E 7 451 8181101121141.151E
BLOCK:G7
>10 9
NC)* 78 e 1 5 N 4 rz 3 w 2
I
In se se
gi
112
.5°-1
57.
5°
H >10
9 N 8 tv 7 N I s h 4 >1 3 2 2
>10 9
o e N 7 N 6 1 5
11, 4
Ice covert 32% of time
1 1
5 7 1 6 3
1 3 6 1 2
>10
67 I 5
Po 4 1.z 3 N 2
H >10
9
N 1 5 to 4 e4 3 M 2
1
>10 9
; 1 5
a, 4 e- 3 tO 2
I
>10 9
rit a ;
1 5 rn 4 rz 3 w 2
1
2 2 9 1
2 1
men
N
‘17
1
112
V -1
57.
V
4
1 3 1
4 7 12 1 1
71 4 1 6 1 8 1 10 1 12 1 14 1 .15 £ T 8 1 8 1 101 12 1 141.15 3 451
BLOCK:F7
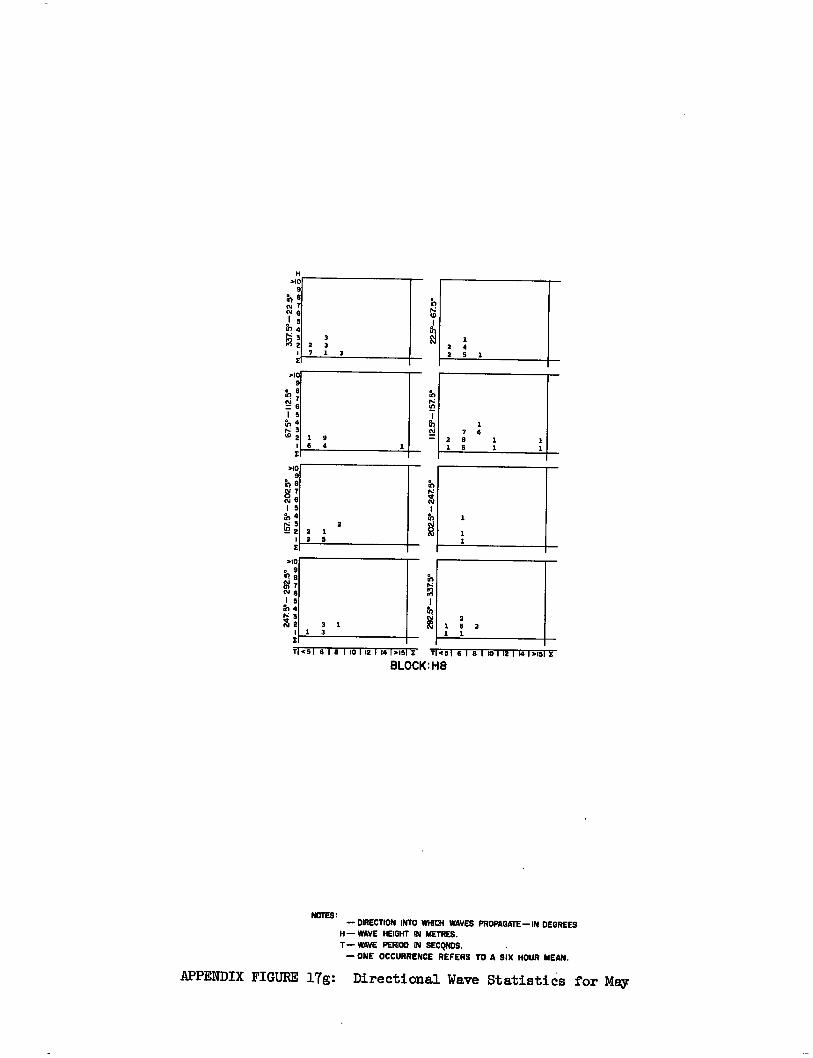
2 1 5 2 1 1
1 2 4 2 5 1
1 7
2 8 1 1 3 1
1 1
1 9 0 1
3 1 1 3
2 2 1 2 3
H
0
en
N N
V
1
pN
>10 9
■A 8 cv 7 N 6
3 2 3 7 1 3
.10 9
N 8 DI 16 I 5 3, 4 N 3 to 2
N 7 6 1 5
GI 4 N 3 N 2
.1 5 07 4
M 3 07 2
Tcsle le I 1011211417.15 E r<5161511011211413.1512
BLOCK: H8
NOTES: — DIRECTION INTO WHICH WAVES PROPAGATE— IN DEGREES
H — WAVE HEIGHT IN METRES. T— WAVE PERIOD IN SECONDS.
— ONE OCCURRENCE REFERS TO A SIX HOUR MEAN.
APPENDIX FIGURE 17g: Directional Wave Statistics for May
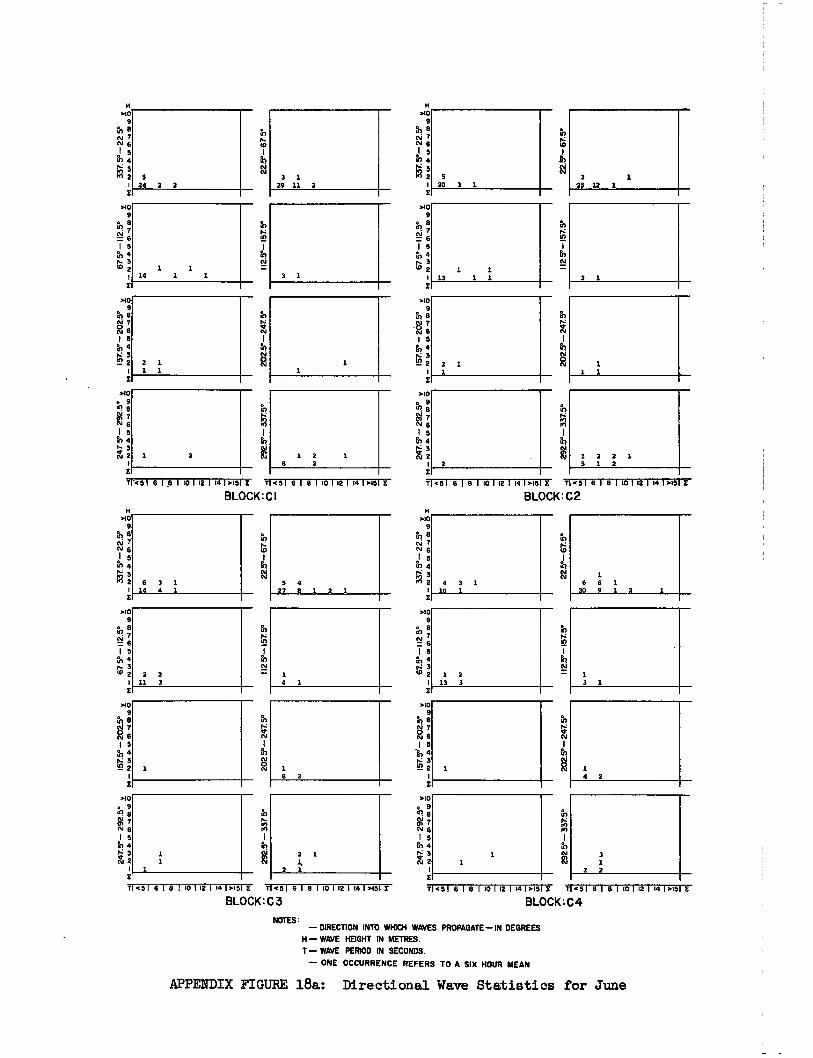
>10 9
&) N N I 5
lb 4
to to
>10 9
al 6 N 7 N 1 5 an 4
3 3 3 1 2
24 2 2 29 11 2 20 3 1
.10 .10 9 9
rn t}1 :
al 6 T5 1 5
4 4 N. 3 W 2 1 1
1, 3 'D 2 1
14 1 1 3 1 13 11 1
.10 9 e
N7 E 16 N 4 rz 3 ° 2
2
>10 9 B
N 7 N6 16 rn 4 rz3
2
010 9
7 6 1 5 GI 4 ...1•4 3 t3.I 2
.40 e 9
g N 6 I 5 en 4
R
1 1
1 2 1 8 2
2 1 1
2 1 1 1
2
112
.5°-15
7.5°
tD
112
5°-I5
7. 5
°
NN
In
1 1 1
1 2 2 1 5 1 2
3 1 25 12 1
3 1
1 4 1
2 1
2 1
6 2 1 4 2
3 1
2 2
6 6 i 30 9 1 2
3 1
112V-1
57
5°
202 5°- 24
7 V
112.5°-1
57.V
2
02
.5°- 24
7. 5
°
90
2
>40 9
I 5 fk, 4 P 3 (.0 2
>10 9
th 8 N 0 N I 5
in 4 3
2 2
>10 • 9 ,11 5
7 N 8 1 5
rn 4 1;i 3 N 2
.40 9
ih 87
1 5 N 4 ts: to 2
.10 9
8 NN I 5
'en 4
2
.40 9
0. 8
I 5 rn 4
1 1
2 2 11 3
J. 1
1
1 2 13 3
H
H
T1.51 616 1101121141.15 I 145I 8 I B I 114 141.4512
BLOCK: C I T<5161131101121141.152 1•<5141611011211413.1512
BLOCK: C2
Ti<51 6 1 8 I 10 112 1141.15 2 T <51 8 1 8 110112 1 14 >151 I
BLOCK: C 3 71 ..5 I 8 I 8 1101 12 I 14 1.15 2 T <51 6 I B 1 10 1 12 1 141.151
BLOCK: C4
NOTES: — DIRECTION INTO WHICH WAVES PROPAGATE—IN DEGREES
H— WAVE HEIGHT IN METRES. T— WAVE PERIOD IN SECONDS.
— ONE OCCURRENCE REFERS TO A SIX HOUR MEAN
APPENDIX FIGURE 18a: Directional Wave Statistics for June
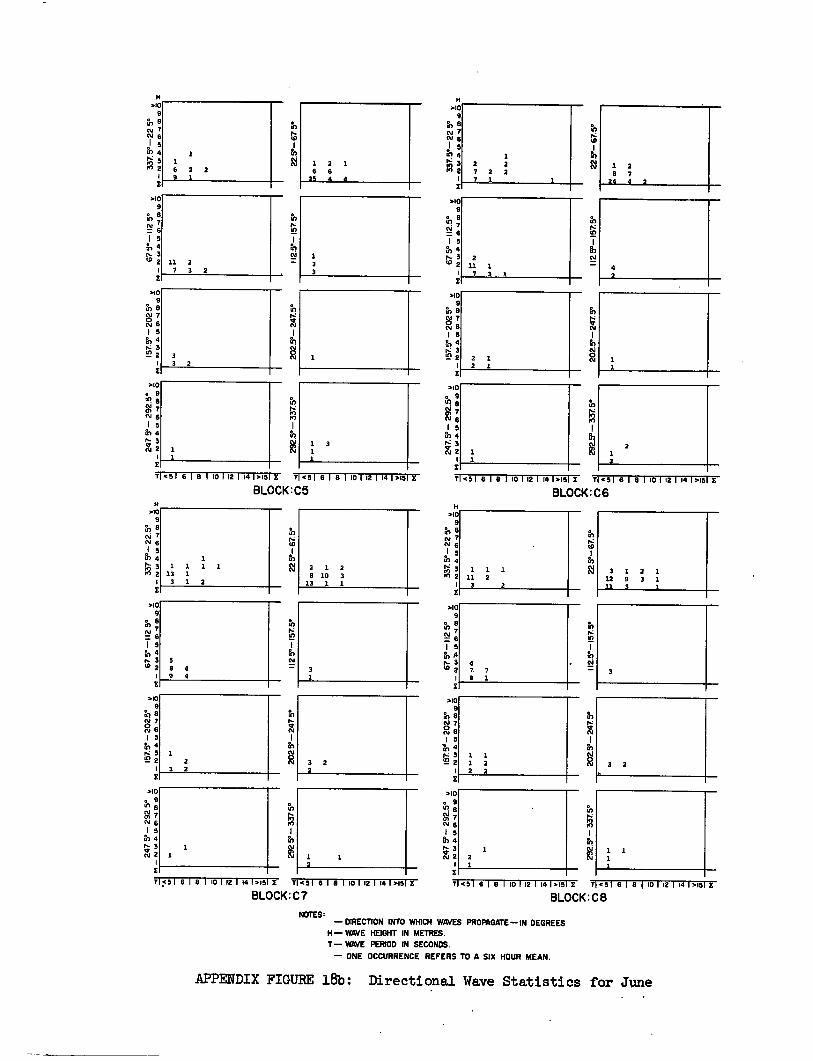
1 1 6 2 2 9 1
11 2 7 3 2
; 2
1 2 1 6 6 25 4 4
1 3 3
H >10
9
1 2 2 7 2 2 7 1 1
2 1 2 1
2 1 2
1 1
1 2 9 7
24 4 2
4 2
N
112 5
°-1
57.5
°
to a Ni Rs
• 9 e
N7 N6
1 5 an 4 rz 3
2
>10
202.
5°- 2
47. 5
°
NN
tn
1 5 in 4 N 3 RI 2
>10 9
in N 7 N a
j 5 N 4
M 3 2 1
>109
in 8 0 N 8 1 5 a, 4
N.3
2
N7
>10
Ng
N6 I S
in 4 rA 3 ro 2
.10 9
N 8 t•-1 76
tO
1 5 tb 4 n3
112.5
°-15
7.5°
rn NN 1,
to
112.5
°-15
7.5°
N
1
H >10
9
*1 8 7
N 6 ; 5 in 4
2 1
.10 9
in .1
1 5 N 4 H. 3 1.0 2
>10 9
N7
6 1 5 a,4 N 3
2 1
>10 • 9
a IN 7 N 6 1 5
in 4 3
N 2
H >10
9
in 6 N 7 N
1 1174
M 2 1
>10
N
76 1 5 in
2
.109
in 8 N 7 R 1 5
*a, 4 N 3 N 2
zt
>10 . 9
M 41/41 6 I 5 0-) 4
3 2
1
1 1 1 1 1
13 1 3 1 2
2 1 2 8 10 3 13 1 1
5 8 4 9 4
1 2
3 2
2
3
2 2
1 1 1 11 2
3 2
3 1 2 1 12 9 3 1 11 3
21
4 7. 7 8 1
1 1 1 2 2 2
1 1 1
1
3
3 2
H
T <51 6 1 8 1 10 1 12 1 14 1.15 E T > 51 8 1 8 1 10 1 12 1 14 I >is' X
BLOCK:C5 Tl<5 1 6 1 8 1 10 1 12 1 141.15 I 'I* >51 6 1 8 1 10 1 12 1 141>151
BLOCK:C6
T <51 8 1 8 1 10 1 12 114 1.15 I T <51 8 1 8 -1 10 1 12 1 14 1.151 E
BLOCK: C7 11<5 1 6I 8 I 10 1 12 1 14 1.15 E T>51 8 1 8 1 10 1 12 1 141>1511
BLOCK: C8
NOTES: — DIRECTION INTO WHICH WAVES PROPAGATE—IN DEGREES
14— WAVE HEIGHT IN METRES. T— WAVE PERIOD IN SECONDS.
— ONE OCCURRENCE REFERS TO A SIX HOUR MEAN.
APPENDIX FIGURE 18b: Directional Wave Statistics for June
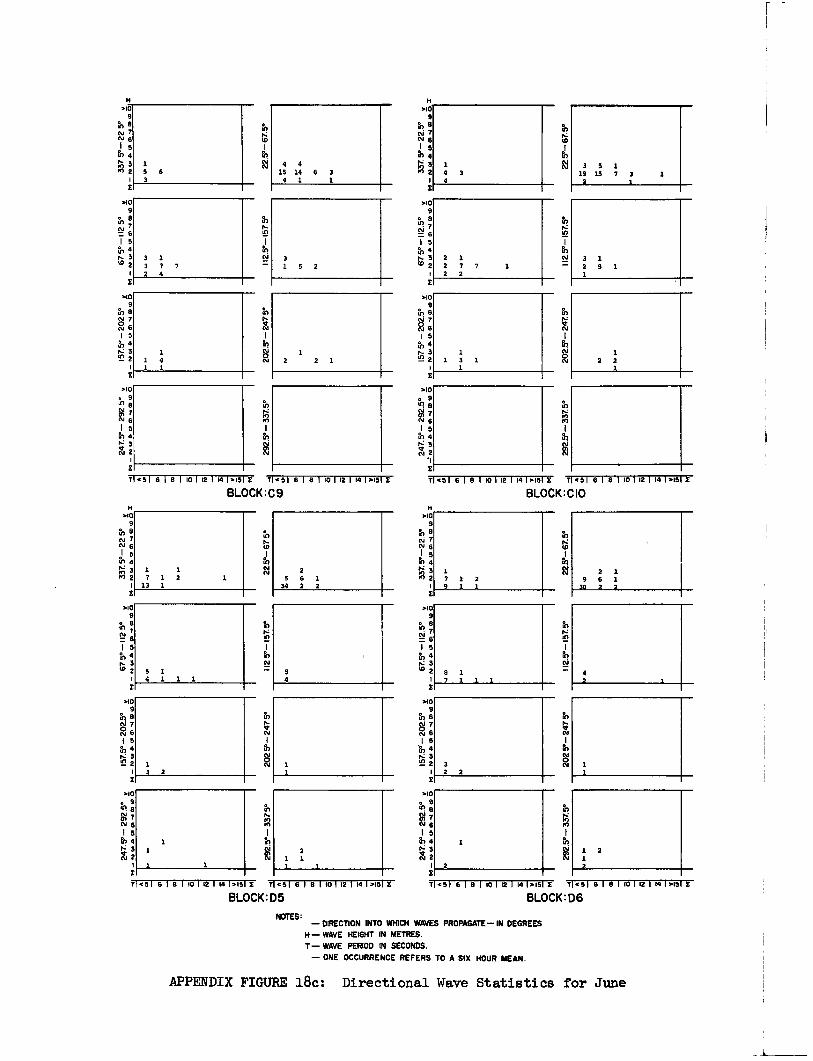
1,
2
2
NOTES: — DIRECTION INTO WHICH WAVES PROPAGATE—IN DEGREES
H— WAVE HEIGHT IN METRES. T — WAVE PERIOD IN SECONDS.
— ONE OCCURRENCE REFERS TO A SIX HOUR MEAN.
APPENDIX FIGURE 18c: Directional Wave Statistics for June
H >10
9 in a N N
1 in 4
4,
to 1
11.- 3 4 4 22 15 6 15 14 6
4 1
H >10
9 °
0.1 6 5
in 4 N 3 M 2 4
4 3
4,
to
3 19 2
5 IS
1 7 3
>10 9
eV 7
1 5 tn 4 I,: 3
>10 9 a
rni ; 1 5
4
(-3
2
>10 e 9 • a N 6
I s 4 3
CV 2
>10 9
e to N 76
1 5 ▪ 4 r- 3 W 2
1
>10 9
in r1 7 :i N 6 1 5 tn 4 s: 3 ▪ 2
1
>10 e 9 ul
NG 1 5 ill 4
14 3 N 2 1
T .51 6 1 8 1 10 1 12 1 14 1.15 E 71.51 6 1 8 1 10 1 12 1 14 1.151
BLOCK:C9 1.51 8 1 8 1 10 1 12 114 1.15 E T .51 6 1 8 1 10 1 12 114 1.151 I
BLOCK:CIO
T <51 6 1 6 1 10 1 12 1 141.15 E T1.51 8 1 8 1 10 1 12 1 14 1>151 E
BLOCK: D5 T1451 8 1 6 1 10 1 I2 1 14 1.15 E T .51 6 1 9 1 10 1 12 1 14 1.151 E
BLOCK: D6
112.5
°-15
7 5°
20
2.5°
- 247
5°
112.5
° - 157.
5°
5,
N
k N N
3 1
1 7 1 2
13 1 1
112 5° - 157.
5°
H >10
9
al N 7 N
N 4
22
>109
ez. 3
rp;
I 5 rn 4 t•Z 3 W 2
I
H >10 9
Fr) a N 7 N 6 .1 ,1-1 4
3 1" 2
>10 9 8
6 1 5
fh 4 t- 3 (0 2 5 1
4 1 1 1
2 5 6 1 34 2 2
4
>10 e 9 ‘7! a M N 6 15
en 4 1%1 3 N 2
2
>109
r1./ 8 8
7 N 1 5
*Er, 4 3
n 2
El
.93 . 9
e N 8 15
rn 4 r" 3 N 2
1
>10
N9
fit 9 7
6 1 5 N 4 N 3 al 2
112.5
° - 157.
5°
Fr,
8
O'
1
7 I 2 9 1 1
; 2
8 1 7 1 1 1
4 2 1
2
2
3 1 3 7 7 2 4
3 1 5 2
1 2 2 I
2 1 2 7 7 2 2
3 1 2 5 1 1
1 2 2
1
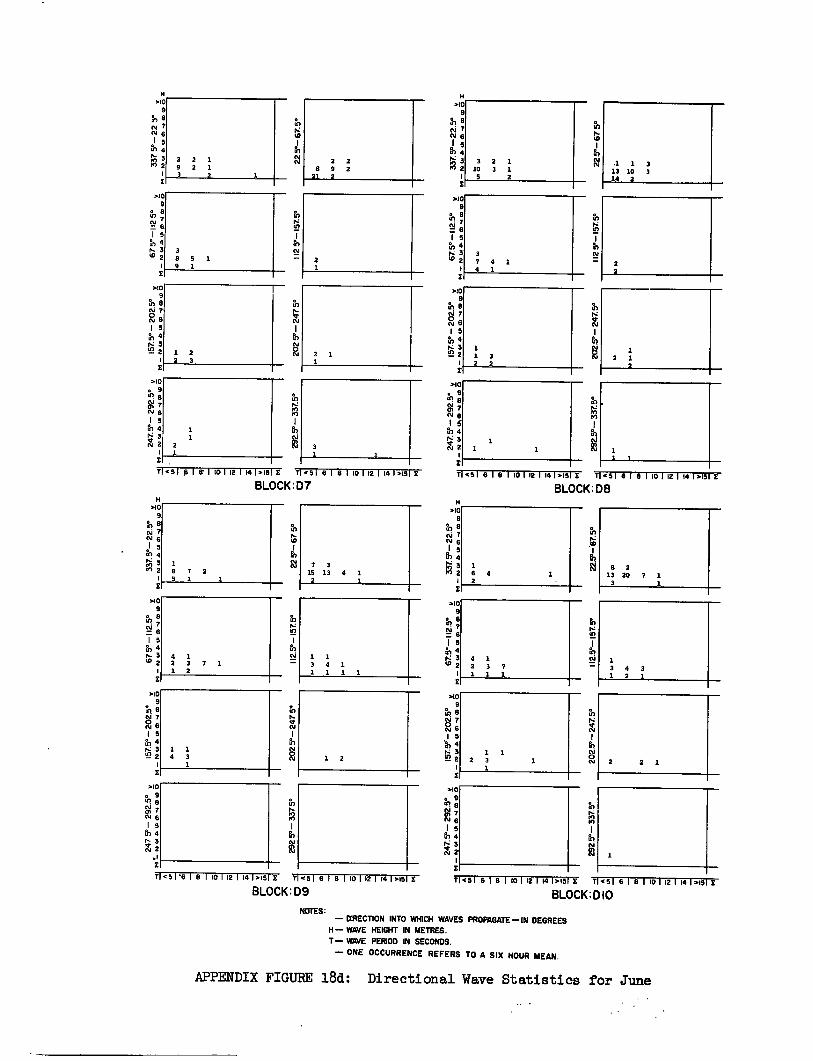
H H
N6
117 Iii 7
1 1
7 <5 1 6 1 6 1 101 19 1 14 1>15 E T1.51 6 1 8 1101121141>m1
BLOCK: 010 T c5 16161 101MI 1413.15E 7 ,0 16181 101121 Mi 0.151E
BLOCK: D9
>10 9
?II N N 6 I Nn q
1,3 to
>10 9
N 8 N 7 N6
ei 5 1n 4
iA wr"
3 2 2 1 2 2 1.; 3 3 2 1 .1 1 3 2 2 9 2 1 8 9 2 10 3 1 13 10 3
3 2 21 2 5 2 14 2
2 1 1
3 1 1
2
16 b 4
3 N 2
7.5 18191 MIMI 141>15 E 7• 48 18161 MIMI 141>151E
BLOCK :D7 TI.c51 6 IS I IO 112 110.15 E TI.51 6 I 6110112 I MI>1612
BLOCK : D8
292 5°- 33
7 5°
NOTES: — DIRECTION INTO WHICH WAVES PROPAGATE—IN DEGREES
H— WAVE HEIGHT IN METRES. T— WAVE PERIOD IN SECONDS.
— ONE OCCURRENCE REFERS TO A SIX HOUR MEAN.
APPENDIX FIGURE 18d: Directional Wave Statistics for June
>10
15
0-3
1
a, 78 9
112
5°-1
57.5
° 20
2.5°
- 24
7 5°
3 8 9 1 9 1
>10 9
1 5 N 4 t 3 W 2
4 1 2 3 7 1 1 2
H >10
9
al 8 N 7
rn
63 1
N
1
pN rn
>10 9
0 7 00 6 1 5 rn 4
tn 3 2
J 5 4
1.■ 3 2 2
1 6 7 2 5 3, 1
7 3 15 13 4 1 2 1
1 1 4 3
1 1 2
sw
1 12.5
° -1
57. 5
° 20
2.5°
- 24
7.5°
H >10
8 in 8 N N 6 1 of 4 04 3 M 2
>10 9 3/ . 2
N e 1 5
4 0.3 3 02
>10 9
tc.3 5
E 1 5
4 3
'n 2
: 0 1 8 2
13 20 7 1 3 1
4 1 2 3 7 1 1 1
1 1 2 3
1
1 3 4 3 1 2 1
2 2 1
N 6 1 5 a, 4 0.: 3
2
>10
>10 O 9 t.11 Si 7 N 6 1 5
En 4 0- 3 N2
>10 0 9 61 a N7 N 6 1 5
Po 4 1,, 3 N2
3 7 4 1 4 1
1 1 3
2
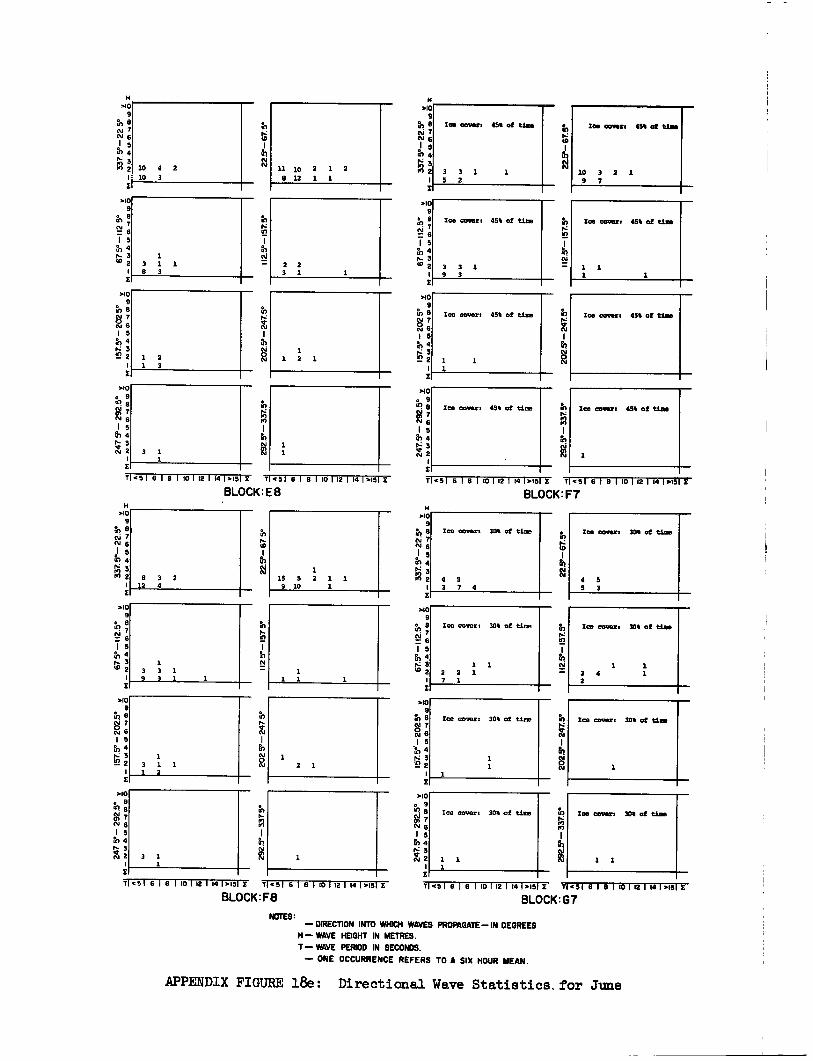
10 4 2 10 3
.10 9
H •to
9
ft') e N ? N
j 5 074
er)
▪
•
el 2 1
81
er e N.
1 5 N 4
3 1 8, N
47 2 3 1 1 1 13 3 I
71051 6 1 B 1 10 1 12 1 14 1.15 E T 0 51 8 1 8 1 10 1 12 1 14 10151 I
BLOCK: E8
Ice covers 45% of time
1 1
Ice covers 45% of tine
1
Ica cover. 45% of time
3 3 1 1 5 2
Ice covers 05% of tile
10 3 2 1 9 7
Ice covers 45% of tire
1 1
H $0
9
al 8 CV 7 N 1 5 th 4
112. 5
°-1
57.
5°
men
81
15 1.1 4
it :
71 <5 I 6 1 8 1 10 1 12 1 14 1.15 E 71051 6 1 9 1 10 1 12 1 14 17151 E
BLOCK: F7
$0 9
oc 7 19 6 15
fe, 4 3 2
I
>10 e 9 el 9
6
Ice cover. 45% of time
Ice covers 450 of time
3 3 1
>10 9
• 9 N 7
ti 6 1 5 a, 4 N 3 W 2
9 3
Ice covers 45% of time
010 9
rft 67 1)1. 6
1 5 N 4 N 3 1.0 2
j 5 in 4 N 3
H >to
9
rt1 N 7 cV 6
010 9
al 8
1 5
"/ 2 1
al 4 N 3
8 3 2 12 4
1 3 3 1 9 3 1
1 3 1 1 1 2
01 13 81
M 7 l- M 7
N6 6
1 5 1 1 5
&I 4 al Go 4
f■ 5 N 3
gi 2 3 1 cli 2
1 1 I
7 051 8 I B 110112 1141015 I 7 051 6 1 B 110112114101513:
BLOCK: G7
010 • 9
1
a, (93
ts- sr
NN
8 N
8, N
Pfl
Ice covert 30% of time
1 1 2 2 1 7 1
010 9
. L4, 1 5
4 N W 2
1
Ice cover. 30% of tine
4 5 3 7 4
H >10
9
j 5 07 4
tft 8 ?
N 6
tor*" 3 07 2
1 I
1 r6
NN
•
10
71051 6 1 8 1 10 112 114 1015 E T 051 6 1 1 10 112 1 14 10151E
BLOCK: F8
>10 9
rg 7 N 6 1 5
Tr, 4
"' 3 2
I
>10
>10 9
rn 8 N 7
6 1 5 fr, 4
3 N 2
010 • 9 07. 9
NN ; I 5
fn 4
it 3 N 2
11 10 2 1 2 8 32 1 1
2 2 3 1 1
Ioe covers 30% of time
1
Ice covers 30% of tie*
1 1 1
1 2 1 3
3 1 1
2 1
1 19 5 2 1 1 9 10 1
Zoe covers 3011 of time
Ice covers 30% of tiro
Ice covers 30% of time
4 3 9 3
Ice cover. 30% of tier
1 1 2 4 1 2
1 2 1
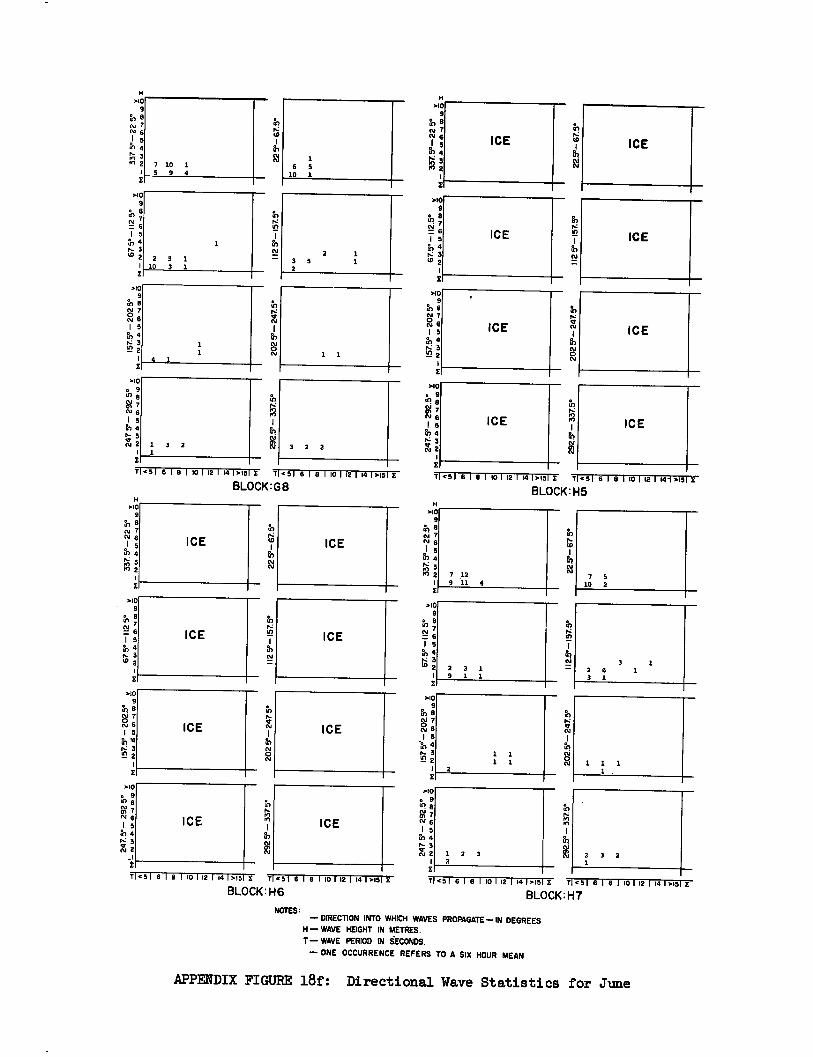
71.51 6 1 8 1 10 1 12 1 14 1.15 E 7 .5 1 6 1 8 1 10 I 12 I 14 1.151 X
BLOCK:G8
71.5 1 6 1 8 1 10 1 12 1 14 1.15 X T .51 6 1 8 1 10 1 12 1 141 .151 X
BLOCK:H5
1 2 3 2
2 3 2 1
.10 9
e 41 7 c=j 6 1 5 N4 f■ 3 10 2
.10 9
N 7 gi 6 1 5
4 1.; 3 N
.10 e 9
RI 7
1 5 F174
H .10
9
N 7 01 6
I,: 3
ICE
ICE
ICE
ICE
7 12 9 11 4
a
rn
H .10
9 'in 8 N 7 N 6 e) 5 O 4
P2
H >10
9 N8 es.i 7 N 6
8 In 4
3 2
ICE ICE
1 5 er', 4
14; :
X
112 5
° - 1
5 7. 5
° 20
2 5°- 24
7 5°
010 9
1 5 N 4 0: 3 1.8 2 2 3 1
9 1 1
.TO 9
in 8 0 N7
N 6 1 5
4-1 2
.10 9
al 8 O 7 N 1 5
'N 4 P 3 4:2 2
ICE ICE
ICE ICE
2
010 .10 e 9 o 9
O 8 N m e ai m g 7
7 1... CV 6 m cv 6
1 5 I 1 5
rn 4 :7 Z-, 4 ft: 5 t- 3 X' 2 E I
x2 ,
. .
ICE ICE
2 3 5 1
.10 o 9
M 7 0.1 6 I 5
4 5
V N2
X
H eq0
9
0, 6 1 (.04 %.
112 5
° - 1
57. 5
° 20
2 5°
- 24
75°
>io 9
ff.> 8 76
1 5 • 4 7. 3 tg,
>10 9
in 8 01 7
R, 6 1 5 N4 1.■ 3 42 2
7 10 1 5 9 4
1 6 5 10 1
1 3 2 3 2 2
2 S I 10 3 1
4 1
292.
5°-
337
5°
202.
5°- 24
7.5°
11
2.5° - 15
7.5 °
1 I I
7 5 10 2
3 2 6 1 3 1
in
1
202
5 °- 2
47. 5
° 11
2 5.-
157
.5°
ICE
ICE
ICE
ICE
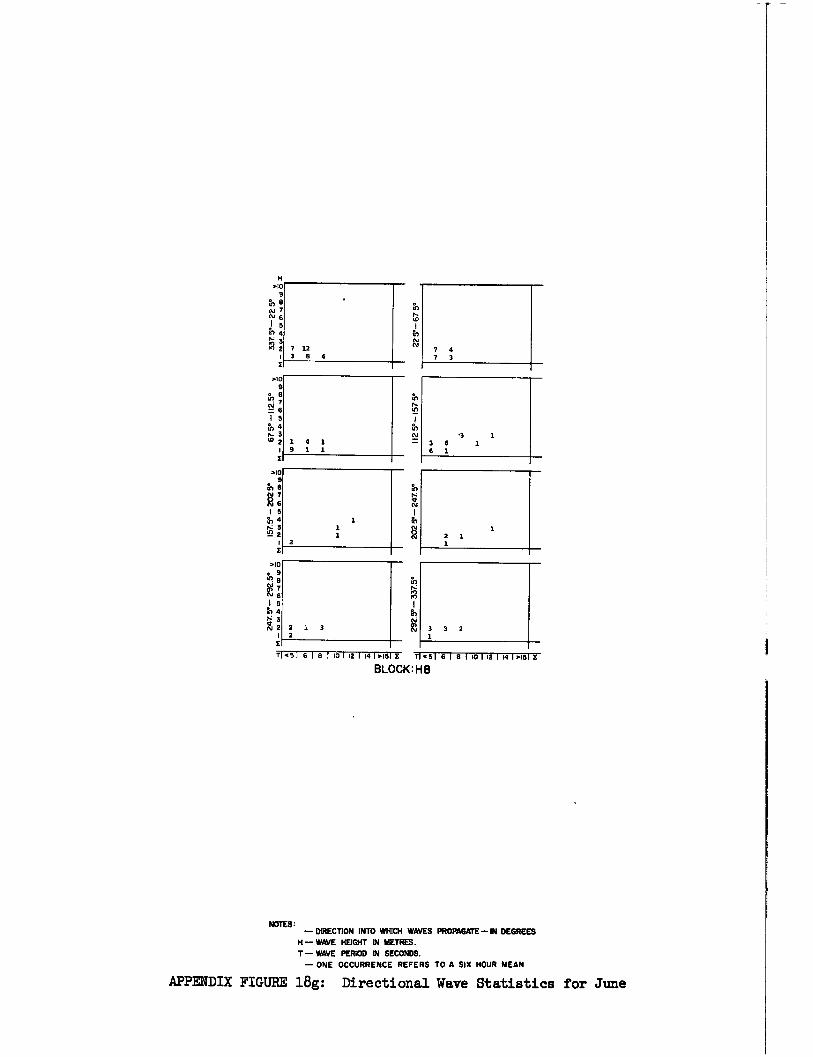
1 2 1
3 3 2
7 4 7 3
•3 1 3 6 1 6 1
112
5° -
157
5°
202 5
°- 2
47. 5
°
7 12 3 8 4
cj 6 1 5 th 4 5- 3 W 2
510 9
Uf e
1 5 N 4
r?;
510
In 8
15 4 3 V
AI 2
2 2
510 9
1 0 1 9 1 1
2
2 1 3 2
T <51 6 1 8 1 10 1 12 1 14 1515 E T <51 6 1 8 1 10 1 12 1 14 1 5151 E
BLOCK: H8
NOTES: — DIRECTION INTO WHICH WAVES PROPAGATE—IN DEGREES
H — WAVE HEIGHT IN METRES. T— WAVE PERIOD IN SECONDS.
— ONE OCCURRENCE REFERS TO A SIX HOUR MEAN
APPENDIX FIGURE 18g: Directional Wave Statistics for June

1 9 3
MO
N 9 '' 47) 7 cv 6 I 5 in 4 ▪ 3 X 2
.51 6,I B I 10 I 121141.15i 14 518181101121141.151E
BLOCK:CI
111
N
112.
5°-1
57.
5°
>10 9
V. 76 5
N 4
t'i3
SO 9
tn N 0 N 1 5 a., 4 N 3
2
3 2
4
5 4
1 4
tr) 67
In
2 1 1 3 4 2 7 3 1 2 33 4
H
9 &le N 7 N 6 I 5 in 4
4 22
r.0 3 2 1
2 1
I12
.5°-
15
7.5°
T <51 6 1 8 1 10 1 12 1 14 1.15 E 714 51 8 1 s 1 lo 1 12 1 14 1 >151 2
4,
sD
.10 9
is7
3 2,
I S tr. , 4
202.5°- 247
5°
H >10
9 'th 8 Ds 7 N I 5
31 4
>10 9 e
M 7 N I 5
Pn 4 ▪ 3 N 2
SO 9
O B
I 5 pr, 4 N 3
2
: 3
4 2 1 1 2 21 5 1 1
1 3 2 32 5 2
4
3 1 2 3 1
BLOCK:C2
3 Hi 2
1 7 2 2 17 2 1 1
2 1 6 1 4
BLOCK: C3 BLOCK:C4
14 MO
9 trl N 7 N 6
5 07 4 N 3
2
SO 9
N a N 7 N 8 1 5 in 4 N 3 D2
SO 9
in 6
1 5 a., 4 1- 3
SO o 9 0
418 87
7 r- in
N 6 In
IS I
ik ) 4 in P A 2
3
I 1 2 4 1
I
I E 71.51 61 8 I 10 1 12 1 141.15 I 71.51 6I B 1101121141>151E 714518181101121141.15E 71.51 6181101121141.151E
1 2 1
1 4
2 5 5
19 11
4 1
112.5°
-15
7.5°
rt,
SO o 9 31 8 M 7 N 6 I 5 to 4
3 Di 2
H >10
9 al N 7 N
ol 07 4
112 5°
-157
5°
SO 9
1 5 4
El
>10
N 7 6
1 5 4
10 3 2 2
7 3 1 1 16 4 1
3 3 1 34 10 1
4
1 3
2 11 1 4
1 1 2 1
NOTES: — DIRECTION INTO WHICH WAVES PROPAGATE — IN DEGREES
H— WAVE HEIGHT IN METRES. T— WAVE PERIOD IN SECONDS.
— ONE OCCURRENCE REFERS TO A SIX HOUR MEAN
APPENDIX FIGURE 19 a: Directional Wave Statistics for July
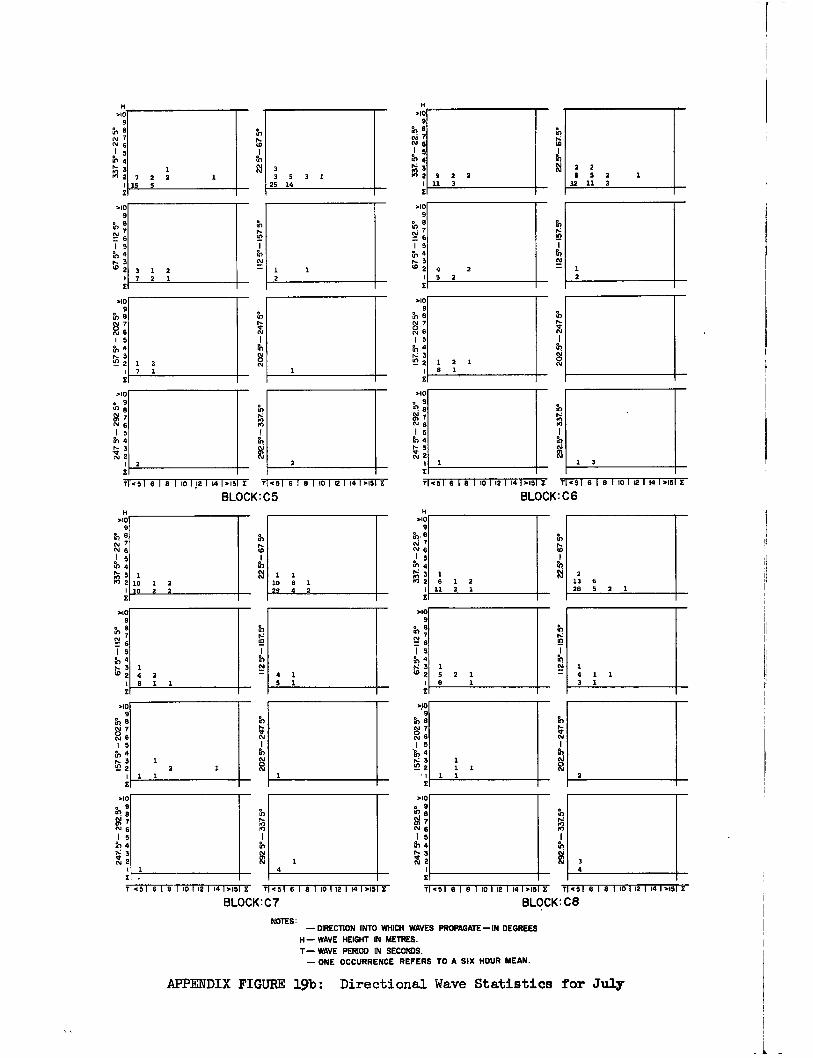
1 2
Pei 3 In 2 1
1 7 2 2
15
>10 9
rn 6 mi N 6
5 Lr1 4 Pn
T1451 6 1 8 1 10 112 1 14 1.15 X 7 <51 8 1 8 1 10 1 12 1 14 1.151 X
BLOCK: C5
112 V
-157
5°
ol
pNN
202 5°
- 247
V
.10 9
N o 8
; 1 5 th 4 es 3
2
.10 e 9 in 8
7 N6 1 5
rn 4
:
>10 9
N 8
8 7 N 6 1 5 N 4 es 3
3 3 5 3 1
25 14
3 1 2 7 2 1
2 2
1 2 7 1 1
1 5 N4 es 3 1
4 2 8 1 1
up 2
1 2
1 1 1
112 5
°-15
7.5°
.10 9
frt e N 7 E 5 1 5 tr, 4
N 3 E' 2 1
o 9
" 6 1 5
Pn 4
X
4 1 5 1
1
4
71451 6 1 8 1 10 112 1 14 1.15 X 7 <51 6 1 8 1 10 112 1 14 1.151 X
BLOCK: C7
NOTES: — DIRECTION INTO WHICH WAVES PROPAGATE—IN DEGREES
H — WAVE HEIGHT IN METRES.
T— WAVE PERIOD IN SECONDS. — ONE OCCURRENCE REFERS TO A SIX HOUR MEAN.
APPENDIX FIGURE 19b: Directional Wave Statistics for July
3 4
1 2 1 8 1
e•10 e 9 q 8 M 7 im 6 1 5
rn 4
.10 9
rn (.11 6 1 5
tn 4
if;
1
.10 9
• 8 Ni
5 N4 N 3 w2
1 X
2 4 5 2
202.
5°- 24
7 5°
11
2.5°-
157.
5°
1 3
2 2 5 5 2 1
12 11 2
12
7 <51 6 1 8 1 10 1 12 1 14 1.15 X 7 <51 6 1 8 1 10 1 12 1 14 1.151 X
BLOCK: C6
.10 9
N 7 cso 6 1 5 N 4 N 3 M 2
,9 6
.10 9
N 7
1 5 1, 4 N 3
•1
.10 9
112.5
° -15
7.5°
;
1 5 N4 N 3 W2
1 6 1 2 11 2 1
2
.40 e 9 ul 8 M N 6 2 I5 Po 4 es V N 2
te)
T1.51 6 1 8 1 10 112 1 14 1.15 <51 6 1 8 1 10 112 1 141>151
BLOCK: C8
1 5 2 1 9 1
2 13 6 28 5 2 1
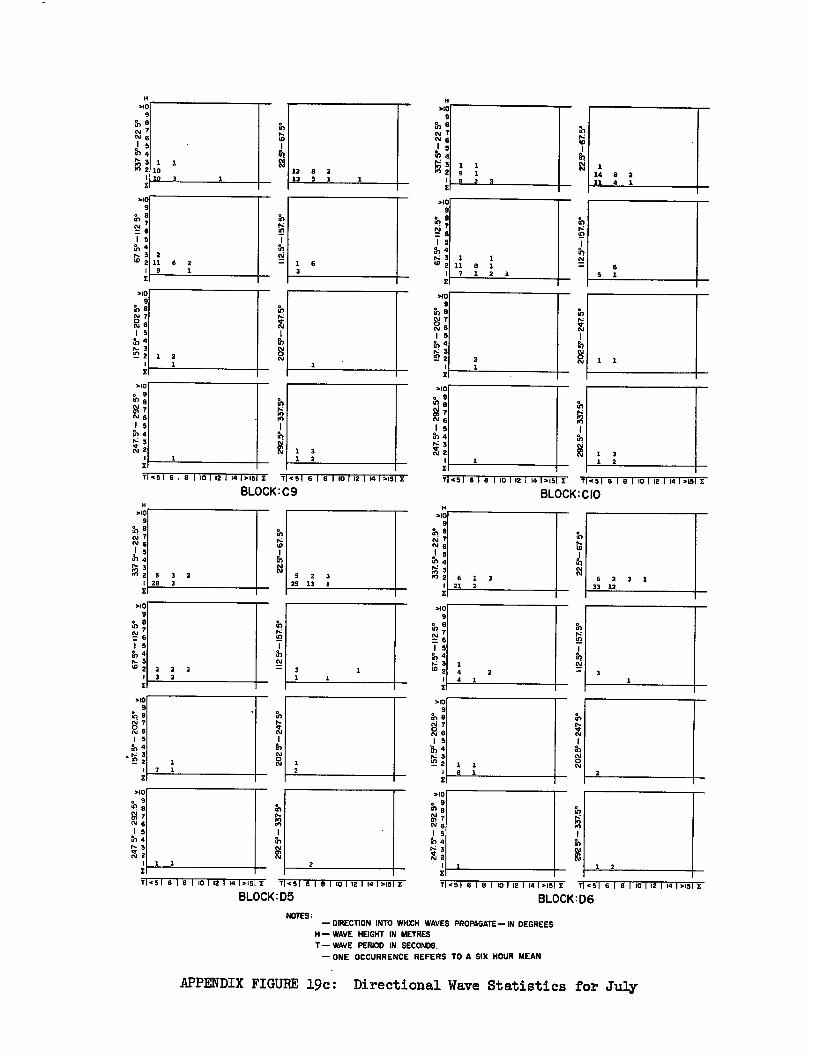
71 < 51 6 1 8 1 101 12 1 14 1.15 E 745161 8 1 101 12 1 141.151E
BLOCK:C9 H
>10 9
rtl 8 0.1 7 N 5
04
1
.10 9
tn N 6
e 5
Y7 4 • 3 63 2
9 in 8
MI 76 1 5 N 4 isz 3 52 2
>10 o 9 0 8
7 MI 6 1 5 in 4
1
714 51 6 1 8 1 10 1 12 1 14 I.t5 I 7 .451 6 1 8 1 10 1 12 1 14 1,151
BLOCK:D5
7 451 6 1 8 1 10 1 12 1 14 1.15 I 7 < 51 6 1 8 1 10 1 12 1 14 1.451 X
BLOCK:C10 H
>10 9
N 7
1 5 10 4
7 <51 6 1 8 1101 12 1 14 1.15 E 7 < 51 6 1 8 1 10 1 12 1 14 l>151 E
BLOCK:D6
j 5 6
NOTES: — DIRECTION INTO WHICH WAVES PROPAGATE — IN DEGREES
H— WAVE HEIGHT IN METRES
T— WAVE PERIOD IN SECONDS. — ONE OCCURRENCE REFERS TO A SIX HOUR MEAN
APPENDIX FIG= 19c: Directional Wave Statistics for July
N
Pn
N
67
20
2.5°- 24
75°
1125° - 15
7. 5°
8)
PR
1 5 4
1, 3 ° 2
1 11
25°-
1575°
.10 9
0 o 8
7 N 6
1 5 ?n 4
1 6 t■ 3 °
1 11 8
1 1
3 7 1 2 1
12 8 2 13 5 1 1
2 11 6 2 9 1
.10 9
111 a
IA 7 03 1 5 fb 4
51 3
>10 e 9
B g NI
I 5 fn 4 1". 3 DJ 2
>10 9
i0 8 Da 7
19 4 3
'12 2 1 2
M 7 N 1 5 th 4
3 & 2
1
>10 • 9
6
1
1 3 1 2
2
1 3 1 2
1 14 8 2 11 4 1
6 5 1
2 2 2 3 2
to to
7 1
I125°
-15
7.5°
20
2 5°
- 247 5°
292 5
°- 3
37
5°
5 3 2 28 3
S 2 3 25 13 1
2
3 3.
21
2 2 1.43
1 5 th 4
: 1
>10 • 9 0 8
6 1 5
rn 4
20
2.5°
- 247 5°
6,
rn
8)
iy 11
2.5° - 15
7.5°
1
4 2 4 1
6 1 3 21 2
1 2
2
6 2 3 1 33 12
3
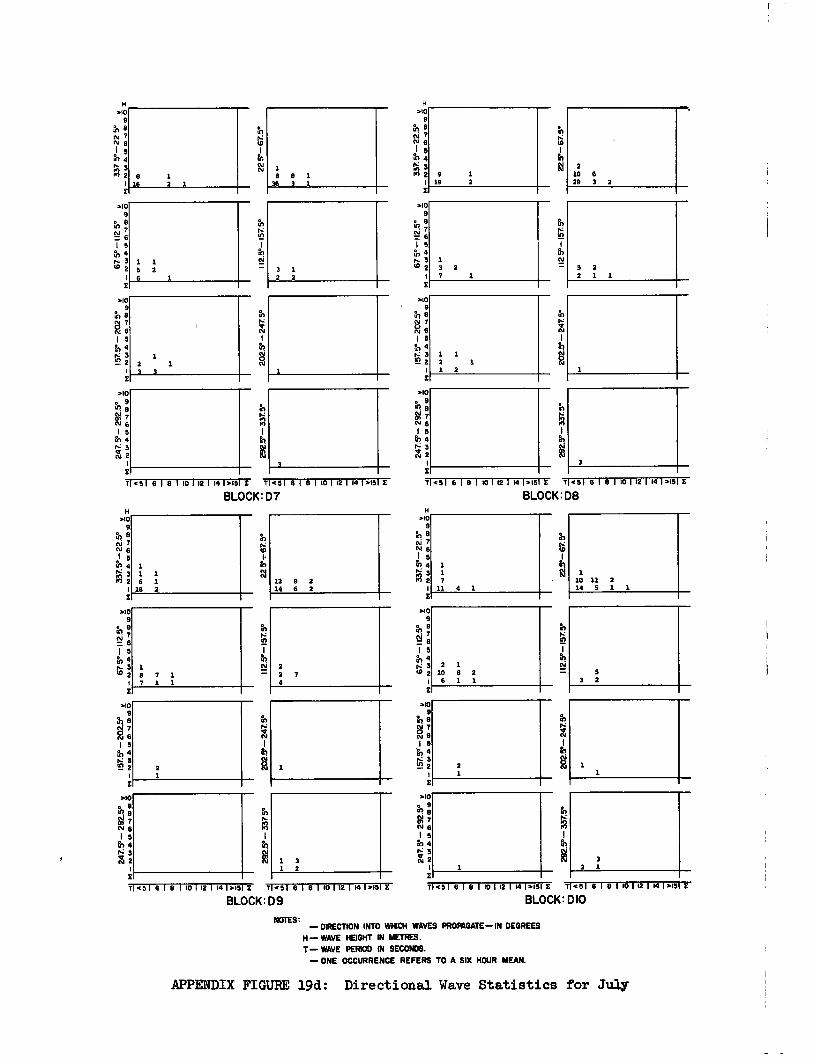
NOTES: — DIRECTION INTO WHICH WAVES PROPAGATE — IN DEGREES
H — WAVE HEIGHT IN METRES. T— WAVE PERIOD IN SECONDS.
— ONE OCCURRENCE REFERS TO A SIX HOUR MEAN.
APPENDIX FIGURE 19d: Directional Wave Statistics for July
14 H
1410
NO
9 9
in 8 N tn 8 N 7 p N 7
CY 6 t0 N8
J 5 J 5
,11 4 Pn 117 4 N N 3
2 2
3
5 5
11451 8 1 8 1 10 1 12 1 14 17.15 E T 451 8 1 8 1 10 1 12 1 14 17.151
BLOCK: D8
N 1 5
4 N 3 gi 2
1
71451 6 1 8 1 10 112 114 17.15 I T 451 6 I 8 1 10 112 114 13451
BLOCK: D7
74516181101121141745Z 74518181101121141.151£
BLOCK: D9 7145 1 6 1 8 1 10 1 12 1 14 1 7.15 I T 451 6 1 8 1 10 1 12 1 14 17.151E
BLOCK: DIO
NO 9
& 8 Lt 7
6 1 5
f.r, 4 N 3 0 2
112.5°-1
57. 5
°
NO 9
III a
0 N 7 44 1 5
To 4
112
.5° -
157.
5°
20
2.5° - 2
47.
5°
8)
H No
9
01 ? N6
5 al 4 04 3
22
H
9 17 8 N N
riz ! 5 47 4
M 2
1 1 1 6 1
16 2 12 8 2 14 6 2
10 11 2 14 5 1 1
1410 9
1 5 ro 4 N 5 0 2
1410 9
LO
1 5 rn 4 N 3 2 2
NO
9
V 7
N
1
8
7.10 o 9 q a tn g 7 N N 6 I5 1 6 4 th r;t: 3 1 N 2
E
MO
N 1 5
en 4 N. 3 N2
If
04 04
310 9
6
1 5 rn 4
5 w2
m09
8 1 N 6
1 5 rt, 4 N 3 El 2
Pn
• V
1 N 2
2
4
NO 9
tO a fV; 1 5
11) 4 I, 5 to 2
NO 9
h; 2 6 1 5 fi) 4 N 5
2 1
10 29 3 2
5 2 2 1 1
1 1 5 2 6 1
1 2 1 3 3
9 19 2
1 3 2 7 1
2 2 7 4
2 1 10 8 2 6 1 1 5 3 2
1
1 3 1 2
2
15 En 4 N 3 N2
1
2
3
3 1 2 2
1 1 2 1 1 2
3
1 8 7 1 7 1 1
2
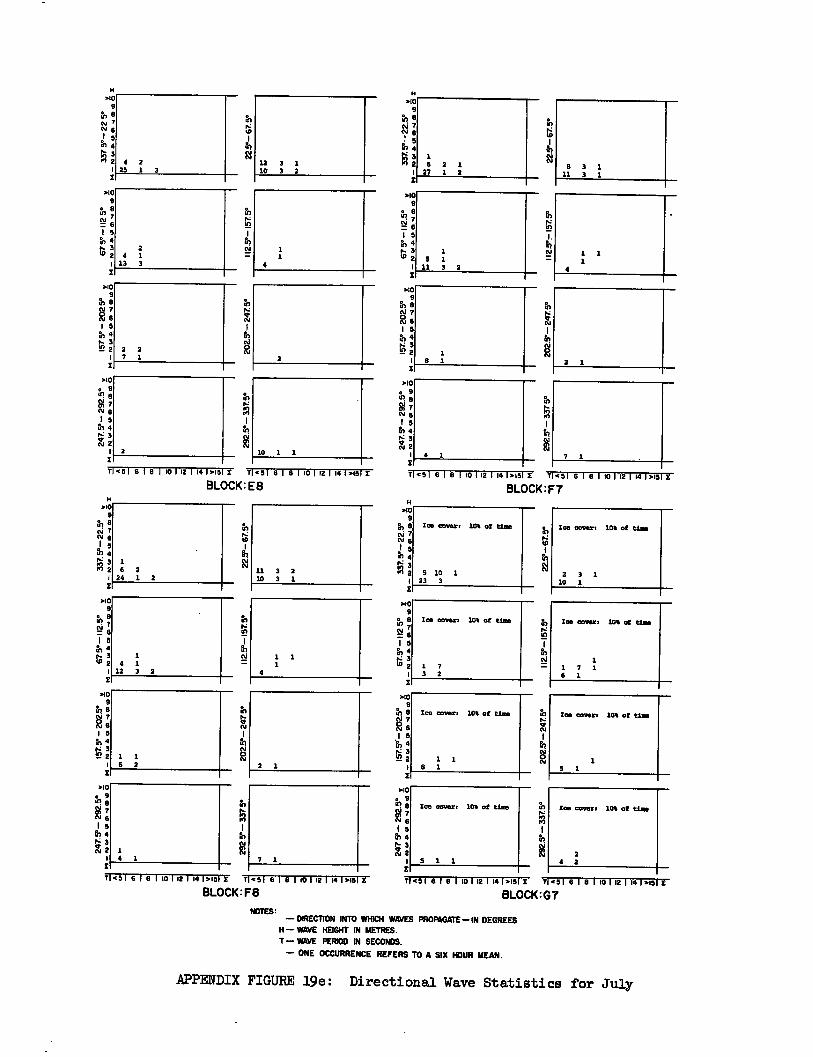
1 4 1
za 3 2
1 1 6 2
4 1 7 1
2 1
.40 9
Ice cover. 10% of time
1 1 8 1
Ice covers 10% of time
5 1 1
Ice covert 10% of time
3 1
Ice cover. 10% of time
4
>10 9
:1 8 1 5 in 4 N 3 47 2 11
2.r-
157W
.10 9
!
15
Ice cover. 10% of time
1 7 3 2
Ice cover: 10% of time
1125°-
157.
5°
th 4
010 9 B
CI 7
I 5 1,5 04 3 er N 2
6 15 64
NZ
>10
7 8 I 5 a, 4 0- 3 cr
>10 9
• a
: I5 4
IN 3 ID 2
H sip 9
6 N 7 N 6
N 5 WI 4 3
2
>10 9
0 • 6
N
1 5 tr', 4 N 3 v0 2
H
4 25
2 1 3
10
12 10
3 3
1 2
.10 9
ra a
? 0.1 6
in 4
1
1 6 27
2 1
1 2
8 11
3 1 3 1
4 13
2 1 3
0
N N
4
1 1
>10 9
• 41
8
15 6 4 N 47 2
1 5 11
1 1 3 2
I. IA N
4
1 1
I
>10 9
re) a
S 7 cv 8 15 in 4 N 3 'n2
>10 • 9
a
cv 15 6 4 N cv 2
2 7
2 1
6
V Pl
2
.10 9
16 B cm 7 2 5
64 N5 e2
I
>10 9
V7
15 4
tz 3 cv 2
1
3Si
1'0
2 1
2 10 1 1 4 1 7 1
T
H >10
9 k os 7
ci 5 cn 4 S.: 3 M 2
El
451 6 I B I 10 I 12 I 14 1.15 2 714 61
BLOCK:E8 6 I B 1 10 1 12 1 14 1.151 2
H 210
9 16B oi 7 N 6
s! 5 41. 4
3
21
T145I 6 1 B 1 10 112 1 14 1215 E T 451 6 1 8 110 112 1 14 I.151 Z
BLOCK:F7
1 6 24
2 1 2
4
10
11 10
3 2 3 1
Ice cover. 10* of time
5 10 1 23 3
Ice covert 10% of time
2 3 1 10 1
T 451 8I B 1 10 1 12 1 14 1215 E T 451 8 1 8 1 10 1 12 1 14 1.151 2
BLOCK:Fe 1.1451 6 1 8 1 10 1 12 1 141,15 E T 451 8 1 0 I 15 I 12 I 141 2451
BLOCK:G7
NOTES • — DIRECTION INTO WHICH WAVES PROPAGATE—IN DEGREES
H— WAVE HEIGHT IN METRES. T— WAVE PERIOD IN SECONDS.
— ONE OCCURRENCE REFERS TO A SIX HOUR MEAN.
APPENDIX FIGURE 19e: Directional Wave Statistics for July
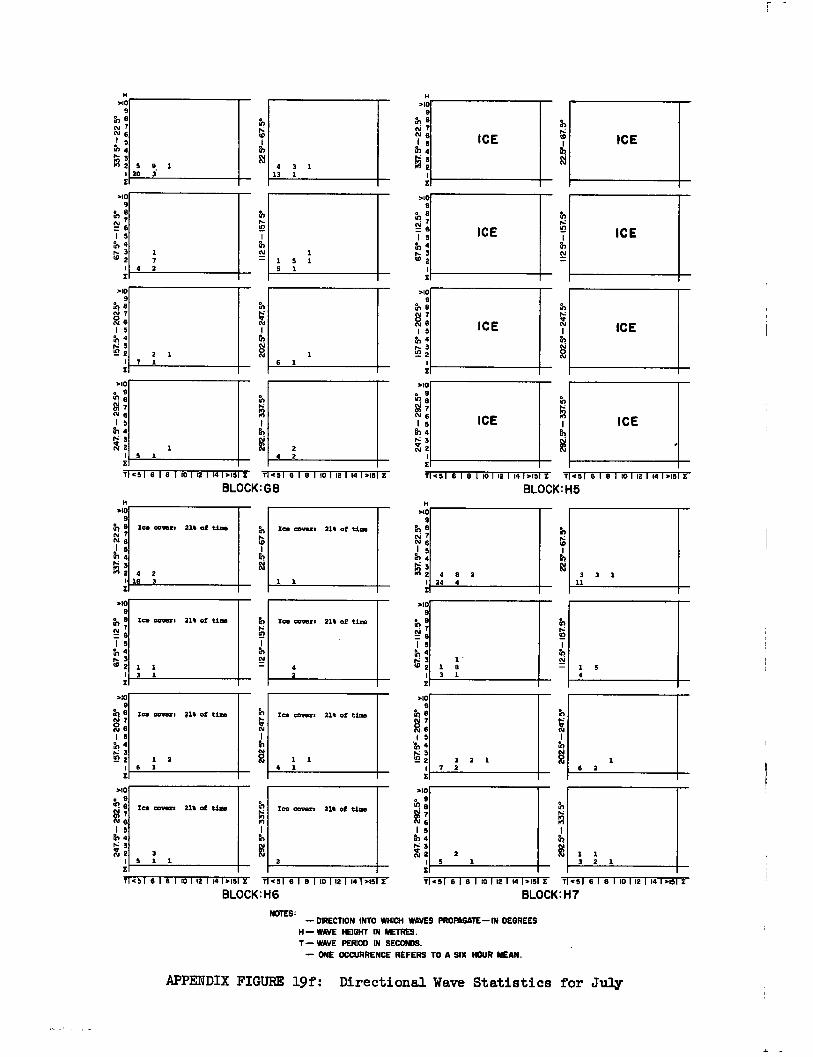
Ice ammo ;1% of time
1 2 6 1
H 010 9 B
N 7 ce 6
5) IA 10
4) 4 N 3 2 2 5 9 1 4 3 1
20 3. 13 1
1 6 1
112.5°- I
57.V
2
02
.5-2
47.
5°
T1451 6 1 8 110 1121141.15 I Te51 8 113110 11211410151E
BLOCK: G8
010 9
l; III 6 1 5 r- 4
3 (.0 2
I
2 4 2
010
W RI 7 N 6
1 s in 4 N 3 N 2
1 5 1 I
N N6 1 5 • 4 N 3 .11 2
I
1 7
4 2
2 1 7 1
N 6 ICE j
04 143 M2
1
>10 9
1V 7
1 5 tr', 4 r3 1°2
1 I
010 9
to 0 N 7 N 1 5
fr., 4 N 3 Le 2
I
so • 9 W
N
I5 in 4 N 3 te 2
I 11.51 eIeIlo 1 12 1 141015 I T45 16181 10 1 12 1 14 1.151
BLOCK: H5
to
N
71.51 6 1 8 1 10 1 12 1 14 1.15 5 T 451 6 1 8 1 10 1 12 1 14 1,451
BLOCK: H6 T1451 6 1 8 1 10 1 12 1 14 1015 I T .51 6 1 8 1 10 1 22 I VI I >191
BLOCK: H7
NOTES: — DIRECTION INTO WHICH WAVES PROPAGATE—IN DEGREES
H— WAVE HEIGHT IN METRES. T— WAVE PERIOD IN SECONDS.
— ONE OCCURRENCE REFERS TO A SIX HOUR MEAN.
APPENDIX FIGURE 19f: Directional Wave Statistics for July
Ice covers 21% of time
3 1 1
1 6 2
1 1 3 2 1
H .93
9 Ice covers
1 1
21% of time tai 7
I in 4
3 2 4 24
8 2 4
8)
10
3 11
3 1
I
Ice covers
4 2
2111 of time
>10 9 e
Eli ; I 5 [1,4
10 2 1 3
1 8 1
1 4 5
I
2409
rp a
N■ 8 15
1, 4
3 2 1 7 2
I
Ice covers 21% of time
2
Ice covers 21% of time
1 1 4 1
N
of
1 a,
>10 e 9 08 g 7 N
15 al 4
te 2
I
112
V-1
57.
5*
H *10
9
th 8 N 7 te 1
in 4 r 3
2z
N L°. 6
I 5 rr, 4 N 3 tO 2
9
rrt e (cc:: : 1 5 th 4 N 3 tn 2
Al 6 5
N 3 611 2
I
)40 • 9
e
010 9
)40
I
I
112
5°-
157.
5°
5, N
to
IM
Ice cover. 21% of ties
4 2 18 3
Ice cover. 21% of time
1 1 3 1
ICE
ICE
ICE
ICE
ICE
ICE
ICE
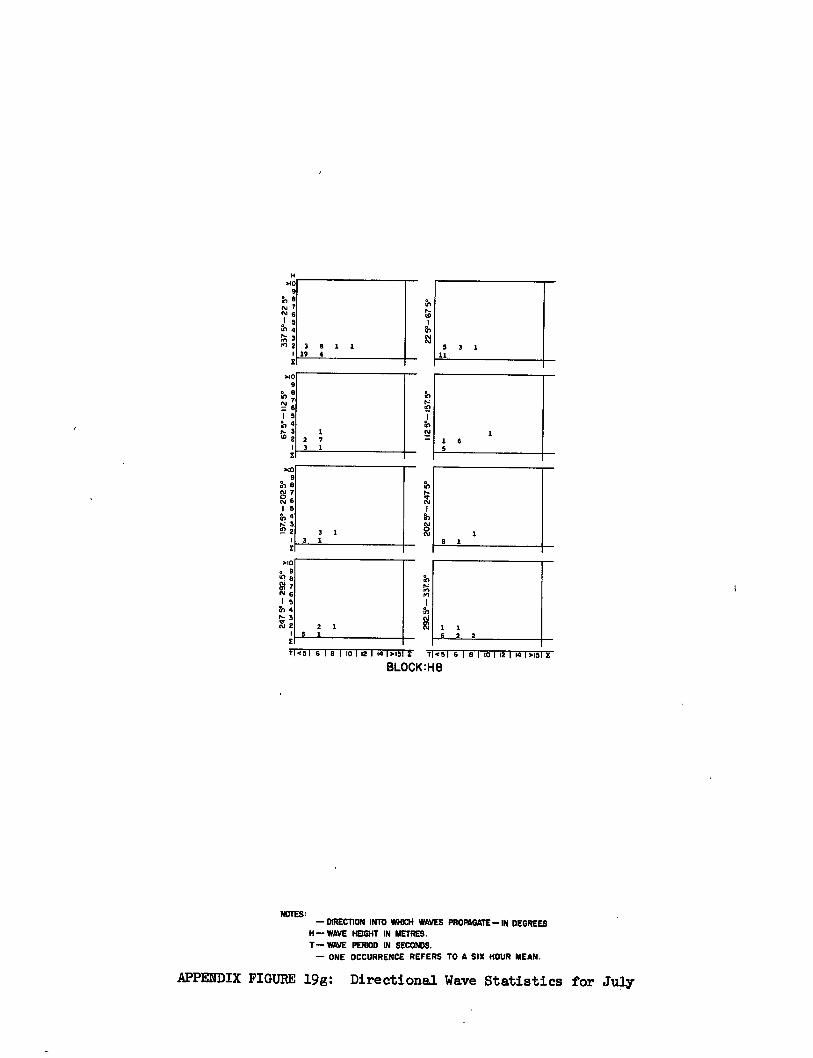
1 8 1
1 1 6 2 2
1 6 112 5
.-15
25°
V
2
2
>ID
1,1 ,1 Al T 6 I 5 a, 4 ••• 3
2
.10 9
0 e
(13;
Is 11„4
el) 2
MO 9
&)e
N T 5
th4
02
1 2 7 3 1
3 1 3 1
2 1 5 1
H
5 3 1 11
3 8 1 1 19 4
22 5°-
67 5°
.10 9
rn N ?
6 1 5
4 3
es 2
1.1<51 6 1 8 1 10 1 12 1 14 11.15 I T 451 6 I 8 110 1 12 I 14 1.151 E
BLOCK:H8
KITES: — DIRECTION INTO WHICH WAVES PROPAGATE—IN DEGREES
H— WAVE HEIGHT IN METRES. T— WAVE PERIOD IN SECONDS.
— ONE OCCURRENCE REFERS TO A SIX HOUR MEAN.
APPENDIX FIGURE 19g: Directional Wave Statistics for July
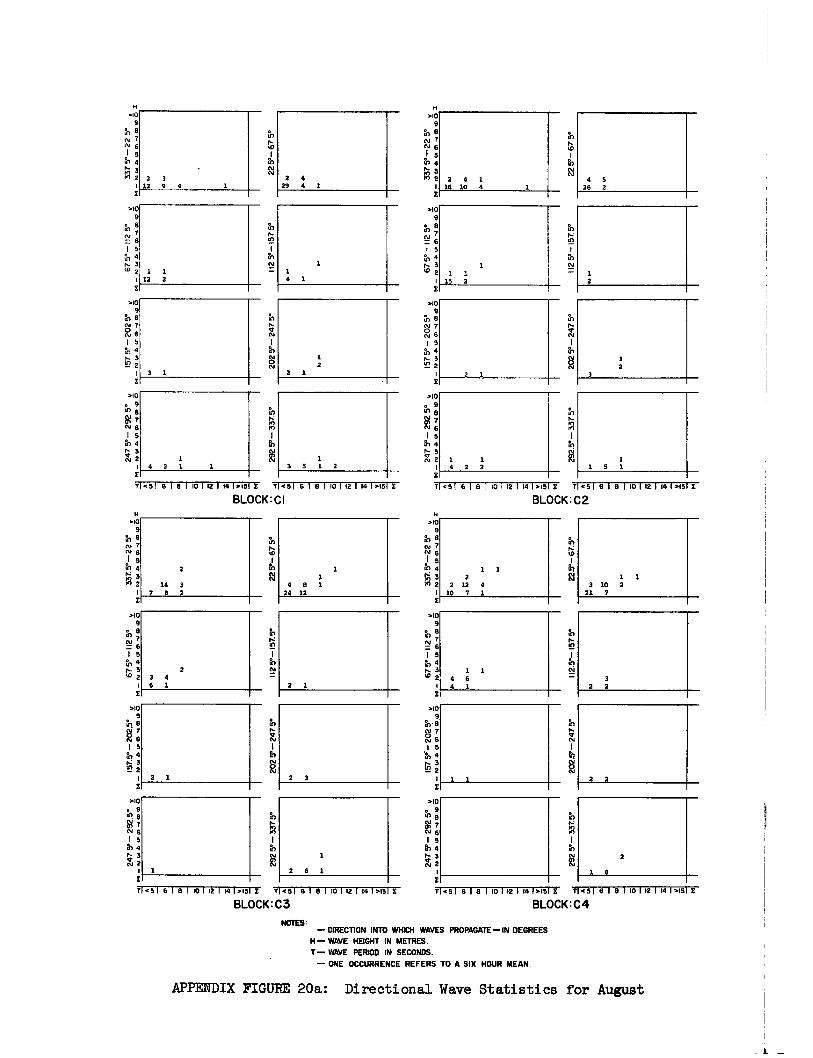
2 3
2
112 5
°- 1
5Z 5°
202 5°- 247
5°
2 4 1 16 10 4
4 5 26 2
1 1 2 2
2 1
22
5°- 67
5°
112
5° -
157
5°
20
2 5°- 24
7 V'
.10 9
N 7 N6
2
.10 9
• a
;
1 5 4
f, 3 2
.405
in 8 N 7 N6
1 5 N 4 1- 3 `-r-' 2
>10 e 9 ‘17 V7 N 6 1 5
Pr) 4
;
H
.10 9
th 8 N N 6 1 5
fn 4
M 3 yl 2
.10 9
to 8
EY 76 1 5 -, 4 r 3 t° 2
>10 9
&) N7
6 1 5 to 4 r, 3 Li'. 2
>10 ▪ 9 0 Si 7 " 6 1 5
al 4
2 3 12 9 4
2 4 29 4 1
1 4 2 1 1
1 1 12 2
3 1
1 3 5 1 2
1 2
2 1
H >10
9 N 8 N N 6
1 5 1 4 1 1
1 3 a 1 1 4 8 1 2 2 12 4 3 10 2
24 12 1 10 7 1 21 7
225°
- 67
.5°
202 V
-24
7 V
T <51 6 1 8 1 10 1 12 1 14 1.15 E 7 <51 6 1 8 1 10 1 12 1 14 1 >151 X
BLOCK:C3
It 2 ts 3
>10 9
1 5 4
I, 3 10 2
1
.10 9
N M 76 I 5 to 4
1
>10 • 9 to. V7
I 5 en 4
2 3 4 6 1
2 1
2 6 1
2 1
2 3
7 <51 6 I 8 1101 12 1 14 1.15 I 7 <51 6 1 8 1 10 1 12 1 14 1 >151 2
BLOCK: CI 7 <51 6 1 8 1 101 121 141.1512 T1 4 51 6 1 E1 1 101 121 141.151E
BLOCK: C2
I 5 In 4
3 w 2
.i0 9
In•8
N 6 I 5
11,4
1
>10 e 9 'n 8 N7 N 6 I 5
87 4
it; : 1
74516181 101 121 141.1512 11.7 516181 101 121 141.151E
BLOCK: C 4
NOTES — DIRECTION INTO WHICH WAVES PROPAGATE— IN DEGREES
H — WAVE HEIGHT IN Ml I Ktb.
T— WAVE PERIOD IN SECONDS.
— ONE OCCURRENCE REFERS TO A SIX HOUR MEAN.
APPENDIX FIGURE 20a: Directional Wave Statistics for August
1 1 4 6 4 1
112.
5°-1
57 5°
3 2 2
202.5 - 247 V
2 2
2
1 6
N 7
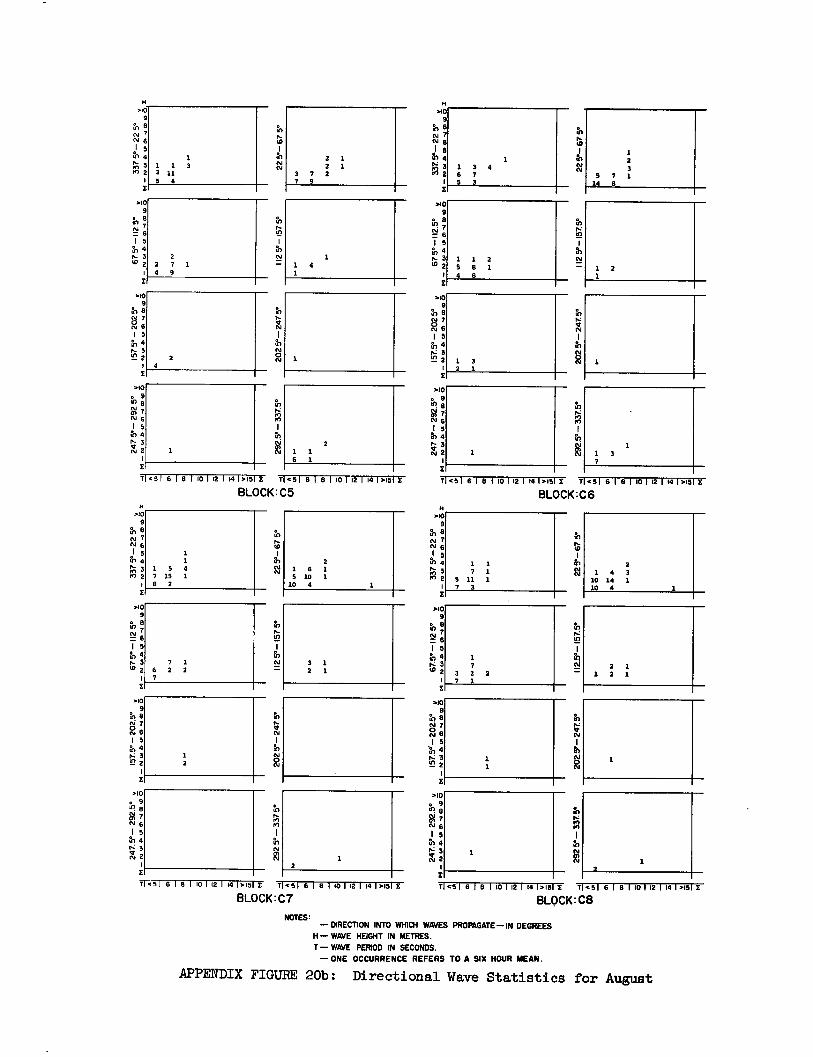
T1<5 1 6 1 8 1 10 1 12 1 14 1.15 I T <51 8 1 8 1 10 1 12 1 14 1.151 E
BLOCK:C7 T <8 1 6 1 8 1 10 1 12 1 14 1.15 E T <51 6 1 8 1 10 1 12 1 14 1.151 I
BLOCK:C8
NOTES: — DIRECTION INTO WHICH WAVES PROPAGATE — IN DEGREES
H— WAVE HEIGHT IN METRES.
T— WAVE PERIOD IN SECONDS.
— ONE OCCURRENCE REFERS TO A SIX HOUR MEAN.
APPENDIX FIGURE 20b: Directional Wave Statistics for August
2 4
.10 o 9 N
N 7 6.1 6
1 5 fr', 4 r-g'2
1 5 En 4 ... 3 N 2
.10 9 8
N 7 c4ii 6
71.51 6 1- 8 1 10 1 12 1 14 1.i5 I T
BLOCK:C5
22 5°
- 67
5°
112
5° -
157
5°
3 7 7 9
2 2 2
1 1
in 8 N 7 csi 6
I N4 3 1 3
6 7 5 3
4 1
1 4 1
1
.10 9 8
,7 6
1 5 Fr, 4 r- 3 W 2
1 1 5 8 4 8
2 I
>10 9
in
07 N 6 1 5 rn 4
r;-; 1
1 3 2 1
1 I 6 1
2
>10
a 9 41 N7 N 6 I 5 N4
Cr• 3 N 2 1
<51 18 1 8 110 1 12 114 1 .151 T <51 8 18 1 10 1 12 1 14 1.15 E
H >10
9
T <51 6 16 110 1 12 1 14 1.151
BLOCK:C6
112
5°-
157.
5°
202
5°-
24
7 5°
In 10
1 5 N 4 r- 3
2 2
2 7 1 4 9
H HO
9
ot N6 1 5 N 4 - 7 3 . .7 2
1 1 1 3 3 11 5 4
Ho 9
th 7 111 6
1 1 1 3 7
1 2 3
5 7 1 14 8
1 2
2 1 1 2 1
H .10
1 1 2
1 5 4 1 6 1 7 15 1 5 10 1 8 2 10 4
112 5°
-15
7 5°
>to o 9
g 7 6
1 5 fh 4 1":„... 3 & 2
.10 9
N 7 2 6 1 5
4 3
Ez 20
2 5°
- 247
5°
2
9
e N 7 N 1 5 N4
.10 9
111 87 11.1 6
1 5 N 4 r- 3 W 2
7 1 6 2 2 7
3 I 2 1
2
N
112
.5.-
15
7.5°
In 141.' N N
fpV
N
t"n
En
1 1 7 1
5 II. 1 7 3
2 I 4 3
10 14 1 10 4 1
1 7
3 2 2 7 1
2
>10 9
52 6 1 5 rn 4
3 '5 2
>10 9
h e Ni4
(.1 6 1 5
11, 4 3
u7 2
N7 N6
>10 . 9
B
1 5 N4
Q N 2
H .10
9
?s, a NI 7 1•1
5 N4
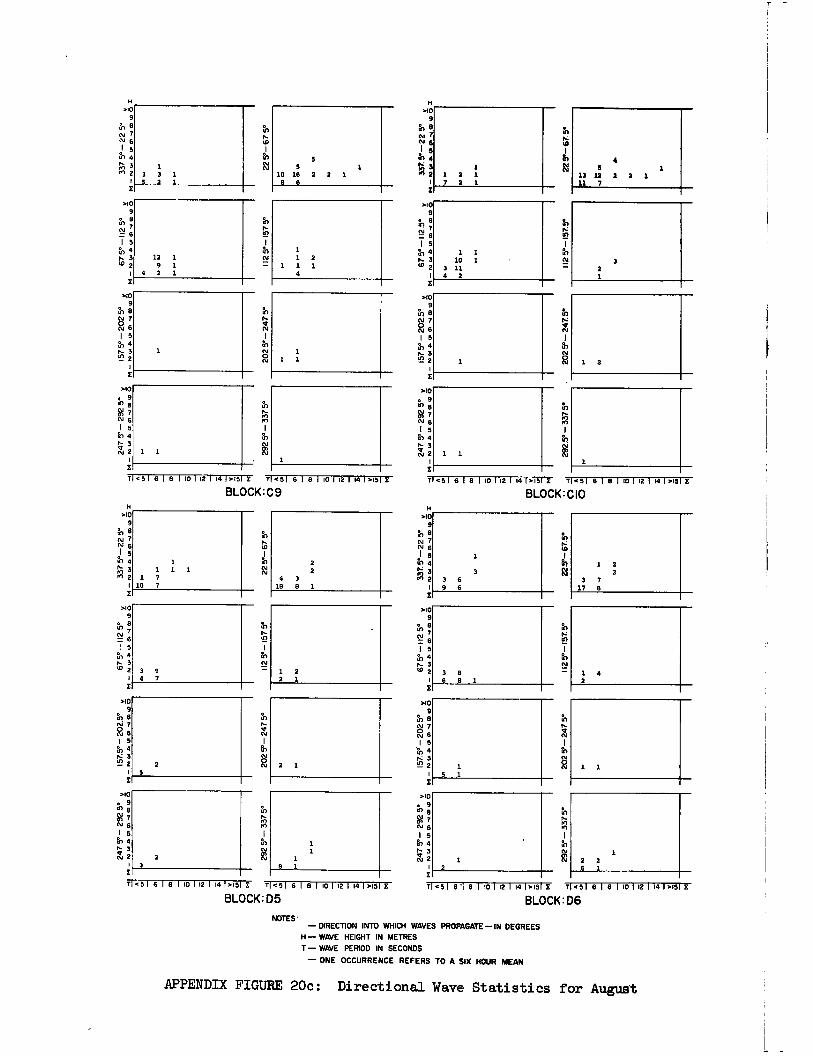
1 5 in 4 6. 3 Ct 2
1
.10 e 9 al
7 6
292
5° -
337
5°
20
2 5°
- 2
47
5°
1 12
5°- 15
7 5°
0,
5 5
10 16 2 2 1 8 6
1 1 2
1 1 1 4
TI<516113 I Wm' 141.151E 7 4 5 16181 101 12 1 141.151E
BLOCK : C 9
3 2
202
5°- 24
7.5°
71451 6 1 6 1 101 12 1 14 1.15 X T 451 6 I 9 1 101 121 141>151 E
112 5
°-1
57. 5
°
rn
.10 9
in 8 N N 6 I 5
Iz
.10 9
N 8 NI 7
1 5 to 4
>10 9
1"1 N 6
I 5 rs., 4 rs 3 W 2
.10
3 i (9
M 7 N 1 5 in 4
ri 32
1 2
1 1 10 1
3 11. 4 2
1
1 2 1 7 2 1
4 6 1
13 12 2 2 1 11 7
BLOCK: CIO
2 3
a a
8 1
T <5 1 6 1 8 1 10 1 12 1 14 1.15 X Tl<5 1 6 1 8 1 10 12 1 14 .151 E
BLOCK: 05
NI
225°
- 67
5°
1 12
5° - 157
5°
20
2 5°
- 24
7 5°
>10 o 9 to
Si 7 N 6 I 5
in 4 O3 2
>10 9
to 8 N 7 N 6
in 1 5
N 3 in rn2
1
>10 9
to o 8
(11 ;
1 5 a, 4 r– 3 '5 2
>10 9
in a 0.1 7
6 1 5 a, 4 r..1 3 • 2
1 1 1 1
1 7 10 7
2 2
4 3 18 8 1
3 9 4 7
1 2 2 1
a 2 1
>10 9 ▪ B
68 7 • 6 1 5
lb 4 6.: 3 N 2
1
>10 e 9 In
all 7 N 6 I 5
er, 4
: 1
TI 4 5 1 61 8 1101 12 I 14 1.15 E T 451 6 I 8 I 10 1 12 I 14 1.151 E
BLOCK: 06
202
5°- 24
7 5°
I 1
2 5°- 15
7. 5°
a
o 9
to 8 ;
I 5 ▪ 4
H >10
9 N 8 N 7 N 6
5 10 4 N 3
2
X
>10 9
if', C-11 ;
1 5 4
6- 3 'D 2
N 6 I 5 to 4
;
9 in N 7
X
H >10
9 to° a cv 7 NI 6 I 5
r11 4 tr:i 3
2
2
1 2 2 6 1
3 7 17 6
3 3 6 9 6
3 8 6 8 1
12 1 9 1
4 2 1
1
1 3 3 1 5 2 1
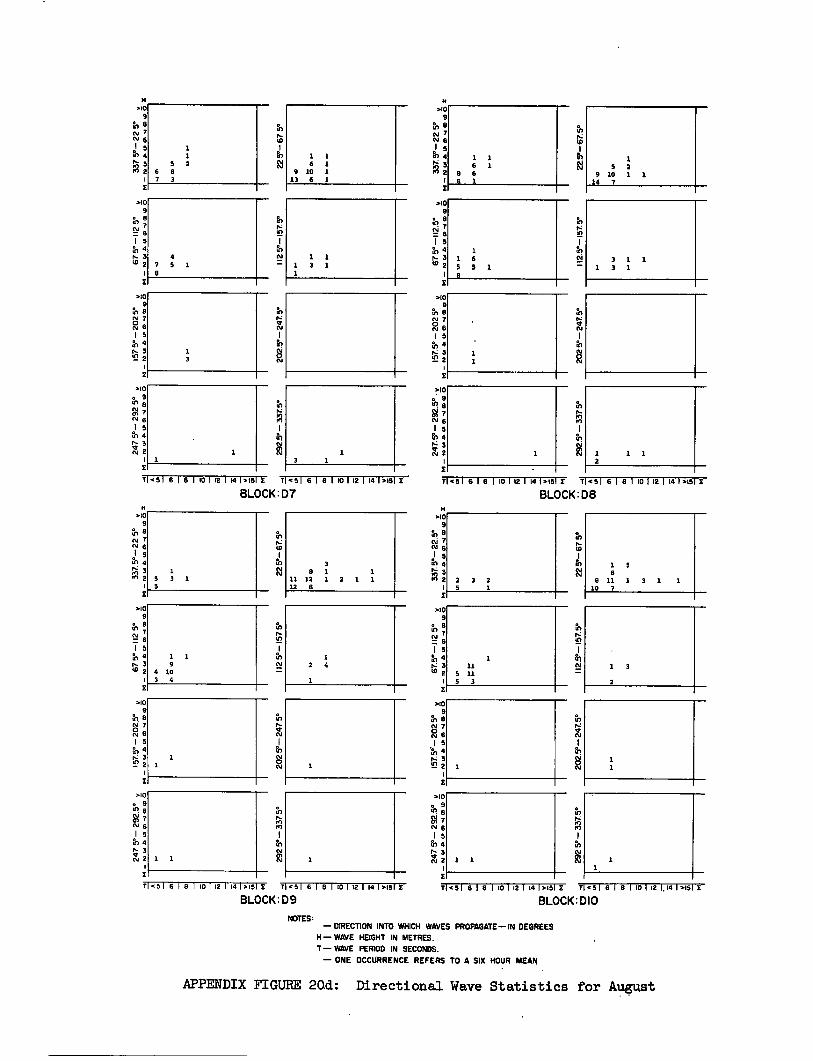
112
5 °-1
57. 5
°
N
5, loV
9 rn 8 0.1 7 01 6 I s N-4 e- 3 2 2
>10 9
N 8
I 5 tr, 4 r. 3 w 2
>03 9
:I8 8 7 N 6 I 5 ro 4 t. 3 52 2
1 3
112.
5e-1
575°
202 5°- 2
4 75°
IA
>10 • 9 d!
N6
I 5 014 tz N2
z
)40 9
ai 6 1 5 rn 4
3 co 2
1
>10 9
O 7
s 15 rs, 4 rz 3
2
£
1 1 6 1
8 6 6 1
1 1 6 5 5 1 a
1 1
2
3 1 1 1 3 1
>10 e 9 el 0'1 N 6 I 5 al a
3 N 2
1 1
5 2 6 8 7 3
1 1 6 1
9 10 1 13 6 1
4 7 5 1 8
3 1
1 3
1 3
2
9
8 11 1 3 1 10 7
a,
112
5° -
157
5°
202 5°
- 247
5°
292 5°
- 3
375°
H NO
9 1.1.1 8 m7 m6
l 5 10 4 Pz 3 M 2
1 11
2.5°
- 15 7
. 5°
202.5°- 24
7 5°
29
2 5°
- 337
5°
>10
N7 26 1 5
'er, 4 3 LT) 2
9 111 Pi 7 N 6 1 5 ti)
3 N2
H >10
9
5, 4 3
'in 8 N 7 N 6 I 5
n 2
>10 9
a-) 1 1.,1
N 1 5 a, 4 I, 3 w 2
>10 9
51 5 N cc:3 6 1 5
4 to.: 3 '12 2
>10
N
• 6
SI 7 N 6 I5 to 4 1, 3
2
2 3 2
1 11
5 11 5 3
1
1 5 3 1 5
3 8 1 1
11 12 1 2 1 1 12 8
1 1 9
4 10 3 0
1 2 4
1
1
H H
TI <5 1 6 18 110 1 12 I 14 1.15 T <5I 6 18 110 1 12 1 14 1.151
BLOCK: D7
T <51 6 1 8 1 10 1 12 I 14 1T•13 I T.51 6181 10 1 12 1 14 1 >151
BLOCK:D8
-11.5161e110 z T.5161elmlmimi.orz
BLOCK:D9 T <51 6 1 8 110112 1141.15 T.51 6 1 6 I 10Ii2 1141.151 X
BLOCK:DIO
NOTES: — DIRECTION INTO WHICH WAVES PROPAGATE— IN DEGREES
H— WAVE HEIGHT IN METRES. T— WAVE PERIOD IN SECONDS.
— ONE OCCURRENCE REFERS TO A SIX HOUR MEAN
APPENDIX FIGURE 20d: Directional Wave Statistics for August
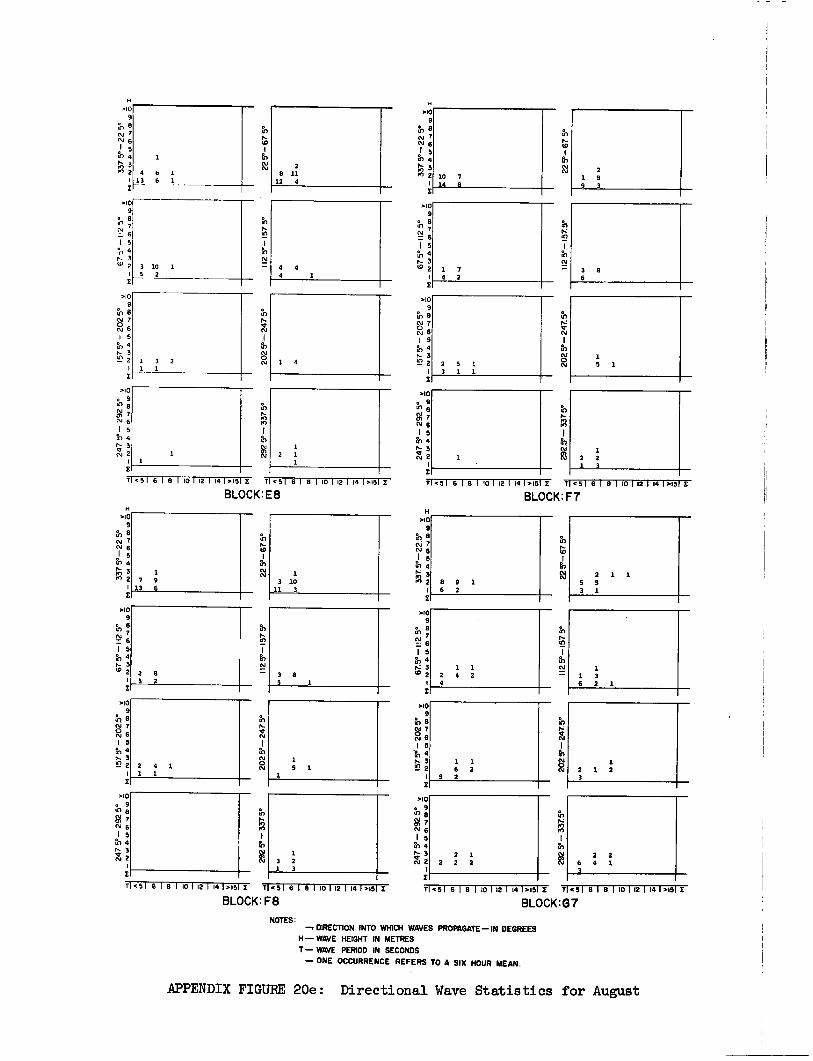
2 5 2
2 4 1 1 1
BLOCK: F8 BLOCK: G7
3 10 1 5 2
1 3 2 1 1
4 4 4 1
225°
- 67
5°
>10
In 8
7 N 6 1 5 in 4
ri.76
T1.51 6181101121141.15 X 1.516181101121141.1512
1:b
N rs.1 6 1 5
i■-", 3 ro 2
112 5
° -1
57 5
° 20
2 5°
- 247
5°
292
5° -
337
5°
>10 9
N 8 N 7
6 1 5 f}-, 4 r- 3 co 2
>10
N 7 2 6 1 5
4
Lin ;
1
4 6 1 13 6 1
2 8 11
12 4
1 4
2 1
BLOCK: E8
N7 N 6 1 5 tn 4
X 71.5 1 6 1 8 1 10 1 12 1 14 1.15 X 7 .51 6 1 8 1 10 1 12 1 14 1.151
>10 o 9 n 9
22 5°
- 67
5°
112 5
° - 1
57.5"
202
5°-
247
. 5°
>10 9
in 8 7
0 CV 6 1 5 fc., 4 6- 3 I'2
>10 9
:I 8 N ;
1 5 fr., 4 r- 3 W 2
1
1 2 2 1 3
2 1 9 9 3
1 7 4 2
3 8 6
2 5 1 3 1 1
BLOCK: F7
8 9 1 6 2
22
5°- 6
7 5°
11
2 5°
-15
7 5°
22
5°-
67 5
° 11
2 5°-
157
5°
5) pN
202 5°
- 2
47 5
°
1 5
H >10
9 in 8 OJ "
10 4
2 2 is: 3
>10 9
1 5 fg, 4
;
>10 9
in 8 0 N 7 N 6
1 4
O. 3 D 2
1 3 10
11 3
3 a 5 1
1 1 2 4 2 4
1 1 6 2
5 2
ccg 6- en 7 N 6 N 6 In 1 5 I Is I 554 u, in 4
N 2 1
3 2 : Xi 1 3
11 < 5 1 6 1 8 1 10 112 1 14 1.151 I 7 <51 6 I 8 1 10 112 1 14 1 >121 2 T1 <51 6 1 8 1 10 I 12 1 141.15 E 7 .51 6 1 8 1 10 1 12 1 14 1 >151 2
NOTES: —7 DIRECTION INTO WHICH WAVES PROPAGATE—IN DEGREES H— WAVE HEIGHT IN METRES T— WAVE PERIOD IN SECONDS
— ONE OCCURRENCE REFERS TO A SIX HOUR MEAN.
APPENDIX FIGURE 20e: Directional Wave Statistics for August
>10 e 9
e
2 2 2 2 1
H >03
9 to 8 01 7 N 6 1 5
Fr) 4 Pi 3 ^l2
>10 9
Lo
>10 9
to t-s-'i N 6 1 5
4 6- 3 u' 2
>10 9
trl 8 cv 7 N 1 5 ?, 4 7, 3 tr' 2
2 2 6 4 1 3
1 2 1 2 3
2 1 1 5 5 3 1
1 1 3 6 2 1
1 7 9
13 6
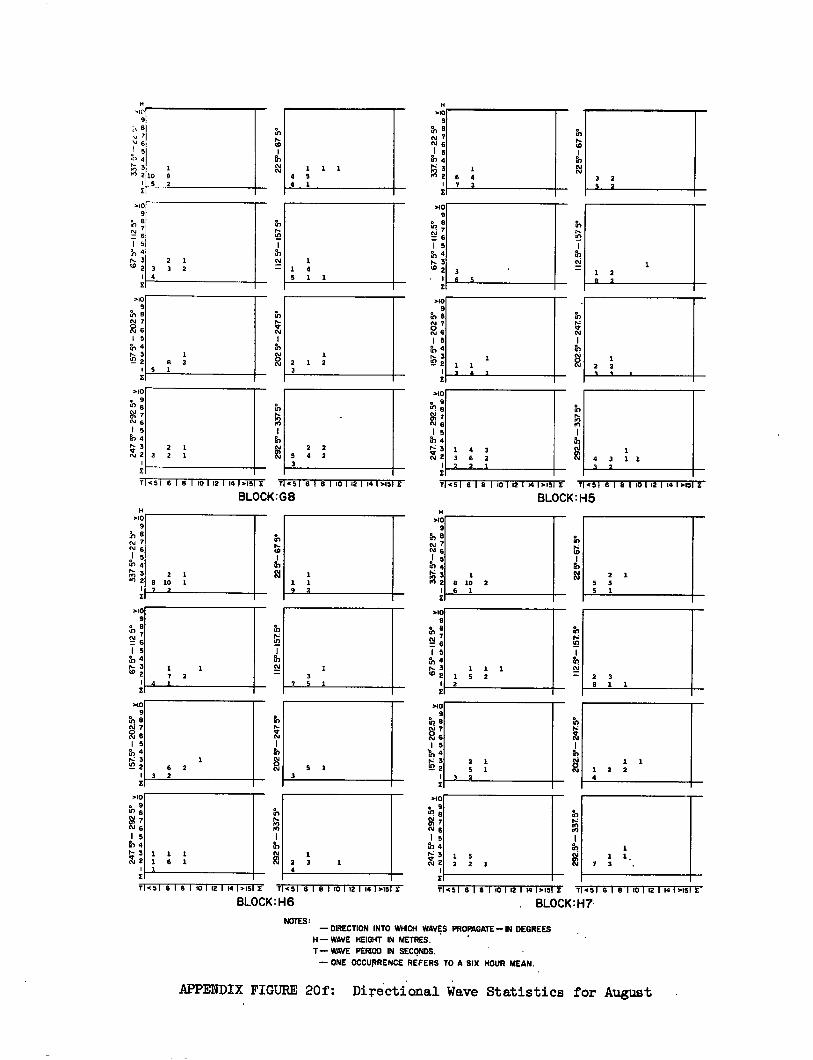
2 2 1 I 1
NOTES: — DIRECTION INTO WHICH WAVES PROPAGATE—IN DEGREES
H— WAVE HEIGHT IN METRES.
T— WAVE PERIOD IN SECONDS.
— ONE OCCURRENCE REFERS TO A SIX HOUR MEAN.
APPENDIX FIGURE 20f: Directional Wave Statistics for August
20
2 5°- 2
47 5
°
112 5°
-15
7 5
°
22 5°
- 67 5
°
2 2 5 0 2 3
1 2 1 2 3
11451 618 1101121141415 Z T 451 6 1 8 1 10 1 12 1 14 14151 £
BLOCK :68
3 6 5
>10 9 e
N 7 6
1 5 N4
92
Zi
H >10
9
th N 7 (%1 6 1 5
fc.) 4
15'7; 3 en 2
>10 9
= 6 1 5
'en 4 r- 3 (.0 2
•
1 6 0 7 3
112.5°-1
57
5°
•
N
N oN
1451616101121141 >15 7451618110112118 1 >151
BLOCK: H5
1 4 3 1 1
/
3 2 5 2
1 1 2 8 2
5 1 3
202 5
- 2
47
5°
T14516181101121141/15 70516181101121141.1513:
BLOCK: H6
112
5° - 15
7. 5
°
>10 e 9 (r)
292 5°-
3375°
7 N 6
15 4
4- 3,, N
9,
>10 9
fit 6 N 7
1 5 a, 4
3 ,n 2
>10 9
1 5 en 4
H >10
9
N N 7
6 j 5 4") 4 1.- 3
2
1 6 2
3 2
1 1 7 2
4 1_
1 3
7 5 1
1 2 3 1
2 1 8 10 1 7 2
1 1 1 9 2
2 3 8 1 1
1 5 2 2 1
>10 9
th 8 ;
I 5 a, 4 5- 3 07 2
410 9
fh
N 7 6 16 N4 5: 3 N 2
>10 e 9 5.1 8
N 6
I 5 1, 4
a 3 N 2
H >109
el 5 47 4
?n e N i N 6
M 2 N43
Zi
1 1 1 1 5 2 2
2 1 5 1
3 2
1 8 10 2 6 1
112.5 -
15
7.5
°
In ri (0
7051 s I 81101121141.15 Z 1145161811011211414.1512:
. BLOCK:H7
2 1 5 5 5 1
1 1 1 2 2 4
2 1 2 2 1
>I0 9
N
1 5 en 4 N. 3 tO 2
>10 9
r08 N 7 R 6 I 5
en 4 5- 3 “2 2
1
SIo
9
`' 7 6
1 5 4
r,3 3 2
>10 e 9 44
017 N 5 1 5 in 4 it 3 cu 2
1 W 9
2 1 3 3 2 4
1 8 2
5 1
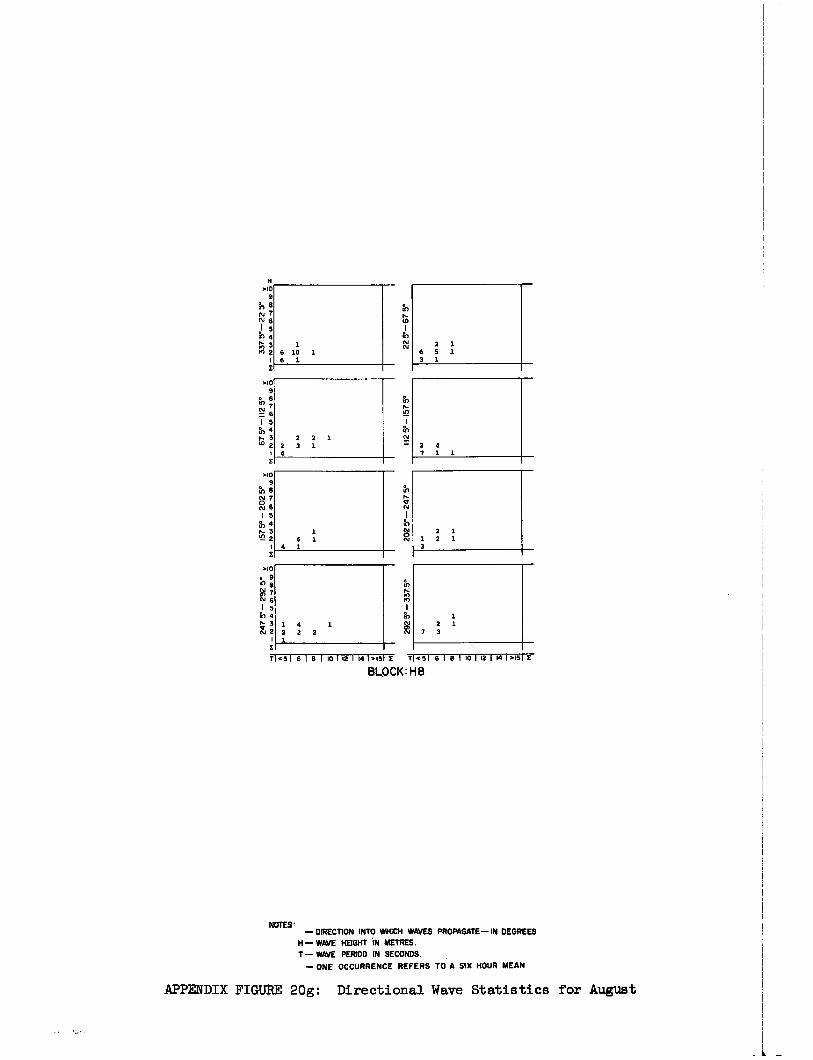
>10 9
Ehe N 7 N 6 I 5
&') 4
2
I
22 5°- 67
5°
112 5
° - 1
57 5°
20
2 5°
- 247
5°
11<5 I 8 1 8 . 1 10112 1 141>15 I 11..51 616I10I12I14IM5It
BLOCK: H8
>10 9 th a Es.! 76 I 5 fs, 4
t' :
>10 9
to N 7 0 cc. 6 I 5 N 4
3 92 2
I
1 2 1
7 3
>10 • 9
s
N6
I 5 to 4
N 292
5°- 3
37 5°
2 4 7 1 1
2 1 1 2 1 3
1 6 10 1 6 1
2 1 6 5 1 3 1
2 2 1 2 3 1 4
1 6 1
4 1
NOTES: — DIRECTION INTO WHICH WAVES PROPAGATE — IN DEGREES
H— WAVE HEIGHT iN METRES.
— WAVE PERIOD IN SECONDS.
— ONE OCCURRENCE REFERS TO A SIX HOUR MEAN
APPENDIX FIGURE 20g: Directional Wave Statistics for August
_ —
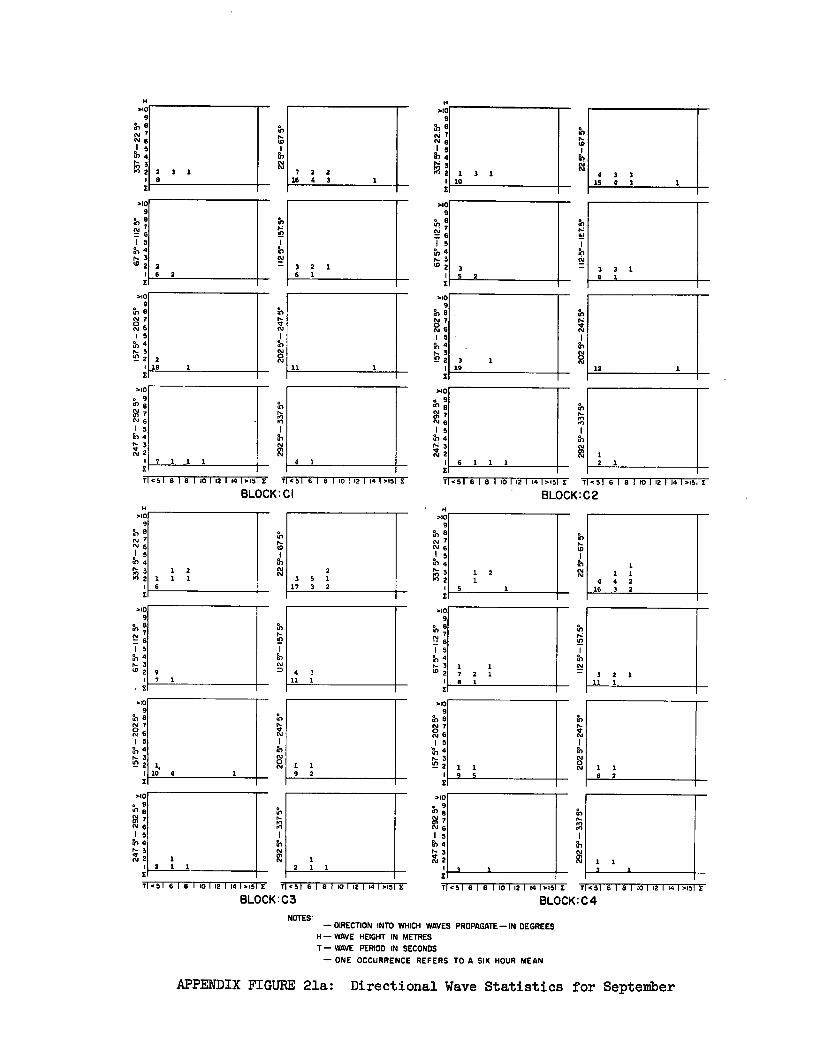
2 3 1 8
112 5
°-157
5°
20
2 V
- 24
7 5°
1 3 1 10
3 3 1 6 1
1 12
32. 1
112
5°-1
@75°
20
2 - 24
7.5°
r-
4 3 3 15 4 3 1
6 1 1 1
53 2
19
71<51 6 1 8 1 10 I 12 1 14 1>15 E 71<5 1 6 1 8 1 10 1 12 1 14 1 >19
1 7 1 1 1
Tl<616161101121141.16 E r<516181101121141.15
H >10
9
e tu
2 2
5 8) 4 r•Z 3
>10 9
6 76
1 5 N 4 ft.. 3 19 2
>10 9
fi) e N 7 N6 I_ 5 a, 4
3 D2
>10 e 9 tn a
ONi ? N 6 1 5
rn 4 1.■ 3 N 2
H
>10 9
N 6 j 5 in 4 M 3 M 2
$0 9
N 8
ti , 1 5
4 r, 3 Wa
>10 9
a, 8 N 7 N6 1 5
a, 4 P 3 e 2
>10 o 9 t0 6 • 7 N 6 1 5
iO4
2 6 2
2 18 1
3 2 1 6 1
11
7 2 2 16 4 3
4 1
9 7 1
22 V
- 67
5°
1125
°-15
75°
20
2 5°
- 247
5°
292
5° -
337
V
H >10
9
N 7 N6
ol 5 6 4
2 2• 3
>10 9
o 8
1 5 N 4 r, 3 O 2
- 1
>10 9
6 5 N 7
6 1 5 to 4 it- 3 ul 2
0
1.12 5°
-15
7 V
20
2 5°
- 247
5°
H >10
9 N a N 7 N 6 1 th 4 M 3 M 2
1
>10 9
:I 8 cs, 76 1 5
'en 4 r- 3 10 2
1
>10 9 8
O 7 N 6 1 5
4 tt- 3 e 2
1
>10 o 9
7 N 6 1 5
1h 4
14 3 N 2
1 10 4 1
>10
a 9 to a
g 7 N 6 I 5
in 4
1 2 1 1 2 1 1
9 2
2 3 5 1
17 3 2
4 3 11 1
2 1
1 1 1
4 4 2 16 3 2
1 1 7 2 1 8 1
1 1 9 5
3 2 1 11 1
8 2
BLOCK: CI
BLOCK: C2
71<5 1 6 1 8 1 10 1 12 1 14 1.15 I 7 <5 1 6 1 8 1 10 1 12 1 14 1.151E
BLOCK : C3
T1.51618 1101121141.15 E T.516181101121141,1511
BLOCK: C4
NOTES: — DIRECTION INTO WHICH WAVES PROPAGATE—IN DEGREES
H— WAVE HEIGHT IN METRES
T— WAVE PERIOD IN SECONDS
— ONE OCCURRENCE REFERS TO A SIX HOUR MEAN
APPENDIX FIGURE 21a: Directional Wave Statistics for September
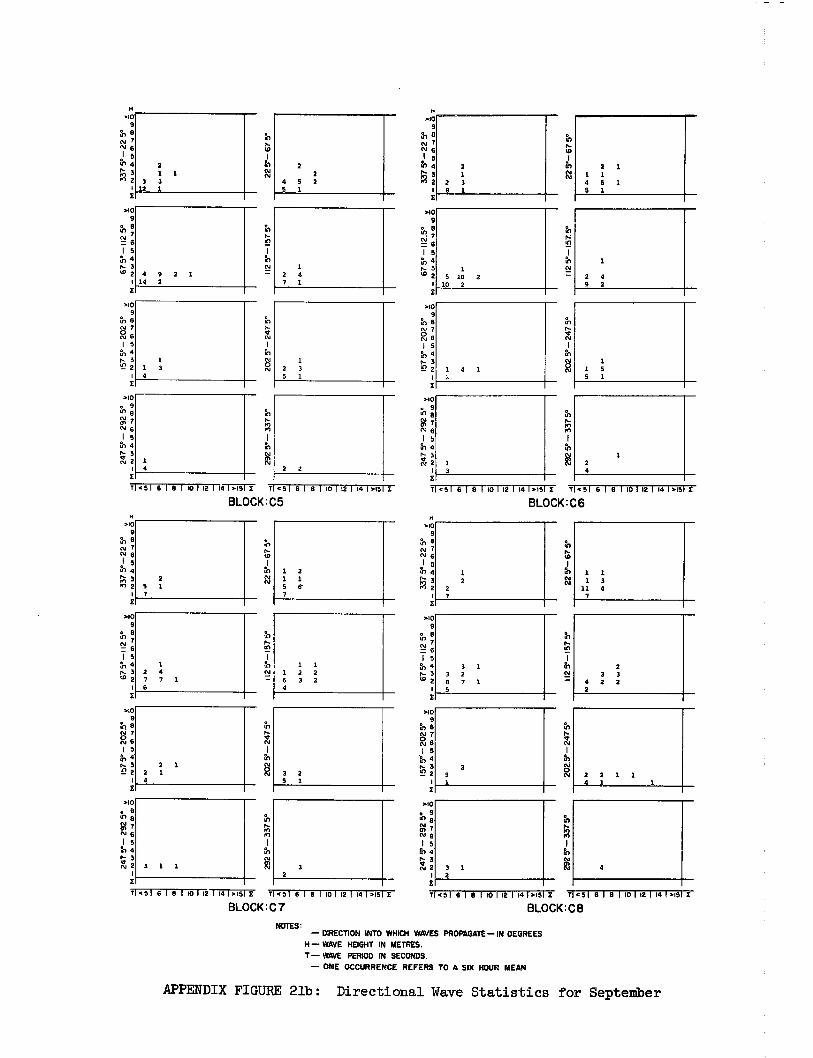
I 6 1 8 1 10 1 12 1 10 >15 E T <5 1 6 1 8 1 lo 12 1 14 1.151 I
BLOCK :C5
1 5 tr, 4
3 (5 2
>10 9
r0 8 N 7 196 1 5 rr, 4 r- 3 e2
>10 o 9
a 7
111 6 1 5 N 4
: 1
T<516181101121141.153 T<51 618110112114130513
BLOCK : C6
>10 9
‘1' ;
H >10
9 ,n* a N N6 I s tn 4
A 1,
32 1 £
1 5 N 4 4
▪ 3 2 11
2 5°
-15
7.5°
2
02
5°- 24
7 5°
2
92
5°- 3
375°
>10 9
a, 8 Ni 2 6 I 5 a-, 4 r. 3
2
>40 o 9 el
R41 N 6 1 5
in 4 3
ct 2
ti IO
112
5°-
157
5°
202
5°- 2
47 5
° 29
2 5°
- 3
37 5°
2 2
1 2 3 5 1
2 2
4 5 2 5 1
1 2 4 7 1
2 1 1
3 3 13 1
4 9 2 1 14 2
1 1 3 4
1 4
5 10 2 10 2
2 4 9 2
1 4 1
3
1 1 5 5 1
2 4
.40 9
tr' 8 N N 6 1 5 tr.,4
t-3 2
>10 e 9
T N6 I 5
4
9 N e N N 6
1 5 0 4
P. 3 2
1 5 N 4 N. 3 t17 2
H .19
>10 9
22 5°
- 67
5°
112
5 °-1
57
5°
2 S 1 7
1 2 4 7 7 1 6
2 1 2 1 4
3 1 1
2 2
3 1 3 2 8 7 1 5
112 5
°- 1
57
5°
4
2 2 1 1 4 1 1
1 1 1 3
11 4 7
2 3 3
4 2 2 2
;
T <51 6 1 8 1 10 1 12
1 1 1 2 2 6 3 2 4
3 2 5 1
3
14 >15 3 71451 6 18 1 10 1 12 1 14 1,451
BLOCK: C 7
H >10
9 f'n N 7 N 6
j 5 ,r1 4 rin. 3 >I 2
>10 9
N 7
1 5 4
r- 3 W 2
>10 9
Y7
C1; ( 1 5 in 4
>10 e 9 In
7 N 6 1 5 1
En 4
(11 2 1,- 3
202
5°-
247
5°
2
3 1 2
11<51 6 1 8 1 10 112 1 14 1.15 E T <51 6 1 8 1 10 1 12 1 14 1,451 X
BLOCK: CS
NOTES: — DIRECTION INTO WHICH WAVES PROPAGATE—IN DEGREES
H — WAVE HEIGHT IN METRES. T— WAVE PERIOD IN SECONDS.
— ONE OCCURRENCE REFERS TO A SIX HOUR MEAN
APPENDIX FIGURE 21b: Directional Wave Statistics for September
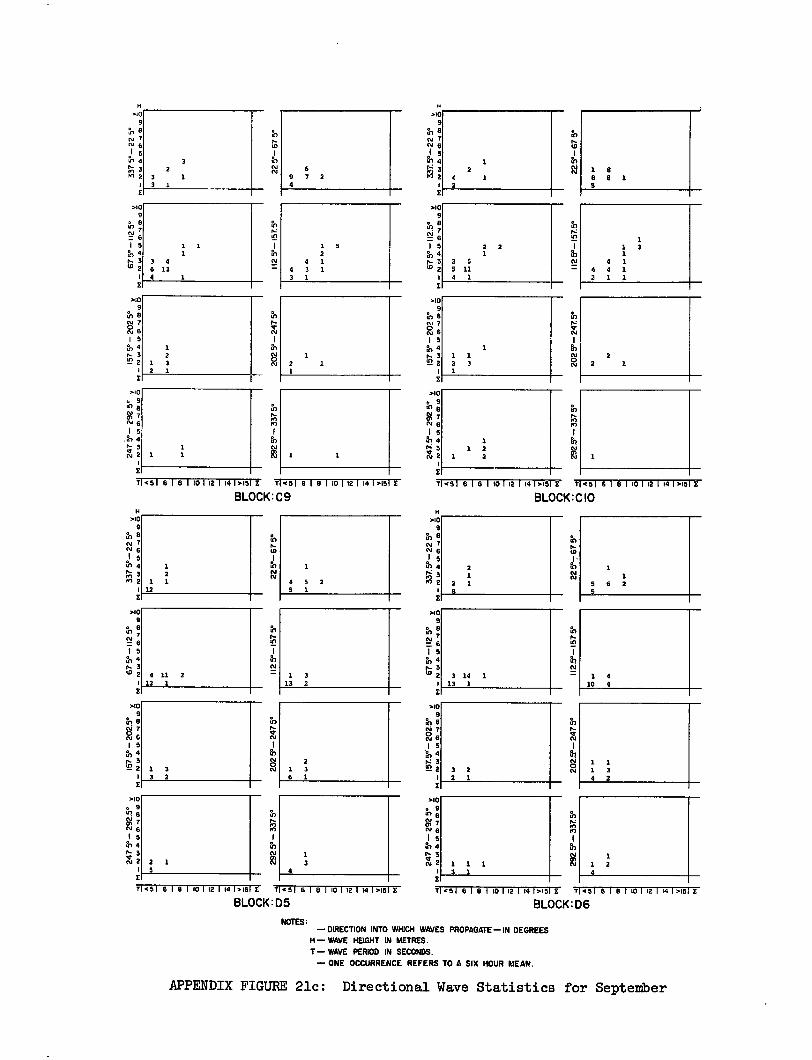
MO 9
N 76
w
I 5 • 4 r- 3
3.10 9
fn N 7 2 6
6 9 7 2 4
1 5 2
4 1 4 3 1 3 1
610 9
in ° N 76
I 5 II, 4 rs 3 W 2 11
2 5°
-1
57.
5°
202 5°-
24
7 5°
3 4 6 13 4
1 1 4- 3 N 2
2
2 S 5 11 4 1
1 1 1 2 3 1
1 1 2 1
112 5°
-157
5°
202 5°-
24
7 5°
H >10
9 e
N 7
eI5 ▪ 4
N 6
✓ 3
2 2 1
610 9
rel e O 7 r 2 6 I 5
4 rz 3 tn 2
1
610 9
7 N 6 I5 a, 4
N. 3
N 2 1
1 5 rs, 4
0- 23 1
610 9
1
4 5 2 1
2 1 3 6 1
1 3 13 2
1 3
4
2
2 1 8
1 1
5 6 2 5
1.
N
3 14 1 13 1
3 2 2 1
1 1 1 3 1
1 1 2 4
1 4 10 4
1 1 1 3 4 2
112.5°-
157
5°
202.5°- 247
5°
292 5°
- 337
5°
1 2
1 1 12
4 11 2 12 1
1 3 3 2
2 1
H >10
9 VI N 7 N 6
112
5° -
157
.5°
1 1 3 1
4 1 4 4 1 2 1 1
in
aA
5 in 4 1.;) 3 M 2
1 5 a, 4 P.. 3 12 2
X
>10 .10 ▪ 9 e 9
o 6 in t'8
in M 7 CM 7
N6 .1 N6
I 5 I 1 5
.31 4 ,,,, rn 4
E r-: 3 X 2
1
E X
T <5 I 6 1 8 1 10 1 12 1 14 1.15 E T <51 6 1 8 1 10 1 12 1 14 1.151 X
BLOCK: C9
3 2
3 1 3 1
22
5°-
67 5
°
1 1
T <5I 6 1 8 1 10 I 12 1 14 1 615 X T1451 6 I 8 1 10 1 12 1 14 1.151
BLOCK : C 10 H
MO 9
th 8 N 7 N 6
2 2
610 9
fh (-11 I 5 a, 4
p- 3 1D z
610 9
e N 7 2 6 1 5 ro 4 p- 3 12 2
X
2
>10 • 9 IP 8
7 N 6 I 5
Eh 4 N 3 X 2
1
71.51 6 1 8 110 1 12 1 14 1 .15 E T <51 6 1 8 1 10 1 12 1 14 1.151 E
BLOCK: D5 T <5) 6 1 B 110 112 1 14 1.15 E 11451 6 1 8 1 10 1 12 1 1416151 X
BLOCK:D6
I 5 10 4 N 3
NOTES: — DIRECTION INTO WHICH WAVES PROPAGATE — IN DEGREES
H— WAVE HEIGHT IN METRES. T — WAVE PERIOD IN SECONDS.
— ONE OCCURRENCE REFERS TO A SIX HOUR MEAN.
APPENDIX FIGURE 21c: Directional Wave Statistics for September
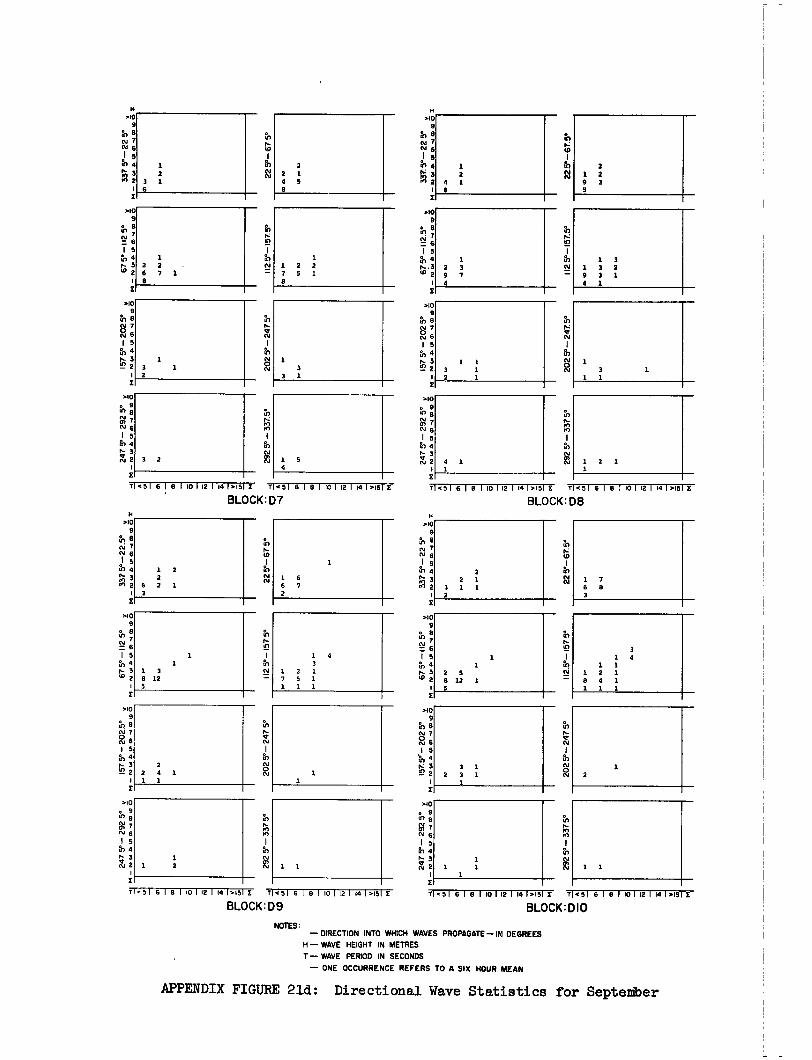
NOTES: — DIRECTION INTO WHICH WAVES PROPAGATE— IN DEGREES
H — WAVE HEIGHT IN METRES
T— WAVE PERIOD IN SECONDS
— ONE OCCURRENCE REFERS TO A SIX HOUR MEAN
APPENDIX FIGURE 21d: Directional Wave Statistics for September
112.5
° -1
57. 5
° 20
2 5°
- 24
7 5°
g3 rr,
T <51 8 1 El I 10I 12 1 14 1.15 E Tl< 5 1 8 I 1 10 1 12 1141.151 £
BLOCK:D7
1 1 2
202
5°- 24
7 5°
7 <51 618 I 701 12 1141,15 E Ti<51 61 8 I 101 121 141,151£
1 12Y
-157
Y
292
5° -
337
5°
26 I 5 5, 4 rs n 2
.10 9
N 7
22
5- 67
5°
9
; I 5 1
5, 4 1 7- 3 1 3 w e 8 12
5
>63 e 9 ul
N 7 6
I 5 in 4
O :
H
9
111 cv
I N 6
A 2
th 4 I.- 3
2 2 4 1 1 1
1 4 3
1 2 1 7 5 1 1 1 1
1 2 2
6 2 1 3
1 8 6 7 2
BLOCK: D9
H MO 9
tn 8 N 7 N 6
In 5 In 4 w, A 2 4
a
1 2 1
2 1 2 9 3
O : V7 N 6 I 5
4
O • 2
71 <5 I 6 I 8 1101 12 I 14 1.15 I <51 6 1 8 r 10 1 12 I 14 1.151 £
BLOCK:08
1 2
40 9
112. 5°-
157
5°
202 5°
- 247 5°
.10 9
ih
0 N 15
Tn 4 ▪ 3 'n 2
3 1 4
1 1 1 2 1 8 4 1 1 1 1
H NO
9 in 8 N 7
I rn
N 6
N 3 2 2
2 2 1
3 1 1 2
1 7 6 8 3
292 5
° - 337 5°
N N 1 5, 8 N
112 5°
-157
. 5°
26 I 5 5, 4 r-
z
H09
in N
21
.10
H09
I 5 rr, 4 1••••3 W 2
1 1 3 1
1 2
4 1
2 3 9 7 4
1I 2 1
1 3 1 3 2 9 3 1 4 3.
>10
o 9 in
N 6 I 5 in 4
1
7 <51 6 I 8 I 10 I 12 1 141.15 E T <51 6 I 8 110112 1 14 1.151 £
BLOCK:DIO
MO 9
117 ;
I 5 4
r- 3 W 2
9 in 8 tv 7
I 5 rr, 4
N 3 e 2
>10
in 093
7 N 6 I 5 N4
H >10
9 in a N C■1 6
o 5 N 4 r-
A 2
1 3 1 2
3 2
1 2 2 6 7 1 8
1 2
3 1 6
292 5
° -
337
5°
1 5 4
1 1 2 2 7 5 1 a
1 3
3 1
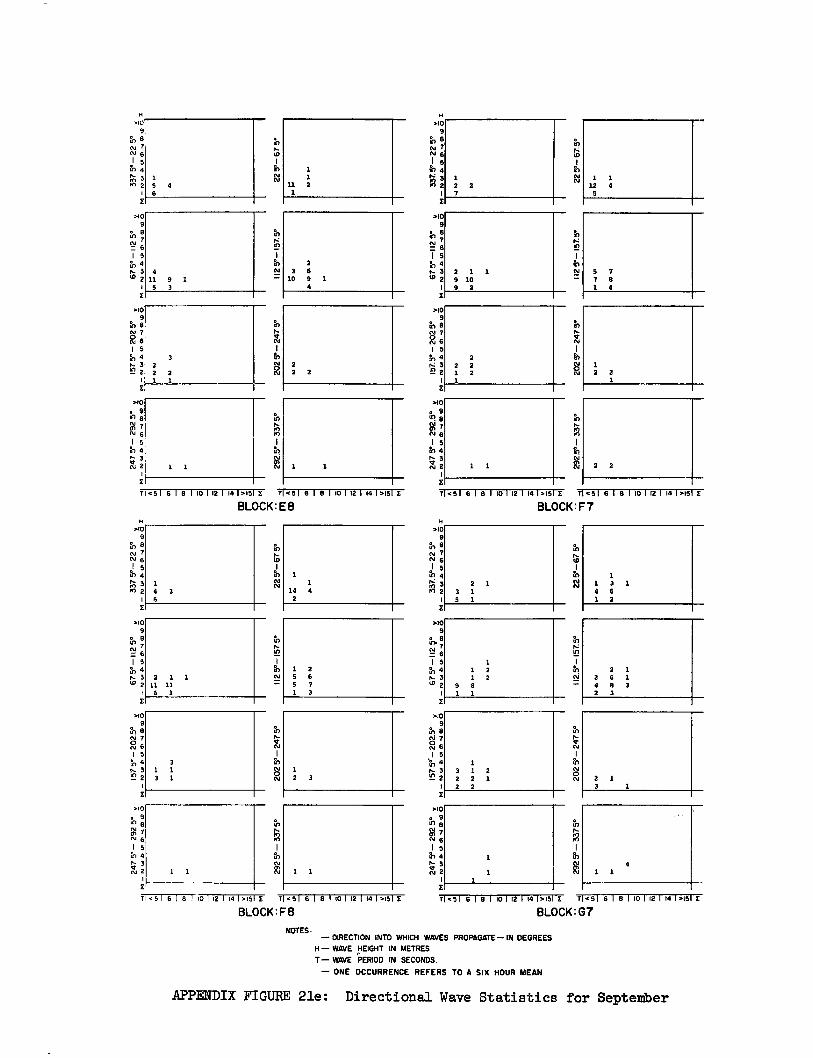
2 2 2
T <51 6 1 8 1 10112 1 141>15 £ T <51 6 1 8 1 10 1 12 1 14 1 >151 £
BLOCK: E8
225°
- 67
5°
112 5°
-15
7. 5°
>10 9
in 8
20
2 5°
- 24
7 5°
N 7 C96 1 5
4 r 3 _2
0.1 6 1 5 th4 'A 3
2
>10 9
tn
N 6
I 5 tr, 4 ✓ 3 432
>10 o 9 In
ON 7 N 6 1 5
al 4 N. 3 N 2
1 5 4 6
1 1
11 2 1
4 11 9 1
5 3
2 3 6
10 9 1 4
1.5161131 101 121 141.15£ 1<516181 101 121 141.151E
BLOCK: F7
2 1 3 1
292
5° - 337
5°
>10 e 9 In
M 1'1 6 1 5
in 4
H >10
9 al 8 N 7 N 6 1 5
111 4 1•■ 3 P2
2409
e tn.
I 5 tn 4 ✓ 3 t0 2
26 I 5
1
>1:
rn 8 151 7
.f'n 4 r- 3 u" 2
In
ID
tn 11
2.5°
-15
7.5°
20
2 5°- 24
7 5°
22
5°- 67
5°
112 5
° -1
57 5°
202
5° -
247
5°
1 1 3 1 4 6 1 2
2 1 2 6 1 4 8 3 2 3
1
1 1
4
: 3
1 1
14 4 2
1 2 5 6 5 7 1 3
1 3 1 2 2 2 1 2 2
2 1 3 1 5 1
1 1 2 1 2
9 8 1 1
APPENDIX FIGURE 21e: Directional Wave Statistics for September
>10 O 9 01 8
617
1 5 4
:
>10 9
1 5 rn 4
3 (0 2
>11:91
e
1 5 tn 4
H >109
tn° 8
N 6 1 5
in 4 s: 3 2 2
2 1 1 9 10 9 2
2 2 2 1 2 1
2 2 7
>8) 9
'en 6.1 7 2 6 1 5 th 4
3 2
10 • 9 In
m 7 rs.1 6 I 5
in 3
N 2
9 8 7 6 5 4 3 2 33
7 5°
-22
5°
.40 9
< 8
,176
1 5
✓ 3 W 2
1 4 3 6
2 1 1 11 11 6 1
3 1 1 3 1
292.
5°-
33 7
5°
202 5°- 24
7 5°
112 5°
-15
7.5°
2
2 5°
- 67
.5°
2 2
2 2 1
1 1 12 4
5
5 7 7 8 1 4
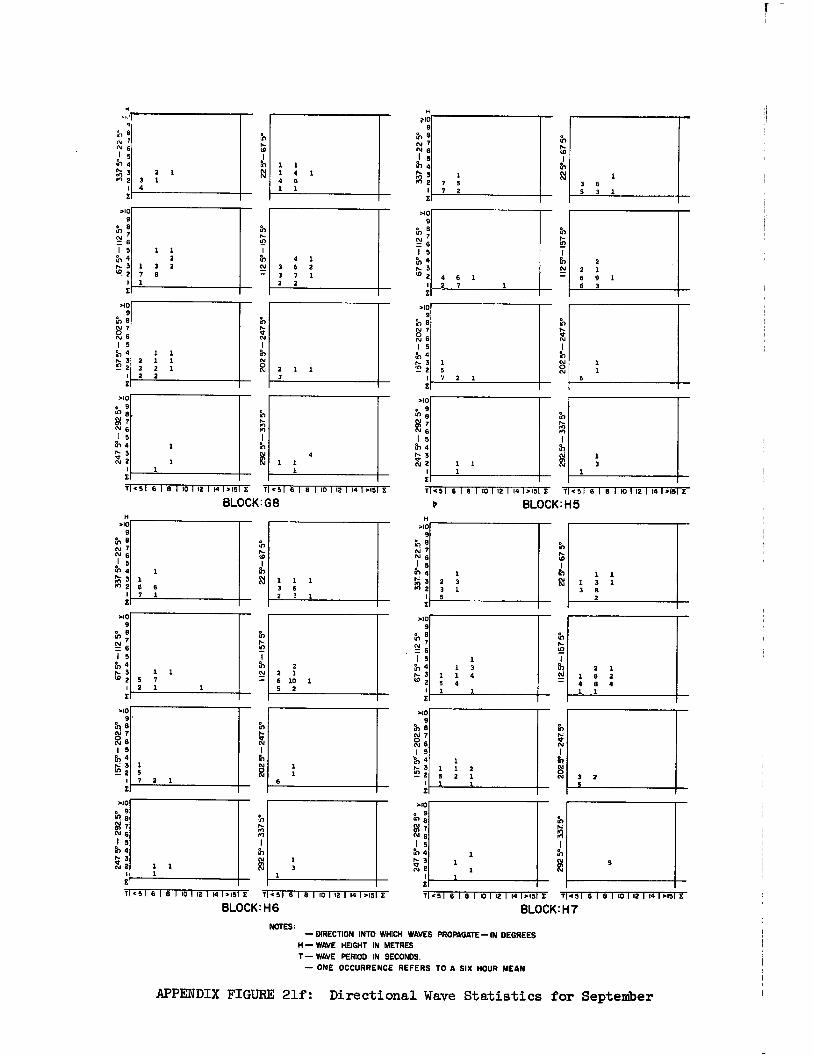
111 4 e- 3
2 1
>10 9
N 57
1 5
M 3 >4 2 1
2 1 3 1 4
4 6 1 2 7
T1451 6 1 8 1 10 1 12 1 14 1.15 E T <51 6 1 8 110 1 12 114 1.151
BLOCK: G8 H
>10 9
N e N 7
>10 9 8
51i76 I 5 ft', 4 1, 3 ‘1) 2
.10 9 e
0 N 7 0.1 1 5 0., 4 t■ 3 N 2
.10 o 9 ul 8g 7 N 6 I 5
N 4 V 3 csi 2
11451 6 1 8 1101 12 1 14 1.15 I T 451 6 I 8 I 10 I 12 I 14 1 >15 I
BLOCK: H6
NOTES:
7 <51 6 1 8 1 10 1 12 1 14 1.15 E 145I6181 10 I 12 I 14 1.161 I
BLOCK: H5 H
.109
° N 7 N
ol 5 In N: 3 2 2
.10 9 ° ;
1 5 4
t- 3 W 2
.10 9 e
0 7 N 6 I 5
4 o- 3 'I' 2
.10 9
NM 7
1 5 11 4
Na
71 4 5 1 6 1 8 I 10 112 I 14 1.15 E 714 51 6 I 8 I 10 I 12 1 141>151 I
BLOCK: H7
— DIRECTION INTO WHICH WAVES PROPAGATE—IN DEGREES H— WAVE HEIGHT IN METRES T— WAVE PERIOD IN SECONDS.
— ONE OCCURRENCE REFERS TO A SIX HOUR MEAN
APPENDIX FIGURE 21f: Directional Wave Statistics for September
22 5- 67
5°
112 Y
-157
5°
1- N 1 N
112. 5
°-1
57
5°
202.
5°- 24
75°
N6 .1 5 111 4
3 In 2
•
: 8 N7 N 6 1 5 474
112
5° -
157 5°
20
2 5°- 24
7 5°
4,
1 7 5 7 2
1 3 6 5 3 1
1 1 1 1 3
1
2 2 1 6 9 1 6 3
1 6 1
rs,
61
112
5°-I5
75°
20
2 5°- 24
7 5°
.10 9
N 137 6
1 5 tn 4 t-3 (6 2
.10 9 e
1 5 tr, 4 I- '2 2
>10 • 9 W
2
7 N 6 I 5 in 4 IN 3
H TIO
9 rn 0.1 7 N
I 5 th 4 t- 3 t0 2
>10 9 8
M 7 N 6 1 5 rr, 4
E
>10 o 9 'O9 S4 CY 6 1 5 -l 4 1- 3
2 1
1 1 6 6 7 1
1 1 5 7 2 1
1 5 7 2 1
1 1
1 2 3 3 1 5
1 1 1 3 1 3 8
2
1 1 3
1 1 4 5 4 1
1 1 1 2 5 2 1 1 1
5
2 1 1 6 2 4 8 4 1 1
2
1
1
1 1 2
1 3 2 7 8 1
1 1 2 1 1 2 2 1 2 2
2 1 1 3
1 1 1 4 1 4 6 1 1
4 1 3 6 2 3 7 1 2 2
1 3
1
1 1
6
1 1 1 3 6 2 3 1
2 2 1 6 10 1 5 2
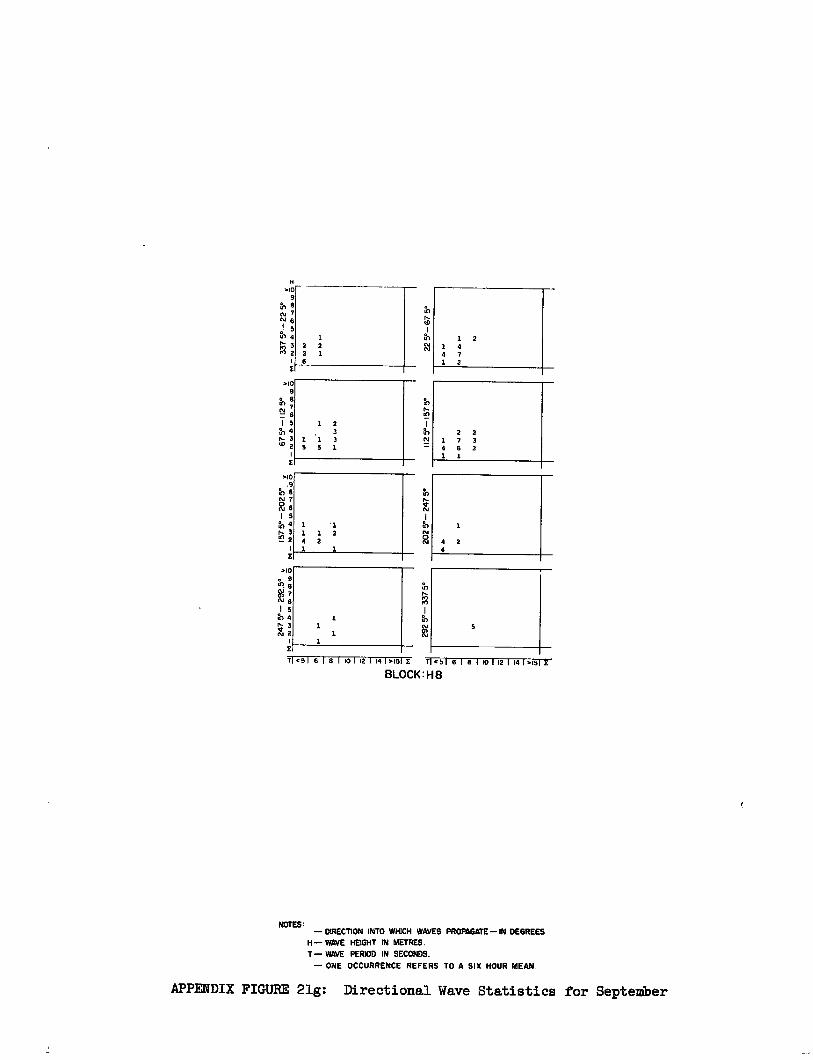
5
1
4 2 4
1 2 1 4 4 7 1 2
2 2 1 7 3 4 6 2 1 1
1 1
1 1
H >10
9
22 5°
- 67 5
° 11
2 5°
-157
5°
20
2 5°
- 2
47 5
°
N cv 7 N , 6 1 5
'.10 9
in 8 Esi; I 5 1 2
fr, 4 3 3 1 1 3 ko 2 5 5 1
'10 .9
*we
F:11 ; I 5
0 1 '1 es. 3 1 1 2 "" 2 4 2
1 1
'.10 o 9 0.8 V 7 cv5 I 5
to 4
71.516181101121141,ME 745I6181101121141..1511
BLOCK: HS
NOTES: — DIRECTION INTO WHICH WAVES PROPAGATE—IN DEGREES
H— WAVE HEIGHT IN METRES. T— WE PERIOD IN SECONDS.
— ONE OCCURRENCE REFERS TO A SIX HOUR MEAN.
APPENDIX FIGURE 21g: Directional Wave Statistics for September
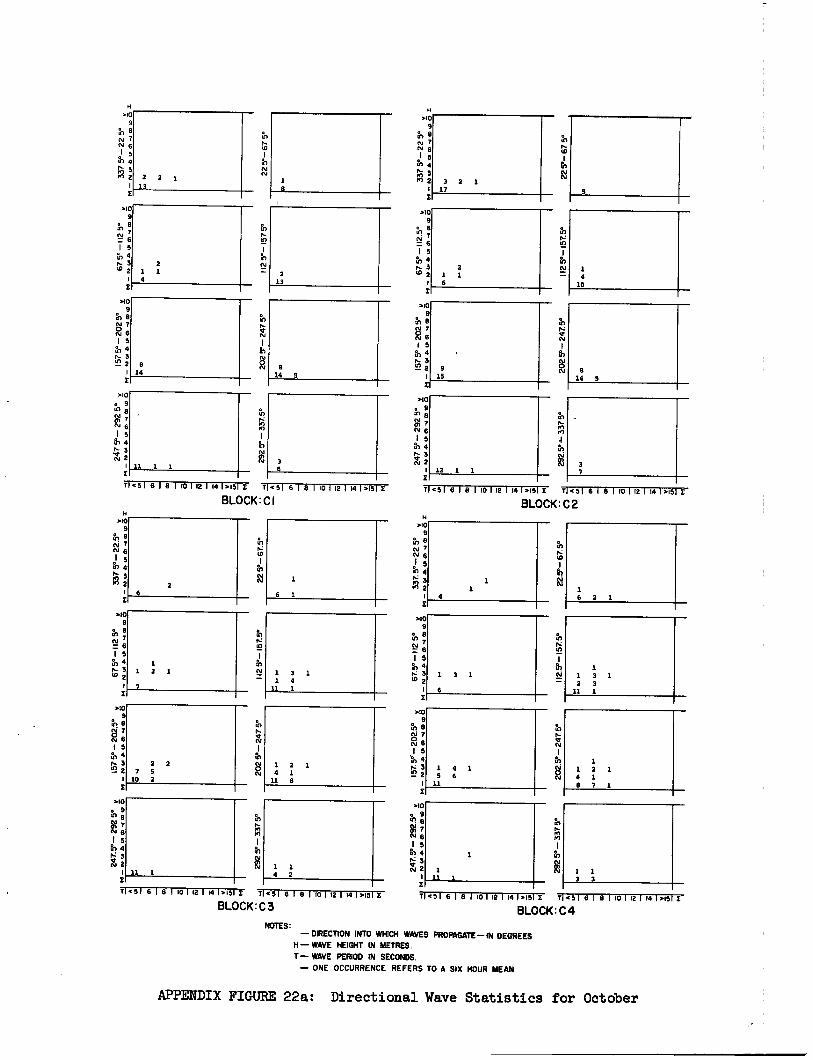
TI 9 5 1 6 1 8 1 10 I- 12 1 14 1.15 E T'.516181101121141'.151 3:
BLOCK: CI
3 2 1 17
8 14 5
>10 9 e
N 7
1 5 en 4
3 12 2
1
202.
5°-
247
5°
ID
ri•c51e1e11011211e 1.15 E r<316181101121141.telE
BLOCK: C2
N
in 5 Lrl 4
M2 rs 3
112 V
-1
57. V
>10 9
▪ 8 7
c=j 6 1 5
fb 4 es 3 ID 2
.10 e 9 (0 a
? N I5
IN 4 1,- 3 X' 2
9 15
5
1 4
10
12 1 1 3 7
1
11 1
1 6 2 1
1 3 1
6
iy
1125
°-157
5°
112.
5 °-1
57 5°
>10 9
0
11)
N
5, AI 6 1 5
'en 4 3
In 2 1
202.
5°- 24
7 5°
0 0 0
H .10
9 N N ? N I50
111 4 re: 3 2 2
.10 9
N • ; 1 5
f'n 4 r• 3 '5 2
.10
M 7 6 15 al 4
cri.■ : 1 I
1 4 1 5 6
11
6 1 4
1 1 3 1 2 3
11 1
4 2
1 1 2 1 4 1 8 7 1
3 3
2 2 13
.40 9
N 87 6
1 5 a, 4
(71 :
el0 9
:I N 1•1 6 1 5
rei 3 en 2
.10 9
,n9 N
1 5 a., 4
3 tn 2
.10 . 08 V7 " 6 1 5 al 4 r- 3 'X 2
2 1 1 4
10
1 2 1
7
2 6
H .10
9 rn 9 N ? N
5 91 4 • 3 M 2
1 I
.10
N N 6
6 5
rn 3
N c
I
.10 9 7e
111 6 I 5 a, 4 rs 3 19 2
.10 9
04: 1 5 a, 4 e. 3 • 2
2 2 7 5
10 2
11 1
In
202
T-2
47
5°
112
5° -
157
5°
14 5
1
13
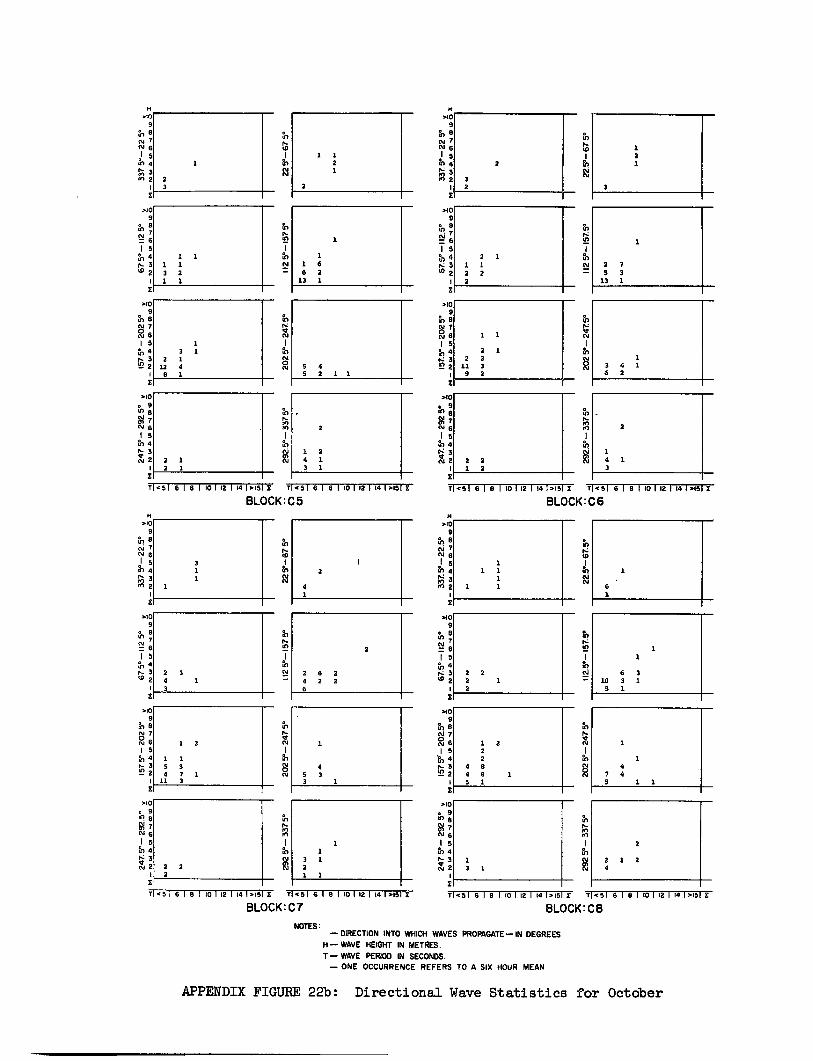
2
1 4 1 3
>10. • 9
7 N 6 1 5 in 4
3 N 2
S 4 5 2 1 1
22
5°- 67 5
°
2
1 2 4 1 3 1
1 1 6 6 2
13 1 I 12
5°-
157
5°
20
2 5°-
247
5°
2 3 2
2 1 2 1
1 1 1 1 3 2 1 1
3 2 1
12 4 8 1
'10 9
N N 7 N 6 1 5 in 4
3 In 2
em0 9
e 8
IS 3_, 4 r- 3 18 2
>10 9
in 6
x
1 5 N 4 r- 3
>10 9
of 6
N 7 6
1 5 GI 4 1, 3
2 1
11
2 5°
-157
5°
202 5°- 247
.5°
>10 9
1 5 4
tZ 3 '8 2
1
>10 9
in
CZ 16 1 5
4 tz 3 8.) 2
1
2 7 5 3
13 1
3 4 1 6 2
2 1 1 1 2 2 2
2 1 2 2
11 3 9 2
2 2 1 2
2
2 6 2 4 2 2 6
1
4 5 3
1 3
1 3 1
24 3
3
1 2
1 1 5 5 4 7 1
11 3
2 2 2
112 5
°- 1
57
5°
20
2 5°- 247
5°
29
2 5°
- 3
37 5°
3
4
1 1
6 3 10 3 1 5 1
1
4 7 4 5 1 1
10
k
2
2 1 2 4
1 12.5
°- 1
57.
5°
20
2 5
°- 2
47 5
0
1 1 1
1 1 1 6
2 2 2 1 2
1 2 2 2
4 8 4 6 1 5 1
1 5 rn 4 r'n 3 WI 2
H >10
9
tr! 8 N 7 N 6
.10 9
N 7 = 6 1 5 • 4 • 3 w 2
.10 9
318 N 7 26 1 5 a., 4 1, 3 02
>10 • 9 0. 01 7 N 6 1 5 in 4
N3
2
H >10
9
N N N 6 .1 5 113 4
2 2 1
.10 9
H V 6
I 5 4
▪ 3 ig 2
>10 9
N 8 7
N 6 1 5
4 r3
V2
.40 e 9 6 01 7 N 6 1 5 fr', 4 1, 3 gi 2
1
T1 <5 1 6 1 8 1 10 1 12 1 14 1.151 I T1.51 6 1 8 1 10 1 12 1 14 1.15
BLOCK: C5 T <51 8 1 8 x10 1 12 114 (>15 I T <5I 6 1 8 1 101 12 1 14 1.151
BLOCK: C6
Ti<5 16181 101 121 141.15II 71.516181 101 121 141.151E
BLOCK:C7
NOTES:
7 <51 6 1 8 1101 12 1 14I>15 I T <51 6 1 6 1 101 12 1 14 1.151 E
BLOCK: C8
— DIRECTION INTO WHICH WAVES PROPAGATE—IN DEGREES
H— WAVE HEIGHT IN METRES.
T— WAVE PERIOD IN SECONDS. — ONE OCCURRENCE REFERS TO A SIX HOUR MEAN
APPENDIX FIGURE 22b: Directional Wave Statistics for October
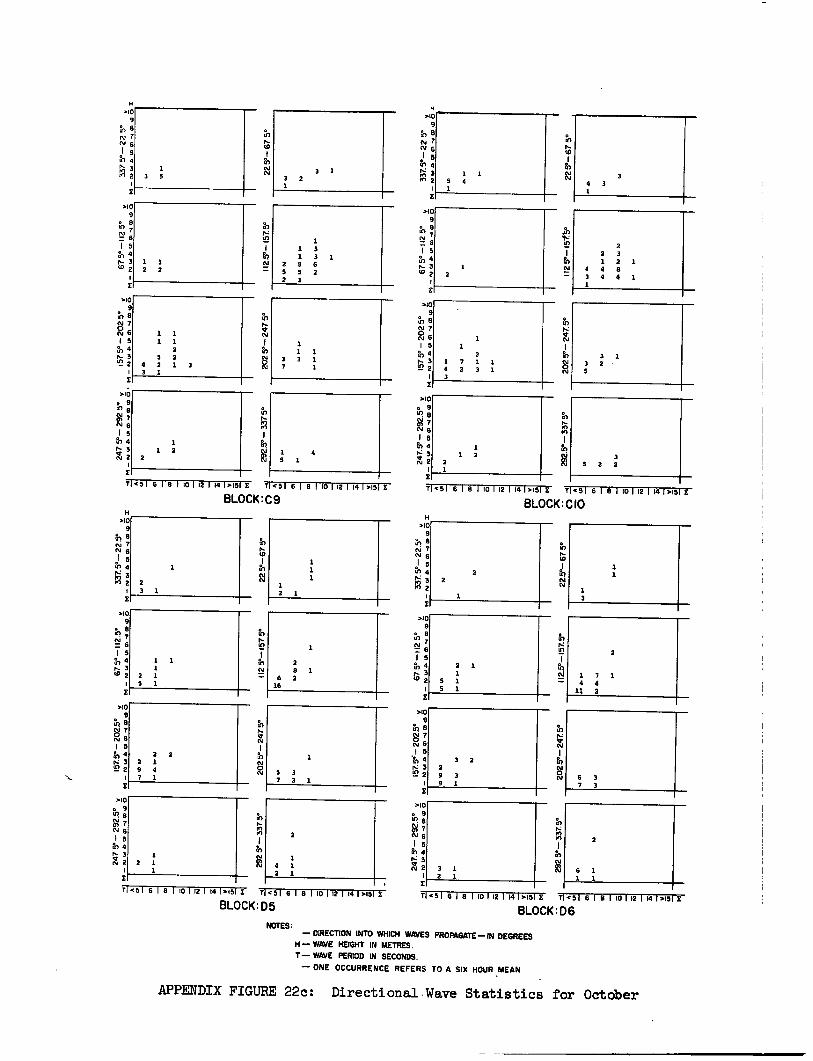
3 5 2 2
2 3 1
NOTES: — DIRECTION INTO WHICH WAVES PROPAGATE—IN DEGREES
H— WAVE HEIGHT IN METRES.
T— WAVE PERIOD IN SECONDS.
— ONE OCCURRENCE REFERS TO A SIX HOUR MEAN
3 1
APPENDIX FIGURE 22c: Dire cti onal Wave Statistics for October
N N 6 1 5
MO 9 8
;
1 5 tr, 4 N3 w 2
MO 9
to
(0J 76 1 5
50 4
g 7 NI 6 1 5
tO 4
:
X
T11.5 I 6 1 8 1 10 1 N 1 14 1.15 X T <51 6 1 8 1101 12 1 141>15l Z
BLOCK: C9
tO 4 1:-.1 3 rn 2
>10 o 9 'n6
Ti<516181101121141.15 X T<5-1 8181101121141.151E
BLOCK : D5 11.51 6181101121141>15 I 1.516181101121141>15
BLOCK: D6
rn
112.
5* - 15
7.5*
20
2 5°
- 24
7 5°
0
P
N 1 2
N N 6
8 0 4 N 3 2z
Is
N3 W 2
NI 7 ic.1 6 1 5 rn N 3 '2 2
H MO
9 u,8
>10 • 9 41 a Si 7 N 6 I 5 in 4
: rs*,. 3 N 2
>10 9
>10
El
21 rko I 6 1 6 1 10 112 I 14 1,15 T <51 6 1 6 110 1 12 I 14 >151 2
BLOCK: CIO
in
In pN
2 2 3 1 2 1
4 4 8 3 4 4 1 1
3 2 5
1 1 5 4 1
3 4 3 1
1 2
1 7 1 1 0 2 3 1 3
1 2 a 1
MO 9
rn (aI ;
1 5 4
A 3 W 2
2 2
1
2
1 7 1 4 4
11 2
0
2
6 1
6 3 7 3
0
N N
1 1
1 3
3 1 2 1
2 1 1
5 1 5 1
3 2 2 9 3 9 1
H MO
9
8 N 7 N 6
j 5 in 4
rn3 2
H >10
9 to N 7 CV j 5
4
;
El
>10 9
'in 8 ;
I 5 a, 4 A
>10 9
in N 0 m6 15
522
>10 o 9
e 7
1 5 Pn 4 I., 3 X 2
10
In
.10
5N 7 2 6 I 5 th 4 N 3 '2 2
1
9 '81
N6 I 5
en 4 N 5 N 2
1
1 1 1
2 1 5 1
1
2 2 2 1 9 4 7 1
1 2 1
1
t 3 5 1
3 2 1
1 1 2 2
1 1 3 1 3 1
2 5 6 5 5 2 2 1
1 1 1 1
2 5 2
4 2 1 3 3 1
1 1 3 3 1 7 1
1 1 2
2 1 4 5 1
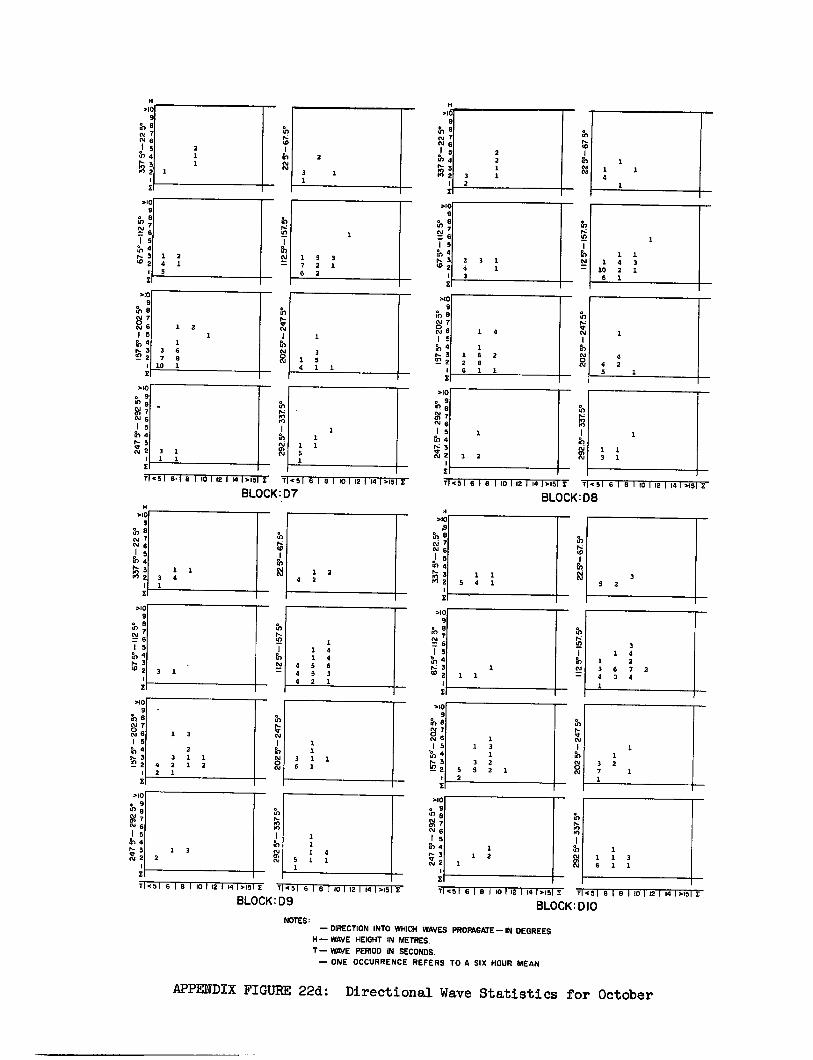
>10 9 e
cst ? 6
1 5 11.., 4
5 in 2 2
02
V- 24
7 5°
20
2 5°
- 247
5°
112 5
°-1 5
7 V'
112
5°-1
575°
29
2 V
- 337
5°
292 5°
- 33
75°
1 1
5 4 1 3
5 2
Yi
H >10
tel • ? NI 6 1 5 th 4 fI3
1
1 2 4 2
>10 9
to 57 6
5 'a, 4 rs: 3 W 2
>10 o 9 Eno
Mil Nu 6 1 5
4 3 2
1 1
3 1 1 6 1
1 1 3
1 3 2
5 5 2 1 2
1 1
3 2 7 1 1
1 1 4 1 4
4 5 6 4 5 3 4 2 1
1 1 1
3 1 4
1 3 6 7 2 4 3 4
1 1 1 4
5 1 1 2
1 1 2
1
1 3. 1 3 6 1 1
Tl<5 1 6.1 8 1 10 I 12 I A 1.15 Y T <51 6 1 8 1 10 1 12 1 14 1 >151
BLOCK :D7
1
1 4
10 2 1
1 3 1
1
4 4 2 5 1
1 1 3 1
1
5161 91 101 121 141.151I 11<516181101 121 141.152 1 4
BLOCK: D8
292.
5°-
337
.5°
202
5- 2
47 5
° 11
25°-
157
.5°
>10 9
'en 87
IS N 4 ID 3 ID 2
1
.109
N 8 cV 7 (9 6 1 5 rn 4
N 3
42 2
>10 o 9 11/
M CV 6 1 5 In 4 r- 3
2
H
>10 9
e! 8 4
Fr) 8 Cu 7 Csl 6
wAi 3 1.1 2
2 1 1
1 2 4 1 5
1 2
1 3 6 7 8
10 1
3 1
1 4
1 1 6 2 2 8 6 1 1
112
5°-1
57.5
°
>10
I S 4
ts 3 2
>10 9
in 8
O 7 cs., 6 1 2
4
i23 2
>10 o 9 0. 8 Pi 7 N 6 1 5 274 1:3; 3 N 2
1
:11
N
2
2
3 2
2 3 1 4 1 3
H
10
In
iy
51
1
3 1 5 4 1 1
2
1 5 3 7 2 1 6 2
H >I0
9 Fele N (s.1 6
eI5
4 5
2 2
>10 9
rr, 7 1 5 fn 4
5 W 2
1
>10 9 8
0.1 7 6
1 5 4 3 2
>10 e 9
e
M 7 N6 I 5 in 4
sc:3 ▪ 3
1 1 3 4 1
3 1
1 3
2 3 1 1.
4 2 1 2 2 1
1 3 2
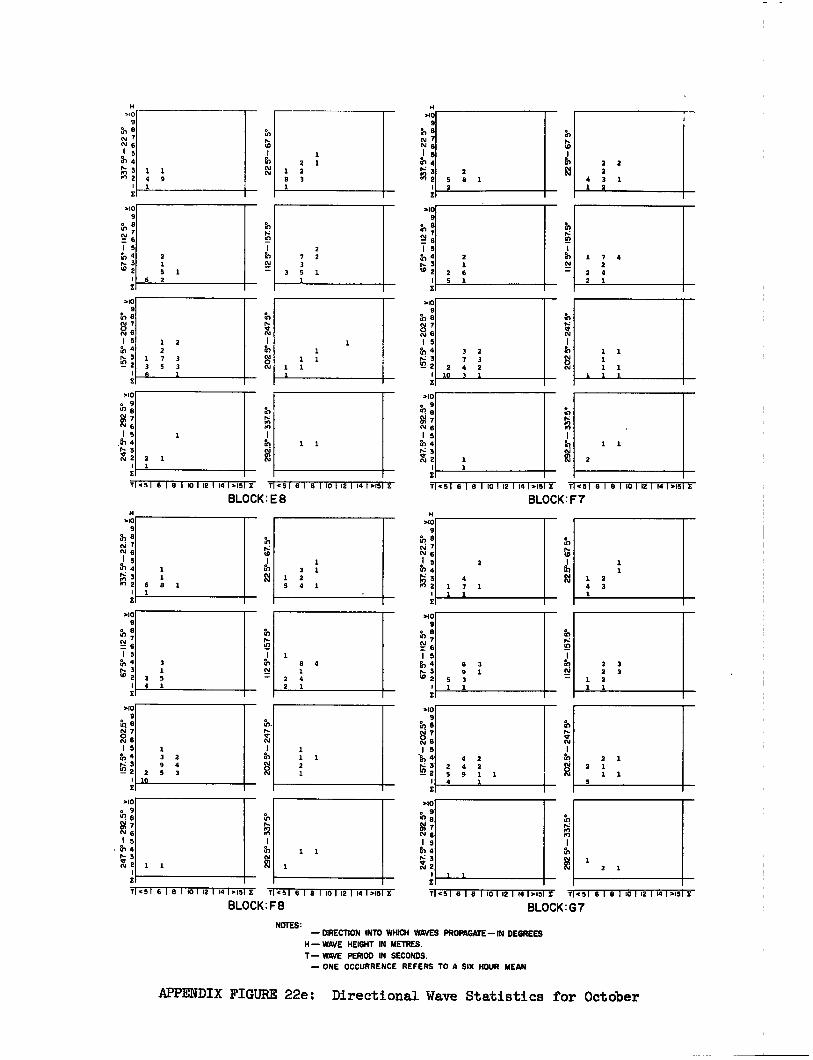
>10 9
8 ,1J
I 5 tr, 4 r- 3 W 2
010 9
toe
0 N7
me
15 .64 N3 o 2
6
2 1 5 2
1 3
22 73
5 1 1
1 3 B
1 2 7 5
2
3 3 1
1 1 1
1125°
-1575°
202 5°- 24
7 5°
H >10
22
5°- 67
5° 9
tn N 7 N 6
1 1 4 9 1
202 5°-
24
7.5°
H >10
9 8
N 7 N6
I 5 N 4
23
>10 9
IJ 7 = 6 I 5 N 4 N 3 W2
6,
to
Ri
112.
5°-
1 57.
5°
>10 • 9
a V7 N 6 I 5
rn 4
2 5 8 1 2
2 1
2 6 5 1
2
1 1 1 1 1
1 1 1
2 2 2
4 3 1 1 2
1 7 4 2
2 4 2 1
>10 o 9 0 6
7 N 6 I 5
fn 4
;7;
1 1
1 2 8 3 1
2 1 3
2
4 1 7 1 1 1
4
2 4 2 1
Rb R1
112
5° -
15 7
5°
H >10
9 in cv 7 N 6 is 0 4 N 3
2
>10 9
tn CY. 6
I 5 th 4
3 ° 2
In N
T <51 6 I 8 I 10 I 12 I 10 1.15 X T <51 6 I 8 1 101 12 I 14 1.151
BLOCK: F8 T145161111 101 121 141.15X 8 8 110 1 12 1 14 1.151 E1 151z
BLOCK: G7
NOTES: — DIRECTION INTO WHICH WAVES PROPAGATE—IN DEGREES
H — WAVE HEIGHT IN METRES.
T— WAVE PERIOD IN SECONDS. — ONE OCCURRENCE REFERS TO A SIX HOUR MEAN
H >10
9
N 8 N7 MI 6
1 5 0 4
3 2
4 2 2 4 2 5 9 1 1 4
20
2 5°- 247 p°
>10 9
ti/ N7
6 15
4 N 3 4/ 2 2
02.x- 24
7 5°
1 1 1 2 1
2 1 2 1
1 1 5
Si 7 cs, 6 I5 th N 5 N
▪
2
>10 o 9 '
N 6 I 5
rn 4 N st& 2
>10 9
:I 8 ;
I 5 4 3
w
1 1
6 8 1 1
1 3 1
1 2 5 4 1
1 1
1 2 4 3 1
3 1
3 5 4 1
6 3 9 1
5 3 1 1
2 3 2 3
1 2 1 1
2 1
TI45 I 6 I 8 I 10 I 12 I 14 1.15 X TI 4 5I 8 I 8 1101 12 1 14 1.151
BLOCK: E 8 TI<5 I 6 I S 1101 12 1 141.15 E T <51 6 I 8110112114100013:
BLOCK: F7
APPENDIX FIGURE 22e: Directional Wave Statistics for October
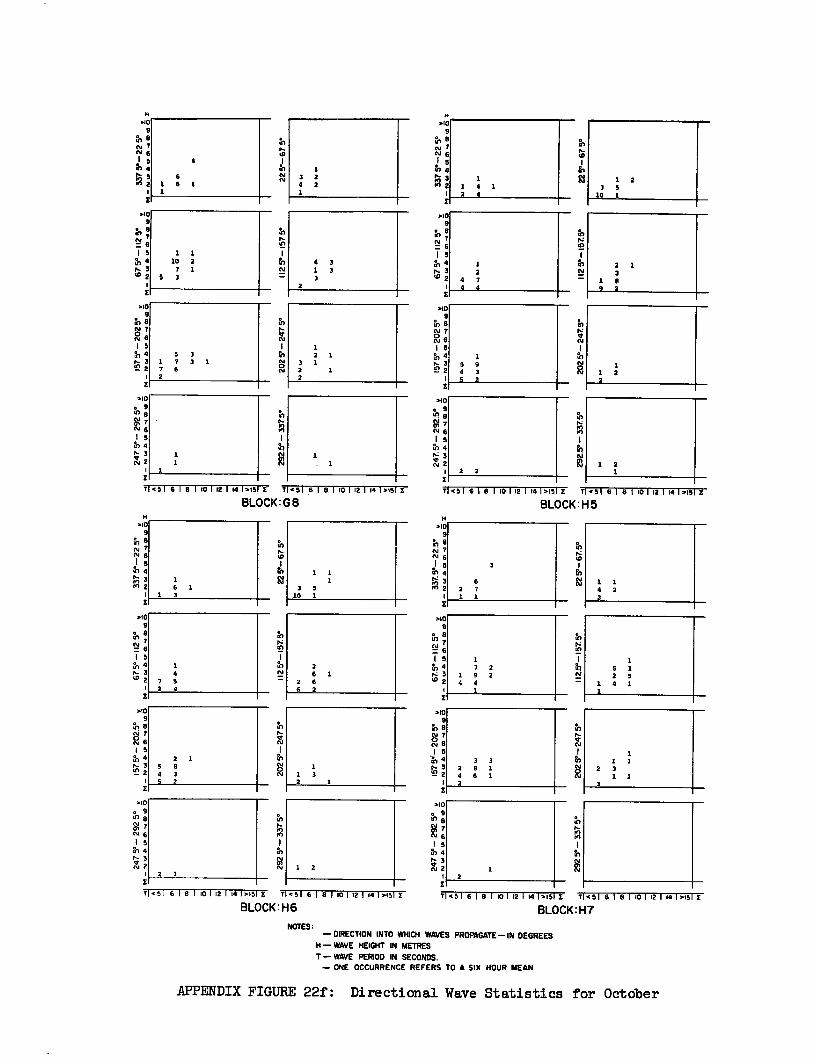
N
A
th
202
5°- 247 5°
11
2 5
°- 1
57
5°
225°
- 67
5°
1 2 1
3 1 2 1 2
1 3 2 4 2 1
4 3 1 3 3
2
H
9 to N 7 I 5 dl 4
3 en 2
4
6 1 6 1 1
6.10 9
?„,
(I' 1 5
4 D. 3 'D 2
.109
rn a
5 11, 4 5 3
1 7 3 1 .r;-3 : 7 6
2
1 1 10 2
7 1 5 3
240 9
I 5 N 4
3 W 2 11
2 5 °
-15
7.5°
.10 • 9 4? SI
5 I 5
In 5
A 2 1
1 2 3 5
10
1 1 2 2
2 2 1 2
1 2
4 7 4 4
2 1 3
1 8 9 3
292 5°
- 3
375°
71.51 8 I 8 1 10 1 12 I 14 1.i5 E T <51 6 1 8 I 10 I 12 1 14 1 6.151 I
225°- 67
5°
112
5°- 15
7.5°
2
025°- 247
5°
• 9 in 8
Mi 6 I 5
C1 4 D. 3 it 2
H
9 N 8 N 7
1 5 65 4 D.3
2
MO 9
; I 5 g, 4
C15
2 1 1 2
1 6 1
1 3 3
10 1
1 4
7 2 4
2 6 1
2 6 6 2
2 3 1 2
3
3
6 2 7 1 1
112.
5°- 15
7. 5°
202
5°- 24
7 5°
fN
Pr)
6.10 9
N 8 ;
15
,n 4
.10 9
rn EN 7
e 1
a„ 4 1, 3 E) 2
H .10
9
I 5
to N (6 5
N 4 Dz 3 2 2
1 7 2
1 9 2 4 4
1
3 3 2 8 1 4 6 1 2
1 1 4 2 2
2
4,
N
.10 • 9 65 8
I S in 4
3 X 2
T <5 I 6 1 8 I 10 I 12 1 14 1.15 Z T <51 6 1 9 I 10 I 12 I 14 1.15
BLOCK : G 8 T <5 1 6 1 8 I 10 1 12 I 14 1.15 E T <51 6 I 9 I 10 1 12 I 14 1.151 X
BLOCK : H 5
1
1 1
BLOCK: H6
.10 • 9 65 8 N7 5.1 1 5
th 4
: 1
7451 6181101121141,15 E T<51 6181101121141.151/
BLOCK: H7
NOTES: — DIRECTION INTO WHICH WAVES PROPAGATE—IN DEGREES
H — WAVE HEIGHT IN METRES T WAVE PERIOD IN SECONDS.
— ONE OCCURRENCE REFERS TO A SIX HOUR MEAN
APPENDIX FIGURE 22f: Directional Wave Statistics for October
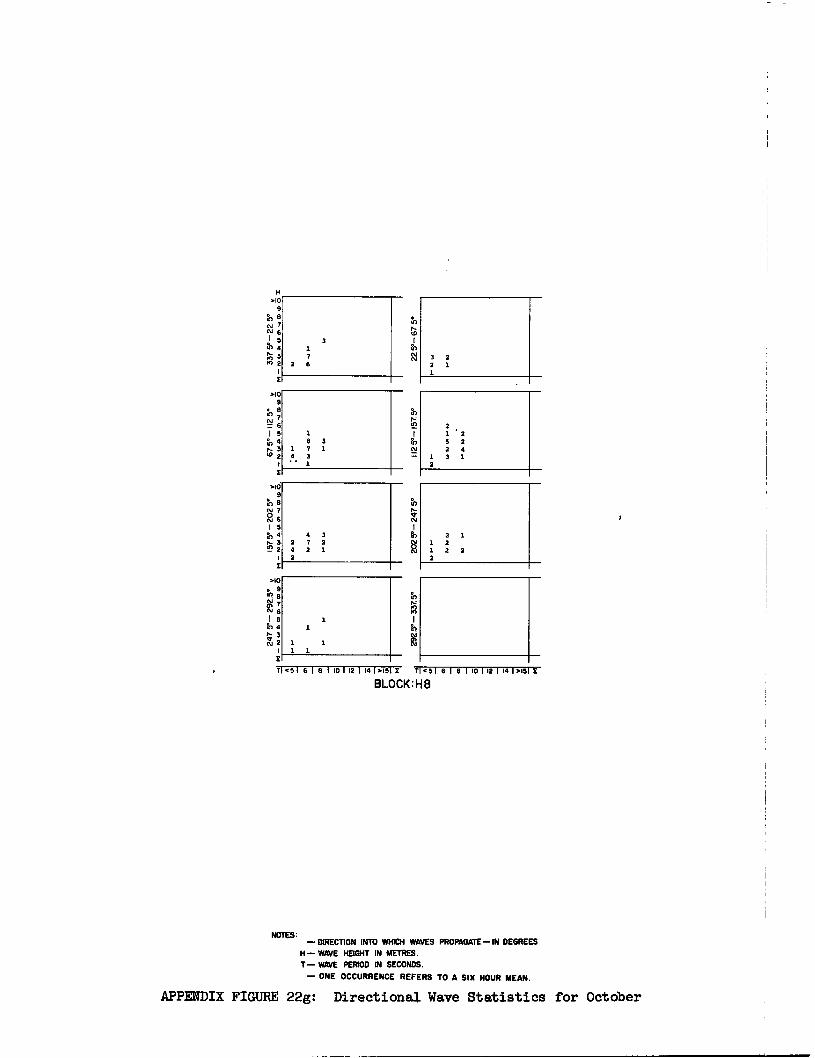
>10 9
N 8
;
I 5 rn 4 r. 3
2
>10 9
to N 0 N 6 I 5
1.0 4
II .10
9 to 8 cv 7 04 6
4,
tO I 5
11)4 1 3
4 7 3 .0 2 2 6 2
1
2 1
1 8 3
1 7 1 4 3
1
112
5° —
157.
5°
?. 2 5 2 2 4 3 1
4 3 2 7 2 4 2 1 2
20250
_247
5e
2 1 1 2 1 2 2 2
1 1 1 1
P
an
.10 e 9
OM 7 CM 6 1 5 to 4 14- 3 N 2
110 101 12 I 141e.15 I T 45I WI 1 114 141.15IE
BLOCK:HS
NOTES: — DIRECTION INTO WHICH WAVES PROPAGATE—IN DEGREES
H— WAVE HEIGHT IN METRES. T— WAVE PERIOD IN SECONDS.
— ONE OCCURRENCE REFERS TO A SIX HOUR MEAN.
APPENDIX FIGURE 22g: Directional Wave Statistics for October
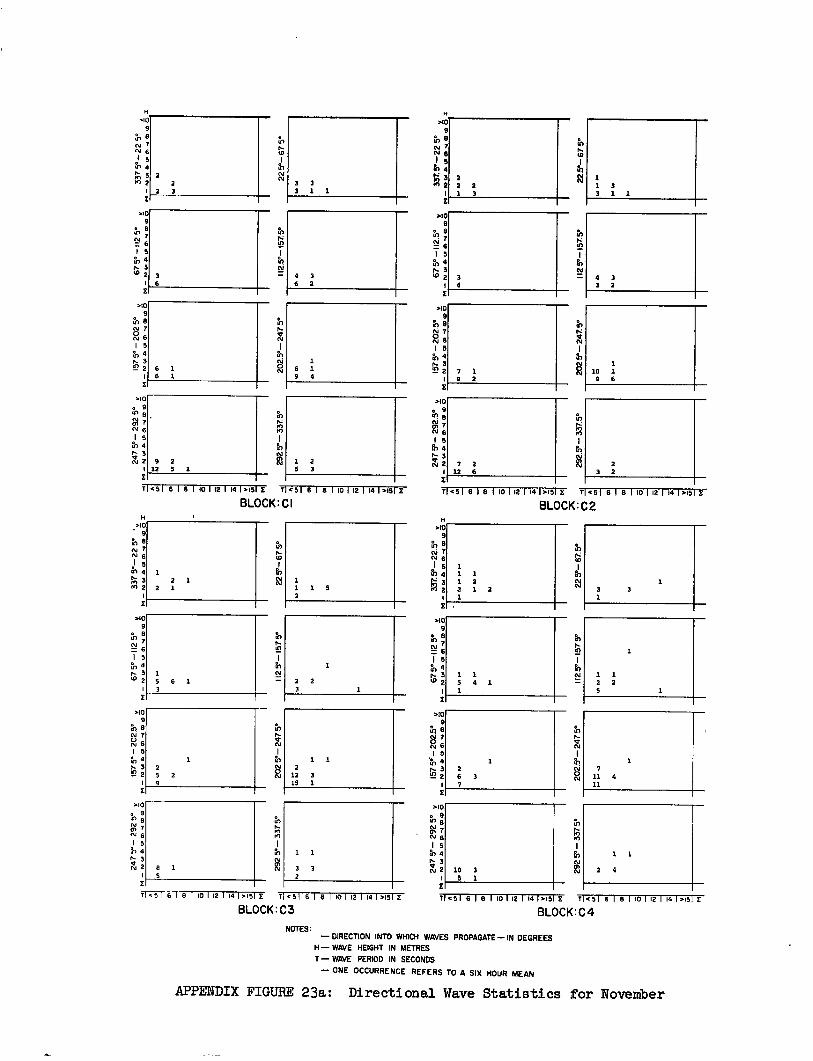
2 3 2
9 2 12 5 1
H H
+10 9
to N N 6 1 5
3,4 >11..- 1,1 2
H
2
2 2 3
N
U1
3 3
3 1 1
.10 9 B
N 7 N 6 I 5 to 4 f•Z 3 2 2
2 2 1
2 3
113
1 1 3
3 1 1
74616161161121631.16z 1,616161631121631>I6rz
BLOCK: CI
7 <51 6 1 8 1 10 1 12 1 14 1>15 E T .51 6 1 8 1 10 1 12 1 14 1 >151 E
BLOCK:C2
>10 9
N N
510 9
N. N
N 6 N 6 1 5 5 1
111 4 1 Pn Ln 4 1 1 r- 3 2 1 9.: 3 1 2 102 2 1
1 5 22 2 1 2
1
>10 >10 9 9
• 8
V. 76 511 6
1 5 1 5 fr) 4 4 r■ 3 r- 3 1 1 up 2 15 6 1 2 2 3 2 5 4 1
1
>10 >105 9
;he N 7 6, 7 RI 6 (C1 6 1 5 1 5 3, 4 1
" 4 1
1`3 u) 2
25 2 12
2 3 ti5 :
2 6 3
9 15 1 7
>10 >10 • 9 in 8
N 7 V 7 1,1 6 N 6
1 5 1 5 N 4 1 1 fl) 4
'774 32 13 1 3 3 V r- 3 N 2 10 3 5
2 5 1
7F-5-1- 67 8 1 10 1 12 1 14 1.15 755 1 6 1 8 1 10 1 12 1 14 1 9151 E <51 6 1 8 1 10 1 12 1 14 1 >15 E
BLOCK: C3
NOTES: —DIRECTION INTO WHICH WAVES PROPAGATE—IN DEGREES
H— WAVE HEIGHT IN METRES
T— WAVE PERIOD IN SECONDS
— ONE OCCURRENCE REFERS TO A SIX HOUR MEAN
APPENDIX FIGURE 23a: Directional Wave Statistics for November
112 5
° - 1
57 5°
112.5
° -
157
5°
202
5°- 24
7 5°
202.
5°- 247
5°
292
5 °- 33
75°
292
5°-
337 5°
7 <51 6 1 8 1 10 1 12 1 14 1 >15. X
BLOCK: C 4
>10 9
1 5 fr., 4 r- 3 W 2
•
>10 9 B
V 0 N 7
N N 6 1 15
tO fe, 4
6 1 N N 6 1 1 ;1 - 1 23 7 1
6 1 9 4 9 2
>10
111 V 7 N 6 I5 tn 4 r- 3 • 2
>10 9
to 8 N 7
1 5 N 4 r- 3 E 2 20
2 5°- 24
7.5°
1125
° -
157.
5°
1 5 fb 4 r- 3 tp 2 11
2 5°
-15
7.5°
29
2.5°
- 33
75°
"0 9
• 8 ,
N
>10 • 9 in 8
N 7 6
1 5 to 4 1.- 3 N 2
4 3 3 2
1 10 1 9 6
1 2 5 3
3 6
4 3 6 2
3 4
7 2 12 6
3 3 1
1
1 1 2 2 5
1 7
11 4 11
2 4
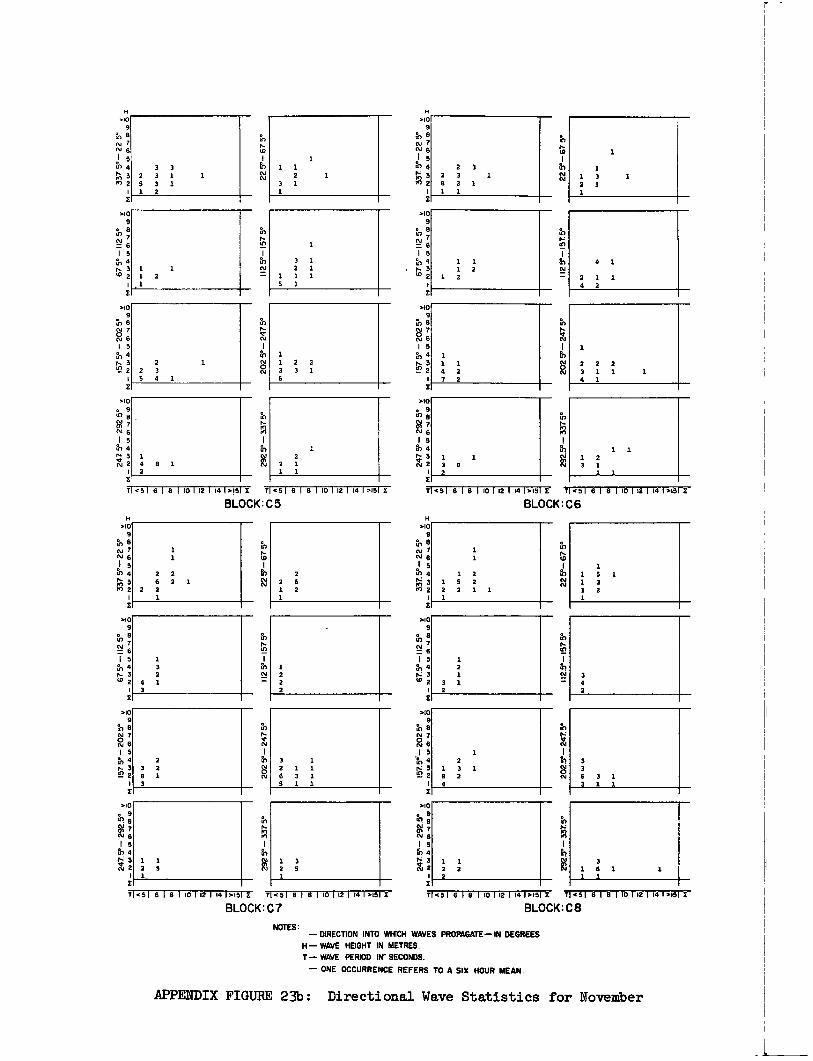
1 2 23 5 4 1
7 .51 6 1 8 1 10 1 12 1 14 1.15 E T .3 1 6 1 8 1 10 1 12 1 14 1.151 Z BLOCK: C5
22 5°-
67
5°
112 5
° -1
5 7 5
° 20
2 5°
- 247
5°
en
.10 9 rn 8 N 7 N 6 1 5 in 4 rti3 In 2
£ >10 9
I 5 ar, 4 re 3 w 2
>10 o 9 to 8 N 7 N6 I 5 in 4 re5 X 2
>10 9 fn 8 N 7 2 6 1 5 N 4 re. 3 ▪ 2
33 2 3 1 1 3 1 1 2 1 1 2 1 3 1 1
31 2 1 1 1 1
1 12 2 3 3 1 6
1 4 8 1 2 1 2 71 1 1
112
5° -
157 5°
T.51 6 1 8 1 101 121 141.151E T.516181 101 121 141.151E BLOCK: C7
>10 9 .
•
13 ; 1 5 N 4 • 3 W 2
202
5°-
24
7 5°
910 9
CCX N6
2
1 5 rr, 4 re, 3 11
>109
0 N7 Ne 15
1 3 2 4 1 3
1 2 2 2
22 6 2 1 2 2 1
H 910
9 rr, 8 N 7 N 6 1 5 in 4 3 In 2
£1
2 26 1 2 1
2 32 8 1 3 3 1 21 1 6 3 1 5 1 1
11 2 3 1 1 3 2 1
>10 9 N 8 N 76 1 5 in 4
>10 9 isr,8 N 7 6 1 5 an te• 4 3 8/2
910
el 5 .4
9
e N 7 N 6
3 E
20
2 5°
- 24
7 5°
22 5°
- 6
7 5°
11
2 5°-
157
Y
910 e 9 8 1 5 In 4
841 N 6
1 11 4 2 7 2
2 2 3 1 6 2 1 1 1
1 22 2 3 1 1 1 4 1
1.
1 13 1 2 1 1
4 1 21 1 4 2
>10 o 9 0. 9 g 7
6 2
1 5 1
Fn 4 Pn
f43 /4 2 1 1 2 2 2
T1.5 1 6 1 8 1 10 1 12 1 14 1.15 E T 451 6 1 8 1 10 1 12 1 14 1.151 E BLOCK:CS
to N
Pn pN
112.
5° -
157
5°
>10 9 4'1 8 N 7 2 6 15 To 4 N 3 2
H 910
9
e Ni
fr. ) 4
N 6 1 5 2 2
910 9 N 8 N 76 I 5 th 4 3 87 2
3 16 1 1 1
1 2 1 3 1 2 4 63 1 3 1 1
1 1 12 1 5 2 2 2 1 1 1
1 1 5 1 1 3 1 2 1
1 2 1 4
2
T.5161131 101 121 14 1.18 2: 1.516181 101 121 141.151E BLOCK C6
NOTES: — DIRECTION INTO WHICH WAVES PROPAGATE—IN DEGREES
H — WAVE HEIGHT IN METRES. T— WAVE PERIOD IN' SECONDS.
— ONE OCCURRENCE REFERS TO A SIX HOUR MEAN.
APPENDIX FIGURE 23b: Directional Wave Statistics for November
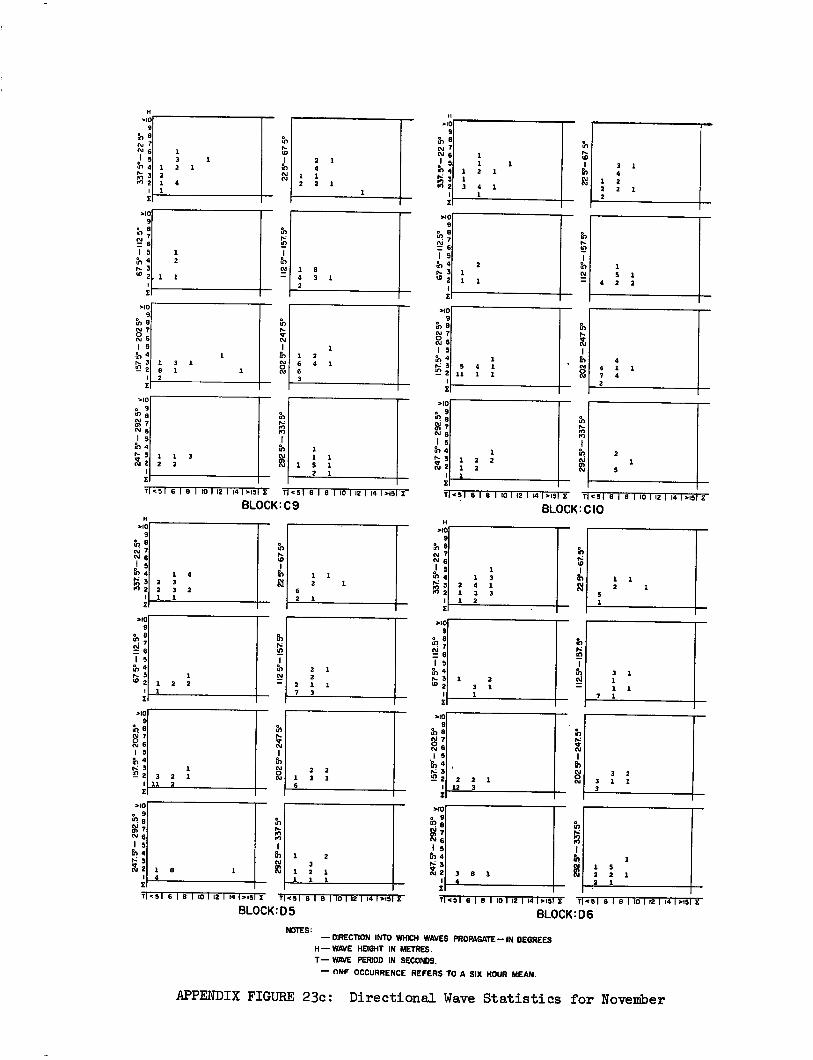
292
5°- 33
75°
71..5 I 6 1 8 1 10 1 12 1 14 1815 E T
>10 9
en N 7 N 6
rn
ID 2 1 I 5 3 1 4 'rn 4 2 1 4
1 1 N 3 1 2 2 2 1 M 2 3 4 1 2 2 1
1 1 1 2
>10 9
8 ;
1 5 4 2 1
1 8 n- 3 1 5 1 4 3 1 2 1 1 4 2 2 2
>40 9
of El N 7 0 N 8
1 I 5 1 2 6 4 6
1 er, 4
1?-; 5 11
4 1
1 1 1
4 7
4 1 1 4
3 1 2
tD
1125
°-1
575°
20
2 - 24
7 5°
112
5 °-
157.
5°
202 5°- 24
7 5°
>10 o 9 41 5 M 7 N 2 1 5
1 h 1 2 1 1 3 1 2 2 N 1
1 5 1 gi 2 1 2 2 1 1
<51 13 1 8 1 10 1 12 I 14 1.151 I Tl<518181101121141.15 E 1<518181101121141.151E
H +i0
9 B
(s, N 6 I 5
en 4
In 3 ro 2
1 2 1 1
1 3 2
4
1 1
1 3 1 8 1 2
1
1 1 3 2 2
2
>10 9
N
1 5 rr, 4 N. 3 48 2
810 9
of e (01 7 NI 6 I 5 th 4 1- 3
2
>10 e 9 Lc) 8
M 7 ni 6
r- 3 NI 2
H
>10 9 B
N 7 N 1 5 1
1 1 an 4 1 3 rn 1 1 2
2 2 2 1
4 3
1 3 5
2 1
1 1 2 1
112.5
° -
157.
5°
202 5°
- 247
H >10
9
tr! 8 N 7 N 6 o! 5
4 • 3 n 2
>10 9
I}, 8
;
1 5 ▪ 4 r- 3 W 2
>10 9
N 7
I 5 ▪ 4 ▪ 3 422
>10 o 9
e ONE 7 N6 I 5 ho
X' 2
112 5
° -1
57.
5°
202 5°
-24
7S°
1 3 2 1
11 2
1 4 2 3 2 3 2 1 1
1 1 3 2 1
1 13 1
810 9
0.1 o 8
7 .c\-1 6 1 5
er, 4 n• 3
2 1
.10 9
N
iCZ ; I 5
'en 4 N 3
>10 e 9 ▪ e
IS Po Ii 3 N 2
1
12 3
1 2 1 1 1 1
2 1 2
2 1 1 7 3
2 2 1 3 1 6
6 2
12 3 1 3 1 1 1 1
7 1
2 2 1 12 3
3 " 4
3 2 3 1 1 3
1 9 2 2 1 2 1
BLOCK: C9
BLOCK: CIO
71.c 5 I 6 I 8 I 10 1 12 I 14 1.15 E T <51 8 1 8 1 10 I 12 1 14 1.151 E
BLOCK: D5 T <51 8 1 13 1 10 I 12 I 14 1.15 E 7 <51 8 I 8 110 1 12 I 14 I >151 2
BLOCK: D6
NOTES: — DIRECTION INTO WHICH WAVES PROPAGATE—IN DEGREES
H — WAVE HEIGHT IN METRES.
T — WAVE PERIOD IN SECONDS.
— new OCCURRENCE REFERS TO A SIX HOUR MEAN.
APPENDIX FIGURE 23c: Directional Wave Statistics for November
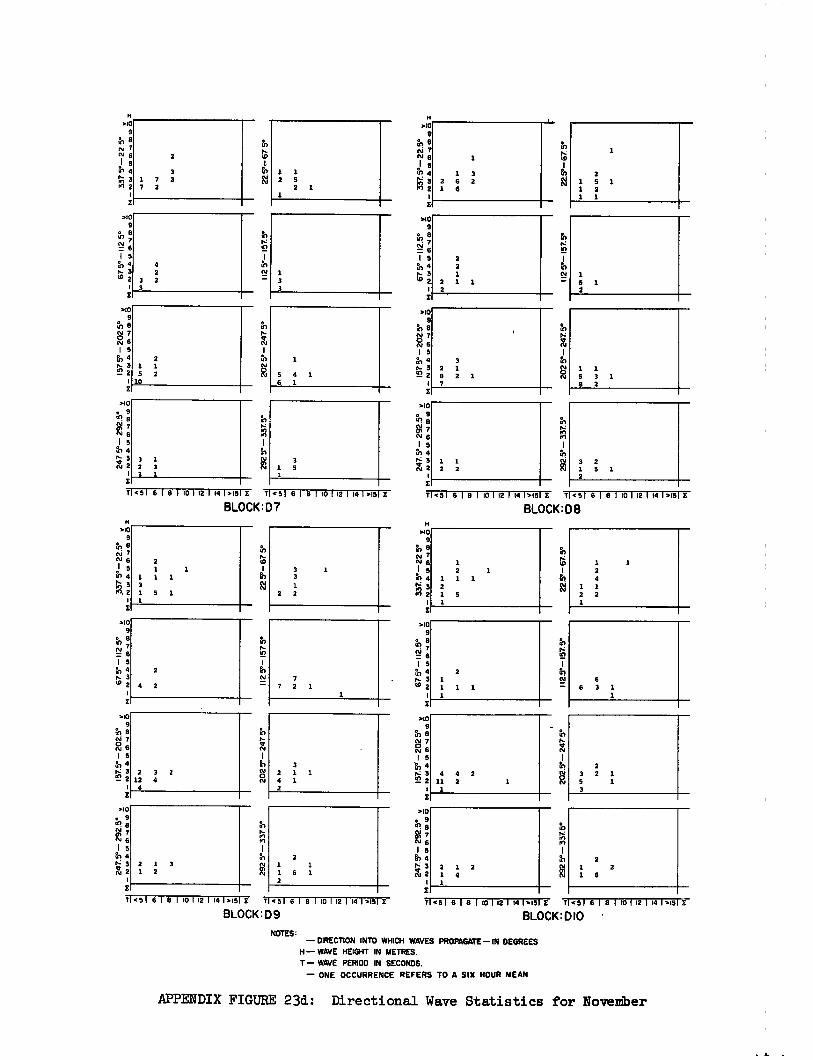
N6 1 5
N 4 I, 3
N 2
T45161131101121141.151 1<518181101121141r1513:
BLOCK: D7
112 5
° - 1
57. 5
° 20
2 5°
- 24
7 5°
H .10
9 N8 N i Of 6 1
1 5 1 1 2 5
th 4 rz 3 2
1 3 6 2
2 1 M 2 1 6 1
a10 9
in 8 0 N 7 N6 15 N4 3
5 4 1 tt!.2 2 8
1 2 1
6 1 7
>10 9
N 6 ai 76
1 5 2 N 4 2
1 p- 3 1 3 '8 2 2 1 1 3 2
.10 0 9 c! a
N 6
g
1 5 in 4
3 2
El
1 1 2 2
< 5 1 8 I 8 110 1 12 1 14 1.15 E T <51 8 I 8 110 1 12 114 1,151E
BLOCK: D8
112
5° -
157.
5°
292.
5°- 33
75°
H .10
9 N8 N 7
I 5 N 4
3 f^2
2
3 1 7 2 7 2
N6
.10 9
N8
1 5 N 4 r- 3 '8 2
>10 9
Ne N 7 R., 6 1 5
N 4 r- 3 w 2
3 1 2 3 3
3 1 5 1
4 2
3 2 3
2 1 1 5 2
10
3 2 1 5 1 2
1 1 5 3 1 8 2
2 1 5 1 1 2 1 1
1 6 1
2
4 2 7
7 2 1 112
5.-1
57 5°
112.5
° - 1
57. 5
°
1 5 N 4 r- 3
2 1
202
5°- 24
7 5°
>10 9
N 8 •
O
2 4 0 2 N 3 2 1
11 2 5 1 1 3
H >117
9
N B N 7 N 6 1
3 1 5 2 3 N4
23. 4
1 3 2 1 1 2 Fe 1 2 1 2 2
1 1 2
2 1 1
1 1 1 3 1 5 1 1
2 1 1 1 1 1
5 6 3 1
1
2 3 2 12 4
4
3 2 1 1 4 1 2
.10 9
N6 N ? m e
j 5 4
r- 3 P. 2
040 9
NB
1 5 N 4 r- 3 W 2
ri0 9
N 8 . cv 7 N 6 1 5 N 4 r: 3 u") 2
.10 o 9
6 1 5
2 4 2 1
6 1 1.4 3 N 2
2 1
1 2 4 2 1 2 6
1 1
6 1 8 1 10 112 1 141 >151 E 11<51 8181101121141>15 E 7451 6191101121141,151 E
BLOCK: D 10
292
5'' - 337
5°
1 1 2
Tl<5 I 6 1 8 1 10 112 1 14 1.15 E TI.51
BLOCK: D9
>10
9
8 7 • 6 1 5 N4
6J2 2 1 3 1 2
NOTES: — DIRECTION INTO WHICH WAVES PROPAGATE— IN DEGREES H— WAVE HEIGHT IN METRES. T— WAVE PERIOD IN SECONDS.
— ONE OCCURRENCE REFERS TO A SIX HOUR MEAN
APPENDIX FIGURE 23d: Directional Wave Statistics for November
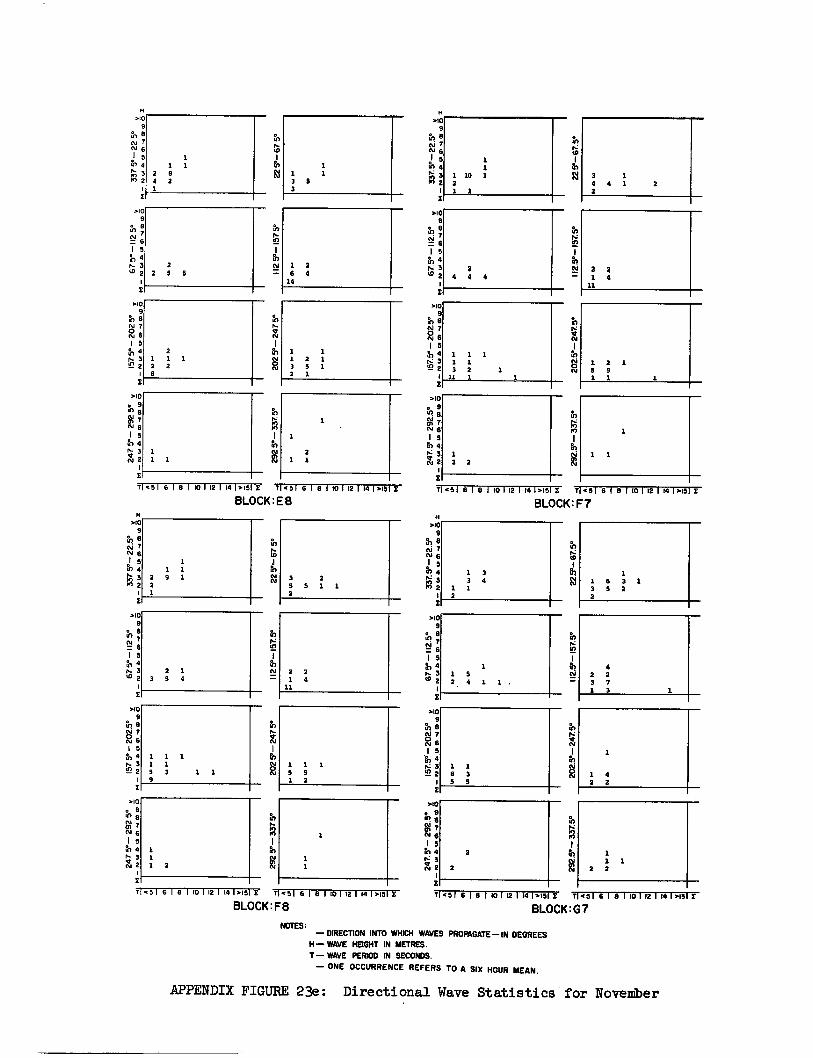
2 2 5 5
1
1
2
2 4 4 4
3 4 4 1 2
2
NINES: — DIRECTION INTO WHICH WAVES PROPAGATE—IN DEGREES
H— WAVE HEIGHT IN METRES. T— WAVE PERIOD IN SECONDS.
— ONE OCCURRENCE REFERS TO A SIX HOUR MEAN.
3 2 5 5 1 1 2
APPENDIX FIGURE 23e: Directional Wave Statistics for November
T <51 6 1 8 1 10 1 12 1 14 1.15 E T <51 6 1 8 1 10 1 12 I 14 1.151 I
BLOCK: E 8 H
>10 9
tn e N 7 cv 6
'64 r- 3
>10 9
N :
1 5 g, 1- 3
2
>109
Frt e N 0 N 6 1 5
en 4
D t■ 3
2
>10 e 9 to
7 N 6 15 in 4
17:, 32 11 <5 1 6 1 8 1 10 1 12 1 141.15 I T <51 6 I 8 1 10—F12 1 14 1>151
BLOCK: F8
11.516181101121141.153: T1<51 6 1 8 1 10 1 12 1 14 1.15 E
BLOCK: F7 H
>10 9
?c, a 0i 7
,1 5 01 4
2
>10 9
IV 7
1S en 4 r- 3 (0 2
0 mi 7 N 1 5
'en 4
to v.: 32
>10 e 9 01 8 V7 N 6 I5
rn 4
'4 3 N 2
El
T <51 6 1 8 1 10 1 12 1 14 1>15 I Tl<51 6 1 8 1 10 1 12 1 141>151 I
BLOCK : G7
1
A2
'en
N
In
N 6
a 9
>10 9
h
1 1
1 10 1 2 1 1
202.
5°- 24
75°
•
>10 9
*
•
8
IO
112 5°
-15
7 5°
20
2 5°
- 247 5°
01 4
H
>10 9
tn N 7 0.1. 6 c! 5
Lt; 3 14 2
IA IO
112.5
°-15
7.5°
>10 9
N 'Yr EY 6 1 5
eh 4
>10
7 0
9 h 8
N 6 15
en 4 tz 3 9- 2
>10 e 9 01 6 V7 N 6 15 rn 4 r 3 N 2
1 5 N 4
3 (.0r.
2
>10 9
'en 8
0 01 7 N 6 1 5 N4 r. 3 52 2
1
>10 e 9 ,n
I S in 4
N 2
2 1 1 1 2 2 a
1 1 1 1 1 3 2 1
11 1
2 3 4
11
23 2
1
1
1 1 1 2 1 3 S 1 2 1
1 1 1 3 5 3
1 2 6 4 24
4 2 2 3 7 1 3 1
1 1 1
2 2
1 1 6 3 1 3 5 2 2
1
1 4 2 2
1 1 1
2 9 1 2 1
2 1 3 5 4
1 1 1 1 1 5 3 9
1 1 1 2
1 3 3 4
1 1 2
1 1 S 2 4 1 1 •
1 1 8 3 5 5
2
1
1 1 1 5 5 1 2
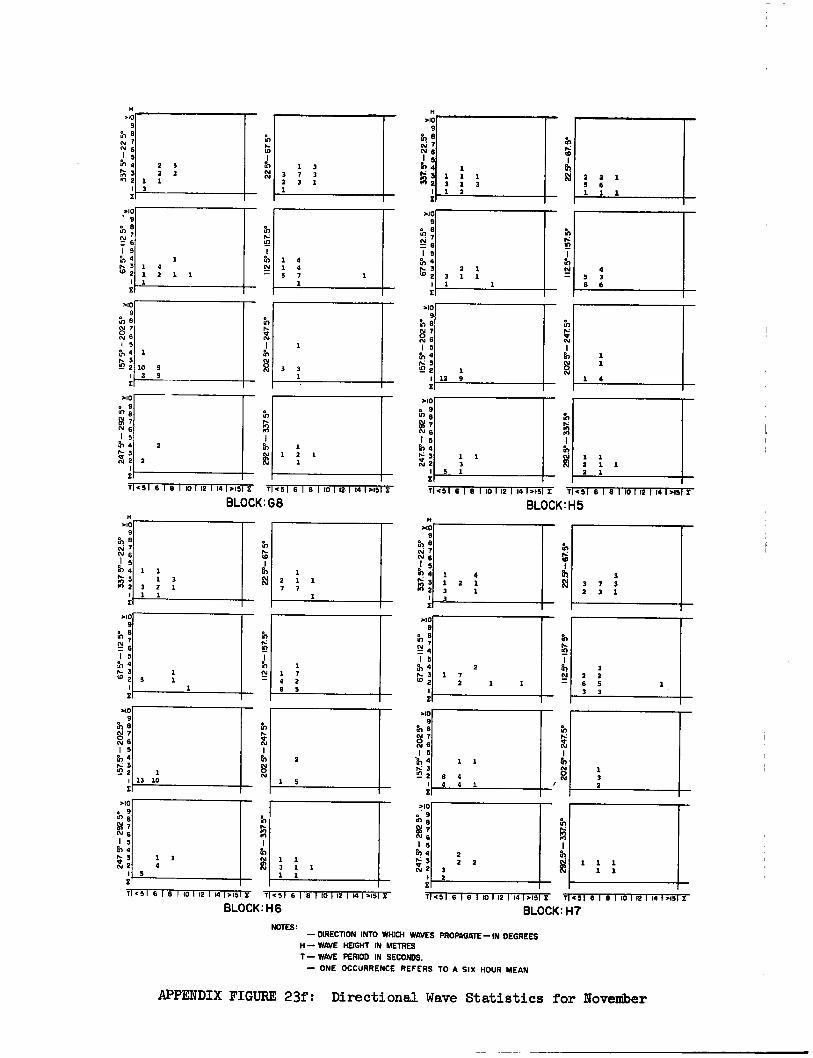
H >10
9 8
? rm 6 1 th 4 N 3
2
.10 ' 9
.1, '71 fsj 6 1 5 N 4 N 3 (02
>10 9
:18 N7 26
1 5 N 4 7- 3 N. 2
E
H
1 3
2 2 1
2
10
3 2 1
1 7 3
3 3 1
>10 9
h tv 7 4%1 1 5
N5 2a
1 3 1
1 1 1 2
1 3
Zi
1 1 1
4 2
1
1 1
1 1
0 4 7 1
1
>10 9
N 6 7
rj 6 1 5 N 4 1.3 10 2
1 3 1
2 1
1 1
1
10 2
9 5
9. N
Epp
2 3
1
3
>10 9
in 8
8 7 N 6 I 5
4 N 3
12 :
>10 o 9
>10
Ln 8 : g 7
6
N 6 IS
In 4 2 1 1 5
4 1 2 1 3 3 1
1 N 2 3.
5 1
71.51 6 1 8 1 10 1 12 1 14 1>15 E 71.51 6 I 8 1 10T12 1 14 1 >15 2: 7451 6 18 110
BLOCK:G8 H H
1
3 1
112 5°
- 1
57.V
1 1 3 2 1 1
gl 2 7
1 1 7
1
1
.40 9
rn.° N N 6
c! 5
11") 4 ■•• 2 23
1
1 1 3 3
4 2 1
1
10
112.5°-
15
7. 5°
N 1
O
N
2
1121141>I5 E r<51sieliolal,41,•151E
BLOCK: H5
>10 9
rn. N 7 Iv 6 1 5 fr) 4 t■ 2 2
2 2 1 9 6 1 1 1
4 5 3 8 6
1 1 2 1 1 2 1
3 3 7 3 2 3 1
8 4 4 1
112 5°
-1575°
20
2 V
- 24
7 V
112.
5 °-1
57
5°
.40 9 • 6
v 76 I 5
fr., 4 r. 3 10 2
.40 9
a,
1 5 iO 4 74 3 tn 2
>10 o 9
e
g 7 A.1 6 I5
Pt! 4 P.: 3 N 2
1
2 2 2
3 2
2 1 7
2
3 2 2 6 3 3
1 3 2
>10 9
:I
I 5 4
7- 3 ° 2
1
>10 9
rrt N 7 0 N 6 1 5
er, 4 3
52 2
>10 5
LH
N6 I 5 al 4 N N 2
1 1
1
1 13 10
1 1 7 0 2 8 5
2
1 5
1 1 4
S
TI <51 6 1 8 1 101 12 1 141.151 E Ti<51 6Ie1101 121141,151Z
BLOCK: H6
NOTES:
7 .51 6 1 8 I 10 1 12 1 14 1.15 E 7 .51 8 1 13 I 10 1 12 I 14 1.151E
BLOCK:H7
— DIRECTION INTO WHICH WAVES PROPAGATE—IN DEGREES H— WAVE HEIGHT IN METRES
1— WAVE PERIOD IN SECONDS. — ONE OCCURRENCE REFERS TO A SIX HOUR MEAN
APPENDIX FIGURE 23f: Directional Wave Statistics for November
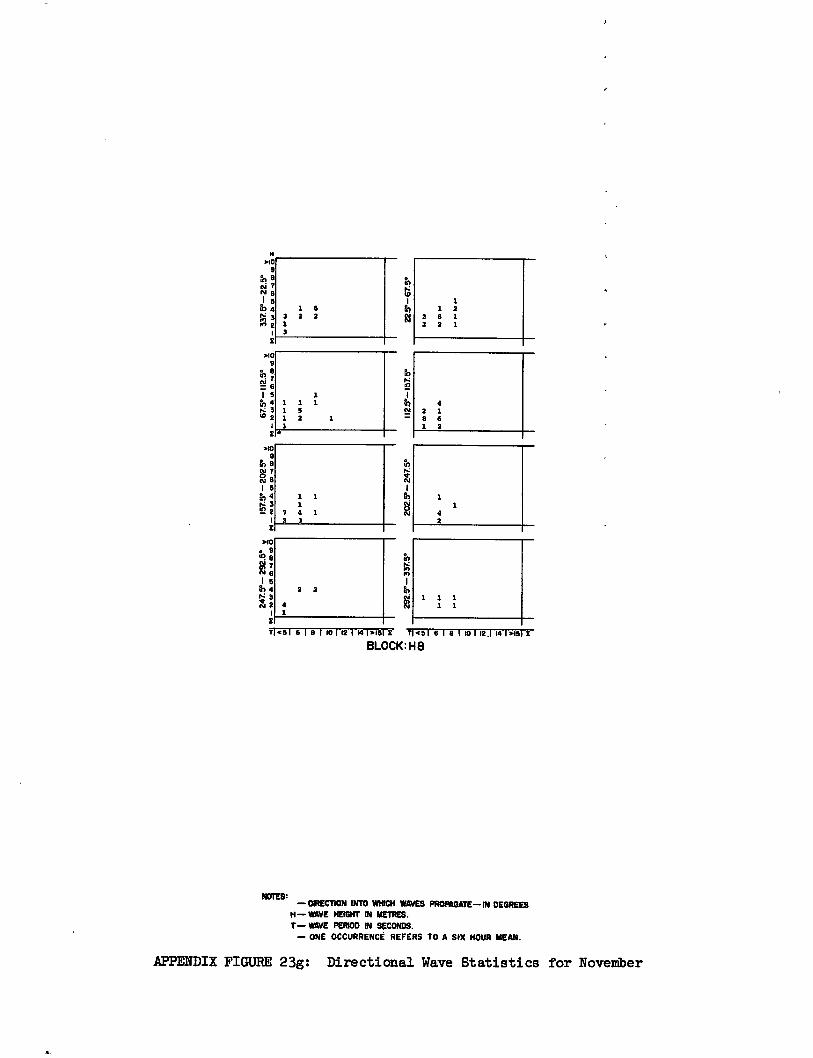
H 2.10
9
co co
1 1 6 1 2
3 2 2 2 8 1 1 2 2 1 3
1 1 1 1 4 1 5 2 3. 1 2 1 8 8 1 1 2
5)
9
O 7 m8 1 6 5, 4
24
7.5°
N 6
5 0 4
2.10 0 9
e
I to 4 0.2, 3 N2
1 1 1
7 0 1 3 3
2 2
1
3. 1
4 2
71051 8 1 8 1 10 1121 14 12.15 1i "T 051 6 1 6 110 1 12.1 14 12.1518
BLOCK : H 8
ACRES: — DIRECTION INTO WHICH WAVES PROPAGATE— IN DEGREES
H— WAVE HEIGHT IN METRES. T NAVE PERIOD IN SECONDS.
— ONE OCCURRENCE REFERS TO A SIX HOUR MEAN.
APPENDIX FIGURE 23g: Directional Wave Statistics for November
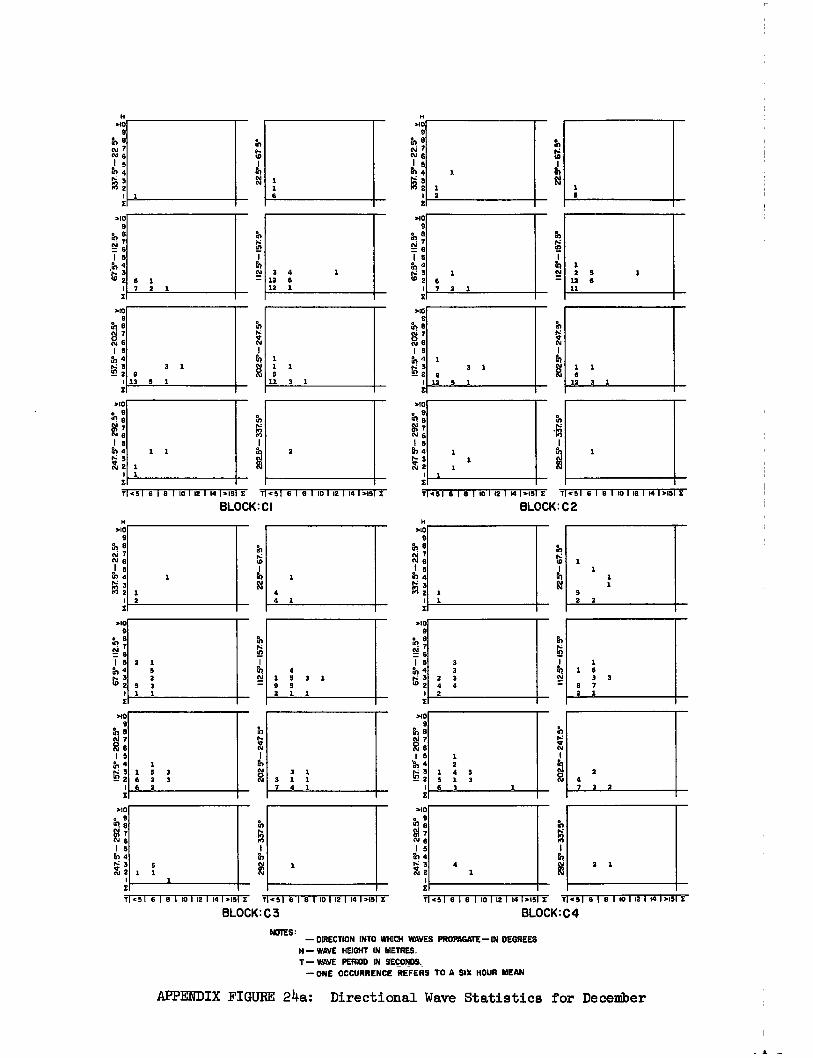
2
1 1 6
H >10
9 tn 8
? N
1 5 al 4
1 2
1,
RI 12
3 12 12
4 6 1
1
>ea 9
tf! ; N 6 1 5 th 4
6 7
1
2 1
57
Cd 1 2
12 11
9 6
1
>10 8
ro 8
7 th
0.1 6 1 5
1 5, 4 1 1 1 3 1 1 1 5 8
6
11 3 1 12 5 1 12 3 1 El
>10 e 9 01 e N7 N6
5 1174 N5 V N2
>10 9
a7 8
>10 • 9 • e N6
15 r, IQ 3 N 2
H .10
9 tn 9 N 7 cv 1 5
tr) 4 N 3
2
112.5*
-15
7.5°
8 N N
1 5 4 3
(1N
7 2
>to 9 B
0 N 7 N 6 1 5
in 4
6 1 7 2 1
3 1
13 5 1
1 1
1 1
1 1
1
1
1 1 5 3 6 2 3 6 2
8:
T .5 1 6 1 6 1 10 1 12 1 14 1.15 I 7 91 6 1 8 1 10 1 12 1 14 13151
BLOCK: C 4 11<51 6 1 8 1 101 12 1 14 1.15 1 1451 6I 8 1 10 1 12 1 14 1.151 1
BLOCK: C 3
>10
rg1 :
7 6 15 rn 4 N 3 N 2
4 4 1
9 N 7 N 6
el 5 al 4 I,: 3 2 2
1) to
p4
1
4 1 5 9 5 2 1
3
1
1
310 9
&?
1 5 th 4 rz 3 (0 I
2 4 a
3 3 3 4
&-)
tcia 1
8 2
1 6 3 3 7 1
>10 9
V
1
>10
r11 : al 7 N I5 8-3 4
3 2
4
N(1 N
1
8
Rt
3,40 9 N7 0 616 15 5,4
6 1 5
4
H >10
9 8
N 7 N6 1 5 IN 4
M 2 P., 3
>10 9
0017 7
N 6 I5 N 4 r. 3
2 1
H >10
9
1
1 2
3 1 5 2
5 3 1 1
5 1 1
3 1 3 1 1 7 4 3.
1 2
1 4 5 5 1 3 6 3 1
1 4
2 47 2
2 1
7 <51 6 1 8 1 101 12 1 14 1.15 E T <5I 6 1 8 1 10 1 12 1 14 1315
BLOCK : CI T <5 16 1 8 1 10 1 12 1 14 1315 1 7 .51 8 1 8 1 10 1 12 1 14 1 3151
BLOCK: C 2
NOTES: — DIRECTION INTO WHICH WAVES PROPAGATE— IN DEGREES
H— WAVE HEIGHT IN METRES. T— WAVE PERIOD IN SECONDS.
— ONE OCCURRENCE REFERS TO A SIX HOUR MEAN
APPENDIX FIGURE 24a: Directional Wave Statistics for December
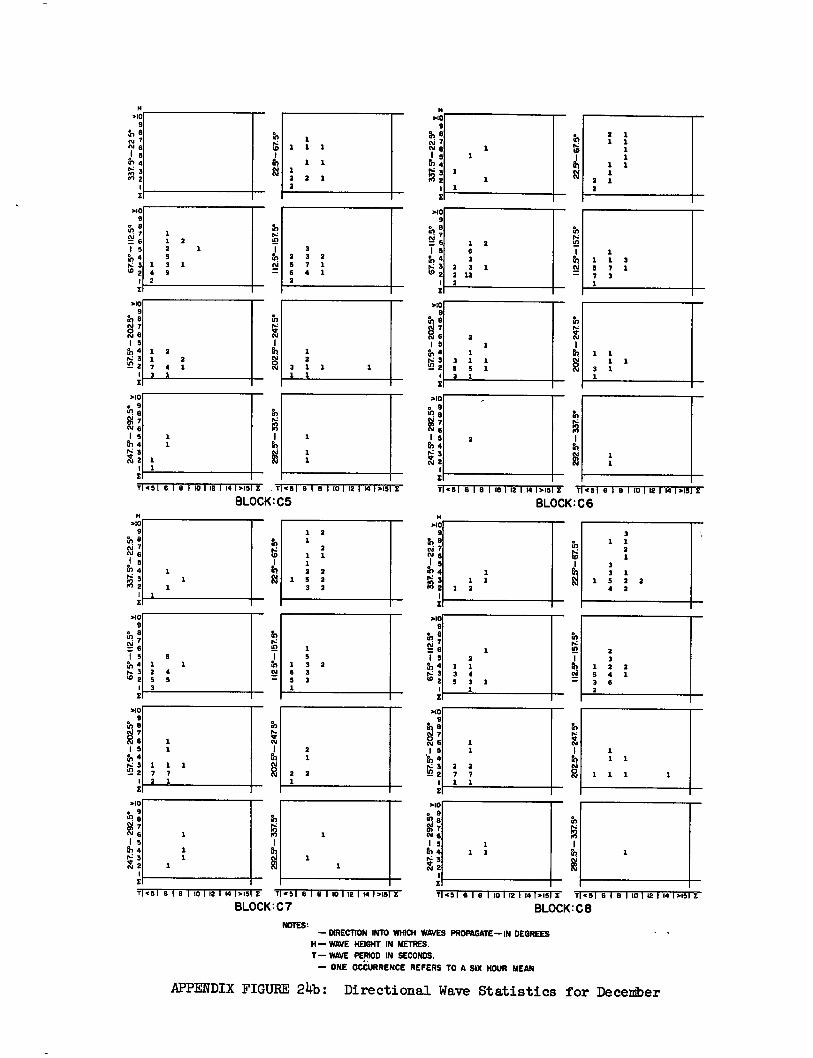
1 1 1
1 1 1 1
1.1 m5 1 6 1 8 1 10 1 12 1 14 1.15 E , T <51 6 1 8 1 10 1 12 1 14 1.151 E
BLOCK: C5
z 451 slelieliolt41.13 E r<313131431131141.431z
BLOCK: C6
T <51 6 1 8 1 10 1 12 114 1.15 E T >51 6 1 8 1 10 1 12 1 14 1.151 E
BLOCK : C 7
T <5 18 1 8 1 10 1 12 1 14 1>15 E T <51 8 1 8 1 10 1 12 1 14 1 >151 E
BLOCK: C8
NOTES: — DIRECTION INTO WHICH WAVES PROPAGATE—IN DEGREES
H — WAVE HEIGHT IN METRES. T— WAVE PERIOD IN SECONDS.
— ONE OCCURRENCE REFERS TO A SIX HOUR MEAN
APPENDIX FIGURE 24b: Directional Wave Statistics for December
sr N
51
1 5 114
H >10
tr, 8 ai ? Cm 6
>10 9
V 6 1 5 N4
3
1 2
3 2 3 1 2 12 2
112.Y-
157.Y
9) to to
1 1 2 2 1 5
1 3 1 4 9
3 2 3 2 5 7 1 6 4 1 2
1 1 1 3 5 7 1 7 3 1
1 1 1 1
1 1 1 2 2 1 2
0 3 2
1 1
1 1
3 1 1 1 1 1 1 1 1
2 1 2
H >10
9 8
OJ7 N 6 1 5 rn 4 1n1 ••• " 2
1
>10 9
rn EY: 6 1 5 to 4 ▪ 3
2 1
4)
A II
2r-
157.
5°
5, 2 1
2 2 1
1 3 2 6 3 5 3 1.
9 eO' 1 N 6 1 5 rn 4
3 2
>10
01 7
1 5 en 4
w2
3
>10 9 ;
1 5 in 4
3 W2
1
>10
>10 9
rn 8 (11; I5 u,4
3 c.0 2
>10 9
N8 1 5
lb 4 3
55 2 1
>10 e 9 cri: 8
E ; 1 5 4
14 3 N 2
1
H >10
9 th 5 N 7
2 1
N j 5 In 4 P.: 3
H >10
9 th 0„, N 6 15
rn 4
5 1 1 2 4 5 5 3
1 1
1 1 1 7 7 2 1
1 1
1 2 1
2 1 1 1 2 2
1 5 2 3 2
2 3
1 2 2 5 4 1 3 8 2
3 1 1
2 1
3 3 1
1 5 2 2 4 2
1
1 2
1 1 3 4 5 3 1
1
1 1
2 2 7 7 1 1
>10 9
N I5
N 4
;
a10 e 9 8) 9
I 5 11 4
3 N co 2
>10 9
rn
ck: I 5 a, 4
'n ▪ 3
2 1
1 2 1 2 7 4 1 3 1
1 2
3 1 1 1 1
2 1
1 3 1 1 5 5 1 3 1
2
1 1
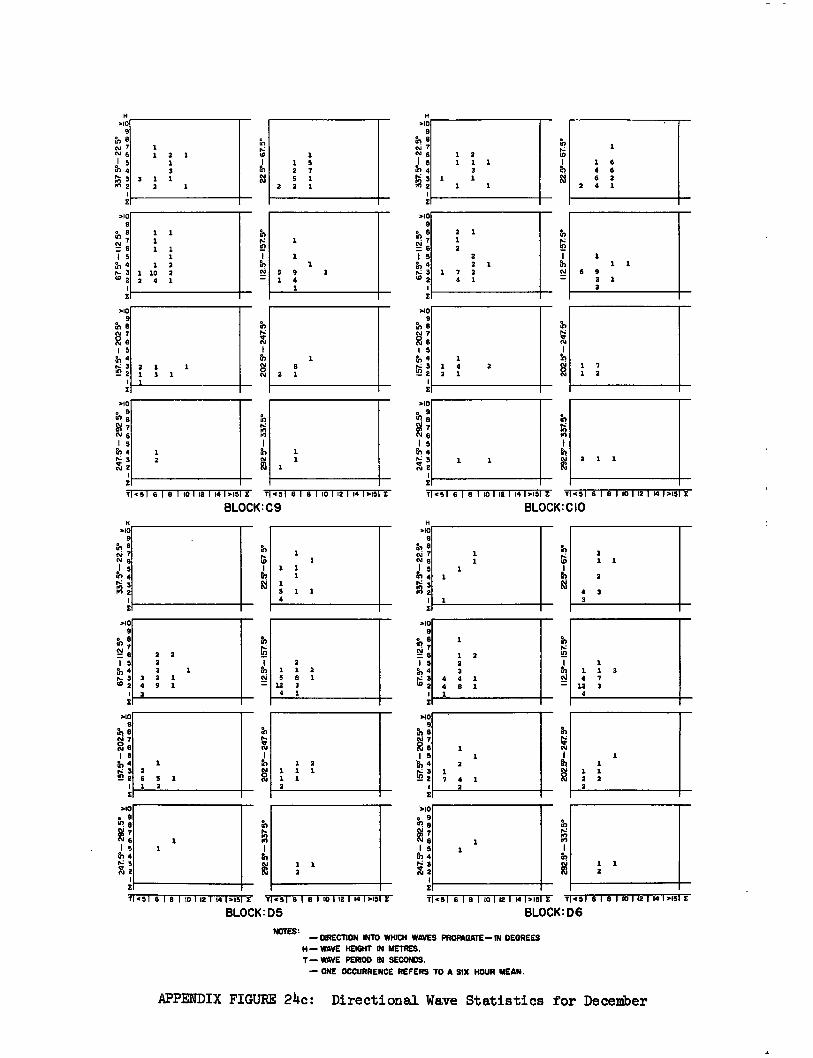
1 1 a
NOTES — DIRECTION INTO WHICH WAVES PROPAGATE—IN DEGREES
H — WAVE HEIGHT IN METRES. T— WAVE PERIOD IN SECONDS.
— ONE OCCURRENCE REFERS TO A SIX HOUR MEAN.
APPENDIX FIGURE 24c: Directional Wave Statistics for December
.10 e 9 • s
M 7 N 6 1 5
?17 4 Is: 3
XI i■ri 2
1 2
7145 1 6 I 8 1 10 I 12 1 14 1.15 E T <51 6 I 8 1 10 I 12 I 14 1.151 I
BLOCK: C9 1l<51 6 1 8 1 10 1 12 1 14 I>15 E T <51 6 1 8 110 112 1 14 1.151 E
BLOCK: CIO
H >10
9
a N 1 N 1 2 I 5 1 1 1 1 6 n4 3 0 6
1 6 2 2 4 1
>10 9
in 8 ti 76
2 1
1
1 5 2
2 1 n4 2 1 1 1
1 3 1 7 2 6 9 tO 2 4 1 2 1
2
.40 9
in 6 0 N 7 N 6 cs,
1 5 4 1
in 3 in 2 1 2
a 1
2 1 1
7 2
112 5°-
I5
7. 5
°
fr)
1
1 1 1
1 1
4 1
9 a
N N
1 5 al 4
1 11 0 0
1
4 3
1 I
2
3
H 3.40
1 1 2 1
3 1 1 2
1 1 1 1 1
1 1 2
10 2 0 1
N, ,1 5 07 4 ti 3 el 2
1 2
Pn
112.
5°-
157
.5°
1 2 1
240 e 9 al al 7 N
I5 11 4
ri :
3
H '40
9
N 7 N6 1 5
07 4 3
2 2
H
9 a, N 7
810 9
in a ;
1 5 er, 4 r, 3 42 z
1 1 5 2 7 S 1
2 2 1
1 5 9 1 4
1
1 1
1 2 1 1
1<5I6181 101121 141.15E 74516181 101 121 141.152
BLOCK: D5
en
2 I5
81 4
kJ' 2
T <51 8 1 8 I 10 112 I 14 1.15 E T <51 8 I 8 I 10 112 I 14 1.151
BLOCK: D6
.10 . 9 e
I s rn 4
s imr 2
>10 • 9
s
1 5
12 4
2 1 8 3 1
2 1
.10 9
in a t%.1. ; 13 a, 4
3 to 2
0 0 1
1
1 2 3 4 8
2
1 1
1
12
1 1 3 7 3
1 1 2
1 1 1
2 1
>10 9
0 N 15
4 17
1
2
24 1
rn
4.1 1 2 2
1 1 1 2
1125
- I5Z
5°
112.
5°-1
57
.5°
.10 9
n 9 ;
1 5 rn 4
3 10 2
3.10 9
N 6 15 a, 4
tn 3 2
2 2 2 3 1
3 2 1 0 9 1 2
2 6 5 1 1 2
1 1
2
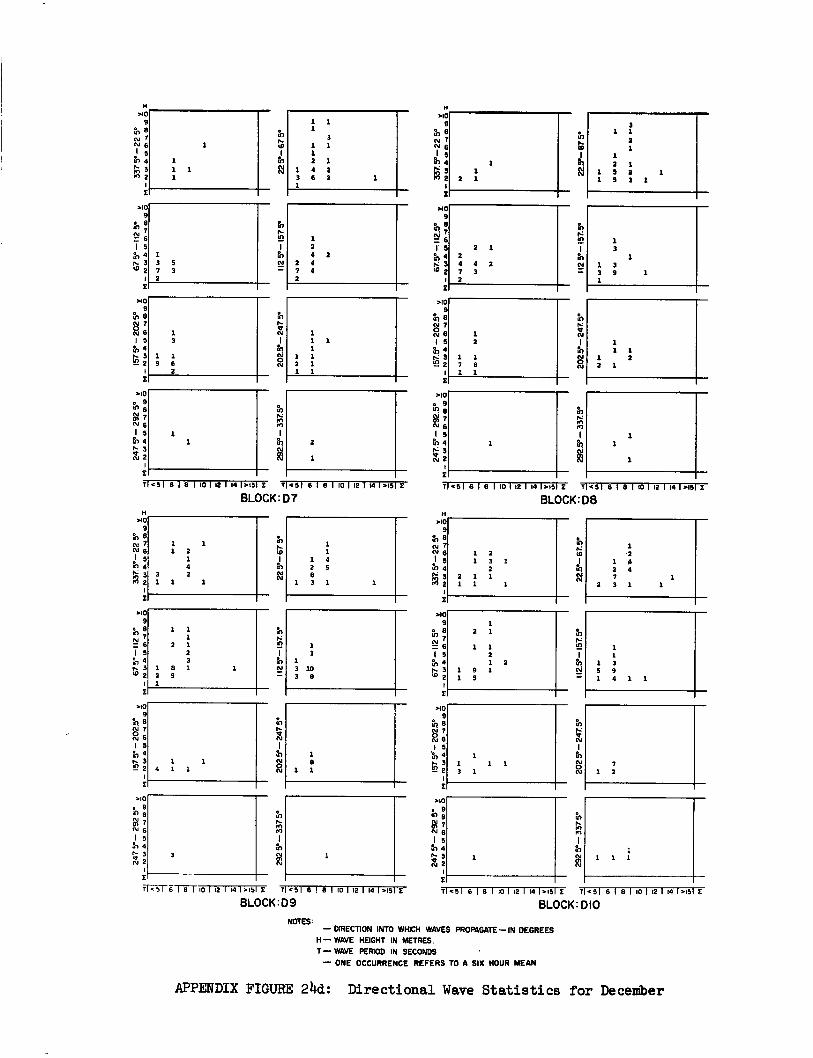
1 1
1
1 1 1
3 1 1 1 2 1
1 4 2 3 6 2 1
2
1
1 1 1 1
1 1 2 1 1 1
1 2 4 2
2 4 7 4 2
In
10
H 7.10
9 N a N 7 N
11
25°
-15
7.5°
.10 9
:38 N 7
6 I 5 a., 4 7. 3 u22
51 lV
710 • 9 In e SI 7 N 6 1 5
fh 4 7- 3 N 2
g 7 N 6
I5 to 4 N 3 N 2
>72 e 9 e
1 5 a, 4 1, 3 87 2
5 0 4
12 3 2
.10 9
• e al 7 V. 6 1' ▪ 4 7: 3 to 2
.10 9
5n8
0 N 7 N 6
5 to 4
3 m") 2
11
2 5°
- 1
575°
2025- 247
.5°
0
3 1
H >10
rn 4
9 ▪ 8 cs, 7 N 6 1 5
1 3 5 7 3 2
1 3
1 1 9 6
2
1
1 2 1
2 1 2 4 4 2 7 3 2
1 2
1 1 7 8
1
1 1 1
1 2 2 1
3 1 1
2 1
1 2 1
1 5 2 1 1 5 3 1
1 3
1 3 3 9 1
1 1 1
2 1 2 3
1 8 1 2 5 1
1
H
1 2 8 3
1 1 4 5
1
710 9
51 8 ni 7 N6 j 5 0 4 IN 3 r;3 2
2 1
1 1
1 1
2 3 2 1
1
1
4)
2
1 2 7 3
1 2
4
1 1
1
1 3 10 3 8
D.10 9
:I 8 V;
1 5 5f 4
tr'r; 23 1 1
2
1 9 5
; 1 1
2 1 5 1
1 1 3 9 4 1 1
>10 9
51 8 CM 7 RI 6 1 5
4 3 2 2
02 5
°- 2
47
5°
IN 3
.10 9
rn. (01$1 7 N 6 1 5 ▪ 4 7- 3 'LI 2
E
9
th a N 7 62 6
5 5f 4
2 a
s 340
9 ▪ 8
;
1 5 N 4
3 t8 2
1
H 510
202 5°- 247 5°
112
5° -1
57.
5°
to 1 1 1 2
1 4
3 2 1 1 1
7 1 2
29
2 5°- 3
375°
T1451 6 1 8 1 10 1 12 1 141>15 £ 7 <51 6 1 e 1 10 1 12 1 141>151 £
BLOCK: D7 71<51 6 1 8 1 101 12 1 141.15 £ 7<51 6 1 8 1 101 12 1 141.151 £
BLOCK: De
.:10 710
to : to tO 9
In7 7- M 7
N6 2 N6
1 5 I 1 5
ro 4 in 5f4
a3 3 I 3
N X 2
1 II 717.-5-1-6 18 1 10 1 12 r 14 1>15 T <51 6 ! 8 110 1 12 1 14 1.151 7 <51 6 1 8 110 1 12 1 14 1.15 Z T <5I 6 1 8 1 10 1 12 1 14 1- .151
BLOCK : D9 BLOCK: DIO NOTES:
— DIRECTION INTO WHICH WAVES PROPAGATE— IN DEGREES H — WAVE HEIGHT IN METRES.
T— WAVE PERIOD IN SECONDS
— ONE OCCURRENCE REFERS TO A SIX HOUR MEAN
APPENDIX FIGURE 24d: Directional Wave Statistics for December
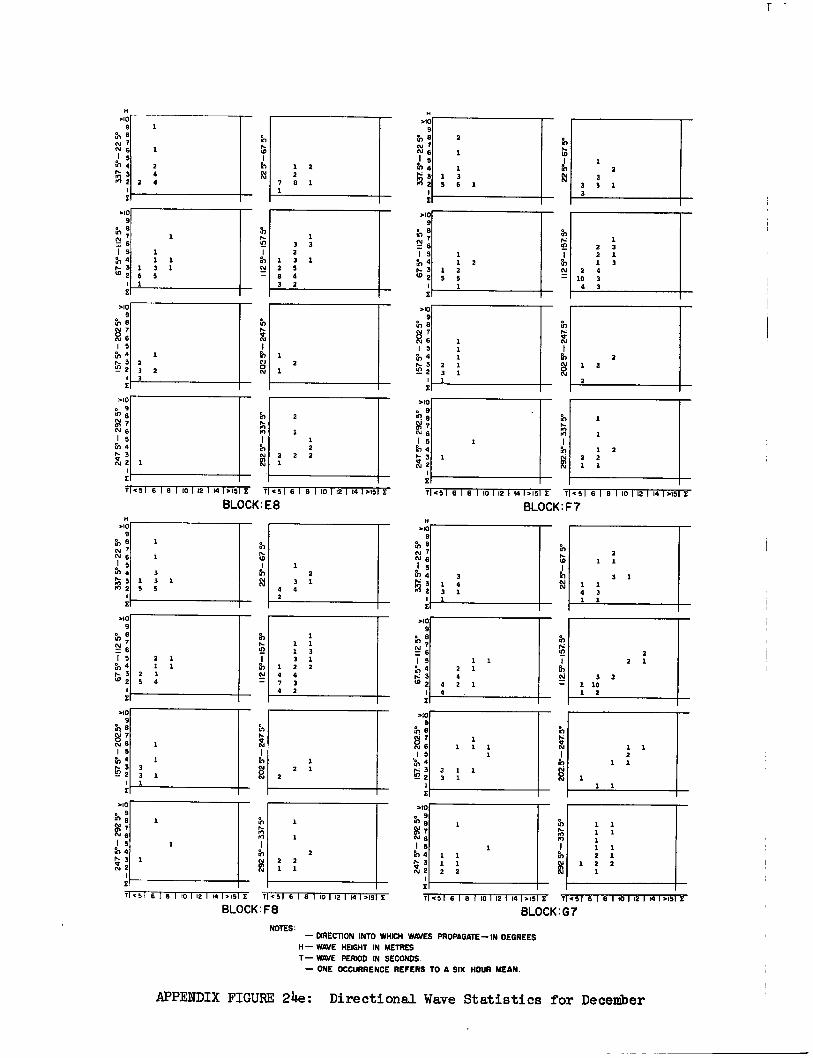
>10 9
clj 1 5 th 4
3 W2
010 9
m e N RI 6 1 5 r , 4 r- 3 "2 2
>10 • 9 to
Pi 7 N 6
3 1 3 1 5 5
2 1 1 1
2 3 5 4
1 3 3 1 1
1
010 9
fh 8 N 7 R. 6
1 5 4
52 2
>10 • 9 0 6
Si 7 N 6
gl 2
1 5 rn 4 P- 3
H 010
9 th .4 7
1 5 tr, n- 3 M2
>10 9
al 8 V 76
1 5 4
n- 3 W 2
1 1 1
1 3 1 6 5 1
1 2 3 2 3
112 Y-I
57
W
1. 2 8 3
a a 5 1 33
1,15 I 7 .51 6 1 8 1 10 1 12 1 14 1 >151 ;
BLOCK: F7
112
5°-1
57.5
°
tD
81
N N
Fa
N
in r, M lo
1 FP
E
1 2 3 2 1 1 3
2 10 3 4 3
1 2 2 2 1 1
2 1 2
2
H
2 1
1
2
1
2 2
1 22
o51 6 1 8 1 10 112 1 14 1>15 E
BLOCK:E8
010 9
N 8 N 7 N 6
N
10 1 2 1
j 5 10 4 3 3 1
3 1 1...4 3 1 0 1 1 4 0 2 3 1 4 3
1. 1 1
>10 9
1 1 1
a., 8
1 3 ; 2 3 1 1 5 1 1 2 1 2 4
2 4 1.■
24 1 3 2
3 2
W2 04 2 1 1 1
10 2
>10 9
in N
6 11 1 1 1 5 2
2 1 3 'en 4 3 2 1. 1
1 1
'2 2 3 1 1 1
>10 9
0 8 1 1 7 1 1
N 6 1 1 5 1 1 1
2 1 1 2 1 2 1
rs 1 2
1 2
1 2 1
2
1 6 1 8 1 10 1 12 1141>151 E T1451 6 1 8 1101 12 1 14 1 >15 E 710 51 6 1 6 1 10 112 1 14 1,451
BLOCK: 07
NOTES* — DIRECTION INTO WHICH WAVES PROPAGATE—IN DEGREES
H — WAVE HEIGHT IN METRES T— WAVE PERIOD IN SECONDS.
— ONE OCCURRENCE REFERS TO A SIX HOUR MEAN.
APPENDIX FIGURE 24e: Directional Wave Statistics for December
H 010
9 to 8 N ? N 6 .1 5 0 0 1, 3 0 2
2
2 0
7 1
I 5 Pr) 4
Tic 5 1 6 1 8 1 10 1 12 I 14 1 >15 E 7
112
5.-1 5
7 5°
1 4 7 4
202
5°-
247
5°
2
0 2 1
4 2
>10 9
N N ? N
1 5
2
1 2 tr, 4 1 2-; 1 3
8 1 M2 5 6 1
>10 9
1 in 713
3 3 C=1 6 1 5 1
3 1 U, 4 1 2 S p- 3 1 2 4 W 2 5 5 2 1
>10 9
th 8 N 7 ia 6 1
1 5 1 tr., 4 1
[?; ; 2 3
1 1
1
>10 9
P s W 7 N 6
1 5 al 4 1.- 3 X 2
, ; 11.51 6 1 8 I 10 1 12 1 14
H
112. 5
°-1
57 5
° 20
2.5°
- 24
75"
T1 c 1 6 I 8 110T12 1 14 1.i9 I T 0 5
BLOCK:F8
202
5°-
247
5°
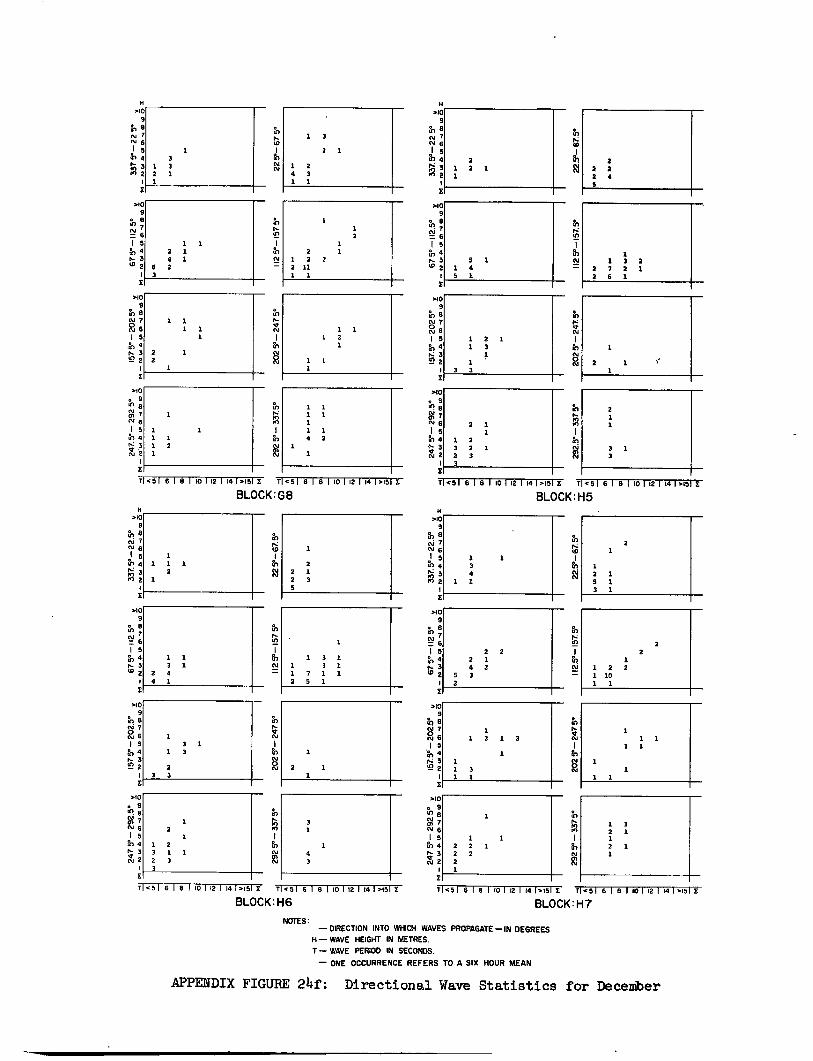
1 3 1
1 3
2 3 3
2 2 2 1 4 2 3
52
2 2
1 1 2 2 1 10 1 1
NOTES: — DIRECTION INTO WHICH WAVES PROPAGATE—IN DEGREES
H— WAVE HEIGHT IN METRES. T— WAVE PERIOD IN SECONDS.
— ONE OCCURRENCE REFERS TO A SIX HOUR MEAN
APPENDIX FIGURE 24f: Directional Wave Statistics for December
H >10
9
tn 8 N 7 N 6
5 04
Si 5 M 2
>10 9
1 2 1
3 3 1
< 8 , N 6 1 5 1 1 fr, 4 2 1
3 4 1 w 2 6 2
3
>10 9
in 8 N 7 1 1 C9 6 1 1 1 5 1
41,4 1.- 3 .2 2
2 2
1
1 .15 E T <5 1 6 1 8 1 10 1 12 I 14 1,151 I
BLOCK:G8
H >10
9
En 8 N 7 N6
T <5 I 6 1 8 1 10 1 12 I 14 1>15 E T <51 6 1 8 110 1 12 1 141>I51
BLOCK:H5
225°
- 67
5°
.10 o 9
N 7 6
I 5 1 In 4 1 1
3 1 2 1
Tl<5 1 6 1 8 1 10 1 12 1 14
MO 9
ni ; 2 1 1 5
2 1 in 4 1 1 2
2 11
2
t•-• 3
0:1 2 1 5 4
1 2
1 7
3 2 2 1
1 1 5 1 2 6 1
>10 9
in 8 N 7
1 1 R 8 1 2 1 5 1 2 1
1 N 4 1 3 1 r: 3 1
1 1 D 2 1 2 1 1 3 3 1
>10 o 9
4.) 1 1 8 2 1 1 1
1
1 N 7
6 I 5
2 3.. 1 1 1
4 2 rn 4 1 2 1 3 2 1 3 1
1 : 2 3 3 3
112 5°
-157
5°
202
5°- 24
7 5°
112 5
° -15
7.5°
20
2 5°
- 247
. 5°
292.
5°- 33
75°
BLOCK: H6
H
1 1 1 2
.1) Ir to
2 2 5
1
2 1 3
>10 9
N e 0.1 7 C46 j 5 <1 4 tz 3
2 2 1
1 3 4 1
iy 1 2 5 3
2 1
1 1 1
1
1
O 7 N 6 15 N 4
N 3 '41 2
>10 o 9 gl 8 Si 7 N 6
1 5 b 4 r- isri 3
2 1
Tl<5 1 6 1 8 1 10 112 I 141>15 E T <51 6 1 8 1 10 1 12 I 14 1'151
1 5 a, 4 I• 3 0 2 11
2.5° -
157.
5°
H >10
9
8 N 7 cs, 6
I 5 in 4 f z 3 <1 2
>10 9
N 8
1 5 N 4
3 102
>10 9
in 8
v 76
292 5°
- 337
5°
T <51 6 1 8 1 101 12 1141>15 £ T <51 6 I 8 I 10 1 12 1 141 >151 E
BLOCK: H7
112
5° -
157
5°
202
5°-
247
5°
292
5°- 337
5°
>10 9
r0 8
ir6 1 5
202
5°- 247
5°
4 3
E.) 2
>10 o 9 cncs, 6
cs 7 0.1 Is
En 4 r- 3
2 1
1 2
1 1 2 3 1 1 2 3 3
1 1 2 2 1 2 2 2 1
2 1 1
1 1 3 1
2 4 4 1
1 3 1 1 3 1 1 7 1 1 2 5 1
2
3
4 3
1 3
2 1
1 2 4 3 1 1
2 1 2 1 1
2 2 2 2 4 5
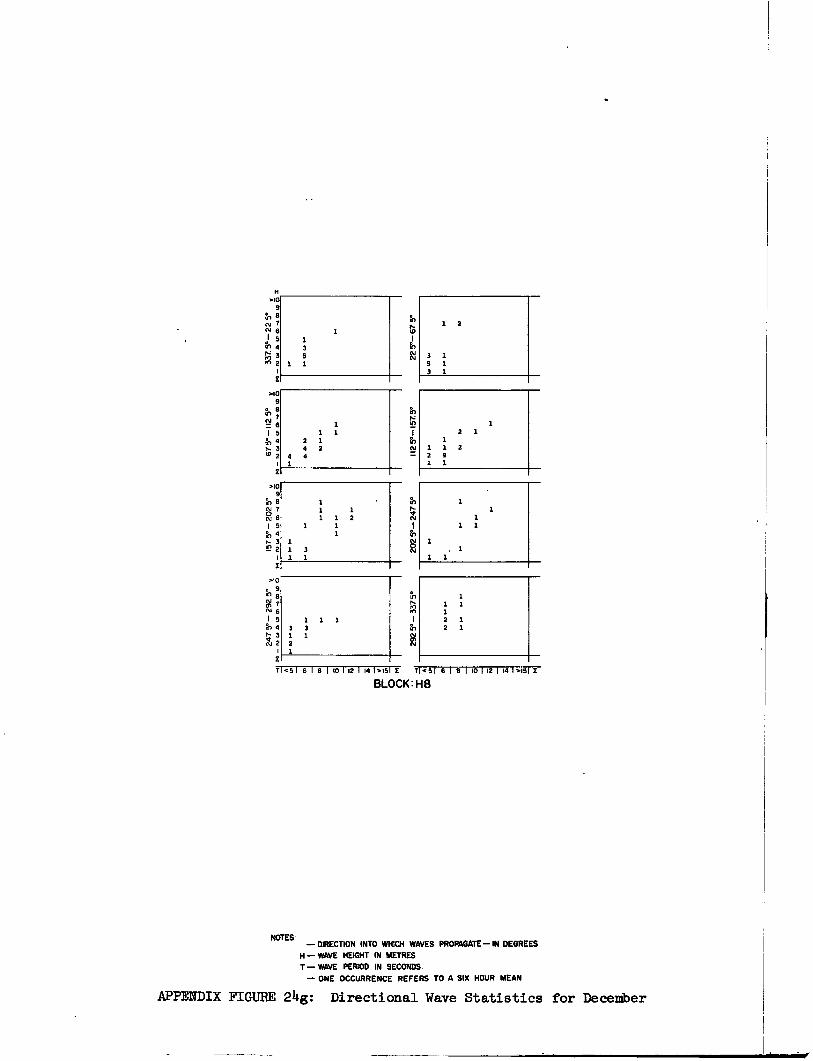
2 1 1
1 1 2 2 9 1 1
1
1 1 1
1 1
1 1
1 - 1 1 1 2 1 2 1
H >10
9 in 8 cv 1 2 N 6 VI
5 si 4 3 In' 3 5 3 1 H•c 2 1 1 5 1
3 1 E
112 Y
-157
.5°
to r- N
N pN
Fr)
>10 9
N 8 7
I 5 4
2- 3 W 2
>10 9
to 8
4
2 4 4
1 1 2
1 1
1
0 N 7 1 1 cv 1 1 2 I 5 1 1
fe, 4 r- 3 1
1
g'2 1 3 1 1
NO 9
In 8
ccill cv 6 I 5 1 1 1
?r, 4 3 3 t, 3
I 1 2
1
1 E
r<516161101121141.162 r<516181101121141.1512
BLOCK: H8
NOTES' — DIRECTION INTO WHICH WAVES PROPAGATE— IN DEGREES
H — WAVE HEIGHT IN METRES T— WAVE PERIOD IN SECONDS.
— ONE OCCURRENCE REFERS TO A SIX HOUR MEAN
APPENDIX FIGURE 24g: Directional Wave Statistics for December


