Labor Unemployment Risk and Corporate Financing...
49
Labor Unemployment Risk and Corporate Financing Decisions * Ashwini K. Agrawal † and David A. Matsa ‡ August 27, 2010 Abstract This paper examines the impact of labor unemployment risk on corporate financing decisions. Theory suggests that firms choose conservative financial policies partly as a means of mitigating worker exposure to unemployment risk. Using changes in state unemployment insurance benefit laws as a source of variation in the costs borne by workers during layoff spells, we explore the connection between unemployment risk and the corporate financing decisions of public firms in the United States. We find that increases in legally mandated unemployment benefits lead to increases in corporate leverage. The impact of reduced unemployment risk on financial policy is especially strong for firms that have greater layoff separation rates, labor intensity, and financing constraints. The estimated premium required to compensate workers for unemployment risk due to financial distress is about 57 basis points of firm value for a BBB-rated firm. These findings suggest that labor market frictions have a significant impact on corporate financing decisions. * We would like to thank David Autor, Samuel Lee, Steven Kaplan, Brian Melzer, Mitchell Petersen, Joshua Rauh, Philipp Schnabl, Morten Sorensen, Ilya Strebulaev, Amir Sufi, David Yermack, and seminar participants at DePaul University, New York University, Northwestern University, and the University of Pennsylvania for helpful comments. We also thank Ed Altman and Brenda Karlin for generously providing data on bond defaults. † The Stern School, New York University, KMC 9-75, 44 West 4 th St, NY, NY 10012. Phone: 212-998-0913. Email: [email protected]. ‡ Kellogg School of Management, Northwestern University, 2001 Sheridan Road, Evanston, IL 60208. Phone: 847-491-8337. Email: [email protected].
Transcript of Labor Unemployment Risk and Corporate Financing...

Labor Unemployment Risk and Corporate Financing Decisions*
Ashwini K. Agrawal† and David A. Matsa‡
August 27, 2010
Abstract
This paper examines the impact of labor unemployment risk on corporate financing decisions. Theory suggests that firms choose conservative financial policies partly as a means of mitigating worker exposure to unemployment risk. Using changes in state unemployment insurance benefit laws as a source of variation in the costs borne by workers during layoff spells, we explore the connection between unemployment risk and the corporate financing decisions of public firms in the United States. We find that increases in legally mandated unemployment benefits lead to increases in corporate leverage. The impact of reduced unemployment risk on financial policy is especially strong for firms that have greater layoff separation rates, labor intensity, and financing constraints. The estimated premium required to compensate workers for unemployment risk due to financial distress is about 57 basis points of firm value for a BBB-rated firm. These findings suggest that labor market frictions have a significant impact on corporate financing decisions.
* We would like to thank David Autor, Samuel Lee, Steven Kaplan, Brian Melzer, Mitchell Petersen, Joshua Rauh, Philipp Schnabl, Morten Sorensen, Ilya Strebulaev, Amir Sufi, David Yermack, and seminar participants at DePaul University, New York University, Northwestern University, and the University of Pennsylvania for helpful comments. We also thank Ed Altman and Brenda Karlin for generously providing data on bond defaults. † The Stern School, New York University, KMC 9-75, 44 West 4th St, NY, NY 10012. Phone: 212-998-0913. Email: [email protected]. ‡ Kellogg School of Management, Northwestern University, 2001 Sheridan Road, Evanston, IL 60208. Phone: 847-491-8337. Email: [email protected].

1
Workers bear significant costs during unemployment. A large literature in labor economics
focuses on unemployment risk as a substantial source of concern for workers, none the least because laid
off workers often endure significant reductions in consumption (Gruber 1997), long delays before
reemployment (Katz and Meyer 1990), and significant wage cuts after returning to work (Farber 2005;
Gibbons and Katz 1991). These costs are particularly evident amid the sustained high unemployment of
the recent credit crisis and jobless recovery (e.g., Luo and Thee-Brenan 2009). Workers’ concerns about
becoming unemployed reduce labor demand even when a firm is far from bankruptcy, naturally affecting
firms’ human resources policies on layoffs and wage setting (Topel 1983, 1984, Li 1986; Hamermesh and
Wolfe 1990). Despite their magnitude, however, workers’ costs of unemployment are largely absent from
standard theories in corporate finance, which typically assume that labor markets are frictionless.
This paper studies the impact of worker unemployment costs on corporate financing decisions.
Specifically, we examine the hypothesis that firms choose conservative financial policies partly as a
means of mitigating worker exposure to unemployment risk.1 Workers require that firms provide a
premium in wages or benefits to compensate them for potential job loss (Topel 1984, Abowd and
Ashenfelter 1990). Firms can choose financial policies that decrease the risk of financial distress and
costly layoffs, implicitly reducing the compensation required by workers to offset unemployment risk.
Diminished exposure to unemployment risk through flexible financial policy is likely to be especially
important in industries that experience relatively high layoff separation rates and tight financing
constraints, as workers in these industries are more likely to experience job loss due to distress. One
particular formalization of this hypothesis has been developed recently by Berk, Stanton, and Zechner
(2010).
Empirical identification of the impact of workers’ exposure to unemployment risk on corporate
financing decisions is challenging for two reasons. The first obstacle is to precisely measure workers’
exposure to unemployment risk. The second difficulty is to distinguish the impact of worker
unemployment costs from other factors which otherwise impact financial policy, such as unobservable
investment opportunities. Correlations between leverage and proxies for unemployment risk, such as firm
size, capital intensity, and wages, are suggestive but open to many interpretations (Verwijmeren and
Derwall 2010; Chemmanur, Cheng, and Zhang 2009).
To overcome these challenges, we exploit changes in state unemployment insurance (UI) benefit
laws, and examine their relation with the corporate financial policies of U.S. firms from 1950 to 2008.
Increases in UI benefits impact corporate financing through their impact on workers’ exposure to 1 As put by Stewart Myers, “To succeed a corporation requires a co-investment of financial capital from the outside and human capital that is built up inside the business…When you ask people to make an investment of human capital in your firm, you do not then do things – like raising the leverage ratio too high – that would needlessly put that investment at risk” (Myers et al. 1998, p.18-19).
2
unemployment risk. More generous state unemployment benefits make layoffs less costly and reduce
workers’ demands to be compensated by their employers for facing high unemployment risk (Topel
1984). Because firms have less incentive to use conservative financial policy to reduce worker exposure
to job loss, they are able to raise leverage and profit from increased debt tax shields and other benefits
associated with debt financing.
Our approach enables us to identify the impact of shocks to unemployment risk on corporate
financial policies without requiring explicit measures of worker risk aversion to unemployment. We
make the (plausible) assumption that legally mandated increases in unemployment insurance payments
lead to reductions in the costs workers face in unemployment, because unemployment benefits partially
replace foregone earnings that result from default-induced unemployment. This assumption is supported
by a vast labor literature that finds theoretical and empirical support for the notion that unemployment
insurance compensation is found to have economically meaningful effects on workers’ behavior and
aggregate labor supply (e.g., Topel and Welch 1980; Topel 1984; Meyer 1990; Meyer 1995; Meyer and
Mok 2007; Liu, Gormley, and Zhou 2010). We further verify that changes making state UI benefit laws
more generous are indeed associated with greater state UI payouts, suggesting that changes in legal
mandated benefit allowances are suitable proxies for shocks to worker exposure to unemployment risk.
Increases in the generosity of state unemployment insurance benefits are associated with
increases in firm leverage and interest coverage ratios. Doubling the maximum total UI benefit is
associated with firms maintaining 4.1 percentage points greater average ratios of debt to assets and 15
percent lower interest coverage. These relations are empirically robust. The inclusion of controls for firm
and year fixed effects implies that the results reflect average within-firm changes in capital structure
among firms when their state increases the generosity of its UI system, after accounting for concomitant
national trends. We include a variety of controls for firm financial characteristics and state economic
conditions to ensure that the results are not driven by firm level variation in performance or
macroeconomic factors. We also show that the results are robust to various alternative measures of UI
benefit generosity. Furthermore, the relationship between UI benefits and leverage becomes even
stronger when we exclude firms that have a geographically dispersed workforce for which we are likely to
measure eligible UI benefits with error.
We find that the relation between UI generosity and leverage is particularly stark for subsamples
of firms that are distinguished by various labor market characteristics and worker attributes. The relation
is especially pronounced for firms in industries where workers face greater risk of unemployment, such as
industries that experience frequent layoffs and industries with production technologies characterized by
greater labor intensity. Increases in UI benefits are likely to have larger effects in these firms because of
the greater likelihood that workers will collect benefits due to industry-related layoff incidence.

3
We also find that the relation between UI payments and financing decisions is stronger for firms
in industries that employ low wage employees and workers who are more likely to draw UI benefits.
Because of liquidity constraints, UI benefits are likely to have a greater impact on low wage employees
(Browning and Crossley 2001, Bloeman and Stancanelli 2005, Chetty 2008). Additionally, workers vary
in the speed with which they are able to secure reemployment after job loss, due to either heterogeneous
search costs or firm specific human capital; workers who can quickly find employment after job loss often
do not take up any UI benefits (Anderson and Meyer 1997). Consistent with these ideas, we find that
financing decisions in industries with many low wage workers and likely UI recipients are especially
sensitive to changes in UI benefit laws.
We also find a stronger relation between UI generosity and leverage among firms that face tighter
financing constraints, as measured by low operating cash flows and the absence of dividend payments.
Tight financing constraints make it difficult for firms to raise capital if they experience a negative shock,
raising the probability that such firms must resort to cost cutting through layoffs or reductions in wages
and benefits (Ofek 1993, John, Lang, and Netter 1992). Workers in these firms therefore likely face
greater unemployment risk, and increases in UI generosity should have a greater impact on the financial
policies of these firms, as we document. Collectively, this broad set of evidence is supportive of
theoretical models which predict that firms choose conservative financial policies partly as a means of
mitigating worker exposure to unemployment risk.
We conduct a number of analyses to verify whether our empirical framework identifies the causal
impact of unemployment risk on corporate leverage. An important possibility to consider is that local
economic downturns could simultaneously lead to both states increasing UI benefits and firms increasing
their borrowing. In this scenario, the estimates may capture an endogenous relation rather than a causal
effect of UI benefit changes on leverage. Extensive empirical analysis, however, finds little support for
this hypothesis. First, controls for state unemployment rates and state GDP growth have minimal
attenuating effect on our estimates; thus for an omitted variable to explain the results, the variable would
have to be uncorrelated with these indicators of local economic health. Second, we find that firms show
no signs of unusually low operating profits or other signs of financial distress when benefits increase.
Third, we show that the financing decisions of firms which generate most of their revenue from national
commerce and are hence less likely to be affected by local economic shocks exhibit large, if not larger,
sensitivities to UI laws than firms which generate most of their sales from local, intrastate markets.
Fourth, as a falsification test, we show that bordering states’ UI benefit levels, which would also be
affected by regional economic conditions, are not correlated with firms’ leverage. Additional tests,
described below, also support a causal interpretation of the results.

4
We also explore the empirical relevance of two alternative mechanisms that may explain the
observed link between UI benefits and leverage. One possibility is that increases in unemployment
insurance benefits increase firms’ UI premiums and other costs, leaving them with less money to pay
down debt; but when we examine the impact of increases in UI benefits on operating performance, we
find evidence that increases in UI benefits are actually associated with positive, statistically insignificant
changes in performance. A second possibility is that unemployment insurance impacts the ability of
unionized workers to bargain with management for higher wages, and that in response, firms choose
aggressive financial policies to toughen their bargaining position. We find, however, that the relation
between UI generosity and financial policies is actually stronger for firms with low union coverage.
Finally, we provide numerical estimates of the overall importance of unemployment risk for
firms’ financing decisions. UI benefits can provide substantial compensation to unemployed workers, but
do not fully account for all costs borne by workers during layoff spells. Using data on employment
changes for firms in default and estimates from Topel (1984) on the size of compensation tied to
unemployment risk, we estimate that the ex ante costs of financial distress due to unemployment risk
compensation are quite large: an average BBB-rated firm pays workers about 57 basis points of firm
value to bear layoff risk due to financial distress. For comparison, these costs explain nearly 90% of the
difference between the tax benefits and risk-adjusted ex post costs of financial distress calculated by
Almeida and Philippon (2007).
The central contribution of this paper is to provide novel empirical evidence that worker
unemployment risk significantly impacts firms’ corporate financial policies. The findings strongly
support models, such as Berk, Stanton, and Zechner (2010), where managers choose financial policy
partly as a means of mitigating labor’s exposure to unemployment risk. More broadly, the evidence
suggests that frictions in labor markets affect corporate financial policies, a phenomenon of growing
interest as human capital becomes an increasingly critical asset for firms (Zingales 2000). This paper also
adds to a growing literature analyzing the interactions between labor economics and finance (including
Matsa 2010; Benmelech and Bergman 2009; Chen, Kacperczyk, and Ortiz-Molina 2010; Simintzi, Vig,
and Volpin 2009). While those papers tend to focus on the use of leverage as a strategic input in the
bargaining process between workers and firms, our paper examines a unique channel through which
financial policy is used to mitigate the costs borne by workers resulting from involuntary unemployment.
Section 1 describes our theoretical framework. Section 2 provides institutional background on
unemployment insurance in the United States. Section 3 describes the data and empirical framework.
Section 4 presents the empirical findings, and Section 5 discusses alternative mechanisms. Section 6
provides estimates of the overall importance of unemployment risk for firms’ financing decisions, and
Section 7 concludes.

5
1. Theoretical framework
Workers bear significant costs when they become involuntarily unemployed, including long
delays before securing another job (Katz and Meyer 1990) and significant wage discounts when they
eventually find reemployment (Farber 2005; Gibbons and Katz 1991). These costs could result from
costly job search (Mortensen 1986), layoff discouragement effects (Jahoda 1982), a limited supply of
match-specific job opportunities (Lazear 2003), or other labor market frictions. Whatever the underlying
causes, the impact of these unemployment costs on worker and firm behavior is significant and has been
the subject of extensive study in labor economics. Given the high costs of unemployment, a number of
theoretical and empirical papers find that workers require compensation in the form of higher wages,
additional benefits, or improved working conditions to compensate for unemployment risk, giving rise to
what is commonly referred to as “compensating wage differentials.”
The notion that wage differentials must compensate workers for bearing unemployment risk dates
back to Adam Smith (1776/1976, p.120):
“The wage of labor in different occupations vary with the constancy or inconstancy of employment.…What he earns, therefore, while he is employed, must not only maintain him while he is idle, but make him some compensation for those anxious and desponding moments which the thought of so precarious a situation must sometimes occasion.…The high wages of those workmen, therefore, are not so much the recompense of their skill, as the compensation for the inconstancy of their employment.”
A number of papers formalize these ideas in theoretical models which collectively reach the conclusion
that workers face non-trivial costs of job mobility that impose constraints on short run labor supply.
Because firms cannot credibly commit to fully insure workers against these costs, firms must compensate
workers ex ante to bear these risks (Abowd and Ashenfelter 1981; Topel 1984; Li 1986; Rosen 1986;
Hamermesh and Wolfe 1990). The risks – and thus the size of the compensation – increases with the
probability of unemployment, the degree of worker risk aversion, the duration of job loss, and the costs
incurred by workers during unemployment spells.
A variety of empirical evidence based on worker micro data supports the importance of
compensating wage differentials for unemployment risk. Abowd and Ashenfelter (1981) find that
compensating differentials for unemployment risk vary across industries and are large – up to 14 percent
of total wages – in the presence of significant unemployment risk. Topel (1984) estimates that a
percentage point increase in anticipated unemployment raises an individual’s wage by about 1 percent in
the presence of mean UI wage replacement, and by about 2.5 percent in the absence of any UI
compensation. Li (1986) and Hamermesh and Wolfe (1990) find that 14 to 41 percent of total inter-
industry wage differentials can be explained by differences in unemployment risk.

6
Compensating wage differentials for unemployment risk are likely to affect firms’ optimal
leverage ratios. Financial leverage affects a firm’s probability of financial distress and hence workers’
exposure to layoff risk, as firms in distress are often forced to lay off workers in order to meet outstanding
debt obligations (Ofek 1993; Asquith, Gertner, and Scharfstein 1994). Increasing leverage can therefore
increase the costs required to compensate workers for bearing greater exposure to the risk of financial
distress and unemployment.
These considerations can be understood as an additional term in the tradeoff weighed by firms
when taking on additional leverage:
[ ] [ ] [ ] ExpenseLaborDistressFinancialofCostsNPVShieldTaxNPVIssueDebtNPV Δ++= (1)
In the traditional tradeoff theory of capital structure, a firm issuing debt balances the value obtained from
debt tax shields with the potential value lost should the debt cause the firm to encounter financial distress
(for example, see Graham 2000). The present value of the costs of financial distress are the product of the
probability of financial distress times the magnitude of ex post direct and indirect costs of distress,
discounted at the appropriate discount rate (Almeida and Philippon 2007).
The contribution of this paper is to provide empirical support for the inclusion of an additional
term in the adjusted present value equation that typically characterizes the tradeoff theory of capital
structure. Because debt financing increases the probability of layoffs ex post, it also raises the
compensation premium that workers require ex ante to bear increased unemployment risk. While costs of
financial distress typically refer to ex post costs realized if the firm eventually becomes financially
distressed, the final term in equation (1) represents costs paid ex ante due to labor market frictions.2
Taking on debt can lead workers to require higher wages even if workers do not directly observe
financial leverage decisions. The impact of leverage on unemployment risk is likely to be manifest in
informative signals from coworkers, management, the business press, and other aspects of the economic
environment. In a recent paper, Hortascu, et al. (2010) find that auto dealers and customers respond to
high-frequency fluctuations in manufacturers’ corporate distress risk; if customers can perceive such
changes in distress risk, it is all the more likely that the firm’s employees perceive these changes as well.
That compensating wage differentials do in fact respond empirically to unemployment risk further
supports this conclusion (Abowd and Ashenfelter 1981; Topel 1984; Li 1986; Hamermesh and Wolfe
1990).
In the empirical analysis that follows, we examine changes in workers’ unemployment insurance
benefits as shocks to the final term in equation (1): unemployment insurance benefits reduce the costs
2 Leverage may impose ex ante costs on the firm through the product market as well. For example, Titman (1984) argues that high leverage potentially reduces sales of long-lived goods because customers anticipating a bankruptcy liquidation expect higher costs of parts and servicing.

7
borne by workers during unemployment. Because unemployment is less costly when workers are eligible
for more generous UI benefits, they require a lower compensating differential per unit of layoff risk. For
example, Topel (1984) finds that unemployment insurance significantly reduces wage premiums for
unemployment risk, and estimates that the full replacement of wages by UI payments would cause
compensating wage premiums to decline to zero. Reduced wage premia thus reduce the costs of debt
issuance, and allow firms to raise leverage and gain from increased debt tax shields, lower managerial
agency costs, and other benefits associated with debt financing.
2. The unemployment insurance system in the United States
The unemployment insurance system of the United States provides temporary income to eligible
workers who become involuntarily unemployed and are willing and able to find alternative sources of
employment. Congress created the system as part of the Social Security Act of 1935, in response to the
hardships of job loss experienced during the Great Depression. The Act created a national system of
unemployment insurance but gave each State the autonomy to set many of the program’s parameters. The
joint federal-state structure has led to a system of unemployment insurance where the basic framework of
insurance provision and administration is common throughout the country, yet there is substantial
diversity among the States in taxable wage limits, tax rates, benefit eligibility, and benefit amounts.
There are two primary purposes of unemployment insurance in the U.S. (Blaustein 1993). First,
unemployment insurance benefits are designed to help the individual worker maintain his living standards
during unemployment and to facilitate his ability to find other work. Second, in doing so, unemployment
insurance benefits provide economic stability for the economy, particularly during recessions.
The structure of the unemployment insurance system has not changed much over the last 75
years, but there have been substantive changes in the benefits provided to workers by state governments.
There are three key features of unemployment insurance benefits: eligibility, wage benefit amounts, and
duration. In order to receive unemployment insurance benefits, a worker must be eligible for benefits
according to regulations passed by legislative bodies of the state in which he resides. Typically, all
private sector workers who are involuntarily unemployed and actively seeking new employment are
eligible to receive benefits. The wage benefit provided to an eligible worker by the unemployment
insurance system is set according to formulas determined by state law. A state’s wage benefit formula
typically calculates the highest earnings realized by the worker in 4 of the last 5 quarters, and seeks to
replace approximately 50% of those wages through weekly payments, subject to minimum and maximum
bounds. There is some variation both across states and over time (within states) in the formulas used to
calculate the benefits, but most of the variation comes from changes to the maximum bounds. States also
set the duration (i.e., the number of weeks) for which the claimant is eligible to receive the weekly benefit

8
payment as long as he is still unemployed and looking for work. There is also variation across states and
over time in the number of weeks for which a claimant is eligible to receive UI benefits.
The funds used to finance unemployment insurance provisions come from taxes assessed on
eligible firms in the United States. Currently, almost all firms that employ at least one worker for 20
weeks and maintain minimal levels of base wage payments are subject to unemployment insurance taxes.
Tax rates are “experience rated,” that is, firms that have a greater propensity to lay off workers (and thus
draw more benefits) pay higher tax rates. These taxes are aggregated at the federal and state levels to
finance UI programs. When a claimant files for UI benefits, payments are first made by state
governments; when states exhaust their resources or hit certain rates of aggregate unemployment, they are
eligible to tap federal funds for additional support.
As explained by Blaustein (1993), various factors lead to variation in unemployment insurance
benefits across states and over time. The political process, including political party preferences, lobbying,
and logrolling, plays a dominant role in establishing the generosity of benefits. Popular social trends in
conservatism versus progressivism also affect the outlook of statutory bodies. Economic factors also play
a role; for example, the degree of a state’s industrial urbanization, underlying trends in unemployment
rates, and higher average wage levels are thought to lead states to provide more generous benefits.
UI benefits have a substantial impact on unemployed workers. Gruber (1997) finds that
unemployment insurance provides significant consumption smoothing benefits to workers; in the absence
of unemployment insurance, he estimates that consumption would fall by one-third. Liu, Gormley, and
Zhou (2010) find that unemployment insurance impacts workers’ personal savings and investment
decisions. Increases in unemployment insurance benefits also affect workers’ searches for new
employment and the durations of their unemployment spells (Topel and Welch 1980; Meyer 1990; Meyer
1995; Meyer and Mok 2007). The impact of UI benefits on unemployed workers, in turn, also appears to
have significant effects on firms. For example, managers are more willing to layoff workers when
benefits improve and workers face lower costs of unemployment (Topel 1983).
Changes in the generosity of unemployment insurance benefits thus provide meaningful shocks to
the cost to workers of being laid off. We use these shocks, which feature substantial heterogeneity across
states and over time, to examine whether firms account for workers’ exposure to unemployment risk in
setting financial policies. Variation in unemployment insurance laws affects workers’ expected outcomes
in unemployment without directly impacting the firm itself, thus providing a clean setting to examine the
relationship between financial policy and workers’ exposure to unemployment risk.

9
3. Data and empirical framework
Raw data suggests that worker unemployment costs affect firm financial policy. Figure 1 shows
the industry-level correlation between layoff propensities and market leverage ratios. The worker layoff
separation rates are long-run averages from the U.S. Bureau of Labor Statistics’s Mass Layoff Statistics
(described in more detail below) and average market leverage is from Compustat for 2008. The graph
shows a negative relationship between layoff propensities and leverage. The negative relation is
consistent with greater layoff propensities exposing workers to greater unemployment risk, which in turn
causes managers in these industries to choose conservative financial policies to protect workers from
unemployment. It is also possible, however, that the statistical relationship between layoffs and capital
structure does not actually reflect a causal relationship; high industry volatility, for example, may lead to
both high layoff propensities and conservative financial policies.
To more precisely measure and identify the impact of worker unemployment costs on financial
policy, we collect data on state unemployment insurance benefit laws and firm balance sheet
characteristics. Our information on unemployment insurance benefits is obtained from the U.S.
Department of Labor’s Significant Provisions of State UI Laws from 1950 through 2008. These annual
publications detail the UI benefit schedules in each U.S state. Under each system, eligible claimants
receive a weekly benefit payment for a set number of weeks, where the benefit amount and duration are
determined by the worker’s employment history during a base period. To measure the generosity of each
state’s UI system, we focus on the product of the maximum benefit amount and the maximum duration
allowed.3 The results are robust to other specifications for the generosity of the benefit criteria.
Summary statistics describing the generosity of unemployment insurance benefits are presented
in Table 1. Log max weekly benefit is the log maximum weekly wage benefit allowance given to workers
in an average state-year; the average log wage benefit, unadjusted for inflation, is 5.2 (approximately
$186 per week). Log max duration is the log maximum number of weeks that a state provides
unemployment insurance benefits to claimants; the average sample state-year amount is 3.3
(approximately 26 weeks). Log max total benefit, the log of the maximum number of weeks times the
maximum weekly benefit amount, provides a proxy for the total unemployment insurance benefits that a
UI claimant can receive in a given year (U.S. Congress 2004). Unadjusted for inflation, the average log
max total benefit is 8.5 (approximately $4,876 per year). There is also significant variation across states; 3 Much of the empirical research on UI generosity examines variation across individual workers in the ratio of the weekly UI benefit to weekly wages, called the “wage-replacement ratio.” Although the wage-replacement ratio derives naturally from theoretical models of job search, it varies relatively little either across state programs or over time (Moffitt and Nicholson 1982). Because our study focuses on differences in UI across firms (and we lack employer-employee linked data), we rely on characteristics of UI generosity that display significant variation empirically across states and over time. Because these provisions have proven more flexible in practice, they are also more directly relevant to policymakers.

10
in 2009, for example, the maximum annual total benefit varies from about $6,000 in Mississippi to more
than $28,000 in Massachusetts.
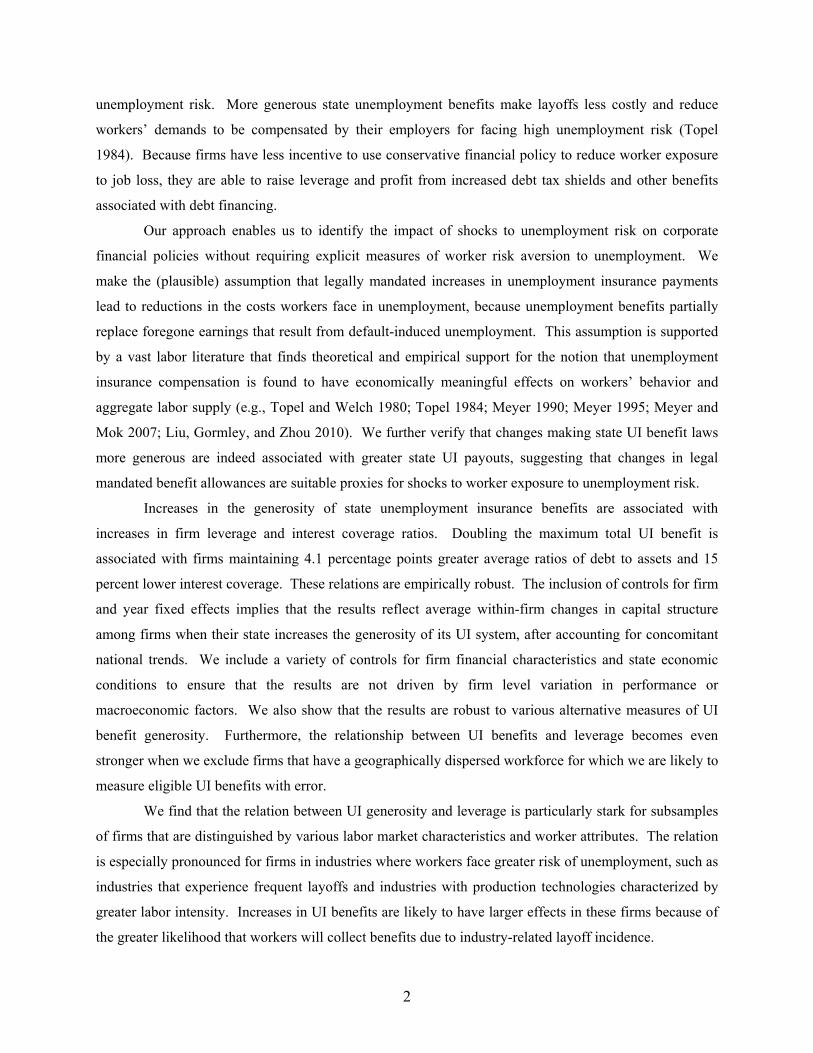
The evolution of state UI benefits over time is depicted graphically in Figures 2 and 3. Figure 2
illustrates relative increases in state maximum unemployment insurance benefits by decade. Each map
corresponds to a different decade and displays the quartile of each state’s increase in UI generosity, where
darker shading indicates larger increases in UI benefits. This is the type of variation in UI generosity that
we exploit in the analysis below. States display significant heterogeneity in relative UI benefit trends
across decades, and within decades, the variation does not appear to be caused by regional trends. The
changes in UI benefits are not dominated by a specific group of states, as at some point in time all states
experience large changes in UI benefit laws relative to their peers. Figure 3 plots the distribution of the
absolute magnitude of the changes in state UI benefit laws over each decade. States typically increase
their UI generosity by 25 to 75 percent over a decade, and much larger increases, such as more than
doubling maximum total benefits, are not uncommon.
There is no indication that states changes UI benefit laws at that same time that they adopt other
laws that impact corporate borrowing. To explore a possible connection, we compare changes in UI
generosity to changes in state corporate income tax rates, perhaps the most important driver of firms’
leverage choices. We obtain historical data on states’ highest marginal corporate income tax rate from the
U.S. Tax Foundation for the years 2000 to 2009. Although the tax rate and log max total benefit display
similar amounts of variation across states and over time, the partial correlation between the series, after
accounting for state and year fixed effects, is only -0.0089 (p ≥ 0.850). The changes in these laws appear
to be unrelated.
The measures of UI generosity that we construct are reflected in the aggregate realized value of
unemployment insurance benefits paid out by states. Using annual data on state UI payments from 1969
(the earliest year available) through 2008 from the U.S. Bureau of Economic Analysis’s (BEA) Regional
Economic Accounts, we regress log total UI compensation on the benefit criteria described above, as well
as controls for macroeconomic conditions and state and year fixed effects. The results, reported in Table
2, indicate that the elasticity of maximum total benefits to actual compensation payments is
approximately 0.9. Aggregate payouts are also correlated with states’ maximum weekly benefit amounts
and maximum duration periods. The correlations are statistically significant and economically
meaningful, and robust to controls for macroeconomic conditions, as represented by the state
unemployment rate (available from the Current Population Survey since 1977) and the GDP growth rate
(from the BEA).
These results complement a large literature in labor economics documenting the effects of
unemployment insurance benefits on the behavior of eligible individuals. Studies show that increases in

11
unemployment insurance benefits significantly affect the duration of workers’ unemployment spells (for
examples, see Moffitt 1985; Meyer 1990; Katz and Meyer 1990; Card 2004). Combined with our
findings about aggregate payouts, these results strongly suggest that the unemployment insurance laws
that we examine in this paper provide substantial assistance to laid-off workers.
To analyze the impact of worker unemployment costs on firms’ financial policies, we combine
our measures of the generosity of states’ unemployment insurance systems with firms’ balance sheet and
income statement information from Compustat. The sample includes all firms (excluding financials and
utilities) with nonmissing observations, which amounts to about 14,000 firms and 140,000 firm-years
over the 1950 through 2008 period. The financial data are winsorized at 1 percent tails, and summary
statistics are reported in Table 1. The ratio of debt to the market value of assets for the average firm is 29
percent.
We use panel regression analysis to examine the connection between UI generosity and financial
policy at the firm-year level. We estimate a typical leverage regression (Rajan and Zingales 1995), and
include the generosity of the UI system of the state where the firm is located as an additional regressor.4
Specifically, let ijtDEBT be a measure of financial leverage at firm i in state j and year t , and
ijtVALUE represent the market value of the firm. We then regress
isttiiststist
ist XBENEFITUIMAXLNVALUEDEBT εωνβα ++++) (= 1 , (2)
where the level of debt as a fraction of the firm’s total value is modeled as a function of the log of the
maximum annual unemployment insurance benefit (as defined above), a set of controls itX , firm fixed
effects iν , and year fixed effects tω . The controls include the financial variables commonly included in
leverage regressions, namely the proportion of fixed assets (a proxy for potential collateral), the market-
to-book ratio (investment opportunities), log sales (firm size), modified Altman’s z-score (probability of
bankruptcy), and return on assets (profitability).5 The firm fixed effects ensure that estimates for 1α
reflect actual changes in benefit generosity and leverage over time rather than simple cross-sectional
4 Firms are assigned to a state based on the company’s headquarters location. If some of a firm’s plants are located in a different state than the firm’s headquarters, then those plants would be subject to a different legal regime. Such mismeasurement may attenuate the results. When we exclude industries likely to have a more dispersed workforce (reported below), the magnitude of the estimates increase. 5 These variables reflect the literature on capital structure, surveyed in Harris and Raviv (1991), and the variables included in cross-sectional analysis in Rajan and Zingales (1995). The modified Altman’s z-score is
assets total
capital working1.2assetstotalearnings retained1.4
assetstotalsales1.0
assets totalEBIT3.3 +++
(MacKie-Mason (1990)).

12
correlations, and the year fixed effects account for transitory economy-wide factors such as aggregate
macroeconomic conditions that could possibly affect both variables. The term itX also includes the state
unemployment rate and the state GDP growth rate to control for contemporaneous local macroeconomic
conditions. Summary statistics for these variables are also presented in Table 1. The estimated standard
errors in all regressions are corrected for clustering at the firm level.
4. Findings
4.1. Unemployment insurance generosity and corporate borrowing
The reduced-form relationship between unemployment insurance benefits and leverage is
depicted graphically in Figure 4. The graph presents the variables’ deviations from annual averages in the
full-sample to account for aggregate time trends. The results are reported for the 6 U.S. states with the
most Compustat firms. The figure shows a positive relationship between UI benefit generosity and
leverage. The comovement of UI benefits and market leverage is striking, even as different states display
vastly different trends in unemployment insurance benefits.
Regression analysis of the relation between the generosity of unemployment insurance laws and
corporate borrowing confirm these results. The estimates, reported in Table 3, show that increases in UI
benefit generosity are associated with increases in financial leverage. The relationship is economically
meaningful and statistically significant: doubling the maximum total UI benefit is associated with 4.1
percentage points greater average leverage (column 1). Controls for firm and year fixed effects ensure
that these results reflect average within-firm changes in capital structure among firms when their state
increases the generosity of its UI system, after accounting for concomitant national economic conditions
and leverage trends. The findings are robust to including financial controls (column 2) and
macroeconomic conditions (column 3).
Workers are covered by the UI regime in the state where they work, whereas our empirical design
measures the UI laws where their employer is headquartered. This disconnect may attenuate our
estimates if some of a firm’s workers are located in a different state than the firm’s headquarters. To
address this issue, we reestimate equation (2) after excluding industries where a large percentage of the
workforce is likely to be geographically dispersed, namely retail, wholesale, and transport. As expected,
excluding these industries increases the estimate of 1α by about a third to 4.1 percentage points (column
4). The results are also robust to using book (instead of market) leverage, although the estimate is slightly
reduced (column 5).
These estimates are economically meaningful. The coefficient estimates for the financial control
variables provide benchmarks for the magnitude of 1α . Doubling the maximum total UI benefit has a

13
similar relationship with total leverage as increasing the proportion of fixed assets by 14 percentage
points or doubling sales. Given that UI generosity varies by a factor of almost five between the most and
least generous states, these magnitudes suggest that UI is quantitatively important in explaining average
leverage.
The value of the tax shield associated with the additional leverage provides another estimate for
the economic magnitude of the relation. Based on the estimate from column (3), doubling the maximum
total UI benefit is associated with 3.0 percentage points greater average leverage. If the average firm
faces an interest rate of 10 percent and marginal tax rate of 25 percent (Graham, Lemmon, and
Schallheim 1998), then the incremenal tax shield totals approximately 0.08 percent of the firm’s assets’
value:
3.0% increase in debt/assets * 10% interest rate * 25% marginal tax rate = 0.08%
For example, for a $2 billion firm, this amounts to $1.5 million. In 2008, the average Compustat firm had
$245,000 in asset value per employee. Thus the value of the incremenal tax shield associated with
doubling the maximum total UI benefit amounts to about $185 per employee for the average firm (i.e.,
0.075% * $245,000 = $185). Although this calculation is only approximate (for example, it may be an
overestimate because it ignores costs of financial distress), it provides an estimate for the additional
wages and benefits workers require to work for a firm with 3.0 percentage points greater average
leverage.
Although much of the academic literature on leverage focuses on the debt-to-asset ratio, for
workers worried about their firm becoming distressed, the most important measure of the firm’s financing
policy is perhaps its interest coverage. Interest coverage (the ratio of operating earnings before
depreciation to interest expense) measures the firm’s ability to use its current profits to cover the interest
payments due on its outstanding debt. Measuring leverage by interest coverage ratios instead of debt
ratios can lead to very different conclusions when a firm is expected to grow. Firms whose cash flows are
expected to grow can appear to have low leverage when measured on a debt-to-asset ratio basis (debt is
low relative to future expected cash flows), but high leverage when measured on an interest coverage
basis (required interest payments are large relative to current cash flows).
The relation between UI benefit criteria and firms’ interest coverage is presented in Table 4.
Following Faulkender and Petersen (2006), we examine interest coverage in logs to account for the
relatively greater importance of changes for low levels of interest coverage.6 As with the debt-to-asset
6 For example, an increase in coverage from 100 to 101 is not as meaningful as an increase from 1 to 2. Following Faulkender and Petersen (2006), we code interest coverage equal to zero when earnings are negative (the ratio is otherwise not well defined) and take the log of one plus interest coverage as the variable of interest. The log transformation also has the advantage of making the distribution more symmetric.

14
ratio, we find that when workers are eligible for greater benefits if unemployed, firms increase their
leverage by maintaining less interest coverage (i.e., they have higher interest expense per dollar of
earnings). The results are both economically and statistically significant: doubling the maximum total UI
benefit is associated with firms maintaining 15 percent lower interest coverage (column 1). The estimates
are robust to including financial controls (column 2) and measures of local macroeconomic conditions
(column 3). Excluding industries where a large percentage of the workforce is likely to be geographically
dispersed increases the estimate’s magnitude to −18 percent (column 4). All of these results for interest
coverage are statistically significant at the 1 percent level.
Across all of the specifications reported in Tables 3 and 4, we find significant associations
between changes in unemployment insurance benefit criteria and firms’ financing policies. Firms appear
to increase total debt as a fraction of assets and maintain lower interest coverage when workers are
eligible to receive higher benefits from state governments during unemployment. The empirical findings
are consistent with the theory that firms boost their financial leverage when workers are better insulated
from unemployment risk.
4.2 Identification analysis
One possible alternative explanation for the findings is that poor local economic conditions, such
as high unemployment, lead both states to adopt more generous UI laws and firms to increase their
borrowing, implying that there may not necessarily be a causal relationship between UI benefits and
leverage. We explore the empirical relevance of this hypothesis in several ways. First, we include
controls for local macroeconomic conditions, namely the state unemployment rate and state GDP growth
rate, and find that the inclusion of these controls has minimal effects on estimates of the association
between UI benefits and leverage (see column 3 of Tables 3 and 4). An omitted variable that explains the
results would have to be uncorrelated with these indicators of local economic conditions.
Second, we point out that although most Compustat firms have relatively localized production
facilities, the revenues of these large, publicly traded firms are typically spread across the country or the
world. For such firms with national product markets, idiosyncratic changes in the economic conditions of
the local areas in which they produce are unlikely to have much effect on their borrowing. Changes in
national economic conditions will affect the demand for their goods which are sold nation- or worldwide,
but these are captured by the year fixed effects.
To evaluate the extent to which local economic shocks may be impacting our results, we gather
data from the 2007 U.S. Commodity Flow Survey to distinguish firms based on the fraction of total
revenues realized from intrastate versus interstate transactions. If changes in UI laws are driven
exclusively by changes in local economic conditions, then the relation between the laws and corporate

15
borrowing should be greatest for firms which generate most of their sales from local, intrastate commerce.
In Table 5, we present regression estimates of the relation between log max UI benefits and firm
financing across samples of firms stratified by the fraction of industry sales that are generated from out-
of-state consumers. The results cast doubt on the importance of residual, omitted local economic shocks
driving the coefficient estimates. We find that the relation between UI generosity and corporate
borrowing is as large, if not larger, when a high fraction of sales are generated out-of-state. Even when
the sample is restricted to industries with more than 85 percent of sales generated out-of-state, max total
UI benefits are associated with a 5.4 percentage point increases in leverage (Panel A, column 6) and a 30
percent reduction in interest coverage (Panel B, column 6).
Third, we examine firms’ profits and find no signs of poor operating performance when benefits
increase. Regression estimates of the relation between log max UI benefits and return on assets are
reported in Table 6. Estimates in column 1 control for only firm and year fixed effects, those in column 2
add controls for the various firm financial characteristics, column 3 also includes controls for local
macroeconomic conditions, and column 4 excludes industries with relatively dispersed workforces.
Across all four specifications, the level of UI benefits has no significant relation to firms’ operating
performance. If anything, the point estimates suggest that increases in UI benefits may be associated with
increases in operating performance.7 These results contradict the notion that poor economic conditions
lead firms to increase their bargaining at the same time that UI benefits improve.
Fourth, we undertake a falsification test whereby we examine the relation between firms’ capital
structures and the generosity of the UI systems in neighboring states. To the extent that a firm’s
operations are concentrated in its headquarter’s state, the generosity of UI benefits in neighboring states
should have no direct effect on the firm. However, if heterogeneity in regional economic conditions
(orthogonal to our controls for state unemployment and GDP growth) affect UI benefit laws in the firm’s
state, then benefit laws in bordering states are likely to be affected as well. In this scenario, including
bordering states’ benefit criteria as additional controls in equation (2) would reduce estimates of 1α . To
the contrary, the results reported in Table 7 find that our estimates of the relation between UI laws and
firms’ borrowing are unaffected by these controls. For both leverage (columns 1 and 2) and interest
coverage (columns 4 and 5), the coefficient on log max total benefit is the same with and without controls
for bordering states’ UI benefits. Furthermore, even when we exclude controls for the generosity of
benefits in the firm’s home state, the relation between bordering states’ benefits and leverage is relatively
small and statistically insignificant; for interest coverage, the estimate suggests the relation is only one-
7 Furthermore, the coefficients weakly increase in absolute magnitude as more control variables are added to the regression, suggesting that the lack of a negative estimated coefficient does not stem from empirical misspecification or omitted variable bias.

16
sixth as large as 1α̂ (column 6). We conclude that the relation between home UI benefits and financing
decisions do not appear to be driven by an omitted regional economic shock.
Fifth, the results are robust to using other measures of UI generosity. During periods of high
unemployment, it is not uncommon for states (or the federal government) to adjust UI benefits by
increasing the duration over which benefits can be drawn. The basic “extended benefits” program, which
was enacted by Congress in 1970, provides up to 13 additional weeks of benefits when a state is
experiencing high unemployment.8 During these extensions, the criteria for weekly benefit amounts are
not affected. To minimize concerns about omitted variables, we deliberately exclude these extended
benefits from our calculations of maximum duration or total potential benefits used in this paper.
Nevertheless, it is possible that even some permanent changes in benefit duration may be motivated by
local economic shocks, so we separately examine the associations with leverage of weekly benefit
allowances and benefit durations. Table 8 shows the correlation between maximum weekly benefits or
maximum duration and financial leverage after controlling for financial covariates and macroeconomic
indicators. Of the four estimates shown, all are sizable in magnitude and three are statistically significant
at conventional confidence levels. Both weekly benefit levels and benefit duration are strongly correlated
with firms’ financing policies.
4.3 Importance of labor market characteristics
Theory suggests that increases in UI benefits impact corporate financing decisions through their
effects on workers’ exposure to unemployment risk. Because workers face non-trivial costs from
unemployment, they require a compensating premium in wages unless firms choose conservative
financial policies that reduce the risk of financial distress and layoffs. More generous state
unemployment benefits make layoffs less costly for workers and enable managers to attract workers even
with higher leverage. Under this model, we would thus expect to find a stronger relationship between UI
benefits and corporate financial policies in industries that are more likely to be affected by labor
unemployment risk. This section evaluates this hypothesis by separately examining industries with
varying propensities to layoff workers and industries with production technologies of varying labor
intensity.
Historically, layoffs are much more common in some industries than others. Differences in the
long-run propensity for layoffs likely result from structural differences, such as the variability of demand
and flexibility of production technologies. We calculate layoff propensities at the three-digit NAICS
industry level using data from the U.S. Bureau of Labor Statistics’s Mass Layoff Statistics for 1996
8 Some states have also adopted a voluntary program to pay up to 7 additional weeks of extended benefits during periods of extremely high unemployment.

17
through 2008. We count the number of workers being separated from their jobs during extended mass
layoffs, defined by the BLS as when at least 50 initial claims are filed against an establishment during a
consecutive 5-week period and at least 50 workers have been separated from their jobs for more than 30
days. For each industry-year, we take the ratio of such separations to total industry employment (from the
BEA), and then obtain the industry layoff separation rate by taking the simple average of these ratios over
the full sample period.
A listing of the layoff separation rate in each industry is presented in Appendix Table A1. The
average layoff separation rate is 1.5 percent (median is 0.8 percent), subject to substantial variation across
industries. Separation rates are less than 0.1 percent in seven industries including real estate, various
health care services, and auto parts dealers; the highest separation rates are in agriculture and forestry
support activities (18.4 percent), passenger ground transportation (5.9 percent), and heavy construction
(5.7 percent).
To exploit variation in the probability of layoffs across industries, we divide our main sample of
firms into two groups based on whether their industry’s layoff separation rate is above or below the
sample median. Then we repeat our analysis of UI generosity and leverage separately for each group of
firms. The results are reported in Table 9.
We find that the relation between maximum total UI benefits and firms’ financial leverage is
statistically significant only in the sample with high layoff separation rates. Point estimates are at least
twice as high when layoff propensities are high, compared to when they are low. Doubling the maximum
total UI benefit is associated with a 4.1 percentage point increase in leverage in industries facing a high
probability of layoffs (p < 0.05; column 1), compared to a 1.7 percent increase (statistically insignificant)
in low layoff industries (column 5). Similarly, doubling the maximum total UI benefit is associated with
a 21.8 percent reduction in interest coverage in industries with a high probability of layoffs (p < 0.01;
column 2), compared to a 4.2 percent decrease (statistically insignificant) in low layoff industries (column
6). Consistent with theory, the findings indicate that the relation between UI generosity and firm financial
policy is especially strong when workers face greater layoff risk.
UI benefits are also more likely to affect financing decisions among firms that are more labor
intensive. Financial leverage increases the probability of layoffs and the compensation required by each
individual worker to bear unemployment risk. The aggregate labor-related costs resulting from increased
leverage grow when firms are more labor intensive, because unemployment risks and the associated
compensation levels are multiplied across a greater number of workers. Managers of firms which rely
heavily on human capital in the production process are thus more likely to take account of worker
unemployment costs when making financing decisions. We measure labor intensity by the ratio of labor
and pension expense to sales. Using Compustat data, we calculate the average labor intensity in 3-digit

18
NAICS industries among firms that report their labor costs, and then divide our main sample of firms into
two groups based on whether their industry’s labor intensity is above or below the sample median.
Finally, we repeat our analysis of UI generosity and leverage separately for each group of firms. The
results are reported in Table 9.
We find that the impact of UI benefits on financing decisions of firms with above-median labor
intensity is economically large and statistically significant. Doubling the maximum total UI benefit is
associated with a 3.7 percentage point increase in leverage and a 20 percent reduction in interest coverage
in labor intensive industries (columns 3 and 4). In contrast, the relation between UI benefits and firm
financing is smaller and statistically insignificant in industries with below median labor intensity
(columns 7 and 8). The findings illustrate that the link between UI benefits and firm financing decisions
is particularly evident in industries where workers are an especially important component of the firm’s
production process.
4.4 Importance of worker characteristics
We also test whether the relation between unemployment insurance and firms’ financing
decisions is stronger in industries with worker characteristics that are likely to make unemployment
insurance especially important. Because of liquidity constraints, unemployment is particularly costly for
workers with limited savings. Browning and Crossley (2001) and Bloemen and Stancanelli (2005) find
that the consumption smoothing benefits of UI are concentrated wholly among individuals who have no
assets at the time of job loss; and Chetty (2008) concludes that 60 percent of the increase in
unemployment durations caused by UI benefits is due to liquidity constraints rather than distortions in
marginal incentives to search. UI benefits are thus more likely to affect financing decisions in firms
where many workers receive low wages, as lower wage workers are likely to have smaller savings and are
especially vulnerable to liquidity constraints after job loss.
We empirically test whether the impact of UI benefits on firm financing decisions is stronger for
industries with high fractions of low wage workers. Using the 2000 U.S. Population Census, we calculate
the percentage of workers in each 3-digit NAICS industries with less than $40,000 in annual income, and
then divide our main sample of firms into two groups based on whether their industry is above or below
the sample median for low wage workers. We again repeat our analysis of UI generosity and leverage
separately for each group of firms. The results are reported in Table 10.
Consistent with the hypothesis, the relationship between UI benefits and leverage is concentrated
among industries with a high proportion of low wage workers. Doubling the maximum total UI benefit is
associated with a 4.2 percentage point increase in leverage and an 18.1 percent reduction in interest
coverage in industries with above median low wage workers (columns 1 and 2). In contrast, the relation

19
between UI benefits and firm financing decisions is smaller in industries with fewer low wage workers,
although the estimate for interest coverage is statistically significant (columns 5 and 6).
UI benefit levels are also more likely to affect financing decisions in industries where workers
more frequently claim benefits when they become unemployed. The speed with which workers are able
to secure reemployment after a layoff varies across industries, perhaps due to heterogeneous search costs
or because some workers face limited demand for their specific skills and human capital. Furthermore,
when workers regain employment after a layoff, they are no longer eligible for benefits, and many
workers who expect to find employment quickly often do not take up benefits at all (Anderson and Meyer
1997). Firms whose workers are likely to claim UI benefits when they are laid off are thus likely to be
especially sensitive to changes in UI laws when making financing decisions.
To test this hypothesis, we use the Current Population Survey to calculate the fraction of workers
in each 2-digit SIC industry that receive income from unemployment insurance in each year the data are
available – from 1988 through 2008. We obtain industry rates of unemployment insurance usage by
averaging across years, weighting by the number of observations to reduce sampling variance. We then
separate industries into two groups based on whether the fraction of workers receiving UI income is
above or below the sample median. The results are presented in Table 10.
Columns 3 and 4 indicate that the relation between unemployment insurance and corporate
capital structure is stronger for industries with above median fractions of workers receiving payments
from unemployment insurance. In addition to any difference in layoff propensities, unemployed workers
in these industries appear more likely to draw unemployment benefits when they become unemployed.
Doubling the maximum total UI benefit is associated with a 4.1 percentage point increase in leverage and
an 16.2 percent reduction in interest coverage for firms in these industries. In contrast, the relation
between UI benefits and firm financing decisions is smaller in industries with relatively few UI recipients
(columns 7 and 8). These findings offer further empirical support that the relation we find between UI
benefits and financing decisions appears to result from firms using conservative financial policies to
mitigate worker exposure to unemployment risk.
4.5 Importance of firm financial constraints
The relation between UI generosity and firms’ financial policies should, in theory, also be
stronger among financially constrained firms. Workers’ concerns about job loss are likely to be
heightened when firms are unable to raise external financing to buffer negative economic shocks, because
many firms respond to performance declines by laying off workers (Ofek 1993, John, Lang, and Netter
1992). Increased unemployment risk due to financing frictions leads workers to require even higher wage
premiums to stay at work and places strong pressure on firms to maintain conservative financial policies,

20
but UI benefits can ease the pressure by reducing workers’ expected costs of unemployment. To explore
these implications, we groups firms based on indicators of financial constraints and examine the relation
between UI benefits and corporate finance separately for each group. The results are reported in Table
11.
We start by classifying firms based on their dividend policy. There is a long tradition of using
firms’ observed payout practices to identify financially vulnerable firms that are likely to face relatively
high costs of external finance (Fazzari, Hurbbard, and Petersen 1988; Kaplan and Zingales 1997). Firms
that need to retain all of their capital are more likely to be financially constrained; their workers therefore
face greater unemployment risk. Among these firms, we find that the relation between the generosity of
UI benefits and firms’ financial leverage is particulary strong: doubling the maximum total UI benefit is
associated with a 5.0 percentage point increase in leverage (column 1) and a 28.9 percent decrease in
interest coverage (column 2). Firms that can afford to pay dividends, on the other hand, are less likely to
be at risk of financial distress, and there is no discernable relationship between UI generosity and either
measure of leverage among these firms (columns 5 and 6).
Similar results are obtained when we divide the sample based on other measures of financial
vulnerability, such as operating cash flows. Firms with low cash flows are potentially less able to pledge
capital to outside investors, thus making it more difficult to raise external financing. We find that UI
generosity is linked with greater leverage (column 3) and lower interest coverage (column 4) among firms
with low cash flows; the relationship is weaker among high-cash flow firms, which are likely to be less
prone to financial distress and are able to provide improved job security for workers (columns 7 and 8).
Collectively, these findings suggest that firms facing tighter financing constraints are more likely to take
worker unemployment costs into account when setting financial policy, as limited access to external
financing exacerbates workers’ unemployment risk during difficult economic times. These results further
strengthen our conclusion that firms use conservative financial policies partly to mitigate worker exposure
to unemployment risk.
5 Alternative mechanisms
5.1 Pure cash flow effect
As described in Section 2, firms pay premiums for their workers’ unemployment insurance.
When UI benefits increase, firms’ premium costs increase as well. With less money to pay down debt,
these additional costs could weaken firms’ financial positions, increasing leverage and reducing cash and
corporate liquidity. In this scenario, the observed relation between UI benefits and leverage may
represent purely a cash flow effect of UI generosity and not a response to workers’ unemployment risk.
UI generosity, therefore, may “mechanically” increase debt by reducing profits.

21
It is not obvious, however, that UI benefits reduce a firm’s resources on net. Although premium
costs increase, workers require less compensation for unemployment risk in wages, benefits, or workplace
amenities that are costly for the firm to provide. In fact, if workers are risk averse and UI premiums are
actuarially fair, then more generous unemployment benefits could make firms better off. Thus, the impact
of UI generosity on firm profitability is an empirical question.
We address this hypothesis in two ways. First, the results reported above are robust to adding
financial controls, including return on assets – a proxy for profitability (see column 2 of Tables 3 and 4).
Although the controls are imperfect, the fact that the point estimates are unaffected by their inclusion
suggests that the observed increases in leverage are not attributable to a mechanical cash flow effect.
Second, we examine the impact of changes in UI benefit laws directly on accounting performance. If
increases in UI benefit laws cause firms’ costs to increase on net, their operating performance should
decrease as profits are dissipated through higher UI premiums and related costs. As reported in Table 6,
the level of UI benefits has no significant relation to firms’ operating performance, and if anything, the
point estimates suggest that increases in UI benefits may be associated with increases in operating
performance. Thus both sets of evidence contradict the notion that UI benefits may affect financial policy
through mechanical increases in firms’ costs.
5.2 Strategic leverage
Another possibility is that UI benefit laws affect financial policy by impacting workers’ outside
options. If increases in unemployment insurance benefits raise the reservation utility of employed
workers, this could improve the bargaining position of workers to extract higher wages. An optimizing
firm may respond by increasing leverage as means of maintaining a tougher bargaining stance with
workers (Bronars and Deere 1991; Matsa 2010). In this scenario, the financial policies associated with
increases in UI benefits, documented above, could reflect changes in the worker-firm bargaining
environment rather than a corporate response to workers’ unemployment risk.
A large literature in labor economics finds that unemployment spells last longer when UI benefits
are more generous (for examples, see Moffitt 1985; Meyer 1990; Katz and Meyer 1990; Card 2004). Part
of this may be because the unemployed worker puts less effort into search, but part also may be because
the worker is reluctant to take a job unless the wages, benefits, and other amenities are adequate. In other
words, more generous UI benefits increase an unemployed worker’s reservation utility (until benefits
expire).
Whether improvements in unemployment insurance benefits also raise the reservation utility of
employed workers depends on how they bargain and their states’ rules governing claimant eligibility for
UI benefits. An individual worker who refuses to work because his employer denied him a raise would

22
almost always not be eligible for UI benefits. UI generosity is thus less likely to affect bargaining power
for workers who bargain individually. In some states, however, UI generosity may affect wage
negotiations for unionized workers. While eligibility rules generally exclude striking workers from
collecting UI benefits, many states allow those unemployed because of a labor dispute to collect
unemployment insurance benefits under specific (but not usual) conditions.
One such eligibility, the work stoppage provision, permits strikers to collect unemployment
benefits during a labor dispute if their employer continues to operate at or near normal levels. In a sense,
a work stoppage provision provides strikers with insurance for a failed strike, because it allows striking
workers to collect benefits only if employers succeed in weathering the strike and continue to operate at
or near normal levels. Consistent with work stoppage provisions improving workers’ bargaining position,
Hutchens, Lipsky, Stern (1989) find that their repeal is associated with less frequent strike activity in
states with relatively generous unemployment insurance programs, and Matsa (2010) finds that firms
respond to their repeal by reducing leverage.
To evaluate whether the corporate financial policies associated with increases in UI benefits
appear to reflect changes in the worker-firm bargaining environment, we repeat our analysis separately
for industries with high and low union presence. We classify industries based on the percentage of their
workforce covered by collective bargaining agreements in 1983.9 The results are reported in Table 12.
The strategic leverage hypothesis predicts that the relation between UI generosity and corporate
financial policies should be concentrated among firms in highly unionized industries. In contrast, we find
the relationship between UI benefits and leverage to be, if anything, stronger among firms in low union
industries. Doubling the maximum total UI benefit is associated with a 4.3 percentage point increase in
leverage and an 22.7 percent reduction in interest coverage in industries with low union coverage
(columns 3 and 4). In contrast, the relations between UI benefits and firm financing are slightly smaller
and statistically insignificant in industries with higher union coverage (columns 1 and 2). We conclude
that the connection between UI and leverage does not appear to be driven by worker bargaining.
6. Overall importance of unemployment risk for leverage
Our analysis thus far analyzes the impact of workers’ unemployment risk on firms’ capital
structures using reduced-form estimates of the effects of exogenous changes in states’ UI benefit laws.
Government insurance, however, only partially reduces a worker’s risk of unemployment. UI typically
9 Industries with at least 25 percent of workers covered by collective bargaining are classified as high union; industries with less than 25 percent are low union. Data on union coverage is from Hirsch and Macpherson (2003), based on a sample of employed wage and salary workers, ages 16 and over, from the Current Population Survey Outgoing Rotation Group Earnings Files for 1983, and are matched to SIC industry classifications using U.S. Bureau of Census (1989).

23
replaces at most half of a worker’s wages (irrespective of state benefit ceilings), so even workers facing a
generous UI system will still demand a modest wage premium for bearing residual unemployment risk.
To provide a more comprehensive measure of unemployment risk’s effect on firms’ financing decisions,
this section develops numerical estimates for the present value of excess labor costs associated with using
leverage.
Labor unemployment risk primarily affects capital structure by raising firms’ wage costs as they
increase financial leverage. To estimate these costs, we use results from Altman (2007) to assess the
default probabilities associated with each rating, and Topel (1984) for the increase in wages required to
compensate workers for bearing a unit of unemployment risk. For each credit rating, we calculate the
additional labor costs required to compensate workers for their expected loss in utility should the firm
default.
For this calculation, the key missing information among existing estimates is the unemployment
risk associated with financial distress. We calculate the probability of being laid off conditional on
default using data on bond defaults from 1977 to 2008, from the Altman-NYU Salomon Center Corporate
Bond Default Master Database. For each default, we gather employment data for the issuer from
Compustat, and calculate the percentage change in employment in a window from the one year before to
one year after the default event.10 For issuers with multiple defaults, we analyze employment changes
around the first event. The results are reported in Table 13, Panel A.
Among the 283 firms for which employment data are available in the immediate years around
default, employment decreases by approximately 27 percent in the 2 years surrounding default. On
average, about half of the decrease occurs in the year before the default while the remainder occurs in the
year after. These estimates are lower bounds, however, because employment reductions are likely to be
greater among firms that delist after default and are missing employment data in Compustat. Of such
firms, 31 enter bankruptcy. Hotchkiss (1995) finds that the median firm entering bankruptcy suffers a 50
percent reduction in employment between the last fiscal year prior to bankruptcy and the first fiscal year
after emerging. Applying this estimate in our sample (and dropping the remaining firms with missing
data), the average decrease in employment around default is 29 percent. Alternative assumptions about
employment changes for firms with missing data lead to similar overall measures of workforce
adjustments around default.
To verify that our measures of employment change are related to financial distress rather than
economic distress, we also examine the contemporaneous change in employment among other Compustat 10 Compustat data allows us to calculate net changes in employment around a default event. If these firms are also hiring employees during the period, our estimates will understate the gross flow out of employment. On the other hand, our estimates may be too high if some firms might have laid off workers even in the absence of distress.

24
firms in the same 2-digit SIC industry as each defaulting issuer. These industry-level employment
changes capture average workforce adjustments related to economic distress under the assumption that
economic distress affects all firms within an industry. As reported in Panel A, the average industry
employment change is +3 percent in the years surrounding default.11 The estimates across various
windows show little sign of economic distress causing layoffs among other firms. The positive
counterfactual employment growth among comparable firms suggests that we may even be
underestimating employment changes related to financial distress.
When a firm increases leverage, it increases the probability of default and exposes workers to a
greater probability of job loss. Topel (1984) finds that, for every additional percentage point in
unemployment risk, average equilibrium wages increase by 0.93 percent. This effect is moderated by the
unemployment insurance system; Topel estimates that compensating wage differentials would increase to
2.5% in the absence of UI benefits.12 The average value of the compensating wage premium, ω , per
dollar of assets is then given by applying the average firm’s labor intensity and capitalizing the annual
wage premium:
prA
Lp
A D +
Π=
υω
where p is the probability of default, υ is the probability of unemployment conditional on default, Π is
the per-unit required wage premium, L is labor expense, A is the market value of assets, and rD is the
expected return on debt.13
Estimates of the compensating wage premium are presented in Panel B of Table 13. Each row
corresponds to a different credit rating. While wage premiums among highly rated firms are minimal
(e.g., about 4 basis points of firm value for a AA-rated firm), they are substantially larger among more
highly leveraged firms. For example, a BBB rating, which corresponds to a leverage ratio of about 0.33
(see Molina (2005)), requires a firm to pay about 57 basis points of firm value in additional wages in the
presence of UI, and about 154 basis points in the absence of UI compensation. For a BB rating (leverage
11 This measure is precisely estimated; using more narrow industry classifications yields similar albeit noisier results. For example, restricting attention to firms in the same 4-digit SIC industry reveals an average contemporaneous employment change of 8% around default for sample firms. 12 Using worker micro data from the Current Population Survey, Topel (1984) exploits differences in job loss rates across industries and regions to estimate the impact of unemployment risk on wages, controlling for demographic, industry, and policy-related factors. 13 We use the historical default probability (Altman 2007) and spread over treasuries (Almeida and Philippon 2007) associated with each credit rating. The average ratio of annual labor expenses to market value of assets in Compustat from 1950 through 2008 is 25.6 percent. Following Almeida and Philippon (2007) and others, we assume the firm maintains a constant leverage ratio (and wage premium) until it defaults, at which point future wage premiums, distress costs, and tax shields are zero.

25
ratio of about 0.46), these figures jump to about 112 basis points with UI and 301 basis points without it.
These estimates suggest that compensating wage premiums for unemployment risk can present substantial
ex ante costs of increasing financial leverage.
These estimates provide a lower bound, as our employment figures do not capture layoffs that
that occur in financial distress in the absence of default. Estimates of employment changes around
default, reported in Panel A of Table 13, show that firms reduce employment by 15 percent in the year
before a default. Distressed firms that are able to avoid default likely reduce employment as well. The
full impact of distress related unemployment risk, therefore, is higher than these estimates imply.
For comparison, we also present estimates of expected ex post costs of financial distress and
marginal tax benefits as reported by Almeida and Philippon (2007, Table VI), based on estimates from
Andrade and Kaplan (1998), Graham (2000), Molina (2005), and their own analysis.14 Using risk-neutral
default probabilities, a BBB rating is associated with ex post financial distress costs of about 4.53% of
firm value. The tax benefits associated with a BBB rating are about 5.18% of firm value. The difference
between estimated debt tax shields and ex post risk-adjusted costs of financial distress is about 0.65%
percent of firm value. For a BBB-rated firm, our estimates indicate that ex ante compensating wage
premiums account for almost 90 percent of the difference between tax shields and ex post costs of
financial distress (i.e., 0.57% of the 0.65% in firm value).
These results show that the ex ante wage costs associated with financial leverage changes
represent a significant costs to shareholders. The size of the compensating wage premium grows as firms
increase leverage, exposing themselves to potential financial distress and their workers to greater
unemployment risk. The estimates imply that labor unemployment risk is an important determinant of
firms’ capital structures, particularly when government-provided unemployment insurance compensation
is limited, leaving workers uninsured against the costs of layoffs.
7. Conclusion
This paper examines the impact of workers’ unemployment risk on corporate financing decisions.
Exploiting variation in unemployment insurance benefit levels as shocks to worker unemployment costs,
we find that reductions in labor unemployment risk are associated with increases in corporate leverage.
Estimates indicate the average wage compensation for unemployment risk totals about 57 basis points of
firm value for a BBB-rated firm. The impact of unemployment risk is particularly strong for firms in
industries where layoffs occur with high frequency, for firms that produce with greater labor intensity,
14 We present these comparisons to help gauge the importance of unemployment risk relative to oft-cited measures of debt financing costs and benefits. Other costs and benefits of leverage include considerations related to agency costs, asymmetric information, and stakeholder bargaining.

26
and for sectors that employ workers with low wages and high UI utilization rates. The relation between
unemployment risk and financial policy is also stronger among firms facing tight financial constraints.
The findings illustrate that firms choose conservative financial policies partly as a means of
mitigating workers’ exposure to unemployment risk, supporting models such as Berk, Stanton, and
Zechner (2010). Reducing leverage decreases the probability that a firm will encounter financial distress
and subject workers to costly layoffs. By reducing leverage, managers are able to lower the wage bill
required by workers as compensation for bearing unemployment risk. More broadly, in contrast to
standard assumptions in finance, the evidence suggests that labor market frictions are an important feature
of the corporate environment. Debt policy is but one of many ways for firms to mitigate workers’
unemployment risk. Firms can also reduce the probability of distress by taking less risky projects, or
reduce workers’ losses in distress by redesigning job tasks to require fewer firm-specific skills (Jaggia
and Thakor 1994). Exploring the implications of unemployment risk on additional corporate policies is
an interesting area for future empirical research.
References
Abowd, John and Orley Ashenfelter, 1981, Anticipated Unemployment, Temporary Layoffs, and Compensating Wage Differentials, in Sherwin Rosen, ed.: Studies in Labor Markets (University of Chicago Press, Chicago).
Almeida, Heitor, and Thomas Philippon, The Risk-Adjusted Cost of Financial Distress, Journal of Finance 62, 2557-86.
Altman, Edward, 2007, About Corporate Default Rates, NYU Salomon Center, Special Report.
Anderson, Patricia M., and Bruce D. Meyer, 1997, Unemployment Insurance Takeup Rates and the After-Tax Value of Benefits. Quarterly Journal of Economics 112, 913-937.
Andrade, Gregor, and Steven Kaplan, 1998, How Costly is Financial (not Economic) Distress? Evidence from Highly Leveraged Transactions that Become Distressed, Journal of Finance 53, 1443-1493.
Asquith, Paul, Robert Gertner, and David Scharfstein, 1994, Anatomy of Financial Distress: An
Examination of Junk-Bond Issuers, The Quarterly Journal of Economics 109, 625-658.
Benmelech, Effi, Nittai Bergman, and Ricardo Enriquez, 2010, Negotiating with Labor under Financial Distress, Harvard University.
Berk, Jonathan, Richard Stanton, and Josef Zechner, 2010, Human Capital, Bankruptcy, and Capital Structure, Journal of Finance 65.
Blaustein, Saul J., 1993. Unemployment Insurance in the United States: The First Half Century (W. E. Upjohn Institute for Employment Research, With Wilbur J. Cohen and William Haber. Kalamazoo, Mich.).
Bloemen, Hans G., and Elena G. F. Stancanelli, 2005, Financial Wealth, Consumption Smoothing and

27
Income Shocks Arising from Job Loss, Economica 72, 431-52.
Bronars, Stephen G., and Donald R. Deere, 1991, The Threat of Unionization, the Use of Debt, and the Preservation of Shareholder Wealth, Quarterly Journal of Economics 106, 231-254.
Browning, Martin, and Thomas F. Crossley, 2001, Unemployment Insurance Benefit Levels and Consumption Changes, Journal of Public Economics 80, 1-23.
Card, David, and Phillip B. Levine, 2000, Extended Benefits and the Duration of UI Spells: Evidence from the New Jersey Extended Benefit Program, Journal of Public Economics 78, 107-138.
Chemmanur, Thomas and Yingmei Cheng and Tianming Zhang, 2009, Capital Structure and Employee Pay, Working Paper.
Chen, Jason, Marcin Kacperczyk, and Hernan Ortiz-Molina, 2010, Labor Unions, Operating Flexibility, and the Cost of Equity, Journal of Financial and Quantitative Analysis, forthcoming.
Chetty, Raj, 2008, Moral Hazard versus Liquidity and Optimal Unemployment Insurance, Journal of Political Economy 116, 173-234.
Farber, Henry S., 2005, What Do We Know about Job Loss in the United States? Evidence from the Displaced Workers Survey, 1984-2004, Federal Reserve Bank of Chicago Economic Perspectives 29, 13-28.
Faulkender, Michael, and Mitchell A. Petersen, 2006, Does the Source of Capital Affect Capital Structure?, Review of Financial Studies 19, 45-79.
Fazzari, Steven M., Robert Glenn Hubbard, and Bruce C. Petersen, 1988, Financing Constraints and Corporate Investment, Brookings Papers on Economic Activity n1, 141-95.
Gibbons, Robert, and Lawrence F. Katz, 1991, Layoffs and Lemons, Journal of Labor Economics 9, 351-380.
Graham, John R., 2000, How Big Are the Tax Benefits of Debt?, Journal of Finance 55, 1901-1941.
Graham, John R., Michael L. Lemmon, and James S. Schallheim, 1998, Debt, Leases, Taxes, and the Endogeneity of Corporate Tax Status, Journal of Finance 53, 131-62.
Gruber, Jonathan, 1997, The Consumption Smoothing Benefits of Unemployment Insurance, The American Economic Review 87, 192.
Hamermesh, Daniel S. and John R. Wolfe, 1990, Compensating Wage Differentials and the Duration of Wage Loss, Journal of Labor Economics 8 (1, Part 2), S175-S197.
Harris, Milton, and Artur Raviv, 1991, The Theory of Capital Structure, Journal of Finance 46, 297-355.
Hirsch, Barry T., and David A. Macpherson, 2003, Union Membership and Coverage Database from the Current Population Survey: Note, Industrial and Labor Relations Review 56, 349-54.
Hortascu, Ali, Gregor Matvos, Chad Syverson, and Sriram Venkataraman, 2010, Are Consumers Affected by Durable Goods Makers’ Financial Distress? The Case of Auto Manufacturers, University of Chicago.
Hotchkiss, Edith S., 1995, Post-Bankruptcy Performance and Management Turnover, Journal of Finance 50, 3-21.
Hutchens, Robert, David Lipsky, and Robert Stern, 1989. Strikers and Subsidies: The Influence of Government Transfer Programs on Strike Activity (W. E. Upjohn Institute for Employment Research, Kalamazoo, Mich.).
Jaggia, Priscilla Butt and Anjan V. Thakor, 1994, Firm-Specific Human Capital and Optimal Capital

28
Structure, International Economic Review 35 (2), 283-308.
Jahoda, Marie, 1982, Employment and Unemployment: A Social Psychological Analysis (Cambridge University Press, Cambridge, U.K.).
John, Kose, Larry H.P. Lang, and Jeffry Netter, 1992, The Voluntary Restructuring of Large Firms in Response to Performance Decline, Journal of Finance 47, 891-917.
Kaplan, Steven N., and Luigi Zingales, 1997, Do Investment-Cash Flow Sensitivities Provide Useful Measures of Financing Constraints, Quarterly Journal of Economics 112, 169-215.
Katz, Lawrence F., and Bruce D. Meyer, 1990, The Impact of the Potential Duration of Unemployment Benefits on the Duration of Unemployment, Journal of Public Economics 41, 45-72.
Lazear, Edward P., 2003, “Firm-Specific Human Capital: A Skill-Weights Approach,” NBER Working Paper No. w9679.
Li, Elizabeth H., 1986, Compensating Differentials for Cyclical and Noncyclical Unemployment: The Interaction between Investors’ and Employees’ Risk Aversion, Journal of Labor Economics 4 (2), 277-300.
Liu, Hong, Todd A. Gormley, and Guofu Zhou, 2010, Limited Participation and Consumption-Saving Puzzles: A Simple Explanation and the Role of Insurance, Journal of Financial Economics.
Luo, Micheal, and Megan Thee-Brenan, 2009, Poll Reveals Trauma of Joblessness in U.S., New York Times, December 15.
MacKie-Mason, Jeffrey K., 1990, Do Taxes Affect Corporate Financing Decisions?, Journal of Finance 45, 1471-93.
Matsa, David A., 2010, Capital Structure as a Strategic Variable: Evidence from Collective Bargaining, Journal of Finance 65.
Meyer, Bruce D., 1990, Unemployment Insurance and Unemployment Spells, Econometrica 58, 757-782.
Meyer, Bruce D., 1995, Lessons from the U.S. Unemployment Insurance Experiments, Journal of Economic Literature 33, 91-131.
Meyer, Bruce D., and Wallace K. C. Mok, 2007, Quasi-Experimental Evidence on the Effects of Unemployment Insurance from New York State (National Bureau of Economic Research, Inc, NBER Working Papers: 12865).
Moffitt, Robert, 1985, Unemployment Insurance and the Distribution of Unemployment Spells, Journal of Econometrics 28, 85-101.
Moffitt, Robert, and Walter Nicholson, 1982, The Effect of Unemployment Insurance on Unemployment: The Case of Federal Supplemental Benefits, Review of Economics and Statistics 64, 1-11.
Molina, Carlos, 2005, Are Firms Underleveraged? An Examination of the Effect of Leverage on Default Probabilities, Journal of Finance, 60, 1427-1459.
Mortensen, Dale, 1986, Job Search and Labor Market Analysis, in Handbook of labor economics, Volume 2, edited by Orley Ashenfelter, Richard Layard, P. Richard G. Layard, David Edward Card, 849-919.
Myers, Stewart, J. McConnell, A. Peterson, D. Soter, and J. Stern, 1998, Roundtable on the Capital Structure Puzzle, Vanderbilt University, Journal of Applied Corporate Finance 11, 8-24.
Ofek, Eli, 1993, Capital Structure and Firm Response to Poor Performance: An Empirical Analysis, Journal of Financial Economics 34(1), 3-30.

29
Rajan, Raghuram G., and Luigi Zingales, 1995, What Do We Know about Capital Structure? Some Evidence from International Data, Journal of Finance 50, 1421-60.
Rosen, Sherwin, 1986, The theory of equalizing differences, Ch. 12 of Orley Ashenfelter and David Card, eds., The Handbook of Labor Economics, 1, 641-692.
Simintzi, Elena, Vikrant Vig, and Paolo Volpin, 2009, Labor and Capital: Is Debt a Bargaining Tool?, London Business School.
Smith, Adam, 1976, An Inquiry into the Nature and Causes of the Wealth of Nations, The Glasgow Edition of the Works and Correspondence of Adam Smith, vol. II., edited by R.H. Campbell and A.S. Skinner, Oxford University Press.
Titman, Sheridan, 1984. The Effect of Capital Structure on a Firm's Liquidation Decision, Journal of Financial Economics 13(1), 137-151.
Topel, Robert, and Finis Welch, 1980, Unemployment Insurance: Survey and Extensions, Economica 47, 351-379.
Topel, Robert H., 1983, On Layoffs and Unemployment Insurance, American Economic Review 73, 541-559.
Topel, Robert H., 1984, Equilibrium Earnings, Turnover, and Unemployment: New Evidence, Journal of Labor Economics 2, 500-522.
U.S. Census Bureau, 1989, Technical Paper 59: The Relationship Between the 1970 and 1980 Industry and Occupation Classification Systems (U.S. Government Printing Office, Washington, DC).
U.S. Congress, U.S. House of Representatives, Committee on Ways and Means, 2004, 2004 Green Book, Background Material and Data on Programs Within the Jurisdiction of the Committee on Ways and Means, 108th Congress, 2nd Session, WMCP: 108-6 (U.S. Government Printing Office, Washington, D.C.).
Verwijmeren, Patrick, and Jeroen Derwall, 2010, Employee Well-Being, Firm Leverage, and Bankruptcy Risk, Journal of Banking and Finance 34, 956-964.
Zingales, Luigi, 2000, In Search of New Foundations, Journal of Finance 55, 1623-1653.

Figure 1. Cross-industry correlation between the layoff separation rate and marketleverage, 2008. The figure plots average market leverage in 2008 against the long-run averagelayoff separation rate at the 2-digit NAICS level. Market leverage is total debt divided by themarket value of the firm, from Compustat. The layoff separation rate is the ratio of workersaffected by extended mass layoffs to total industry employment, based on data from the U.S.Bureau of Labor Statistics’s Mass Layoff Statistics and the U.S. Bureau of Economic Analysis.The regression line shown is weighted based on the underlying number of firm observations. A1 percentage point increase in the layoff separation rate is associated with 6.4 percentage pointdecrease in market leverage.
53
62 44
54
2272
52
5145
5632
21
7148
33
23
31
.1.2
.3.4
.5.6
Mar
ket l
ever
age
0 .01 .02 .03 .04Layoff separation rate
30

Figure 2. Relative increases in state maximum unemployment insurance benefits by decade, 1950–2009. The figure displays thequartile of a state's increase in maximum total benefits, relative to other states in each decade from 1950 to 2009. Larger increases inbenefits are shown in darker shades. Maximum total benefits is the product of the statutory maximum weekly UI benefit and the maximumduration, based on information from annual issues of the U.S. Department of Labor’s Significant Provisions of State UI Laws.
Panel A. 1950–1960
Panel B. 1960–1970
Panel C. 1970–1980
Panel E. 1990–2000
Panel D. 1980–1990
Panel F. 2000–2009
First quartile Second quartile Third quartile Fourth quartile
31
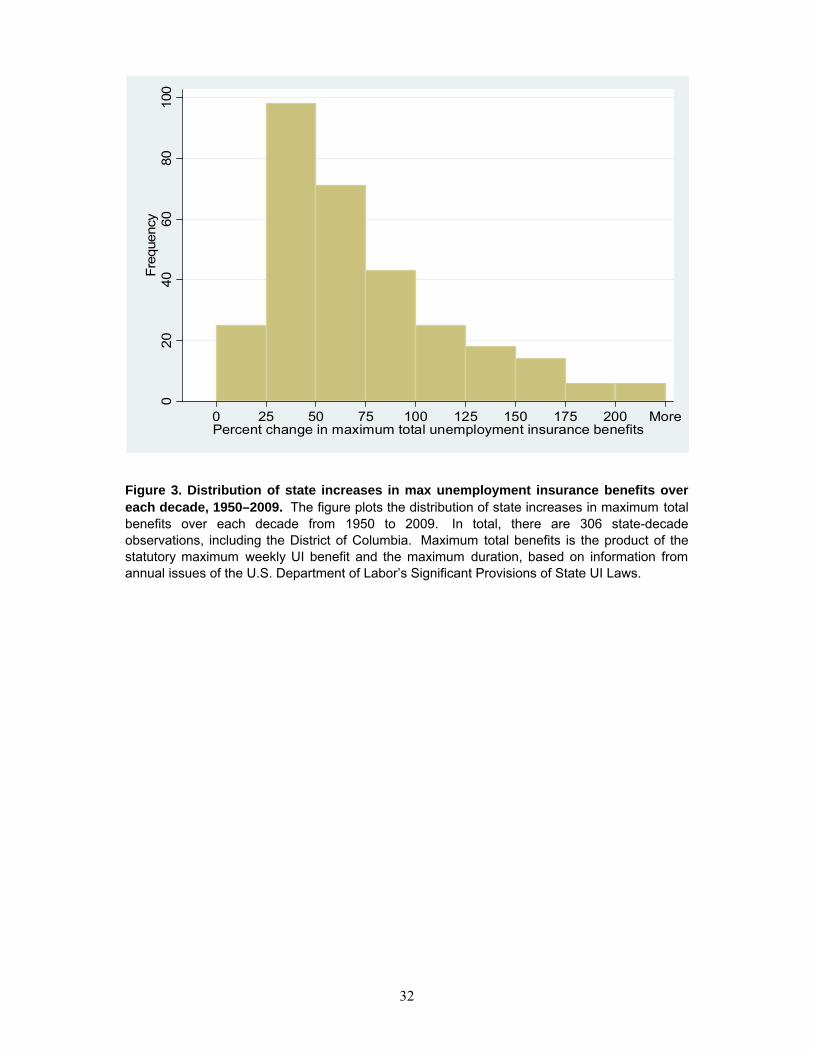
Figure 3. Distribution of state increases in max unemployment insurance benefits overeach decade, 1950–2009. The figure plots the distribution of state increases in maximum totalbenefits over each decade from 1950 to 2009. In total, there are 306 state-decadeobservations, including the District of Columbia. Maximum total benefits is the product of thestatutory maximum weekly UI benefit and the maximum duration, based on information fromannual issues of the U.S. Department of Labor’s Significant Provisions of State UI Laws.
020
4060
8010
0Fr
eque
ncy
0 25 50 75 100 125 150 175 200 MorePercent change in maximum total unemployment insurance benefits
32

Figure 4. Average market leverage and log max unemployment insurance benefits bystate, 1950–2008. The figure plots average annual state residuals from regressions marketleverage and log maximum total benefits on year fixed effects from 1950 to 2008. Results foreach of the 6 largest US states are reported. Market leverage is total debt divided by the market value of the firm, from Compustat. Log max total benefits is the natural log of the product of thestatutory maximum weekly UI benefit and the maximum duration, based on information fromannual issues of the U.S. Department of Labor’s Significant Provisions of State UI Laws.
-.4-.2
0.2
-1-.8
-.6-.4
-.20
-.2-.1
0.1
.2.3
-.20
.2.4
-.4-.2
0.2
.4
-.6-.4
-.20
-.10
.1
0.0
5.1
.15
-.05
0.0
5.1
-.1-.0
50
.05
-.02
0.0
2.04
.06
-.05
0.0
5.1
1950 1960 1970 1980 1990 2000 2010 1950 1960 1970 1980 1990 2000 2010
CA FL
IL NJ
NY TX
Market leverage Log max total benefit
Log
max
tota
l ben
efit
Mar
ket l
ever
age
33

Table 1. Summary statistics
MeanStandard deviation 25th percentile Median 75th percentile
Total debt / Assets 0.292 0.254 0.072 0.230 0.460Log interest coverage 1.875 1.449 0.839 1.805 2.653
Log max total benefit 8.554 0.629 8.171 8.679 8.972Log max weekly benefit 5.283 0.625 4.905 5.412 5.704Log max duration 3.271 0.048 3.258 3.258 3.258
Proportion of fixed assets 0.312 0.219 0.141 0.266 0.438Log sales 4.423 2.284 2.991 4.440 5.966Return on assets -0.003 0.397 0.015 0.086 0.141Z-score 0.877 5.205 0.948 2.058 2.848Market to book ratio 2.333 4.455 0.773 1.478 2.777Unemployment rate 6.383 1.943 5.019 6.174 7.472GDP growth 6.768 3.439 4.510 6.417 8.734
A. Dependent variables
B. Unemployment insurance variables
C. Control variables
The sample consists of 144,327 firm-year observations from 1950 through 2008. The unemploymentinsurance (UI) benefit criteria are from annual issues of the U.S. Department of Labor’s SignificantProvisions of State UI Laws, the financial data are from Compustat, the state unemployment rates arecalculated from the Current Population Survey (available with complete state indicators starting in 1977),and the state GDP growth rates are from the U.S. Bureau of Economic Analysis. The sample includes allfirms (excluding financials and utilities) with nonmissing observations for the variables shown below. Theleverage ratio is debt divided by the market value of assets. Log interest coverage is the natural log of 1plus the ratio of operating earnings before depreciation to interest expense, where the variable is recodedto zero for observations with negative earnings. Compustat variables are winsorized at 1% tails.
34
Table 2. Unemployment Insurance Laws and Total State Benefit Payments
(1) (2) (3) (4) (5) (6)
Log max total benefit 0.891*** 0.896***(0.128) (0.107)
Log max weekly benefit 1.009*** 1.009***(0.131) (0.107)
Log max duration 0.484** 0.645**(0.232) (0.251)
Unemployment rate 0.064*** 0.064*** 0.068***(0.007) (0.008) (0.008)
GDP growth -0.022*** -0.022*** -0.027***-0.005 -0.005 -0.006
Observations 2,040 2,040 2,040 1,632 1,632 1,632R-squared 0.92 0.92 0.91 0.93 0.93 0.91
Fixed effects:State X X X X X XYear X X X X X X
Log state unemployment insurance compensation
The table summarizes the results from state-panel regressions of log state unemployment insurance (UI) compensationon variables representing the generosity of state UI benefit criteria and a set of controls. Controls in all regressionsinclude state and year fixed effects. Where shown, controls also include the state unemployment rate and the state GDPgrowth rate. Standard errors, clustered at the state level, are reported in parentheses. ** and *** denote statisticalsignificance at the 5%, and 1% levels, respectively.
35

Table 3. Unemployment Insurance Laws and Firms' Capital Structures
(1) (2) (3) (4) (5)
Log max total benefit 0.041** 0.032** 0.030* 0.040** 0.017*(0.016) (0.016) (0.016) (0.016) (0.009)
Proportion of fixed assets 0.223*** 0.224*** 0.232*** 0.218***-(0.011) -(0.011) -(0.012) -(0.014)
Log sales 0.031*** 0.035*** 0.033*** 0.030***(0.002) (0.002) (0.002) (0.002)
Return on assets -0.063*** -0.053*** -0.047*** -0.050***(0.009) (0.008) (0.007) (0.005)
Z-score -0.010*** -0.009*** -0.009*** -0.025***-(0.001) (0.000) -(0.001) -(0.001)
Market to book ratio -0.006*** -0.006*** -0.005*** -0.004***0.000 0.000 0.000 0.000
Unemployment rate -0.002** -0.002** -0.002**(0.001) (0.001) (0.001)
GDP growth -0.005*** -0.005*** -0.001(0.001) (0.001) 0.000
Observations 144,327 144,327 119,942 98,885 98,885R-squared 0.60 0.64 0.65 0.64 0.66
Exclude dispersed industries X XBook value XFixed effects:
Firm X X X X XYear X X X X X
Total debt / Assets
The table summarizes the results from firm-panel regressions of total debt divided by the marketvalue of the firm (divided by book value in column 5) on the log maximum total potential benefitavailable under the state’s unemployment insurance system, and a set of controls. Controls in allregressions include firm and year fixed effects. Where shown, controls also include financialcontrols (the proportion of fixed assets, the market-to-book ratio, log sales, modified Altman’s z-score, and return on assets) and state economic indicators (state unemployment rate and the stateGDP growth rate). Where indicated, industries are excluded where a large percentage of theworkforce is likely to be geographically dispersed, namely retail, wholesale, and transport.Standard errors, clustered at the state level, are reported in parentheses. *, **, and *** denotestatistical significance at the 10%, 5%, and 1% levels, respectively.
36
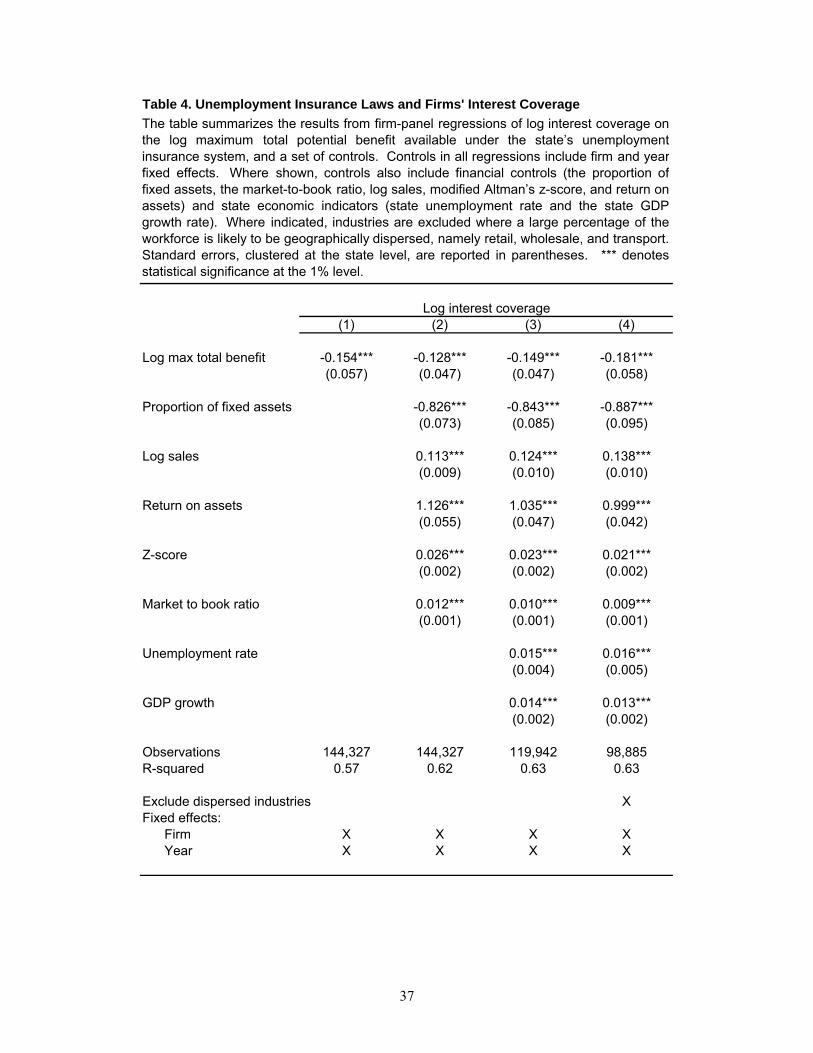
Table 4. Unemployment Insurance Laws and Firms' Interest Coverage
(1) (2) (3) (4)
Log max total benefit -0.154*** -0.128*** -0.149*** -0.181***(0.057) (0.047) (0.047) (0.058)
Proportion of fixed assets -0.826*** -0.843*** -0.887***(0.073) (0.085) (0.095)
Log sales 0.113*** 0.124*** 0.138***(0.009) (0.010) (0.010)
Return on assets 1.126*** 1.035*** 0.999***(0.055) (0.047) (0.042)
Z-score 0.026*** 0.023*** 0.021***(0.002) (0.002) (0.002)
Market to book ratio 0.012*** 0.010*** 0.009***(0.001) (0.001) (0.001)
Unemployment rate 0.015*** 0.016***(0.004) (0.005)
GDP growth 0.014*** 0.013***(0.002) (0.002)
Observations 144,327 144,327 119,942 98,885R-squared 0.57 0.62 0.63 0.63
Exclude dispersed industries XFixed effects:
Firm X X X XYear X X X X
Log interest coverage
The table summarizes the results from firm-panel regressions of log interest coverage onthe log maximum total potential benefit available under the state’s unemploymentinsurance system, and a set of controls. Controls in all regressions include firm and yearfixed effects. Where shown, controls also include financial controls (the proportion offixed assets, the market-to-book ratio, log sales, modified Altman’s z-score, and return onassets) and state economic indicators (state unemployment rate and the state GDPgrowth rate). Where indicated, industries are excluded where a large percentage of theworkforce is likely to be geographically dispersed, namely retail, wholesale, and transport.Standard errors, clustered at the state level, are reported in parentheses. *** denotesstatistical significance at the 1% level.
37

Table 5. Unemployment Insurance Laws and Firms' Capital Structures
Full sampleSales data not missing
Interstate sales > 70%
Interstate sales > 75%
Interstate sales > 80%
Interstate sales > 85%
(1) (2) (3) (4) (5) (6)
Log max total benefit 0.040** 0.037* 0.041* 0.042** 0.042** 0.054***(0.016) (0.020) (0.021) (0.021) (0.020) (0.018)
Observations 98,885 68,846 66,065 64,756 57,723 34,577R-squared 0.64 0.63 0.63 0.63 0.63 0.62
Log max total benefit -0.181*** -0.136** -0.160*** -0.164*** -0.177*** -0.304***(0.058) (0.057) (0.058) (0.058) (0.065) (0.086)
Observations 98,885 68,846 66,065 64,756 57,723 34,577R-squared 0.63 0.62 0.62 0.62 0.62 0.60
Financial controls X X X X X XFixed effects:
Firm X X X X X XYear X X X X X X
Panel A. Total debt / Assets
Panel B. Total debt / Assets
The table summarizes the results from firm-panel regressions of firms’ financial leverage (total debt divided bythe market value of the firm or log interest coverage) on the log maximum total potential benefit available underthe state’s unemployment insurance system, and a set of controls. Each column corresponds to differentsample restrictions based on the geographic breakdown of sales in the firms' industry, specifically the percentof the value of product shipments in the firm's 3-digit NAICS industry sent to destinations in a different U.S.state, based on the 2007 Commodity Flow Survey. Controls in all regressions include firm and year fixedeffects, financial controls (the proportion of fixed assets, the market-to-book ratio, log sales, modified Altman’sz-score, and return on assets), and state economic indicators (state unemployment rate and the state GDPgrowth rate). Industries are excluded where a large percentage of the workforce is likely to be geographicallydispersed, namely retail, wholesale, and transport. Standard errors, clustered at the state level, are reported inparentheses. *, **, and *** denote statistical significance at the 10%, 5%, and 1% levels, respectively.
38

Table 6. Unemployment Insurance Laws and Firms' Operating Performance
(1) (2) (3) (4)
Log max total benefit 0.002 0.015 0.032 0.038(0.022) (0.025) (0.036) (0.042)
Observations 144,327 144,327 119,942 98,885R-squared 0.66 0.70 0.70 0.71
Financial controls X X XEconomic indicators X XExclude dispersed industries XFixed effects:
Firm X X X XYear X X X X
Return on Assets
The table summarizes the results from firm-panel regressions of return on assets on the logmaximum total potential benefit available under the state’s unemployment insurance system,and a set of controls. Controls in all regressions include firm and year fixed effects. Whereshown, controls also include financial controls (the proportion of fixed assets, the market-to-book ratio, log sales, modified Altman’s z-score, and return on assets) and state economicindicators (state unemployment rate and the state GDP growth rate). Where indicated,industries are excluded where a large percentage of the workforce is likely to begeographically dispersed, namely retail, wholesale, and transport. Standard errors, clusteredat the state level, are reported in parentheses. None of the reported estimates arestatistically significant at the 10% level.
39

Table 7. Falsification Test: Unemployment Insurance Laws in Bordering States
(1) (2) (3) (4) (5) (6)
Log max total benefit 0.040** 0.040** -0.181*** -0.182***(0.016) (0.015) (0.058) (0.056)
Log max total benefit, 0.020 0.024 -0.015 -0.032 bordering states median (0.023) (0.024) (0.111) (0.118)
Observations 98,885 98,754 98,754 98,885 98,754 98,754R-squared 0.64 0.64 0.64 0.63 0.63 0.63
Financial controls X X X X X XEconomic indicators X X X X X XFixed effects:
Firm X X X X X XYear X X X X X X
Total debt / Assets Log interest coverage
The table summarizes the results from firm-panel regressions of firms’ financial leverage (total debt divided by themarket value of the firm or log interest coverage) on the log maximum total potential benefit available under thestate’s unemployment insurance (UI) system, the median log maximum total potential benefit available under the UIsystems in bordering states, and a set of controls. Controls in all regressions include firm and year fixed effects,financial controls (the proportion of fixed assets, the market-to-book ratio, log sales, modified Altman’s z-score, andreturn on assets), and state economic indicators (state unemployment rate and the state GDP growth rate).Industries are excluded where a large percentage of the workforce is likely to be geographically dispersed, namelyretail, wholesale, and transport. Standard errors, clustered at the state level, are reported in parentheses. ** and ***denote statistical significance at the 5% and 1% levels, respectively.
40

Table 8. Unemployment Insurance Laws and Firms' Capital Structures -- Additional UI Measures
(1) (2) (3) (4)
Log max weekly benefit 0.042** -0.181***(0.017) (0.064)
Log max duration 0.047 -0.328*(0.076) (0.174)
Observations 98,885 98,885 98,885 98,885R-squared 0.64 0.64 0.63 0.63
Financial controls X X X XEconomic indicators X X X XFixed effects:
Firm X X X XYear X X X X
Total debt / Assets Log interest coverage
The table summarizes the results from firm-panel regressions of firms’ financial leverage (total debt divided bythe market value of the firm or log interest coverage) on variables representing the generosity of states’unemployment insurance system (the log maximum weekly benefit and the log maximum duration), and a set ofcontrols. Controls in all regressions include firm and year fixed effects, financial controls (the proportion of fixedassets, the market-to-book ratio, log sales, modified Altman’s z-score, and return on assets), and stateeconomic indicators (state unemployment rate and the state GDP growth rate). Industries are excluded wherea large percentage of the workforce is likely to be geographically dispersed, namely retail, wholesale, andtransport. Standard errors, clustered at the state level, are reported in parentheses. *, **, and *** denotestatistical significance at the 10%, 5%, and 1% levels, respectively.
41
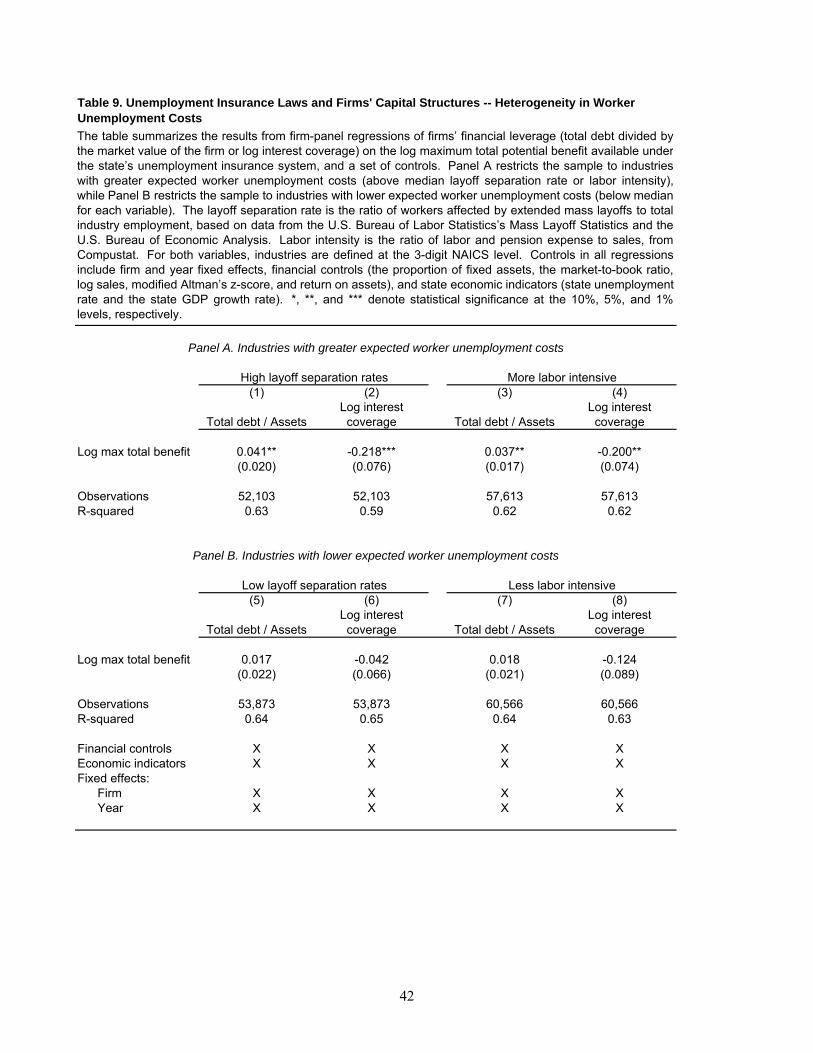
(1) (2) (3) (4)
Total debt / AssetsLog interest coverage Total debt / Assets
Log interest coverage
Log max total benefit 0.041** -0.218*** 0.037** -0.200**(0.020) (0.076) (0.017) (0.074)
Observations 52,103 52,103 57,613 57,613R-squared 0.63 0.59 0.62 0.62
(5) (6) (7) (8)
Total debt / AssetsLog interest coverage Total debt / Assets
Log interest coverage
Log max total benefit 0.017 -0.042 0.018 -0.124(0.022) (0.066) (0.021) (0.089)
Observations 53,873 53,873 60,566 60,566R-squared 0.64 0.65 0.64 0.63
Financial controls X X X XEconomic indicators X X X XFixed effects:
Firm X X X XYear X X X X
Low layoff separation rates Less labor intensive
Table 9. Unemployment Insurance Laws and Firms' Capital Structures -- Heterogeneity in Worker Unemployment Costs
Panel A. Industries with greater expected worker unemployment costs
High layoff separation rates
Panel B. Industries with lower expected worker unemployment costs
More labor intensive
The table summarizes the results from firm-panel regressions of firms’ financial leverage (total debt divided bythe market value of the firm or log interest coverage) on the log maximum total potential benefit available underthe state’s unemployment insurance system, and a set of controls. Panel A restricts the sample to industrieswith greater expected worker unemployment costs (above median layoff separation rate or labor intensity),while Panel B restricts the sample to industries with lower expected worker unemployment costs (below medianfor each variable). The layoff separation rate is the ratio of workers affected by extended mass layoffs to totalindustry employment, based on data from the U.S. Bureau of Labor Statistics’s Mass Layoff Statistics and theU.S. Bureau of Economic Analysis. Labor intensity is the ratio of labor and pension expense to sales, fromCompustat. For both variables, industries are defined at the 3-digit NAICS level. Controls in all regressionsinclude firm and year fixed effects, financial controls (the proportion of fixed assets, the market-to-book ratio,log sales, modified Altman’s z-score, and return on assets), and state economic indicators (state unemploymentrate and the state GDP growth rate). *, **, and *** denote statistical significance at the 10%, 5%, and 1%levels, respectively.
42

(1) (2) (3) (4)
Total debt / AssetsLog interest coverage Total debt / Assets
Log interest coverage
Log max total benefit 0.042** -0.181* 0.041** -0.162*(0.017) (0.090) (0.020) (0.082)
Observations 46,163 46,163 57,767 57,767R-squared 0.66 0.64 0.63 0.61
(5) (6) (7) (8)
Total debt / AssetsLog interest coverage Total debt / Assets
Log interest coverage
Log max total benefit 0.029 -0.122* 0.017 -0.097(0.020) (0.069) (0.017) (0.072)
Observations 63,340 63,340 59,683 59,683R-squared 0.62 0.61 0.66 0.64
Financial controls X X X XEconomic indicators X X X XFixed effects:
Firm X X X XYear X X X X
Table 10. Unemployment Insurance Laws and Firms' Capital Structures -- Cross-industry Heterogeneity in Importance of Unemployment Insurance
Low UI payment rates
Panel A. Industries with greater UI payments and low wage workers
Panel B. Industries with lower UI payments and low wage workers
Fewer low wage workers
Many low wage workers High UI payment rates
The table summarizes the results from firm-panel regressions of firms’ financial leverage (total debt divided bythe market value of the firm or log interest coverage) on the log maximum total potential benefit available underthe state’s unemployment insurance system, and a set of controls. Panel A restricts the sample to industrieswith greater UI payments and more low wage workers (above median proportion of workers to collect UIbenefits, or proportion of workers earning less than $40,000 per year), while Panel B restricts the sample toindustries with lower UI payments and fewer low wage workers (below median for each variable). Theproportion of workers collecting unemployment insurance payments is from the Current Population Survey,where industries are defined at the 2-digit SIC level. The proportion of low wage workers is from the 2000U.S. Population Census, where industries are defined at the 3-digit NAICS level. Controls in all regressionsinclude firm and year fixed effects, financial controls (the proportion of fixed assets, the market-to-book ratio,log sales, modified Altman’s z-score, and return on assets), and state economic indicators (stateunemployment rate and the state GDP growth rate). *, **, and *** denote statistical significance at the 10%,5%, and 1% levels, respectively.
43

Table 11. Unemployment Insurance Laws and Firms' Capital Structures -- Cross-firm Heterogeneity
(1) (2) (3) (4)Total debt /
AssetsLog interest coverage
Total debt / Assets
Log interest coverage
Log max total benefit 0.050** -0.289*** 0.040* -0.219**(0.023) (0.092) (0.022) (0.081)
Observations 67,621 67,621 48,882 48,882R-squared 0.65 0.60 0.67 0.57
(5) (6) (7) (8)Total debt /
AssetsLog interest coverage
Total debt / Assets
Log interest coverage
Log max total benefit 0.016 0.041 0.023 0.023(0.011) (0.061) (0.015) (0.111)
Observations 31,180 31,180 48,876 48,876R-squared 0.77 0.74 0.72 0.71
Financial controls X X X XEconomic indicators X X X XFixed effects:
Firm X X X XYear X X X X
Positive dividends High cash flows (above median)
Panel A. Firms facing greater financial constraints
Zero dividends Low cash flows (below median)
Panel B. Firms facing fewer financial constraints
The table summarizes the results from firm-panel regressions of firms’ financial leverage (total debt divided bythe market value of the firm or log interest coverage) on the log maximum total potential benefit available underthe state’s unemployment insurance system, and a set of controls. Panel A restricts the sample to firms facinggreater financial constraints (zero dividends or below median operating cash flows), while Panel B restricts thesample to firms facing fewer financial constraints (positive dividends or above median operating cash flows).Controls in all regressions include firm and year fixed effects, financial controls (the proportion of fixed assets,the market-to-book ratio, log sales, modified Altman’s z-score, and return on assets), and state economicindicators (state unemployment rate and the state GDP growth rate). Industries are excluded where a largepercentage of the workforce is likely to be geographically dispersed, namely retail, wholesale, and transport.Standard errors, clustered at the state level, are reported in parentheses. *, **, and *** denote statisticalsignificance at the 10%, 5%, and 1% levels, respectively.
44

Table 12. Connection with Union Bargaining
Total debt / Assets
Log interest coverage
Total debt / Assets
Log interest coverage
(1) (2) (3) (4)
Log max total benefit 0.034 -0.115 0.043** -0.227***(0.027) (0.098) (0.017) (0.081)
Observations 35,491 35,491 59,523 59,523R-squared 0.62 0.60 0.64 0.63
Financial controls X X X XEconomic indicators X X X XExclude dispersed industries X X X XFixed effects:
Firm X X X XYear X X X X
High union (coverage ≥ 25%) Low union (coverage < 25%)
The table summarizes the results from firm-panel regressions of firms’ financial leverage (totaldebt divided by the market value of the firm or log interest coverage) on the log maximum totalpotential benefit available under the state’s unemployment insurance system, and a set ofcontrols. Columns 1 and 2 restrict the sample to industries where at least 25 percent of theworkforce is covered by collective bargaining, while columns 3 and 4 restrict the sample toindustries where fewer workers are covered. Data on union coverage is from Hirsch andMacpherson (2003), based on a sample of employed wage and salary workers, ages 16 andover, from the Current Population Survey Outgoing Rotation Group Earnings Files for 1983, andare matched to SIC industry classifications using U.S. Bureau of Census (1989). Controls in allregressions include firm and year fixed effects, financial controls (the proportion of fixed assets,the market-to-book ratio, log sales, modified Altman’s z-score, and return on assets), and stateeconomic indicators (state unemployment rate and the state GDP growth rate). Industries areexcluded where a large percentage of the workforce is likely to be geographically dispersed,namely retail, wholesale, and transport. Standard errors, clustered at the state level, are reportedin parentheses. *, **, and *** denote statistical significance at the 10%, 5%, and 1% levels,respectively.
45

Period (Years) Observations Mean Standard Error Min Max
I. Defaulting firms[-1,+1] 283 -0.27 0.02 -0.30 -0.23[-1,0] 362 -0.16 0.01 -0.19 -0.14[0,+1] 286 -0.13 0.01 -0.16 -0.10
II. Rest of industry[-1,+1] 283 0.03 0.01 0.01 0.04[-1,0] 362 0.00 0.00 -0.01 0.01[0,+1] 286 0.02 0.00 0.01 0.03
Credit rating With UI Without UI
AAA 0.01 0.01 0.02 0.32 0.47AA 0.04 0.05 0.13 1.84 2.51A 0.05 0.06 0.16 3.84 4.40
BBB 0.53 0.57 1.54 4.53 5.18BB 1.03 1.12 3.01 6.81 7.22B 1.46 1.59 4.28 9.54 8.95
Table 13. Estimates of Compensation for Unemployment Risk by Credit Rating
Panel A. Employment Changes Around Default (percent of employment)
95% confidence interval
Panel B. Costs and Benefits of Leverage (percent of firm value)
Costs of financial distress
Tax benefits of debt
Almeida and Philippon (2007)Wage PremiumIncluding bankruptciesExcluding
bankruptcies
The table presents estimates of the ex ante wage costs of firm leverage decisions. Panel A contains statisticsdescribing employment changes in various windows (measured in years) around default for firms in the AltmanNYU Salomon Center Corporate Bond Default Master Database (1977 to 2008). Industry (2-digit SIC)employment changes around default (excluding the defaulting firm) are also reported. Panel B presentsestimates of wage premium, ω , as a percent of the market value of assets, A , required to compensateworkers for unemployment risk across various credit ratings, based on the following formula:
where p is the probability of default, υ is the probability of unemployment conditional on default, Π is the per-unit required wage premium, L is labor expense, and r D is the expected return on debt. The first columnexcludes employment changes for bankrupt firms in estimating p. The second and third columns assume a50% reduction in employment for bankrupt firms for which employment data is unavailable. The second (third)column presents average compensating wage premiums assuming mean (no) UI wage replacement. Thefourth and fifth columns present risk-adjusted ex post costs of financial distress and the tax benefits of debt foreach credit rating as reported by Almeida and Philippon (2007, Table VI).
prA
Lp
A D +
Π=
υω
46

Industry NAICSLayoff separation
rate (percent)
Agriculture and forestryForestry and logging 113 0.8Agriculture and forestry support activities 115 18.4
Mining, quarrying, and oil and gas extractionOil and gas extraction 211 0.3Mining, except oil and gas 212 2.8Support activities for mining 213 1.3
Utilities 221 0.5Construction
Construction of buildings 236 1.2Heavy and civil engineering construction 237 5.7Specialty trade contractors 238 0.6
ManufacturingFood manufacturing 311 4.4Beverage and tobacco product manufacturing 312 2.1Textile mills 313 3.7Textile product mills 314 1.7Apparel manufacturing 315 4.5Leather and allied product manufacturing 316 4.4Wood product manufacturing 321 1.9Paper manufacturing 322 1.4Printing and related support activities 323 0.8Petroleum and coal products manufacturing 324 2.6Chemical manufacturing 325 0.8Plastics and rubber products manufacturing 326 1.3Nonmetallic mineral product manufacturing 327 2.4Primary metal manufacturing 331 3.0Fabricated metal product manufacturing 332 0.9Machinery manufacturing 333 1.6Computer and electronic product manufacturing 334 2.3Electrical equipment and appliance manufacturing 335 2.6Transportation equipment 336 4.1Furniture and related product manufacturing 337 1.6Miscellaneous manufacturing 339 1.1
Retail tradeMotor vehicle and parts dealers 441 0.1Furniture and home furnishings stores 442 0.4Electronics and appliance stores 443 0.7Building material and garden supply stores 444 0.5Food and beverage stores 445 0.7Health and personal care stores 446 0.2Gasoline stations 447 0.1Clothing and clothing accessories stores 448 0.4Sporting goods, hobby, book and music stores 451 0.3General merchandise stores 452 1.4Miscellaneous store retailers 453 0.1Nonstore retailers 454 1.0
Appendix Table A1. Layoff separation rates by 3-digit NAICS industryThis table lists layoff separation rates for three-digit NAICS industries. The layoff separation rateis the ratio of workers affected by extended mass layoffs to total industry employment, based ondata from the U.S. Bureau of Labor Statistics’s (BLS) Mass Layoff Statistics and the U.S. Bureauof Economic Analysis. Extended mass layoffs are defined by the BLS as when at least 50 initialclaims are filed against an establishment during a consecutive 5-week period and at least 50workers have been separated from their jobs for more than 30 days.
47

Industry NAICSLayoff separation
rate (percent)
Transportation and warehousingAir transportation 481 2.2Water transportation 483 3.5Truck transportation 484 0.4Transit and ground passenger transportation 485 5.9Pipeline transportation 486 2.7Scenic and sightseeing transportation 487 2.1Support activities for transportation 488 0.5Couriers and messengers 492 0.7Warehousing and storage 493 0.4
InformationPublishing industries, except Internet 511 0.5Motion picture and sound recording industries 512 3.6Broadcasting, except Internet 515 0.5Telecommunications 517 0.9Data processing, hosting and related services 518 0.7Other information services 519 1.1
Finance and insuranceCredit intermediation and related activities 522 0.8Securities, commodity contracts, investments 523 0.2Insurance carriers and related activities 524 0.3Funds, trusts, and other financial vehicles 525 0.3
Real estate and rental and leasingReal estate 531 0.0Rental and leasing services 532 0.2
Professional, scientific, and technical services 541 0.4Management of companies and enterprises 551 0.2Administrative and waste services
Administrative and support services 561 1.0Waste management and remediation services 562 0.4
Educational services 611 0.1Health Care and Social Assistance
Ambulatory health care services 621 0.1Hospitals 622 0.2Nursing and residential care facilities 623 0.1Social assistance 624 0.7
Arts, entertainment, and recreationPerforming arts and spectator sports 711 0.8Museums, historical sites, zoos, and parks 712 0.5Amusement, gambling, and recreation 713 1.8
Accommodation and food servicesAccommodation 721 1.2Food services and drinking places 722 0.4
Other services, except public administrationRepair and maintenance 811 0.1Personal and laundry services 812 0.1Membership associations and organizations 813 0.2
Appendix Table A1. Layoff separation rates by 3-digit NAICS industry (cont.)
48