
Labor Market Structures and the Sacri–ce Ratio · 2017-05-05 · Labor Market Structures and the...
31
Labor Market Structures and the Sacrice Ratio Christopher Bowdler Department of Economics and Oriel College, University of Oxford. Email: [email protected] Luca Nunziata University of Padua, IZA Bonn Email: [email protected] Abstract Using OECD panel data for 1961 2000 we provide evidence that the output cost associated with disination (the sacrice ratio) decreases with coordination between wage-setters in the labor market. The relationship holds for alternative measures of labor market coordination and after controlling for standard sacrice ratio determinants. The sign of the relationship is robust across alternative denitions of the sacrice ratio, but its statistical signicance varies. Our results also indicate that more stringent employment protection laws increase sacrice ratios, but the e/ect is not signicant at conventional levels. We provide explanations for our ndings based on the speed of nominal wage adjustment in New Keynesian models. JEL Classication: E30. Keywords: sacrice ratio, labor markets, wage coordination, employment protection. We thank Tony Caporale for supplying data on the political stance of governments in the OECD during the post-war period and four anonymous referees for very helpful comments. 1
Transcript of Labor Market Structures and the Sacri–ce Ratio · 2017-05-05 · Labor Market Structures and the...

Labor Market Structures and the Sacri�ce Ratio�
Christopher Bowdler
Department of Economics and Oriel College, University of Oxford.
Email: [email protected]
Luca Nunziata
University of Padua, IZA Bonn
Email: [email protected]
Abstract
Using OECD panel data for 1961�2000 we provide evidence that the output cost associated
with disin�ation (the sacri�ce ratio) decreases with coordination between wage-setters in the
labor market. The relationship holds for alternative measures of labor market coordination and
after controlling for standard sacri�ce ratio determinants. The sign of the relationship is robust
across alternative de�nitions of the sacri�ce ratio, but its statistical signi�cance varies. Our
results also indicate that more stringent employment protection laws increase sacri�ce ratios,
but the e¤ect is not signi�cant at conventional levels. We provide explanations for our �ndings
based on the speed of nominal wage adjustment in New Keynesian models.
JEL Classi�cation: E30.
Keywords: sacri�ce ratio, labor markets, wage coordination, employment protection.
� We thank Tony Caporale for supplying data on the political stance of governments in the
OECD during the post-war period and four anonymous referees for very helpful comments.
1
1 Introduction
International di¤erences in the output cost of disin�ation (the sacri�ce ratio) have been the
focus of renewed interest in monetary economics since the study by Ball (1994). Recent em-
pirical contributions have investigated a wide range of potential sacri�ce ratio determinants.
The impact of trade openness is examined by Temple (2002), Daniels, Nourzad and VanHoose
(2005) and Bowdler (2009), and the e¤ect of current account and capital account restrictions is
investigated by Razin and Loungani (2007). Other studies focus on the credibility of macroeco-
nomic policy during disin�ation. In particular, the sacri�ce ratio has been shown to decrease
with the probability agents assign to successful in�ation reduction (Boschen and Weise, 2001),
the presence of governments from the political right (Caporale and Caporale, 2008) and the
existence of an in�ation targeting regime (Goncalves and Carvalho, 2009). On the other hand,
Jordan (1997) �nds that central bank independence increases the sacri�ce ratio and this result
is con�rmed by Daniels et al. (2005). A related line of research has provided new procedures for
measuring sacri�ce ratios and evidence concerning the dependence of those sacri�ce ratios on a
range of factors, including the in�ation regime prior to disin�ation, see Zhang (2005), Hofstet-
ter (2008) and Senda and Smith (2008). In this paper we provide evidence that labor market
structures in�uence international di¤erences in sacri�ce ratios, building on ideas that have often
been discussed in the literature but which have rarely been tested.
Disin�ation episodes are often initiated by periods of tight �scal and monetary policy. Ulti-
mately, the success of such policies depends on a decrease in the in�ation expectations of price-
and wage-setters. Lower in�ation expectations provide a basis for lower nominal wage growth,
which helps to lock in in�ation reductions. The importance of wage-setting to in�ation dynam-
ics is recognized in both macroeconomic policy-making and research. During the 1960s and
2

1970s many governments employed direct wage controls as a tool of anti-in�ation policy, see for
example Nelson (2005). In recent research Olivei and Tenreyro (2007) utilize information on the
timing of wage negotiations to explain within year variation in the trade-o¤ between in�ation
and output.
The idea that we emphasize is that labor market structures can a¤ect the speed at which
nominal wage growth moderates during disin�ation episodes and thereby play a role in deter-
mining the sacri�ce ratio. The starting point is that labor markets are imperfectly competitive,
such that wage-setters decide the precise timing of wage moderation after disin�ation policies are
initiated. This behavior is a feature of New Keynesian models in which price- and wage-setting
is staggered and agents are averse to relative price and wage changes, see Ball and Romer (1991)
for a model that captures these e¤ects and Taylor (1983) for discussion in the context of labor
markets. The factors that determine the length of time until wage moderation will be critical in
setting disin�ation costs �delays will thwart disin�ation, prompting larger output losses. When
labor market laws a¤ord considerable protection to those in employment, e.g. through restric-
tions on �ring by �rms, wage-setters may choose to delay wage moderation because the chances
of job losses are limited, and dominated by the bene�t from higher real wages. We therefore
hypothesize a positive relationship between the sacri�ce ratio and the strictness of employment
protection arrangements.
In contrast, when labor markets are centralized and interactions between �rms and wage-
setters highly coordinated, for example in Scandinavian countries, wage moderation can be
implemented more rapidly. The reason is that when unions negotiate from an aggregate per-
spective they are more likely aware that wage moderation for one set of workers is occurring
alongside economy wide moderation, leaving relative wages una¤ected. As a result the relative
wage concerns that can frustrate nominal adjustment are absent and disin�ation can proceed at
3
lower output cost.1
Our contribution is to investigate the relationship between labor market structures and
sacri�ce ratios using a detailed panel dataset on di¤erences in employment protection laws,
unionization rates and the degree of labor market coordination in 18 OECD countries, and a
baseline sample of 76 disin�ation episodes obtained from Ball (1994) and Bowdler (2009). The
results show that higher levels of coordination in wage bargaining are associated with statis-
tically signi�cant reductions in the sacri�ce ratio. More stringent employment protection laws
are associated with larger sacri�ce ratios, though the statistical signi�cance of that relationship
is weaker than that based on labor market coordination. Building on previous work on the
e¤ects of labor market coordination on macroeconomic outcomes (Calmfors and Dri¢ ll, 1988,
Daniels, Nourzad and VanHoose, 2006) we investigate an inverse U-shape relationship between
coordination and the sacri�ce ratio, and �nd weak evidence for a non-linearity of that kind. In
an important extension of our baseline results, we examine sacri�ce ratios from Senda and Smith
(2008), calculated using the assumptions regarding trend output during disin�ations proposed
by Zhang (2005) and Hofstetter (2008), which are di¤erent to those employed by Ball (1994)
and Bowdler (2009). The e¤ects of labor market coordination and employment protection are
qualitatively similar to those in our baseline results, but signi�cant at con�dence levels of just
10%, 15% or lower. On the other hand, our results are generally robust to alternative exten-
sions of our methodology such as the use of di¤erent measures of coordination and employment
protection, the use of �xed e¤ects and time dummies and the exclusion of outlier observations.
1A review of the channels linking labor market structures and the speed of nominal wage moderation is provided
in Calmfors (2004). The other channels discussed include the idea that coordinated structures reduce the average
duration of wage contracts, relative to decentralized structures, because an externality (greater aggregate nominal
rigidity) is neglected in the latter case, leading to ine¢ cient contracts, see Ball (1987).
4

Our paper contributes to a substantial literature on labor market structures and macroeco-
nomic outcomes. Bruno and Sachs (1985) and Calmfors and Dri¢ ll (1988) represent important
early contributions. More recently, Thomas (2001) shows that nominal wage growth is more
responsive to unemployment under highly centralized wage bargaining systems (though it is
not necessarily more responsive to productivity growth, or input price shocks) and Nunziata
(2005) shows that real wages are more responsive to unemployment under coordinated bargain-
ing systems. In his original study of sacri�ce ratios, Ball (1994) found a negative and marginally
signi�cant e¤ect from the Bruno and Sachs (1985) indicator of wage �exibility. This index pools
discrete measures of the duration of wage contracts, the synchronization of wage negotiations
and the degree of indexation of wage contracts.2 In section 3 we discuss how our results re-
late to this evidence. Finally, in investigating the e¤ect of central bank transparency on the
slope of the Phillips curve (which is related to the sacri�ce ratio), Chortareas, Stasavage and
Sterne (2003) use labor market coordination as a control. The coordination index is positively
correlated with the speed of in�ation adjustment, consistent with the argument that we have
described. However, the Phillips curve proxies are available for a sample of just 21 countries,
precluding systematic investigation of the e¤ects of other labor market institutions.
The structure of the paper is as follows. In section 2 the measurement of the sacri�ce ratio,
labor market structures and other variables is discussed, and the basic form of the regression
models is presented. In section 3 the results from a range of regression speci�cations are in-
terpreted in terms of the main hypotheses proposed in this introduction. Tests for non-linear
relationships are presented, and various robustness exercises are discussed. Section 4 concludes
with a summary of the paper.
2Ball obtained a similar result using a measure of the speed of wage adjustment estimated from time series
regressions.
5

2 Data and Methodology
The sacri�ce ratio is de�ned by Ball (1994) as the ratio between total output losses and the
change in trend in�ation over the course of a disin�ation (a disin�ation is a period during which
trend in�ation falls by more than 1:5 percentage points from peak to trough). Total output
losses are calculated as the sum of annual percentage deviations of real GDP from a straight
line connecting output in the year of an in�ation peak to output in the year after an in�ation
trough. Trend in�ation in year t is an average of the annual rate of consumer price in�ation
recorded in eight quarters, namely the four quarters of year t, the last two quarters of t� 1 and
the �rst two quarters of t + 1. Ball calculates sacri�ce ratios for 65 disin�ation episodes in 19
OECD countries observed for 1961� 88.
This sample is expanded through adding disin�ations that have occurred since 1988 for each
of the 19 countries studied by Ball. The source for additional observations is Bowdler (2009),
who calculates post�1980 sacri�ce ratios using the procedure introduced by Ball. In the case
of disin�ations that occurred in the 1980s, estimates of the sacri�ce ratio are available from
both the original Ball study and the more recent source. In some instances the two studies
di¤er slightly in terms of the dating of disin�ation episodes, probably due to the e¤ects of data
revisions, but in general there is a strong concordance between the two sets of estimates for the
period of overlap, see Bowdler (2009) for discussion. In order to maintain full comparability with
other papers in the literature, the Ball estimates of the sacri�ce ratio are used through 1988, and
observations from the alternative source are added post�1988.3 A similar strategy is followed
by Caporale and Caporale (2008), who augment Ball�s sample using post�1988 estimates of the
sacri�ce ratio from Andersen and Wascher (1999). Although there are some di¤erences across
3The 1986-92 disin�ation in New Zealand reported in the Bowdler (2009) sample is not used because it overlaps
with the �nal disin�ation that Ball reports for New Zealand.
6

the sacri�ce ratios identi�ed by Andersen and Wascher and Bowdler for the post-1988 period,
in our results we are able to reproduce the main �ndings from Caporale and Caporale (2008),
suggesting general agreement between the two sources.4 One advantage of extending the sample
using observations from Bowdler is that sacri�ce ratios are calculated using output losses relative
to local linear trends and are therefore directly comparable with the original Ball data, whereas
Andersen and Wascher use output losses relative to trends calculated by the OECD.
In order to explore the relationship between the sacri�ce ratio and labor market structures,
we estimate regressions of the form
SACi = �+ �COIBi + EPi + �TUi + 0X+"i (1)
where i denotes a disin�ation, SAC is the sacri�ce ratio in percentage points, COIB an
index of labor market coordination, EP an index of employment protection and TU a measure
of the importance of trade unions in the labor market. The vector X comprises controls that
we discuss below, and " is an error term. All labor market variables are from the year in which
disin�ation commences.5 A key issue is the measurement of labor market structures. In the case
of COIB we use an index of the degree of coordination in wage bargaining due to Kenworthy
(2001). This is a de jure measure that summarizes information on labor market characteristics
that are believed to in�uence the coordination of wage-setting, e.g. the number of unions in the
bargaining process, the fraction of the workforce whose wages are determined through bargaining
and the degree to which minor players in the market follow the agreements reached by larger
4Andersen and Wascher identify a disin�ation for Germany in the 1990s that is not identi�ed by Bowdler,
whilst Bowdler identi�es two disin�ations for Italy during the 1990s when Andersen and Wascher identify just
one.5Using averages for the years spanned by a disin�ation gives very similar information because of the smoothness
of the indicators through time.
7

unions. As discussed in Kenworthy (2001, 2003) the index pools information from other studies
that measure coordination in wage-setting. We therefore interpret it as a summary measure of
the dozen or so de jure coordination measures that could have been used �Kenworthy (2003)
shows that his indicator is highly correlated with other available measures. The index increases
in the degree of coordination and varies across countries and time, from 1 (e.g. the U.S.) to 5
(e.g. Japan). Relevant summary statistics for all variables are presented in table 1.
It is important to note that coordination in wage-setting extends the concept of centraliza-
tion in wage-setting, which has often been analyzed in the literature. Greater centralization
of labor markets, so that they are dominated by a small number of unions, is one means of
achieving coordination, but others include guidance of decentralized systems by market actors
such as union and employer confederations, dominant unions or government sponsored forums
(Kenworthy, 2003). As any one of these mechanisms may facilitate wage moderation during dis-
in�ation episodes, it is coordination in wage-setting that we use to explain variation in sacri�ce
ratios, rather than centralization of wage-setting. See Soskice (1990) and Flanagan (1999) for a
discussion of the importance of this distinction for empirical work on labor market con�gurations
and macroeconomic outcomes.
The measure of employment protection, EP , is taken from Nickell et al. (2005). It increases
in the strictness of employment protection legislation and takes values in the range 0� 2. The
maximum value occurs for countries such as Italy, where laws regulating the �ring of workers
and the rights of part-time workers are judged most restrictive. The series exhibits some time
variation, but the dominant source of variation is the cross-section. As there are very few
alternative measures of EP , we consider only the Nickell et al. version in our baseline results,
but in section 3.2 we consider an alternative measure as a robustness exercise. TU is de�ned
as the percentage of the workforce that belong to a trade union, and is also taken from Nickell
8
et al. (2005). We include TU because it is a relatively continuous measure of labor market
characteristics compared to the discrete indices for coordination and employment protection. In
the regression speci�cation it may either capture the extent to which labor supply can resist
wage moderation, or proxy an aspect of coordination not incorporated in our main measures.
We remain agnostic on this issue.
In table 2 we present a correlation matrix for SAC and the labor market variables. The
three separate dimensions of the labor market structure (coordination, employment protection
and unionization) are not highly correlated. This suggests that regressor multicollinearity will
not be a major problem in our empirical work. The unconditional correlation between the
sacri�ce ratio and coordination is negative; those between the sacri�ce ratio and employment
protection and the sacri�ce ratio and unionization are positive but very close to zero.
The vector X comprises a set of controls emphasized in the literature. The �rst three
are discussed by Ball (1994): INFLOSS, the percentage point change in in�ation during the
disin�ation, PEAK, the percentage in�ation rate at the start of the disin�ation and SPEED,
the speed of disin�ation de�ned as INFLOSS divided by the duration in years of a disin�ation.6
Data for these variables (and also SAC) for the pre-1990 period were downloaded from the
website of Jonathan Temple, who tabulated the data in Ball (1994). Data for the post-1990
period for these variables were taken from Bowdler (2009). The other covariates are OPEN ,
the average percentage share of imports in GDP during the years in which the disin�ation
occurred7, CBI, Cukierman�s (1992) index of the legal independence of central banks, the
6A referee pointed out the potential endogeneity of INFLOSS (and hence SPEED) given that it enters the
sacri�ce ratio denominator. In section 3 we check that such endogeneity does not induce or obscure our main
results through reporting models with and without the INFLOSS and SPEED controls, and using the reciprocal
of the length in years of a disin�ation as an alternative de�nition of SPEED.7Underlying data are from the IMF�s International Financial Statistics database. For the German disin�ation
9
interaction of OPEN and CBI (see Daniels et al. 2005) and RIGHT , a binary variable equal
to 1 if the government in o¢ ce is from the political right for the duration of the disin�ation
and 0 otherwise (see Caporale and Caporale, 2008, whose classi�cation of governments is from
Alesina, Roubini and Cohen, 1997).8
2.1 Sample and Estimation
Our baseline sample comprises 76 disin�ation episodes from 17 countries,9 61 are from Ball
(1994) and occur pre�1990 and 15 are from Bowdler (2009) and occur post�1990. We use
61=65 disin�ations from the original Ball sample (corresponding to 17=19 of the countries con-
sidered by Ball) because (i) in line with recent studies such as Daniels et al. (2005) and Caporale
and Caporale (2008), the observation for Luxembourg is excluded due to there being no corre-
sponding observation for central bank independence (CBI), and (ii) the three observations for
Spain are omitted because the Kenworthy version of COIB is not calculated for Spain (Ken-
worthy justi�es this decision on the grounds that labor market structures are di¢ cult to assess
in the period in which Spain was not a democracy). The 15 episodes taken from Bowdler (2009)
of 1965-67 the data were not available and therefore the average openness statistic for 1970 is used (this is the
closest year to 1967 for which data are available). The results reported in section 3 are robust to excluding this
observation.8Goncalves and Carvalho (2008) control for the presence of an in�ation target and an index of the transparency
of the central bank. Only 8=17 countries that adopted in�ation targeting in the Goncalves-Carvalho sample are
represented in our sample, and of those 8 only a handful undertook a disin�ation since the transition to in�ation
targeting. Therefore a control for in�ation targeting does not a¤ect our main results, even though it represents an
important in�uence in other samples. Similarly, the transparency index is insigni�cant when added to the models
that we estimate (as it was in the Goncalves and Carvalho study) and therefore we do not include it in our core
analysis.9These are Australia, Austria, Belgium, Canada, Denmark, Finland, France, Germany, Ireland, Italy, Japan,
Netherlands, New Zealand, Sweden, Switzerland, UK, USA.
10

are Australia 1989 � 93, Belgium 1990 � 95, Canada 1990 � 94, Denmark 1988 � 93, Finland
1989� 96, France 1990� 94, Ireland 1989� 93, Italy 1990� 94, Japan 1990� 95, Netherlands
1991� 96, Sweden 1990� 98, Switzerland 1991� 98, UK 1990� 93 and US 1990� 94.
We estimate several versions of equation (1) by OLS and compute standard errors after clus-
tering at the country level in order to allow for heteroscedasticity and residual serial correlation
of unknown form.
3 Results
In table 3 we present our baseline regression estimates. The �rst and second columns con�rm the
main �ndings from recent studies of the sacri�ce ratio using the sample that we have constructed.
As in Daniels et al. (2005) openness to trade increases the sacri�ce ratio after controlling for its
interaction with CBI, although unlike in the Daniels et al. results the interaction OPEN �CBI
is su¢ ciently negative that the marginal e¤ect from openness (calculated by setting CBI to
its sample mean) is negative. This is consistent with the �nding from Bowdler (2009) that
sacri�ce ratios from the 1990s are more highly negatively correlated with trade openness.10 In
terms of the measure of political stance, we �nd that, per unit, the output cost of disin�ation
is 0:47 percentage points lower when overseen by right wing governments. This estimate is
approximately two thirds that obtained by Caporale and Caporale (2008) using a comparable
speci�cation (table 5, column 3 in their paper), and is signi�cant at the 15% level whereas
the Caporale and Caporale estimate was signi�cant at the 10% level. The evidence for smaller
10Daniels et al. control for the length of a disin�ation rather than its speed, and, in their most general
speci�cation, condition on the measure of wage duration employed by Ball (1994). If the column 1, table 3
speci�cation is changed so that SPEED is omitted and the two Daniels et al. controls are added, our results on
trade openness and central bank independence are unchanged.
11

sacri�ce ratios under right wing governments is slightly weaker when the sample is expanded
using Bowdler (2009) rather than Andersen and Wascher (1999).
In columns 3 � 5 we study the e¤ects of labor market structures on the sacri�ce ratio,
�rst in isolation, then adding other controls. Using the column 3 estimates, an increase in the
degree of labor market coordination is associated with smaller sacri�ce ratios, consistent with
the notion that coordination between labor unions facilitates the wage adjustment required for
disin�ation. The estimate is signi�cant at the 1% level in all speci�cations. The EP index of
employment protection laws increases disin�ation costs, although the e¤ect is signi�cant only
at the 10% level in the column 4 speci�cation and is less signi�cant in other cases.11 Any
positive correlation between employment protection indices and the sacri�ce ratio could arise
if employment protection confers on workers and unions the power to resist wage moderation,
delay disin�ation and raise disin�ation costs. For example, in the case of the United Kingdom,
disin�ation was implemented more rapidly and at lower cost in the 1980s than in the 1970s,
following the rolling back of employment protection legislation under the Thatcher government.
On the other hand, the TU variable is robustly insigni�cant, indicating no evidence that this
measure of the potential importance of unions in wage agreements in�uences disin�ation costs.12
The standardized coe¢ cients for labor market structures, obtained by multiplying the re-
gression coe¢ cients by the ratio of the standard deviation of a labor market variable to the
11 In footnote 6 we noted the potential endogeneity of INFLOSS and SPEED. If those two variables are
omitted from the column 4 speci�cation, the t-ratio for COIB is 2:38 and that for EP is 1:94. Adding the
recipriocal of the length in years of a disin�ation to that regression gives t-ratio of COIB of 3:06 and a t-ratio
for EP of 2:05 (the inverse length variable has a t-ratio of 3:32).12 If the TU term is deleted from the parsimonious speci�cation in column 3, COIB is signi�cant at the 1%
level and EP at the 20% level. If the TU term is deleted from the speci�cation in column 4, COIB is signi�cant
at the 1% level and EP is signi�cant at the 7% level.
12

standard deviation of the sacri�ce ratio, are (using the column 4 estimates) 0:29 for COIB and
0:23 for EP . These e¤ects are far from one-for-one and illustrate what is revealed in the column
2 R2 statistic � labor market structures account for only a small proportion of the variation
in sacri�ce ratios. However, this is not to say that labor market structures do not exert an
economically meaningful e¤ect on disin�ation costs. For example, according to our column 4
estimates, an increase in COIB from the level recorded in the United States and Canada to
the level recorded in Japan, reduces the cost of a 5 percentage point disin�ation by 6:4% of
GDP. Similarly, a loosening of employment protection from the levels seen in Italy and Sweden
to those in the United States could save 6:2% of GDP during a 5% disin�ation. These calcula-
tions should, of course, be interpreted with caution, for example it is not clear that a country
could overhaul employment protection laws whilst leaving all other features of its labor markets
unchanged, but they do suggest that di¤erences in labor market structures exert a meaningful
e¤ect on disin�ation experiences.
In column 5 of table 3 we control for the measure of wage �exibility (WAGE FLEX) due to
Bruno and Sachs (1985) and discussed in section 1 in the context of Ball�s analysis of the sacri�ce
ratio (data restrictions reduce the sample to 72 in this case). The magnitude and signi�cance
of the COIB e¤ect are unchanged, while the magnitude and signi�cance of the EP e¤ect both
fall relative to column 4. In section 1 we argued that labor market characteristics in�uence
sacri�ce ratios via wage dynamics, and it is therefore interesting to note that WAGE FLEX is
insigni�cant and does little to a¤ect the role of labor market variables. There are three points
to bear in mind in relation to this issue. Firstly, some of the e¤ects of wage �exibility may
operate through other controls. For example, in �exible economies policy-makers may have an
incentive to launch rapid disin�ations because the associated output costs are small, in which
case the variable SPEED would capture some of the e¤ect of wage �exibility. A regression
13

of SAC on WAGE FLEX yields a slope coe¢ cient that is signi�cant at the 5% level, giving
some credence to this view, though clearly such a simple model is open to the standard omitted
variables critique. Secondly, it is important to note that WAGE FLEX is a de jure measure
of wage �exibility, in that it indicates the likely degree of �exibility given the extent of wage
indexation, the duration of wage contracts and the synchronization of wage negotiations. It is
not the actual or de facto level of wage �exibility, which matters for disin�ation dynamics in
practice. It is therefore possible that the labor market variables contain information regarding
nominal �exibility over and above that in WAGE FLEX, for example COIB may proxy the
amount of wage adjustment unions actually agree to during negotiations. Thirdly, WAGE
FLEX varies only in the cross-section and has not been updated since its formulation in the
1980s, whereas the measures of labor market structures due to Kenworthy and Nickell et al.
exhibit time-variation and are updated through 2000. Overall, we argue that the insigni�cance
of WAGE FLEX is not at odds with the evidence that labor market features are important
determinants of sacri�ce ratios.
3.1 Testing for Non-linearity
As discussed in section 2, the degree of coordination in wage-setting is related to the central-
ization of wage-setting, which is essentially the inverse of the number of trade unions in the
market. The e¤ects of centralized wage-setting on unemployment and in�ation outcomes have
been investigated in a number of papers, for example Calmfors and Dri¢ ll (1988) and Daniels,
Nourzad and VanHoose (2006). An important theme in these papers is that increases in wage
centralization from a low base may increase in�ation and unemployment, because the growth
of labor unions creates monopoly power in labor markets and raises real wages relative to the
competitive level. The incentive for centralized unions to moderate wage claims in order to
14

improve macroeconomic outcomes starts to dominate only at higher levels of centralization,
yielding the famous inverse U-shape e¤ect from centralization. Although we stress the distinc-
tion between centralization measures and our coordination indices (see section 2), we investigate
non-linearities in the e¤ects of coordination on sacri�ce ratios given their importance in the
literature on centralization.
In order to do this we generated �ve dummy variables, one for each of the �ve tiers from
the Kenworthy COIB index. We then replaced COIB with the dummy variables corresponding
to categories 2 through 5, the omitted dummy being subsumed in the regression intercept (if
this dummy were to be added it would be collinear with the intercept and the other dummy
variables). The included dummy variables measure the incremental e¤ect of COIB in each
tier relative to the lowest tier (COIB = 1), which is the excluded category. Under the inverse
U-shape hypothesis the dummy variable coe¢ cients should be positive for intermediate tiers
(indicating a smaller negative e¤ect of COIB on the sacri�ce ratio at intermediate levels of
coordination) and negative, or at least smaller, for the extreme tiers (indicating large reductions
in the sacri�ce ratio at very high or very low levels of coordination).13 In table 4 we report the
sequence of dummy variable coe¢ cients and absolute t-ratios obtained after clustering at the
country level, for three sets of regression controls: (A) PEAK, INFLOSS, SPEED, OPEN ,
CBI and OPEN �CBI; (B) the model (A) controls plus RIGHT ; (C) the model (B) controls
plus EP and UDNET .
The results provide only weak evidence for the inverse U-shape. The middle three tiers from
13The use of the composite COIB variable up to this point is equivalent to imposing the restriction that the
dummy variable coe¢ cients vary linearly. The negative COIB e¤ect, for instance, implies a linearly decreasing
sequence of dummy variable coe¢ cients. The most important di¤erence between that case and the inverse U-shape
is that the latter implies a non-monotonic relationship between the sacri�ce ratio and COIB.
15

COIB consistently trace out the inverse U-shape, but only the tier 4 coe¢ cients are statistically
signi�cant at conventional levels of con�dence. Furthermore, sacri�ce ratios in tier 1 are 0:23,
0:004 or 0:61 percentage points larger than in tier 2 (depending on the regression speci�cation),
and sacri�ce ratios in tier 5 are 0:50, 0:42 or 0:17 percentage points larger than in tier 4. As
such, the coe¢ cients suggest multiple peaks in the e¤ects of COIB, consistent with a W-shape,
though as noted above the majority of these coe¢ cient estimates are not signi�cant. In essence,
our results provide evidence that high levels of coordination reduce sacri�ce ratios relative to
low levels of coordination, but no evidence that low levels of coordination are associated with
smaller sacri�ce ratios than are intermediate levels of coordination.
3.2 Robustness
In this sub-section we �rst consider the robustness of our baseline results to alternative estimation
strategies, variable measurements and sample de�nitions. We then investigate the relationship
between labor market structures and di¤erent concepts of the sacri�ce ratio. These are derived
from alternative assumptions regarding the behavior of trend output during disin�ations and
therefore yield di¤erent measures of the output loss from disin�ation. Given the importance
of trend output assumptions in quantifying the output cost of disin�ation, this represents an
important test of the robustness of our baseline results.
In the �rst column of table 5 we extend the table 3, column 4 regression to control for a full
set of country �xed e¤ects and decade dummies for disin�ations occurring in the 1970s, 1980s
and 1990s (when disin�ations span decades they are allocated to the decade in which most of
the disin�ation occurred). The e¤ect from COIB is signi�cant at the 5% level. This indicates
that more coordinated wage-setting is associated with smaller disin�ation costs not only across
countries, but also within countries through time. On the other hand, the e¤ect of stricter
16
employment protection, which was marginally signi�cant in the baseline results, is essentially
zero when estimated purely from time series variation in the data. This re�ects the lack of
time variation in EP . We address this issue by turning to an alternative index of employment
protection due to Allard (2003). This index increases with employment protection, on a scale
from 0 to 5. Importantly, it exhibits more time variation than the standard employment protec-
tion index used in our baseline regressions (Allard and Lindert, 2006). In column 2 we use the
new employment protection measure and a full set of �xed e¤ects and time dummies. The EP
e¤ect is signi�cant at the 5% level, providing stronger evidence that within country increases in
employment protection raise disin�ation costs.
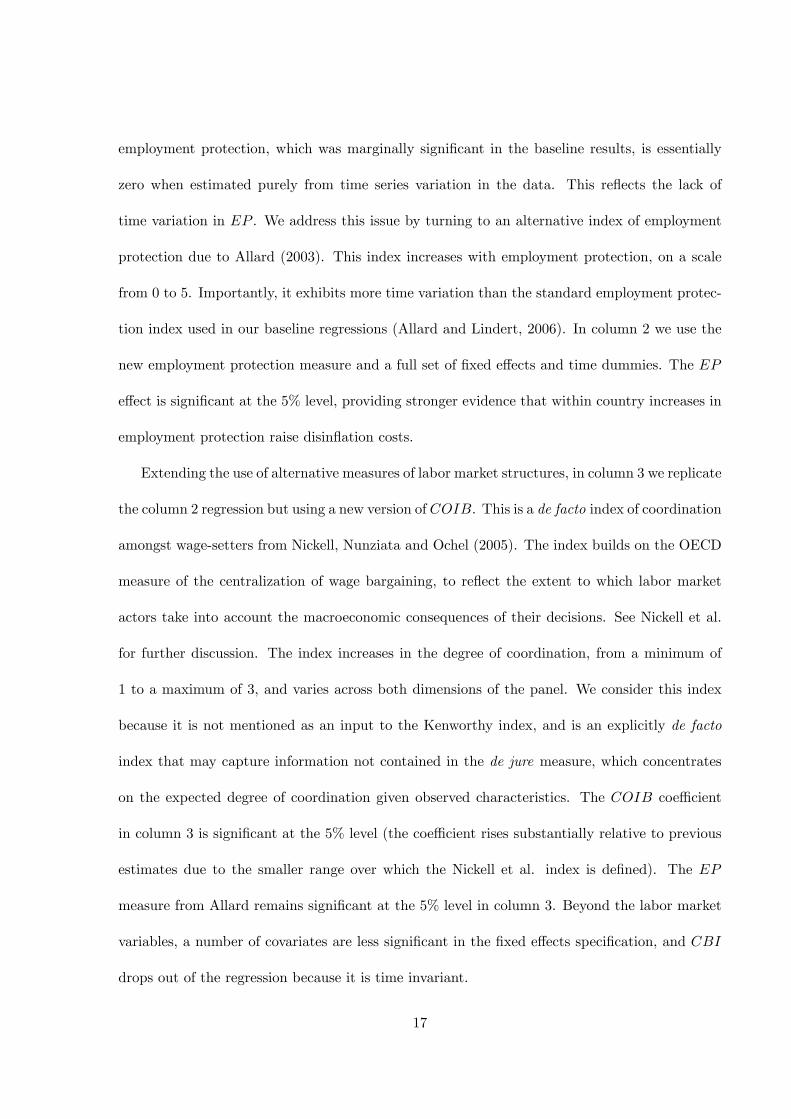
Extending the use of alternative measures of labor market structures, in column 3 we replicate
the column 2 regression but using a new version of COIB. This is a de facto index of coordination
amongst wage-setters from Nickell, Nunziata and Ochel (2005). The index builds on the OECD
measure of the centralization of wage bargaining, to re�ect the extent to which labor market
actors take into account the macroeconomic consequences of their decisions. See Nickell et al.
for further discussion. The index increases in the degree of coordination, from a minimum of
1 to a maximum of 3, and varies across both dimensions of the panel. We consider this index
because it is not mentioned as an input to the Kenworthy index, and is an explicitly de facto
index that may capture information not contained in the de jure measure, which concentrates
on the expected degree of coordination given observed characteristics. The COIB coe¢ cient
in column 3 is signi�cant at the 5% level (the coe¢ cient rises substantially relative to previous
estimates due to the smaller range over which the Nickell et al. index is de�ned). The EP
measure from Allard remains signi�cant at the 5% level in column 3. Beyond the labor market
variables, a number of covariates are less signi�cant in the �xed e¤ects speci�cation, and CBI
drops out of the regression because it is time invariant.
17

Our next robustness exercise involves trimming the sample through excluding observations
for which Cook�s distance statistic (computed from the table 3, column 4 speci�cation) exceeds
the ratio 4degrees of freedom , the threshold recommended in Belsey, Kuh and Welsch (1980). Using
this criterion just one observation is excluded: Finland 1989 � 96. The COIB and EP e¤ects
decrease in magnitude relative to table 3 column 4, but the COIB e¤ect is signi�cant at the 5%
level and the EP e¤ect is signi�cant at the 10% level.
In the �nal column of table 5 we replace the variable PEAK with INF HISTORY , de�ned,
following Hofstetter (2008), as the average annual in�ation rate during the ten years immediately
prior to the year in which disin�ation commenced. The motivation for this exercise is twofold.
Firstly, the variable INF HISTORY is less likely endogenous to the sacri�ce ratio via the
sacri�ce ratio denominator than is PEAK (recall that PEAK is measured in the year in which
disin�ation commences, unlike INF HISTORY which is from the decade prior to that year).
Secondly, Smith and Senda (2008) show that measures of in�ation history play a more important
role in explaining the sacri�ce ratio than does the in�ation peak prior to disin�ation, suggesting
it may be a more important control in evaluating the robustness of the relationship between
labor market structures and the sacri�ce ratio.14 The results in table 5, column 5 con�rm the
Senda and Smith �nding, in that INF HISTORY is signi�cant at the 5% level, whereas PEAK
was insigni�cant in all previous speci�cations. Further, the e¤ects of COIB and EP increase
in magnitude and statistical signi�cance relative to the table 3, column 4 results.
The �nal issue that we address relates to a recent contribution by Goncalves and Carvalho
(2009), who contend that the role of variables measuring institutions (in their case, the presence
of an in�ation target for policy-makers) may be subject to bias via a selection e¤ect. Speci�cally,
14Senda and Smith de�ne in�ation history using geometrically declining weights, but note that their results are
una¤ected when using the unweighted average.
18

countries in which the sacri�ce ratio is inherently low, and which can therefore o¤set positive
in�ation shocks at little cost, may institute in�ation targeting regimes more readily given that
hitting the target is less costly. A correction for selection bias based on Heckman�s procedure is
then implemented. We have not pursued a similar exercise in respect of labor market institutions,
and leave detailed analysis of the determinants of labor market institutions for future research.
However, some relevant insights can be gleaned from our �xed e¤ects regressions in columns
1 and 2 in table 5. The possibility that cross-country variation in labor market structures is
selected in response to international di¤erences in the expected sacri�ce ratio, and that this
selection e¤ect accounts for our results, can be ruled out in these instances. The reason is that
the regression slopes are estimated purely from temporal variation in the data. The evidence
for the robustness of our results after controlling for �xed e¤ects, suggests that our �ndings
are not driven by a cross-sectional selection e¤ect. There remains the possibility that countries
re-con�gure labor market structures through time in response to changes in the sacri�ce ratio.
This cannot be ruled out using our current research design �including a set of time dummies
does not control for selection e¤ects along the time dimension. Evidence from the historical
record suggests that major changes in the structure of labor market institutions are endogenous
to economic conditions, e.g. in the United Kingdom following the election of Margaret Thatcher,
but whether the magnitude of the sacri�ce ratio is one of those conditions is an open question.
3.2.1 Alternative Measures of the Sacri�ce Ratio
A valid assessment of the importance of labor market structures for disin�ation costs depends
critically on accurate measurement of the sacri�ce ratio. In recent contributions, Zhang (2005)
and Hofstetter (2008) have proposed measures of the sacri�ce ratio calculated under alternative
assumptions concerning the evolution of trend output, and which therefore yield di¤erent mea-
19
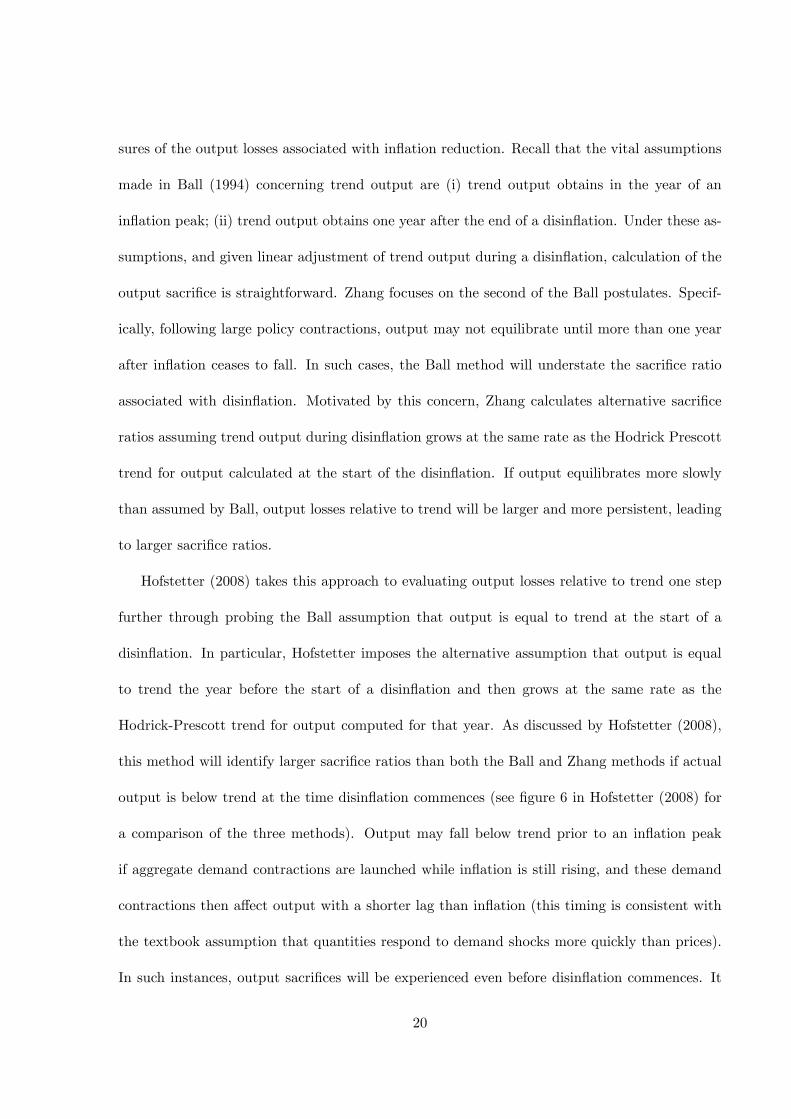
sures of the output losses associated with in�ation reduction. Recall that the vital assumptions
made in Ball (1994) concerning trend output are (i) trend output obtains in the year of an
in�ation peak; (ii) trend output obtains one year after the end of a disin�ation. Under these as-
sumptions, and given linear adjustment of trend output during a disin�ation, calculation of the
output sacri�ce is straightforward. Zhang focuses on the second of the Ball postulates. Specif-
ically, following large policy contractions, output may not equilibrate until more than one year
after in�ation ceases to fall. In such cases, the Ball method will understate the sacri�ce ratio
associated with disin�ation. Motivated by this concern, Zhang calculates alternative sacri�ce
ratios assuming trend output during disin�ation grows at the same rate as the Hodrick Prescott
trend for output calculated at the start of the disin�ation. If output equilibrates more slowly
than assumed by Ball, output losses relative to trend will be larger and more persistent, leading
to larger sacri�ce ratios.
Hofstetter (2008) takes this approach to evaluating output losses relative to trend one step
further through probing the Ball assumption that output is equal to trend at the start of a
disin�ation. In particular, Hofstetter imposes the alternative assumption that output is equal
to trend the year before the start of a disin�ation and then grows at the same rate as the
Hodrick-Prescott trend for output computed for that year. As discussed by Hofstetter (2008),
this method will identify larger sacri�ce ratios than both the Ball and Zhang methods if actual
output is below trend at the time disin�ation commences (see �gure 6 in Hofstetter (2008) for
a comparison of the three methods). Output may fall below trend prior to an in�ation peak
if aggregate demand contractions are launched while in�ation is still rising, and these demand
contractions then a¤ect output with a shorter lag than in�ation (this timing is consistent with
the textbook assumption that quantities respond to demand shocks more quickly than prices).
In such instances, output sacri�ces will be experienced even before disin�ation commences. It
20

is instances of this sort that Hofstetter�s procedure can handle, but Ball�s method cannot.
In order to assess the importance of measurement of the sacri�ce ratio for the relationship
between labor market structures and disin�ation costs, we use data from Senda and Smith
(2008) who calculate sacri�ce ratios using the methods proposed by Ball, Zhang and Hofstetter
for 77 disin�ations occurring between 1960 and 1998. The data vintage used by Senda and
Smith is more recent than that employed by Ball (1994) and consequently the datings of dis-
in�ations, as well as the magnitudes of sacri�ce ratios, di¤er slightly from those used in our
baseline estimations. We use Senda and Smith�s sacri�ce ratios calculated via Ball�s method
as a test of the robustness of our baseline results to the use of a more recent data vintage, in
addition to using Senda and Smith�s sacri�ce ratios calculated using the Zhang and Hofstetter
methods to determine the implications of alternative assumptions regarding trend output during
disin�ations.
We constructed a database comprising the sacri�ce ratios from Senda and Smith and added
measures of each of the covariates described in section 2 (the variables PEAK and INFLOSS
were taken from Senda and Smith). In the new sample of 77 sacri�ce ratios the average sacri�ce
ratio calculated using Ball�s, Zhang�s and Hofstetter�s methods are 1:17%, 2:65% and 3:22%
respectively. Consistent with the arguments presented in Zhang and Hofstetter, sacri�ce ratios
are larger when calculated using alternative assumptions on the evolution of trend output. The
sample correlation between the Ball and Zhang measures is 59%, while that between the Ball and
Hofstetter measures is 64%. The new data were then used to estimate three sets of regressions
for each of the three versions of the dependent variable. The three sets of regression controls
were (A) COIB, EP and UDNET ; (B) the controls in (A) plus INFLOSS, INF HISTORY
and LENGTH (the length of the disin�ation in years); (C) the controls in (B) plus OPEN ,
CBI, OPEN � CBI and RIGHT .
21

The results for COIB and EP are presented in table 6. In the parsimonious regression
speci�cation in row A the negative e¤ect of labor market coordination is weak using each of the
three measures of the sacri�ce ratio. Conditioning on the controls in Senda and Smith (2008),
in row B, increases the strength of these e¤ects such that they are signi�cant at the 5%, 11%
and 26% levels for the Ball, Zhang and Hofstetter measures. As in Senda and Smith�s results,
INF HISTORY and LENGTH are particularly important controls. On the other hand, the
signi�cance of the results is weaker after controlling for the row C covariates. An inspection
of the partial regression plots for COIB (not reported here) indicates that the low levels of
signi�cance are mainly due to the observation for New Zealand, 1994 � 98. Interestingly, all
three measures of the sacri�ce ratio are negative for this episode, which is at odds with the
usual presumption that disin�ation requires an output sacri�ce. In the right-hand panel of table
6 we replicate the COIB estimates for a sample of 76 disin�ations that excludes the 1994� 98
episode for New Zealand. The results are somewhat stronger in this case. In row B, the negative
e¤ect from COIB is signi�cant at the 10% level for each of the three sacri�ce ratio concepts (and
signi�cant at the 1% level using the Ball measure), while in row C, which includes the broadest
range of controls, the COIB e¤ects are always signi�cant at the 15% level (and signi�cant at
the 1% level using the Ball measure). Overall, whilst the relationship between labor market
coordination and the sacri�ce ratio is less strong using sacri�ce ratios calculated using di¤erent
assumptions concerning trend output, it remains negative, and is borderline signi�cant in some
samples and regression speci�cations. In contrast, the EP e¤ect, which was more marginal in
the baseline results, is insigni�cant using the new sacri�ce ratio concepts, and changes signs in
some instances. Accordingly, we emphasize our results for COIB ahead of those for EP .
22

4 Summary
In this paper we have examined the relationship between labor market structures and interna-
tional di¤erences in the sacri�ce ratio, a measure of the output cost of disin�ation. The main
�nding is that coordination between wage-setters in the labor market reduces the sacri�ce ratio,
although the statistical signi�cance of this �nding is sensitive to the use of alternative procedures
for measuring the sacri�ce ratio. A potential explanation for this �nding is that coordinated
wage-setting facilitates the moderation of nominal wage growth required for disin�ation. An in-
dex of employment protection increases the sacri�ce ratio but the relationship is not signi�cant
at conventional levels. Our results indicated that these e¤ects operate even after controlling
for a measure of wage �exibility previously studied in the literature, suggesting that the indices
of labor market structures we study contain information beyond that in standard measures of
wage �exibility. Unlike in the related literature on the centralization of wage-setting, we found
only weak evidence for an inverse U-shape e¤ect from coordination. The robustness of the core
results was investigated in some detail. The basic e¤ects of labor market structures remained
intact after holding constant a wide range of variables that have been studied in the literature,
and also after controlling for outliers in the data. The e¤ect of coordination was robust when
measured using a di¤erent method, but was less strong in a sample of sacri�ce ratios measured
using di¤erent assumptions concerning trend output during disin�ations.
References
Alesina, Alberto, Nouriel Roubini and Gerald Cohen, (1997). Political Cycles in the Macro-
economy. The MIT Press, Cambridge MA.
Allard, Gayle (2003). Jobs and Labor Market Institutions in the OECD. Doctoral disserta-
tion, University of California, Davis.
23
Allard, Gayle and Peter Lindert (2006). �Euro-productivity and Euro-jobs since the 1960s:
Which institutions mattered?�Instituto de Empresa working paper number 22.
Andersen, Palle and William Wascher, (1999). �Sacri�ce Ratios and the Conduct of Mone-
tary Policy in Conditions of Low In�ation.�Bank for International Settlements working paper
82.
Ball, Laurence (1987). �Externalities from Contract Length.�American Economic Review,
77, 615-29.
Ball, Laurence and David Romer (1991). �Sticky Prices as Coordination Failure.�American
Economic Review, 81, 539-52.
Ball, Laurence (1994). �What determines the sacri�ce ratio?�In Mankiw, N. G. ed. Mone-
tary Policy, 155-182. University of Chicago Press, Chicago.
Belsey, David, Edwin Kuh and Roy Welsch (1980). Regression Diagnostics: Identifying
In�uential Data and Sources of Collinearity. John Wiley. New York.
Boschen, John and Charles Weise (2001).�The Ex Ante Credibility of Disin�ation Policy and
the Cost of Reducing In�ation.�Journal of Macroeconomics, 323-47.
Bowdler, Christopher (2009). �Openness, Exchange Rate Regimes and the Phillips Curve.�
Journal of International Money and Finance, 148-60.
Bruno, Michael and Je¤rey Sachs (1985). Economics of Worldwide Stag�ation. Harvard
University Press, Cambridge, MA.
Calmfors, Lars and John Dri¢ ll (1988). �Bargaining structure, corporatism, and macroeco-
nomic performance.�Economic Policy, 14-61.
Calmfors, Lars (2004). �Wages and Wage Bargaining Institutions in the EMU �A Survey
of the Issues.�Seminar Paper no. 690, Institute for International Economic Studies, Stockholm.
Caporale, Barbara and Tony Caporale (2008). �Political Regimes and the Cost of Disin�a-
24
tion.�Journal of Money, Credit and Banking, 1541-54.
Chortareas, Georgios, David Stasavage and Gabriel Sterne (2003). �Does Monetary Policy
Transparency Reduce Disin�ation Costs?�Manchester School, 71, 521-40.
Cukierman, Alex (1992). Central bank strategy, credibility and independence: theory and
evidence. The MIT Press, Cambridge MA.
Daniels, Joseph, Farrokh Nourzad and David VanHoose (2005). �Openness, central bank
independence and the sacri�ce ratio.�Journal of Money, Credit and Banking, 37, 371-79.
Daniels, Joseph, Farrokh Nourzad and David VanHoose (2006). �Openness, centralized wage
bargaining and in�ation.�European Journal of Political Economy, 969-88.
Flanagan, Robert (1999). �Macroeconomic Performance and Collective Bargaining: An
International Perspective.�Journal of Economic Literature, 1150-75.
Goncalves, Carlos Eduardo and Andre Carvalho (2009). �In�ation Targeting Matters: Evi-
dence from OECD Economies�Sacri�ce Ratios.�Journal of Money, Credit and Banking, 233-43.
Hofstetter, Marc (2008). �Disin�ations in Latin America and the Carribean: A Free Lunch?�
Journal of Macroeconomics, 30, 327-45.
Jordan, Thomas (1997). �Disin�ation Costs, Accelerating In�ation Gains, and Central Bank
Independence.�Weltwirtschaftliches Archiv, 1-21.
Kenworthy, Lane (2001). �Wage-Setting Coordination Scores.�Dataset available at
www.emory.edu/SOC/lkenworthy/.
Kenworthy (2003). �Quantitative Indicators of Corporatism.� International Journal of So-
ciology, 10-44.
Nelson, E., 2005. �The Great In�ation of the Seventies: What Really Happened?�Advances
in Macroeconomics, volume 5, article 3.
Nickell, Stephen, Luca Nunziata and Wolfgang Ochel (2005). �Unemployment in the OECD
25

since the 1960s. What do we know?�Economic Journal 115, 1-27.
Nunziata, Luca (2005). �Institutions and Wage Determination: A Multi-Country Ap-
proach.�Oxford Bulletin of Economics and Statistics 67, 435-466.
Olivei, Giovanni and Silvana Tenreyro (2007). �The Timing of Monetary Policy Shocks.�
American Economic Review, 97, 636-663.
Razin, Assaf and Prakash Loungani (2005). �Globalization and In�ation-Output Tradeo¤s.�
NBER working paper 11641.
Romer, David (1993). �Openness and In�ation: Theory and Evidence.�Quarterly Journal
of Economics, 108, 869-903.
Senda, Takashi and Julie Smith (2008). �In�ation History and the Sacri�ce Ratio: Episode-
Speci�c Evidence�Contemporary Economic Policy, 26, 409-19.
Soskice, David (1990). �Wage Determination: The Changing Role of Institutions in Ad-
vanced Industrialized Countries.�Oxford Review of Economic Policy, 36-61.
Taylor, John (1983). �Union Wage Settlements During a Disin�ation.�American Economic
Review, 73, 981-93.
Temple, Jonathan (2002). �Openness, In�ation and the Phillips Curve: A Puzzle.�Journal
of Money, Credit and Banking, 34, 450-468.
Thomas, Alun (2002). �The Costs and Bene�ts of Various Wage Bargaining Structures: An
Empirical Exploration.�International Monetary Fund working paper 02/71.
Zhang, Lawrence (2005). �Sacri�ce Ratios with Long-lived E¤ects.� International Finance,
231-62.
26
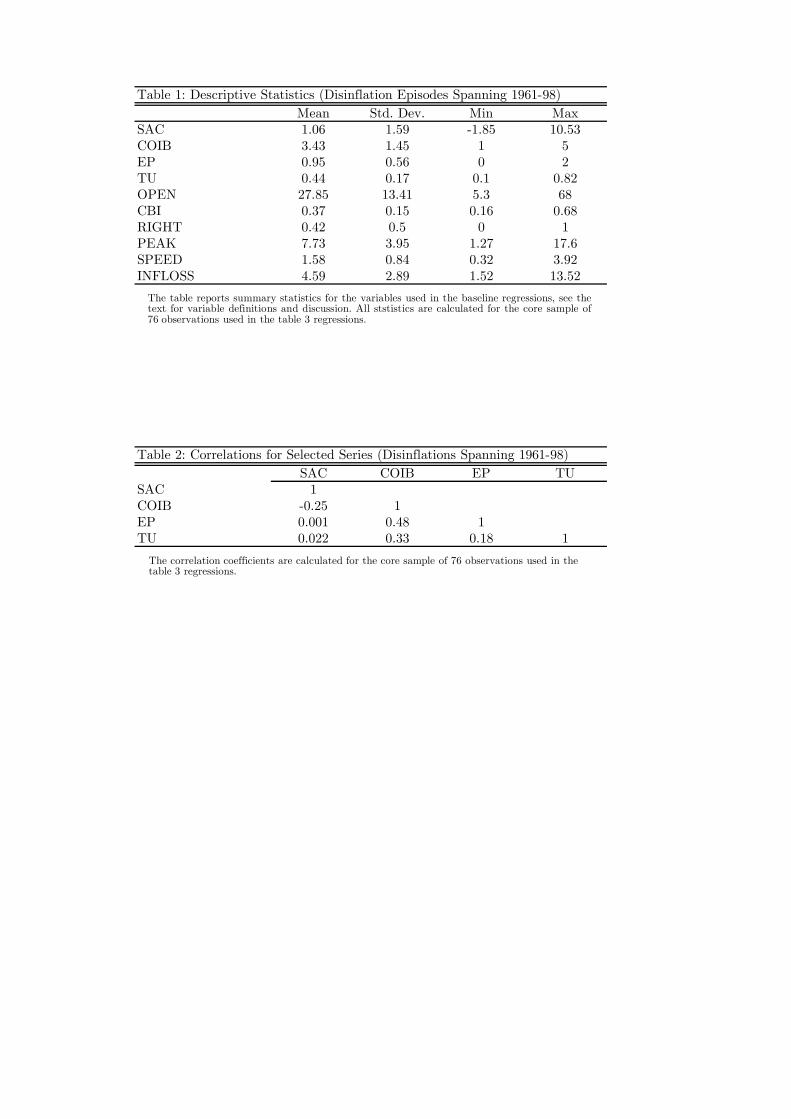
Table 1: Descriptive Statistics (Disinflation Episodes Spanning 1961-98)
Mean Std. Dev. Min MaxSAC 1.06 1.59 -1.85 10.53COIB 3.43 1.45 1 5EP 0.95 0.56 0 2TU 0.44 0.17 0.1 0.82OPEN 27.85 13.41 5.3 68CBI 0.37 0.15 0.16 0.68RIGHT 0.42 0.5 0 1PEAK 7.73 3.95 1.27 17.6SPEED 1.58 0.84 0.32 3.92INFLOSS 4.59 2.89 1.52 13.52
Table 2: Correlations for Selected Series (Disinflations Spanning 1961-98)
SAC COIB EP TUSAC 1COIB -0.25 1EP 0.001 0.48 1TU 0.022 0.33 0.18 1
The table reports summary statistics for the variables used in the baseline regressions, see thetext for variable definitions and discussion. All ststistics are calculated for the core sample of76 observations used in the table 3 regressions.
The correlation coefficients are calculated for the core sample of 76 observations used in the table 3 regressions.

Table 3: Sacrifice Ratios and Labour Market Structures (Disinflations Spanning 1961-98)
1 2 3 4 5COIB -0.43 (2.79)** -0.32 (2.70)** -0.32 (2.78)**EP 0.42 (1.21) 0.65 (1.78) 0.47 (1.47)TU 1.17 (0.63) 1.59 (0.86) 1.98 (0.88)OPEN 0.04 (1.76) 0.04 (1.86) 0.03 (2.28)* 0.02 (1.25)CBI 6.62 (3.36)** 6.99 (3.46)** 6.61 (4.19)** 4.86 (2.43)*OPEN*CBI -0.18 (2.98)** -0.18 (3.04)** -0.13 (3.17)** -0.09 (1.78)PEAK -0.01 (0.10)** -0.01 (0.19) -0.05 (0.54) -0.05 (0.56)SPEED -0.82 (4.10) -0.72(3.50)** -0.56 (3.69)** -0.64 (4.35)**INFLOSS 0.17 (1.63) 0.15 (1.51) 0.15 (0.44) 0.15 (1.68)RIGHT -0.47 (1.55) -0.46 (1.53) -0.35 (1.23)WAGE FLEX -0.07 (0.52)
R20.24 0.26 0.11 0.32 0.33
Sample size 76 76 76 76 7276The dependent variable is the sacrifice ratio. See the text for details concerning the measurement of the sacrifice ratio and
the regressors. All regressions include an intercept. The figures in parentheses are absolute t-ratios based on standarderrors calculated after clustering at the country level. ** and * denote significance at the 1% and 5% levels respectively.

Table 4: Non-linear Effects of Coordination (Disinflations Spanning 1961-98)
COIB SCORE A B C
2 -0.23 -0.004 -0.61
(0.47) (0.01) (1.41)
3 1.09 1.21 0.7
(1.24) (1.35) (0.91)
4 -0.75 -0.59 -1.22
(3.63)** (2.64)* (4.35)**
5 -0.25 -0.17 -1.05
(0.94) (0.62) (1.88)
Estimates of the change in the sacrifice ratio from each COIB category relative to category oneof COIB (the excluded category). The figures in parentheses are absolute t-ratios based onstandard errors calculated after clustering at the country level. ** and * denote significance atthe 1% and 5% levels respectively. Column A results are from a regression that includesPEAK, INFLOSS, SPEED, OPEN, CBI and OPEN*CBI. Column B results are from aregression that contains the colum A variables plus RIGHT. Column C results are from aregression that contains the column B variables plus EP and UDNET.
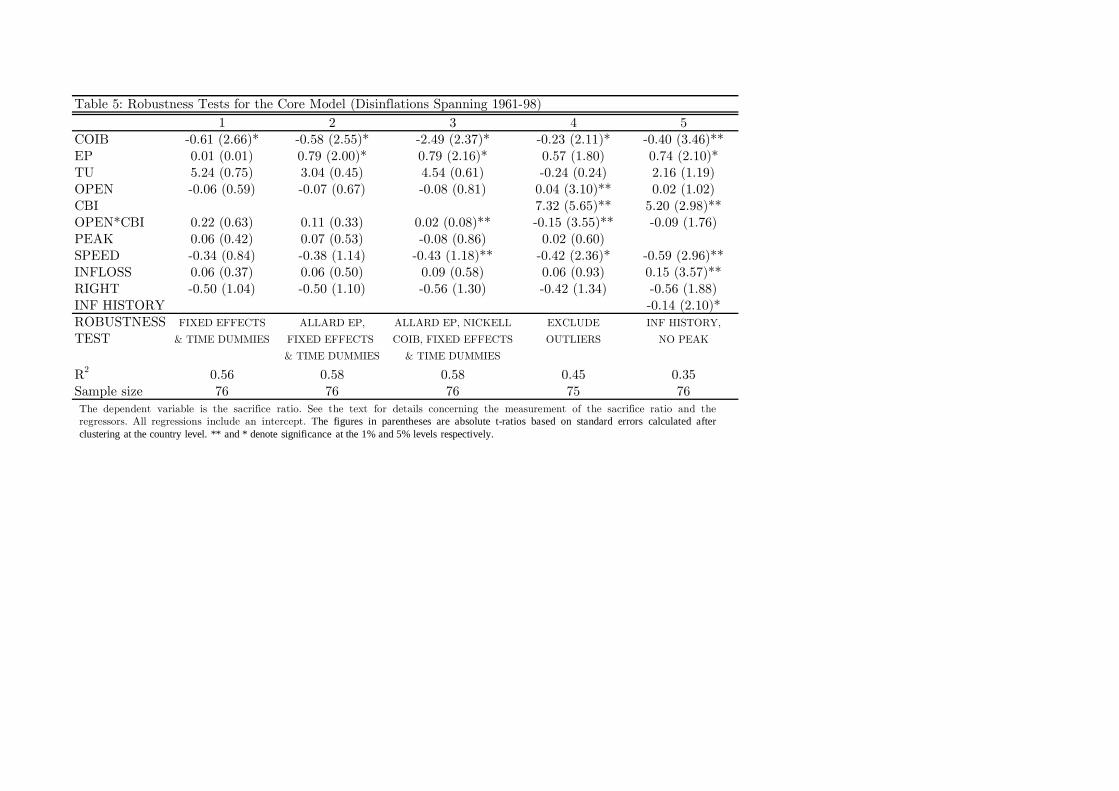
Table 5: Robustness Tests for the Core Model (Disinflations Spanning 1961-98)
1 2 3 4 5COIB -0.61 (2.66)* -0.58 (2.55)* -2.49 (2.37)* -0.23 (2.11)* -0.40 (3.46)**EP 0.01 (0.01) 0.79 (2.00)* 0.79 (2.16)* 0.57 (1.80) 0.74 (2.10)*TU 5.24 (0.75) 3.04 (0.45) 4.54 (0.61) -0.24 (0.24) 2.16 (1.19)OPEN -0.06 (0.59) -0.07 (0.67) -0.08 (0.81) 0.04 (3.10)** 0.02 (1.02)CBI 7.32 (5.65)** 5.20 (2.98)**OPEN*CBI 0.22 (0.63) 0.11 (0.33) 0.02 (0.08)** -0.15 (3.55)** -0.09 (1.76)PEAK 0.06 (0.42) 0.07 (0.53) -0.08 (0.86) 0.02 (0.60)SPEED -0.34 (0.84) -0.38 (1.14) -0.43 (1.18)** -0.42 (2.36)* -0.59 (2.96)**INFLOSS 0.06 (0.37) 0.06 (0.50) 0.09 (0.58) 0.06 (0.93) 0.15 (3.57)**RIGHT -0.50 (1.04) -0.50 (1.10) -0.56 (1.30) -0.42 (1.34) -0.56 (1.88)INF HISTORY -0.14 (2.10)*ROBUSTNESS FIXED EFFECTS ALLARD EP, ALLARD EP, NICKELL EXCLUDE INF HISTORY,
TEST & TIME DUMMIES FIXED EFFECTS COIB, FIXED EFFECTS OUTLIERS NO PEAK
& TIME DUMMIES & TIME DUMMIES
R2
0.56 0.58 0.58 0.45 0.35Sample size 76 76 76 75 76The dependent variable is the sacrifice ratio. See the text for details concerning the measurement of the sacrifice ratio and theregressors. All regressions include an intercept. The figures in parentheses are absolute t-ratios based on standard errors calculated afterclustering at the country level. ** and * denote significance at the 1% and 5% levels respectively.

Table 6: Estimates from Alternative Sacrifice Ratio Measures (1960-98)
Full sample (77 disinflations) Sample excluding New Zealand 1994-98
Results for COIB
Ball Zhang Hofstetter Ball Zhang Hofstetter
A -0.09 (1.38) -0.13 (0.57) 0.03 (0.13) -0.13 (1.79) -0.19 (0.79) -0.12 (0.50)
B -0.16 (2.59)* -0.32 (1.62) -0.22 (1.17) -0.19 (3.57)** -0.38 (1.89) -0.35 (1.88)
C -0.14 (2.10)* -0.27 (1.29) -0.18 (0.92) -0.18 (2.85)** -0.33 (1.51) -0.32 (1.54)
Results for EP
Ball Zhang Hofstetter Ball Zhang Hofstetter
A 0.33 (1.40) 1.10 (2.12)* 0.43 (0.76) 0.37 (1.52) 1.16 (2.14)* 0.59 (1.04)
B -0.07 (0.31) 0.28 (0.50) -0.17 (0.34) -0.05 (0.24) 0.31 (0.55) -0.10 (0.20)
C 0.08 (0.48)* 0.89 (1.44) 0.76 (1.43) 0.04 (0.22)** 0.81 (1.24) 0.59 (0.55)
Estimates of the COIB and EP effects for Ball, Zhang and Hofstetter sacrifice ratios calculated by Senda and Smith (2008). Thefigures in parentheses are absolute t-ratios based on standard errors calculated after clustering at the country level. ** and *denote significance at the 1% and 5% levels respectively. Row A results are from regressions that control for COIB, EP andUDNET. Row B results are from regressions that control for the row A variables plus INFLOSS, INF HISTORY and LENGTH.Row C results are from regressions that control for the row B variables plus OPEN, CBI, OPEN*CBI and RIGHT.


