Labor Market in Vietnam - · PDF fileLabor Market in Vietnam: Reforms and Developments in the...
46
Labor Market in Vietnam: Reforms and Developments in the context of Globalization Thang Dang School of Economics University of Economics Ho Chi Minh City, Vietnam [email protected] November 28 th 2011
Transcript of Labor Market in Vietnam - · PDF fileLabor Market in Vietnam: Reforms and Developments in the...

Labor Market in Vietnam:
Reforms and Developments in the context of Globalization
Thang Dang School of Economics
University of Economics Ho Chi Minh City, Vietnam
November 28th 2011

Problems of the Statement
• Roles of labor market in economic development
• Vietnam’s transition towards to market economy
• Global macroeconomic fluctuations
• Roles of policy-makers on employment and labor market
28/11/2011 2 Thang Dang

Outline
1. Vietnam Economy Overview
2. Labor Market: Reforms and Recent
Developments
3. The 2007–2008 Global Financial Crisis and
Labor Market
4. Problems facing the Vietnamese Labor Market
5. Some Suggestions for Policy-Makers
28/11/2011 3 Thang Dang

1. Vietnam Economy
Overview
28/11/2011 Thang Dang 4

Impressive economic growth
• Since the 1986 Doi moi (Renovation):
– A transition from a centrally planned to a market
economy
– Stable economic growth strongly
28/11/2011 5 Thang Dang

Figure 1.1: Real GDP Growth of Selected East Asian Economies,1986–2010 (% annual)
Source: Data from World Development Indicators (1986–2010)
28/11/2011 6 Thang Dang
-15.0
-10.0
-5.0
0.0
5.0
10.0
15.0
20.0
1986 1987 1988 1989 1990 1991 1992 1993 1994 1995 1996 1997 1998 1999 2000 2001 2002 2003 2004 2005 2006 2007 2008 2009 2010
% A
nnua
l G
DP
Gro
wth
Year
Vietnam China Thailand Malaysia Indonesia
After the Asian financial crisis in 1998, Vietnam’s economic
growth has been second only to that in China in Asia

Figure 1.2: Average economic growth rates, 2000–2008 (%)
28/11/2011 Thang Dang 7
3.9
5.9 5.4
10.2
7.3 7.5
World Asia Pacific ASEAN China India Vietnam
Source: Data from IMF (2009)

28/11/2011 Thang Dang 8
0%
10%
20%
30%
40%
50%
60%
70%
80%
90%
100%
1986 1987 1988 1989 1990 1991 1992 1993 1994 1995 1996 1997 1998 1999 2000 2001 2002 2003 2004 2005 2006 2007 2008 2009
% o
f to
tal G
DP
Year
Agriculture Industry Services
Source: Data from GSO National Accounts (1986–2009)
Figure 1.3: Contribution to total GDP by aggregated economic sectors, 1986–2009
(constant prices 1994)
Changing the structure of economy towards industry
and services

Sources for economic growth
• The point is that while FDI plays a critical role in opening
up new export markets and encouraging technological
change and transfer, its role in providing employment will
continue to remain secondary to domestic firms.
(Permani, 2008 and 2009)
• Exported–Oriented Industrialization (EOI) policies
28/11/2011 9 Thang Dang

Figure 1.4: Foreign Direct Investment (FDI) Inflows into Vietnam, 1991–2010 (USD millions)
28/11/2011 Thang Dang 10
0
2000
4000
6000
8000
10000
12000
14000
1991 1992 1993 1994 1995 1996 1997 1998 1999 2000 2001 2002 2003 2004 2005 2006 2007 2008 2009 2010
USD
m
il.
Year
Source: Data from GSO (1991–2011)

Figure 1.5: Vietnam’s Exports of Goods and Services, 1986–2010 (% of GDP)
28/11/2011 Thang Dang 11
0.0
10.0
20.0
30.0
40.0
50.0
60.0
70.0
80.0
90.0
1986 1987 1988 1989 1990 1991 1992 1993 1994 1995 1996 1997 1998 1999 2000 2001 2002 2003 2004 2005 2006 2007 2008 2009 2010
% o
f G
DP
Year
Source: Data from World Development Indicators (1996–2010)

2. Labor Market: Reforms
and Recent Developments
28/11/2011 Thang Dang 12

Population and Labor Force
• Big size of population and labor force:
– Human Resource for development: Increasing productivity,
competitiveness, and economic development
– Rising the rate of savings in the economy
– Key Policies: Creating employment to utilize this resource; social
security
28/11/2011 Thang Dang 13

Figure 2.1: Population of Vietnam, 2000–2008 (‘000 people)
28/11/2011 Thang Dang 14
77635
78686
79727
80902
82032
83106
84137
85172
86211
72000
74000
76000
78000
80000
82000
84000
86000
88000
2000 2001 2002 2003 2004 2005 2006 2007 2008
'000 p
eopl
e
Years
Source: Data from GSO (2000–2008)

Figure 2.2: Vietnam’s Labor Participation Rate, 1986–2010 (% of Total Population Ages 15+)
28/11/2011 Thang Dang 15
68
69
70
71
72
73
74
75
76
77
78
79
1986 1987 1988 1989 1990 1991 1992 1993 1994 1995 1996 1997 1998 1999 2000 2001 2002 2003 2004 2005 2006 2007 2008 2009
% o
f to
tal po
pula
tion
15+
Year
Source: Data from World Development Indicators (1986–2009)
Although there are some decreases in Labor
Participation relatively due to …
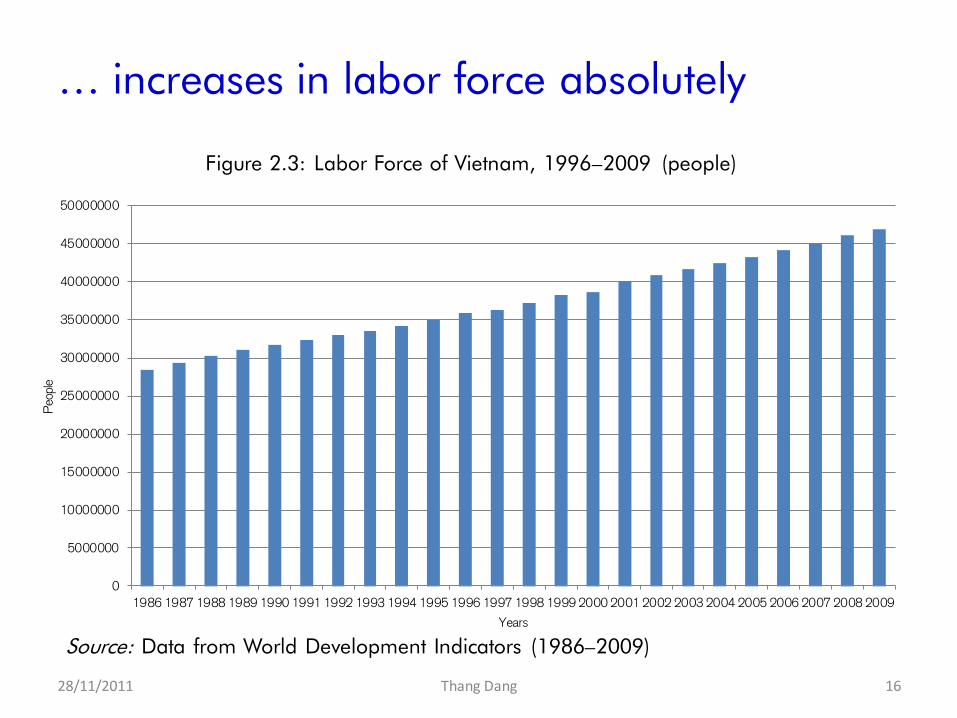
Figure 2.3: Labor Force of Vietnam, 1996–2009 (people)
28/11/2011 Thang Dang 16
0
5000000
10000000
15000000
20000000
25000000
30000000
35000000
40000000
45000000
50000000
1986 1987 1988 1989 1990 1991 1992 1993 1994 1995 1996 1997 1998 1999 2000 2001 2002 2003 2004 2005 2006 2007 2008 2009
Peo
ple
Years
Source: Data from World Development Indicators (1986–2009)
… increases in labor force absolutely

Figure 2.4: Labor force 15 years and older by age groups, 2000–2010 (% of Labor Force)
28/11/2011 Thang Dang 17
0%
10%
20%
30%
40%
50%
60%
70%
80%
90%
100%
2000 2001 2002 2003 2004 2005 2006 2007 2008 2009 2010
% o
f Lab
or F
orce
Year
15 - 24 25 - 49 50+
Source: Data from GSO (2000 - 2010)
Young labor force has brought many valuabe things….,
however there have been some drawbacks ….

Population and Labor Force
• How is about the quality of Vietnamese labor force?
28/11/2011 Thang Dang 18

Although there are improvements on average
schooling years…
28/11/2011 Thang Dang 19
7.4 7.4 7.5
8.1
8.3
1993 1998 2002 2004 2006
Ave
rage
Yea
r of
Sch
oolin
g
Year
Source: Data from VLSS (1993, and 1998); VHLSS (2002, 2004, and 2006)
Figure 2.5: Average years of schooling of working age population

Figure 2.6: Education structure of working age population, 1993–2006 (%)
28/11/2011 Thang Dang 20
0%
10%
20%
30%
40%
50%
60%
70%
80%
90%
100%
1993 1998 2002 2004 2006
% o
f w
orki
ng a
ge p
opul
atio
n
Years
No degree & primary school Lower secondary school Upper secondary school Junior College and above
Source: Data from VLSS (1993, and 1998); VHLSS (2002, 2004, and 2006)
…,the quality of labor resources is still major problem

Employment Trend
• Labor mobility:
– Increasing rural–urban migration rate (although 72%
of population from rural regions) (MOLISA, 2010)
– Mobility of workers from the agricultural to industrial-
service sectors and vice versa is possible with
transactions costs (Chan et al. 2005)
28/11/2011 Thang Dang 21

Employment Trend
• Employment Growth:
28/11/2011 Thang Dang 22
Year 2000 2001 2002 2003 2004 2005 2006 2007
Labor Force Participation Rate 72.3 73.0 72.5 72.0 71.4 71.1 70.3 69.7
Employment Rate of Population 15+ 70.7 71.0 70.9 70.4 69.9 69.6 68.7 68.1
Table 2.1: Labor Force Participation Proportion and Employment Rate of Population
aged 15 and over, 2000–2007 (%)
Source: MOLISA, and Labor Survey (2000–2007)

Employment Trend
• Employment Growth: Non-stated sector has increasing
contribution to employment creation in the economy
(MOLISA, years from 2000 to 2007)
– Employment rate: 90%
– Employment creator rate: 91%
28/11/2011 Thang Dang 23

Employment Growth has been low, and …
Industry Employment Elasticities
Agriculture -0.11
Industry 0.85
Manufactoring 0.66
Construction 0.41
Services 0.68
Non–Agriculture 0.74
All sectors 0.31
28/11/2011 Thang Dang 24
Source: Adapted from Manning (2010)
Table 2.2: Employment Elasticities with Respect to Output
by Industry (2000–2007)

… has been not equivalent to Economic Growth
• Have public policies for creating jobs in Vietnam been
sufficient and effective?
28/11/2011 Thang Dang 25
1.27
0.58
0.58
0.47
0.43
0.37
0.32
0.28
0.21
0 0.2 0.4 0.6 0.8 1 1.2 1.4
Brunei Darussalam
Singapore
Philippines
Malaysia
Indonesia
Lao PDR
Cambodia
Vietnam
Thailand
Source: Adapted from MOLISA (2010)
Figure 2.7: Employment Elasticities to GDP of some selected countries in
Southeast Asia, 2004–2008

Employment Trend
• Job creation:
– Jobs in the foreign sector: rapid employment expansion in
manufacturing (accounting for nearly 40 per cent of all new
jobs 2000–2007) (Manning 2010)
– Jobs were created for new job seekers as well as rural
workers who had been previously engaged in agriculture
– Even though employment growth was much slower than in
the foreign sector, the majority of new jobs (around 75 per
cent) were created in the domestic private sector in 2000–
2007
– The variety of jobs created outside the agricultural sector
28/11/2011 26 Thang Dang

Changing the structure of employment by economic
sectors in the economy …
28/11/2011 Thang Dang 27
0%
10%
20%
30%
40%
50%
60%
70%
80%
90%
100%
2000 2001 2002 2003 2004 2005 2006 2007
% o
f T
otal
Em
ploy
men
t
Years
Agriculture Industry Services
Figure 2.8: Employment Rates by economic sectors, 2000–2007 (%)
Source: MOLISA (years from 2000 to 2007)

Unemployment Trend
• Low umployment rates because workers willing to accept
low-paid jobs more than underemployment status
28/11/2011 Thang Dang 28
0
0.5
1
1.5
2
2.5
3
2000 2001 2002 2003 2004 2005 2006 2007
Une
mpl
oym
ent
Rat
e
Year
Source: Data from MOLISA and Labor Survey (years from 2000 to 2007)
Figure 2.9: Unemployment Rate, 2000–2007 (%)

Figure 2.10: Unempoyment Rates of Labor Force in Urban Regions,
1996–2010 (%)
28/11/2011 Thang Dang 29
0.00
1.00
2.00
3.00
4.00
5.00
6.00
7.00
8.00
1996 1997 1998 1999 2000 2001 2002 2003 2004 2005 2006 2007 2008 2009 2010
% u
nepl
oym
ent
Years
Source: Data from GSO (years from 1996 to 2010)

Labor Productivity
• What is about productivity of Vietnamese laborers?
28/11/2011 Thang Dang 30
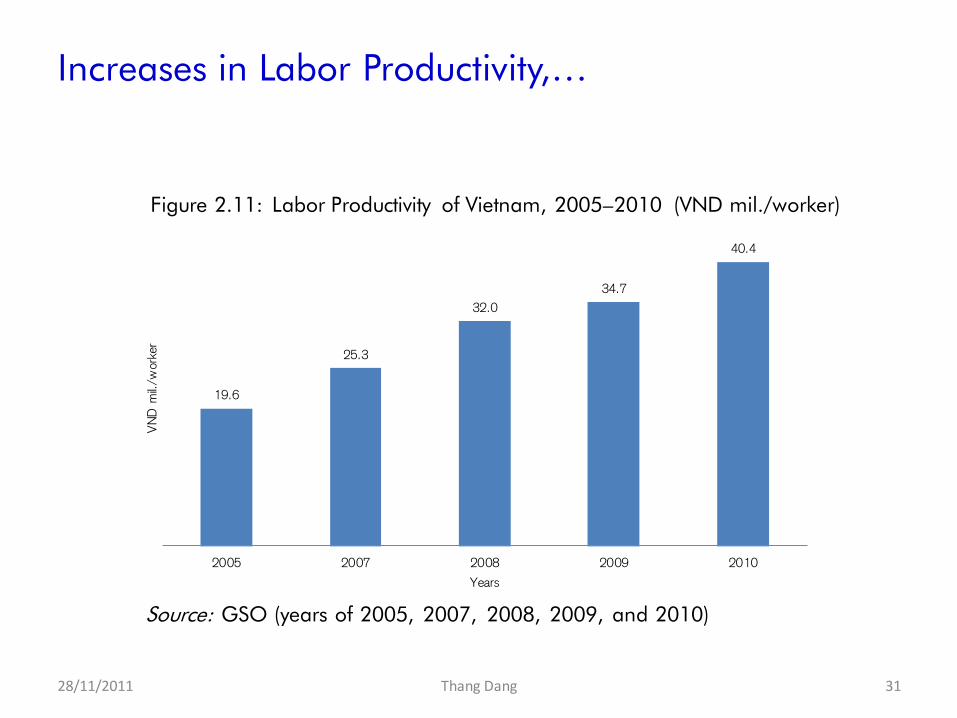
Figure 2.11: Labor Productivity of Vietnam, 2005–2010 (VND mil./worker)
28/11/2011 Thang Dang 31
19.6
25.3
32.0
34.7
40.4
2005 2007 2008 2009 2010
VN
D m
il./w
orke
r
Years
Source: GSO (years of 2005, 2007, 2008, 2009, and 2010)
Increases in Labor Productivity,…

Figure 2.12: Labor Productivity of Some Countries in 2008 (USD, 1990)
28/11/2011 Thang Dang 32
45,958
25,924
15,520
10,430
10,406
9,276
8,214
7,453
5,702
4,079
0 5,000 10,000 15,000 20,000 25,000 30,000 35,000 40,000 45,000 50,000
Singapore
Malaysia
Thailand
China
Indonesia
ASEAN
Philippines
India
Vietnam
Cambodia
USD
Cou
ntrie
s
Source: Adapted from MOLISA (2010)
…. low labor productivity in comparing with other
countries in Asia

Figure 2.13: Comparative labor force utilization in the world, 2003–2007 (%)
Source: Economic Intelligence Unit (2008)
Turkey
Sri Lanka
Colombia
Nicaragua
Philippines Malaysia
Pakistan
Bulgaria
Morocco
Mexico Argentina
Hungary Italy Austria Romania Bangladesh Poland
France India
Lithuania Indonesia
Slovakia Brazil
USA UK Finland
Germany Czech republic
South Korea
Japan Portugal
Canada Thailand
China
Sweden Hong Kong Norway NewZealand
Chile
Slovenia
Taiwan
Spain
Latvia
Russia Australia
Iceland
VietNam
Ireland
Singapor
30%
35%
40%
45%
50%
55%
60%
-3% -2% -1% 0% 1% 2% 3% 4% 5% 6%
Lab
or f
orce
par
ticip
atio
n ra
te 2
007
Change in labor force participation rate, 2003 - 2007
28/11/2011 33 Thang Dang

Figure 2.14: Comparative labor productivity in the world, 2003–2007 (%)
Coted Ivoire Senegal
Dominican Republic Yemen
Ecuador Brazil Iran
Syria
Peru
Pakistan
Kenya Ghana Bangladesh Nigeria
Philippines VietNam
Ethiopia Cambodia
India
Indonesia South Africa Egypt Thailand Bulgaria
Tunisia
Costa Riac Mexico
Chile Argentina Croatia Poland
Portugal
Hungary
Ukraine
Sri Lanka
Russia Colombia
Czech republic Kazakhstan
Malaysia Turkey
Saudi Arabia
Lithuania
Slovakia Latvia
Slovenia NewZealand
Spain Greece South Korea
Switzerland
Germany
Italy Austria
Canada Australia
Israel Iceland
Japan Denmark Taiwan Singapore
Sweden UK Finland Norway
France Ireland
USA
Hong Kong
Estonia
Venezuela
Belarus
China
2000
12000
22000
32000
42000
52000
62000
72000
82000
-1% 1% 3% 5% 7% 9%
GD
P p
er e
mpl
oyee
2007 (
ajus
ted
PP
P)
Compound annual growth rate of real GDP per employee, 2003 - 2007
Source: Asia Community Research Center (2008)
28/11/2011 34 Thang Dang

Labor Productivity
• The agricultural sector (Mainning 2010)
– Quite large by international standards: In 2007, it accounted for
just under half of all employment (for example, compared with 40
per cent of jobs in Indonesia and closer to 30 per cent in the
Philippines among comparator countries in East Asia).
– Recorded labor productivity was very low: one-quarter to one-fifth
of productivity levels in manufacturing and most service sectors in
2007
28/11/2011 Thang Dang 35

Wage and Income
• Wage and laborers’ income has been increased during
the period of strong economic growth (MOLISA, 2010)
28/11/2011 Thang Dang 36

3. The 2007-2008 Global Financial Crisis
and Labor Market
• Economic stability began to falter and Vietnam faced a
difficult eighteen months before it began to be caught up
in the global slowdown in the second half of 2008
(Thanh and Duong, 2009)
• As first price instability and then the GFC impacted on
output and exports.
– The Vietnam economy has performed well: growth performance through
2008 and 2009 is much closer to that of China (and Indonesia) than
countries more seriously affected by the slowdown in the global
economy;
28/11/2011 Thang Dang 37

Figure 3.1: Annual GDP Growth in Selected East Asian Countries,
2007–2010 (% annual)
28/11/2011 Thang Dang 38
-4.0
-2.0
0.0
2.0
4.0
6.0
8.0
10.0
12.0
14.0
16.0
2007 2008 2009 2010
% A
nnua
l Eco
nom
ic
Gro
wth
Years
Vietnam China Thailand Malaysia Indonesia
Source: Data from World Development Indicators (2011)

28/11/2011 Thang Dang 39
Figure 3.2: Vietnam’s Exports of Goods and Services,
2007–2010 (% of GDP)
62.0
64.0
66.0
68.0
70.0
72.0
74.0
76.0
78.0
80.0
2007 2008 2009 2010
% o
f G
DP
Years
Source: Data from World Development Indicators (yearly)

3. The 2007–2008 Global Financial Crisis
and Labor Market
• Labor Market Impacts
– Effects on employment, hours of work and wages in
export-oriented industries: being especially felt by
more vulnerable contract workers and in some small
and medium establishments which produce products
outsourced from larger exporting firms
– The absence of direct government support, are likely
to flow through to the domestic economy, impacting
on jobs and, more important, incomes of the large
majority of self-employed workers
28/11/2011 Thang Dang 40

3. The 2007–2008 Global Financial Crisis
and Labor Market
• Response to the Crisis
– Export-oriented firms and small and micro-enterprises
linked to global production networks were hit
particularly hard
– While job losses for regular workers tended to be
small (especially since companies were concerned
about capacity to respond to demand increases during
the recovery), firms adjusted by reducing hours of
work, overtime and the number of shifts
– Many workers who did lose their jobs were able to
shift to agriculture, trade and construction (the latter
boosted by stimulus packages) and at lower rates of
pay in the informal sector
28/11/2011 Thang Dang 41

3. The 2007–2008 Global Financial Crisis
and Labor Market
• Consequences:
– Unemployment increases were not large but poverty
decline for individuals is estimated to have halted in
East Asia (World Bank 2009b, p. 24) due to flexible
labour markets have ensured low unemployment
– Being been milder compared with several
neighbouring countries (Vietnam’s degree of
international exposure)
28/11/2011 Thang Dang 42

Figure 3.3: Unemployment rates of
labor force age by region (%)
28/11/2011 Thang Dang 43
0.00
0.50
1.00
1.50
2.00
2.50
3.00
3.50
4.00
4.50
5.00
2008 2009 2010
%
Years
Total Urban Rural
0.00
1.00
2.00
3.00
4.00
5.00
6.00
7.00
2008 2009 2010
%
Years
Total Urban Rural
Figure 3.4: Underemployment rates of
labor force age by region (%)
Source: GSO, Employment and national accounts data (yearly)

3. The 2007–2008 Global Financial Crisis
and Labor Market
• Labour Institutions and the Recovery
– The right signals to workers in regard to higher
productivity opportunities
– Workers being able and willing to move to growing
sectors of the economy
– Need more labor market flexibility from labor
regulations
• Particularly in:
– Minimum Wages
– Industrial Relations
28/11/2011 Thang Dang 44

4. Problems facing Vietnamese Labor Market
• Challenges facing Vietnam’s labor market (Manning,
2010)
– Slower labor market adjustment because of the institutional
environment
– Shortages of skilled labor
– Labor market rigidities and
– An under-developed industrial relations system
• Some major impediments still remain to a more flexible
labor market, which inhibit employment adjustments,
both in boom and bust. Obstacles to employment
creation have included the system of registration for
rural urban migrants, which has probably slowed
permanent migration for jobs into cities and the new
industrial zones (Loi, 2005)
28/11/2011 45 Thang Dang

5. Some suggestions for policy-makers
• Need more reforms in the labor market institutional
environment
• Educational Reforms: Enhancing the quality of human
resources (Major Problem in Vietnam)
• Flexible industrial relations system: Labor mobility
• Social Security Policies for workers
28/11/2011 46 Thang Dang