Label-free live brain imaging and targeted patching with ... · Label-free live brain imaging and...
6
Label-free live brain imaging and targeted patching with third-harmonic generation microscopy Stefan Witte a,b,1 , Adrian Negrean a,b,c , Johannes C. Lodder b,c , Christiaan P. J. de Kock b,c , Guilherme Testa Silva b,c , Huibert D. Mansvelder b,c,2 , and Marie Louise Groot a,b,2 a Biophysics Group, Institute for Lasers, Life, and Biophotonics Amsterdam, VU University, De Boelelaan 1081, 1081 HV, Amsterdam, The Netherlands; c Integrative Neurophysiology, Centre for Neurogenomics and Cognitive Research, VU University, De Boelelaan 1085, 1081 HV, Amsterdam, The Netherlands; and b Neuroscience Campus Amsterdam, De Boelelaan 1085, 1081 HV, Amsterdam, The Netherlands Edited* by Margaret M. Murnane, University of Colorado, Boulder, CO, and approved February 18, 2011 (received for review December 15, 2010) The ability to visualize neurons inside living brain tissue is a funda- mental requirement in neuroscience and neurosurgery. Especially the development of a noninvasive probe of brain morphology with micrometer-scale resolution is highly desirable, as it would provide a noninvasive approach to optical biopsies in diagnostic medicine. Two-photon laser-scanning microscopy (2PLSM) is a powerful tool in this regard, and has become the standard for minimally invasive high-resolution imaging of living biological samples. However, while 2PLSM-based optical methods provide sufficient resolution, they have been hampered by the requirement for fluorescent dyes to provide image contrast. Here we demonstrate high-contrast imaging of live brain tissue at cellular resolution, without the need for fluorescent probes, using optical third-harmonic generation (THG). We exploit the specific geometry and lipid content of brain tissue at the cellular level to achieve partial phase matching of THG, providing an alternative contrast mechanism to fluorescence. We find that THG brain imaging allows rapid, noninvasive label- free imaging of neurons, white-matter structures, and blood ves- sels simultaneously. Furthermore, we exploit THG-based imaging to guide micropipettes towards designated neurons inside live tissue. This work is a major step towards label-free microscopic live brain imaging, and opens up possibilities for the development of laser-guided microsurgery techniques in the living brain. biomedical imaging ∣ biophotonics ∣ neuro-imaging ∣ nonlinear optics H igh-resolution imaging is an essential technique in many areas of science. In diagnostic medicine, the ability to per- form a noninvasive optical biopsy (1, 2) of various types of tissue with micrometer-scale resolution would provide a major step forward. While two-photon laser-scanning microscopy (2PLSM)- based methods have revolutionized biological imaging (3, 4), they require fluorescent probes to provide image contrast. Such probes may interfere with cellular function and are usually not practical for biomedical applications. Other nonlinear intera- ction mechanisms can provide intrinsic, label-free image contrast in nonlinear microscopy, such as second-harmonic generation (SHG) (5), third-harmonic generation (THG) (6–10), coherent anti-Stokes Raman scattering (11, 12), and stimulated Raman scattering (13). Here we show that specifically THG microscopy is a powerful and versatile tool for label-free live brain imaging. THG is a well known nonlinear optical phenomenon (14), which has the inter- esting property that the phase-matching conditions required for efficient THG can be enhanced by the presence of discontinuities within the focal volume of a laser beam. In imaging, THG micro- scopy has been shown to provide contrast in transparent samples (15), and its potential has been explored for dermatological studies (16, 17), zebrafish embryogenesis (18), and zebrafish nervous system imaging (19). While these studies demonstrate the excellent possibilities of label-free microscopy, THG imaging provided only partial information, and had to be augmented by SHG and/or two-photon-excited auto-fluorescence imaging. In stark contrast, we find that the composition of the living brain is very well suited for THG imaging, providing excellent structur- al contrast using only a single imaging modality, without the need for externally applied contrast agents. Results and Discussion Third-Harmonic Generation Microscopy. The principle of THG brain imaging is shown in Fig. 1A. Our setup consists of a 2PLSM microscope with a femtosecond optical parametric oscillator (OPO) as the light source (see Materials and Methods and Fig. S1). The OPO generates 200 fs pulses with a repetition frequency of 80 MHz, tunable between 1,050 and 1,500 nm. The maximum available output energy after the microscope objective is ∼200 mW. The laser wavelength needed for THG is longer than typically used in 2PLSM, as the produced THG signal will be at exactly one third of the excitation wavelength. For THG imaging, wavelengths in the range of 1,200–1,350 nm provide optimum contrast. While the use of shorter wavelength still provides significant contrast, the THG signal is then produced at UV wavelengths that are more readily absorbed by the tissue and less efficiently collected by the microscope optics. Wave- lengths above 1,350 nm suffer from excessive water absorption, which prevents deep-tissue imaging. An added advantage of using longer wavelengths is the increased depth penetration and reduced photodamage compared to the Ti:Sapphire wavelength range (20). The efficiency of THG depends mainly on the third-order susceptibility χ ð3Þ of the medium and the phase-matching condi- tions. The total generated THG intensity by a laser beam with intensity I ω and angular frequency ω in a medium is given by (14): I THG ¼ 3ω 2n ω c 2 χ ð3Þ I 3 ω Z z2 z1 e iΔkz ð1 þ 2iz∕bÞ 2 dz; [1] where n ω is the refractive index of the medium for the incident beam, c is the speed of light, Δk ¼ðn 3ω 3ω∕cÞ-3ðn ω ω∕cÞ is the phase mismatch, z is the position along the beam axis, z 1 and z 2 are the boundaries of the medium, and b is the confocal parameter of the focused laser beam. In a homogeneous medium with a positive phase mismatch Δk, the phase-matching integral in Eq. 1 goes to zero and no THG is produced, irrespective of the magnitude of I ω and χ ð3Þ . Note that practically all materials have a positive phase mis- match in the visible wavelength range. In contrast, partial phase Author contributions: S.W., A.N., H.D.M., and M.L.G. designed research; S.W., A.N., J.C.L., C.P.J.d.K., and G.T.S. performed research; S.W. analyzed data; and S.W., H.D.M., and M.L.G. wrote the paper. The authors declare no conflict of interest. *This Direct Submission article had a prearranged editor. 1 To whom correspondence should be addressed. E-mail: [email protected]. 2 H.D.M. and M.L.G. share senior authorship. This article contains supporting information online at www.pnas.org/lookup/suppl/ doi:10.1073/pnas.1018743108/-/DCSupplemental. 5970–5975 ∣ PNAS ∣ April 12, 2011 ∣ vol. 108 ∣ no. 15 www.pnas.org/cgi/doi/10.1073/pnas.1018743108 Downloaded by guest on June 23, 2020
Transcript of Label-free live brain imaging and targeted patching with ... · Label-free live brain imaging and...

Label-free live brain imaging and targeted patchingwith third-harmonic generation microscopyStefan Wittea,b,1, Adrian Negreana,b,c, Johannes C. Lodderb,c, Christiaan P. J. de Kockb,c, Guilherme Testa Silvab,c,Huibert D. Mansvelderb,c,2, and Marie Louise Groota,b,2
aBiophysics Group, Institute for Lasers, Life, and Biophotonics Amsterdam, VU University, De Boelelaan 1081, 1081 HV, Amsterdam, The Netherlands;cIntegrative Neurophysiology, Centre for Neurogenomics and Cognitive Research, VU University, De Boelelaan 1085, 1081 HV, Amsterdam, TheNetherlands; and bNeuroscience Campus Amsterdam, De Boelelaan 1085, 1081 HV, Amsterdam, The Netherlands
Edited* by Margaret M. Murnane, University of Colorado, Boulder, CO, and approved February 18, 2011 (received for review December 15, 2010)
The ability to visualize neurons inside living brain tissue is a funda-mental requirement in neuroscience and neurosurgery. Especiallythe development of a noninvasive probe of brain morphology withmicrometer-scale resolution is highly desirable, as it would providea noninvasive approach to optical biopsies in diagnostic medicine.Two-photon laser-scanning microscopy (2PLSM) is a powerful toolin this regard, and has become the standard for minimally invasivehigh-resolution imaging of living biological samples. However,while 2PLSM-based optical methods provide sufficient resolution,they have been hampered by the requirement for fluorescent dyesto provide image contrast. Here we demonstrate high-contrastimaging of live brain tissue at cellular resolution, without the needfor fluorescent probes, using optical third-harmonic generation(THG). We exploit the specific geometry and lipid content of braintissue at the cellular level to achieve partial phase matching ofTHG, providing an alternative contrast mechanism to fluorescence.We find that THG brain imaging allows rapid, noninvasive label-free imaging of neurons, white-matter structures, and blood ves-sels simultaneously. Furthermore, we exploit THG-based imagingto guide micropipettes towards designated neurons inside livetissue. This work is a major step towards label-free microscopiclive brain imaging, and opens up possibilities for the developmentof laser-guided microsurgery techniques in the living brain.
biomedical imaging ∣ biophotonics ∣ neuro-imaging ∣ nonlinear optics
High-resolution imaging is an essential technique in manyareas of science. In diagnostic medicine, the ability to per-
form a noninvasive optical biopsy (1, 2) of various types of tissuewith micrometer-scale resolution would provide a major stepforward. While two-photon laser-scanning microscopy (2PLSM)-based methods have revolutionized biological imaging (3, 4),they require fluorescent probes to provide image contrast. Suchprobes may interfere with cellular function and are usually notpractical for biomedical applications. Other nonlinear intera-ction mechanisms can provide intrinsic, label-free image contrastin nonlinear microscopy, such as second-harmonic generation(SHG) (5), third-harmonic generation (THG) (6–10), coherentanti-Stokes Raman scattering (11, 12), and stimulated Ramanscattering (13).
Here we show that specifically THG microscopy is a powerfuland versatile tool for label-free live brain imaging. THG is a wellknown nonlinear optical phenomenon (14), which has the inter-esting property that the phase-matching conditions required forefficient THG can be enhanced by the presence of discontinuitieswithin the focal volume of a laser beam. In imaging, THG micro-scopy has been shown to provide contrast in transparent samples(15), and its potential has been explored for dermatologicalstudies (16, 17), zebrafish embryogenesis (18), and zebrafishnervous system imaging (19). While these studies demonstratethe excellent possibilities of label-free microscopy, THG imagingprovided only partial information, and had to be augmented bySHG and/or two-photon-excited auto-fluorescence imaging. Instark contrast, we find that the composition of the living brain
is very well suited for THG imaging, providing excellent structur-al contrast using only a single imaging modality, without the needfor externally applied contrast agents.
Results and DiscussionThird-Harmonic Generation Microscopy.The principle of THG brainimaging is shown in Fig. 1A. Our setup consists of a 2PLSMmicroscope with a femtosecond optical parametric oscillator(OPO) as the light source (see Materials and Methods andFig. S1). The OPO generates 200 fs pulses with a repetitionfrequency of 80 MHz, tunable between 1,050 and 1,500 nm. Themaximum available output energy after the microscope objectiveis ∼200 mW. The laser wavelength needed for THG is longerthan typically used in 2PLSM, as the produced THG signal willbe at exactly one third of the excitation wavelength. For THGimaging, wavelengths in the range of 1,200–1,350 nm provideoptimum contrast. While the use of shorter wavelength stillprovides significant contrast, the THG signal is then producedat UV wavelengths that are more readily absorbed by the tissueand less efficiently collected by the microscope optics. Wave-lengths above 1,350 nm suffer from excessive water absorption,which prevents deep-tissue imaging. An added advantage ofusing longer wavelengths is the increased depth penetration andreduced photodamage compared to the Ti:Sapphire wavelengthrange (20).
The efficiency of THG depends mainly on the third-ordersusceptibility χð3Þ of the medium and the phase-matching condi-tions. The total generated THG intensity by a laser beam withintensity Iω and angular frequency ω in a medium is given by(14):
ITHG ¼�
3ω
2nωc
�2
χð3ÞI3ω
Zz2
z1
eiΔkz
ð1þ 2iz∕bÞ2 dz; [1]
where nω is the refractive index of the medium for the incidentbeam, c is the speed of light, Δk ¼ ðn3ω3ω∕cÞ-3ðnωω∕cÞ is thephase mismatch, z is the position along the beam axis, z1 andz2 are the boundaries of the medium, and b is the confocalparameter of the focused laser beam.
In a homogeneous medium with a positive phase mismatchΔk, the phase-matching integral in Eq. 1 goes to zero and noTHG is produced, irrespective of the magnitude of Iω andχð3Þ. Note that practically all materials have a positive phase mis-match in the visible wavelength range. In contrast, partial phase
Author contributions: S.W., A.N., H.D.M., and M.L.G. designed research; S.W., A.N., J.C.L.,C.P.J.d.K., and G.T.S. performed research; S.W. analyzed data; and S.W., H.D.M., andM.L.G. wrote the paper.
The authors declare no conflict of interest.
*This Direct Submission article had a prearranged editor.1To whom correspondence should be addressed. E-mail: [email protected]. and M.L.G. share senior authorship.
This article contains supporting information online at www.pnas.org/lookup/suppl/doi:10.1073/pnas.1018743108/-/DCSupplemental.
5970–5975 ∣ PNAS ∣ April 12, 2011 ∣ vol. 108 ∣ no. 15 www.pnas.org/cgi/doi/10.1073/pnas.1018743108
Dow
nloa
ded
by g
uest
on
June
23,
202
0

matching can be achieved by introducing a small inhomogeneityat the focus, resulting in a finite THG signal. Detailed calcula-tions show that the maximum value of the integral in Eq. 1 isreached when a structure is half the size of the focal volume (21).
THG Imaging of Live Brain Tissue. As a result of these underlyingphysical principles, the phase-matching conditions for THG aregoverned by the specific structure and composition of the mate-rial within the laser focus, and can be controlled through thefocusing parameters of the laser. Brain tissue consists for a largepart of axons and dendrites, with typical diameters in the range of0.3–2 μm (22, 23). These structures contain a high concentrationof lipids, which are known to have a high χð3Þ (9). By setting thefocal volume of the incident laser beam to several times the sizeof a typical dendrite, we create a geometry where the phase-matching conditions enable efficient THG (21) (Fig. 1B). In con-trast, neuronal cell bodies mostly contain organelles that aremuch smaller, mainly having structures at the 20–100 nm lengthscale. These smaller structures do not produce a significant THGsignal for our 3 μm focal length. As a result, THG is suppressedinside the neurons (Fig. 1C). By setting the focusing conditionsin this way we create a “shadow contrast” image, enabling high-resolution visualization of neurons inside live brain tissue in anoninvasive way, without the need for fluorescent dyes or geneticprobes. A typical THG image of neurons in the neocortex of a
mouse is displayed in Fig. 1D, showing this shadow contrast withclearly distinguishable cell bodies.
An initial study on THG signals from neuronal membranes wasreported by Yelin et al. (8), who used isolated cultured neuronson a coverslip. It should be stressed that due to the highly differ-ent geometrical phase-matching conditions in live bulk tissuecompared to isolated cells, the conditions for THG are verydifferent in the present case.
For THG imaging, we typically use several tens of mW closeto the sample surface, and increase the energy up to 200 mW athigher depths to compensate for intensity losses due to light scat-tering and focusing aberrations introduced by the tissue. Whilethese average laser powers may seem high compared to typicalvalues used in 2PLSM, the long wavelength and the absence ofresonant excitation ensure that tissue viability is maintained evenafter extensive imaging. As THG does not lead to photobleach-ing, phototoxicity is also minimized compared to fluorescenceexcitation. We have continuously recorded images at a fixedlocation for >30 minutes without significant changes in signalstrength or tissue morphology.
For a practical optical biopsy, backward (epi-)detection is afundamental requirement. Although THG is only produced inthe forward direction, at 400 nm the scattering length is severaltimes shorter than the absorption length. This tissue propertyensures that a significant fraction of the generated THG photonsis scattered back towards the sample surface (24), enabling effi-cient epidetection as depicted schematically in Fig. 1A.
To characterize the response of the tissue to light at a wave-length of 1,200 nm, we use a broadband emission filter (380–700 nm) to collect the fluorescence and harmonic signals overthis large bandwidth. A direct comparison between images takenwith this broadband filter and images recorded with a narrow-band filter at the THG wavelength shows that the epicollectedsignal is dominated by the THG signal, which comprises >85%of the detected photons. These observations confirm that mole-cular excitation and photobleaching do not influence THG imageformation in brain tissue.
To investigate the lipid origin of the χð3Þ, brain tissue wasstained with Nile Red, a hydrophobic fluorescent probe whichonly exhibits fluorescence in lipid environments (25). Comparingsimultaneously measured THG and 2PLSM fluorescence imagesshows excellent correlation outside the cell bodies (Fig. 2 Aand B). Inside the neurons, the lipid-rich endoplasmic reticulum(ER) is brightly stained by the Nile Red, while this structureremains much fainter in the THG images because the ER mostlycontains structures at the 20–100 nm scale, which do not providesignificant THG contrast. To exclude the possibility that the NileRed influences the THG signal in any way, we acquired THGimages before and after Nile Red staining and found them tobe identical. These observations confirm that a significant THGsignal is only obtained in the presence of both the high χð3Þ fromthe lipids and the structural phase matching from the brain tissuegeometry.
Label-Free Imaging of Various Brain Structures. The ability to imagetissue structure and organization is demonstrated in Fig. 2 C–F.A THG scan of the dentate gyrus brain region in an unstainedacute rat brain slice is shown in Fig. 2C. The sensitivity to lipidscan be exploited effectively in the visualization of white-matterstructures due to their lipid-rich myelin sheaths. Fig. 2D displaysa THG image of the white-matter structure Corpus Callosum in amouse brain slice, clearly showing axon bundles. The 3D-imagingcapability is demonstrated in Movie S1, showing a 3D-projectionof a volume scan through the Corpus Callosum. In comparison toother white-matter imaging techniques (13, 26, 27), THG imaginghas the significant advantage of imaging gray matter structuressimultaneously, using only a single laser beam and detector,and at near-real-time speed. Fig. 2E shows a THG image of the
Fig. 1. Label-free live brain imaging using third-harmonic generation micro-scopy. (A) Schematic of THG microscopy on brain tissue in an epidetectiongeometry. Inset: Principle of THG. Note that no optical excitation of the med-ium takes place. (B) Focused laser beam at a dendrite. By setting the laserfocal volume several times larger than the dendrite diameter, partial phasematching is achieved, and a significant THG signal is produced. (C) Focusedlaser beam in the cell body. Due to the poor structural phase-matchingconditions, no THG is produced. (D) THG microscopy image of living neuronsin mouse brain tissue. The somata appear as dark shadows.
Witte et al. PNAS ∣ April 12, 2011 ∣ vol. 108 ∣ no. 15 ∣ 5971
BIOPH
YSICSAND
COMPU
TATIONALBIOLO
GY
APP
LIED
PHYS
ICAL
SCIENCE
S
Dow
nloa
ded
by g
uest
on
June
23,
202
0

striatum in a mouse brain slice, where both neurons and axonbundles are clearly resolved. Note that the axon bundles runperpendicular to the image plane, so that a cross-section of thebundles is seen. The axon bundles can be visualized more clearlyby performing a depth scan at this location, of which a 3D-projection is shown in Movie S2.
Simultaneous SHG imaging can be performed by adding asecond photomultiplier. Due to the absence of collagen in brainextracellular matrix and its amorphous structure, phase matchingof SHG in gray matter structures is not feasible (Fig. S2, SI Text).Nevertheless, SHG imaging can be used to visualize axon bun-dles, because uniform polarity microtubule arrays inside axonsprovide the required phase-matching conditions for SHG (26).
In addition to neuronal imaging, THG microscopy enablesimaging of vasculature (28) simultaneously without externalcontrast agents (Fig. 2F, Fig. S3). The hemoglobin in red bloodcells is known to be a major source of THG signal when using1,200–1,300 nm excitation light (15), through near-resonantexcitation of the Soret band of the heme cofactor, which has a
high nonlinear excitation cross-section due to its porphyrinstructure (29).
Combined THG and Fluorescence Imaging. Further information onthe structures that are observed with THG imaging is obtainedby using specific fluorescent markers for identification (30), asillustrated in Fig. 3. Details about the imaging procedures arelisted in the Materials and Methods section. We employ the dyeSulforhodamine-101 (SR-101) to label astrocytes (31) in an acuteslice of mouse prefrontal cortex. Incidentally, two-photon excita-tion of SR-101 at 1,200 nm is very efficient, allowing simultaneousacquisition of THG and SR-101 fluorescence images. TypicalTHG and 2PLSM images are shown in Fig. 3 A and B, respec-tively, while the overlay is displayed in Fig. 3C. This data providesevidence that astrocyte cell bodies are slightly visible in theTHG images, albeit at significantly lower contrast due to theirsmaller size.
Genetic fluorescent markers such as Green FluorescentProtein (GFP) are useful in identifying specific neuronal celltypes. As an example, we have performed imaging experimentson transgenic mouse brain expressing GFP in somatostatin-positive interneurons (32). Combined THG imaging and GFP-2PLSM provides information on the distribution of these specific
Fig. 2. THGmicroscopy image of living brain tissue. (A) THG image of mouseneocortex. (B) 2-photon fluorescence from Nile Red-stained lipid structuresat the same location as A. (C) THG image of rat dentate gyrus (horizontalsection). (D) THG image of mouse Corpus Callosum, axon fiber bundlesare clearly resolved. A 3D-projection of this structure is shown in Movie S1.(E) THG image of striatum in a mouse brain (coronal section). Both white-matter fibers and neurons are clearly visible. The bright grainy structuresare axon bundles that run perpendicular to the image plane. A 3D-projectionat this location is shown inMovie S2. (F) THG image of blood vessels in the toplayer of the cerebral cortex of a live, anesthetized mouse (average intensityprojection of a 50 μm z-stack).
Fig. 3. Combined THG and 2PLSM imaging. (A) THG image of mouse pre-frontal cortex. (B) 2PLSM image of astrocytes labeled with SR-101. (C) Overlayof A and B, providing information on the distribution of astrocytes within theneuronal network. (D) THG image of mouse prefrontal cortex. (E) 2-photonfluorescence image of GFP-labeled somatostatin-positive neurons. (F) Imageoverlay of D and E, showing the distribution of somatostatin-positive cells inthe structure of the PFC.
5972 ∣ www.pnas.org/cgi/doi/10.1073/pnas.1018743108 Witte et al.
Dow
nloa
ded
by g
uest
on
June
23,
202
0
interneurons in e.g., the neocortex and hippocampus. SeparateTHG and GFP recordings in the prefrontal cortex are shown inFig. 3 D and E, respectively. The overlay in Fig. 3F then clearlyidentifies the specific interneurons within the larger networkof cells.
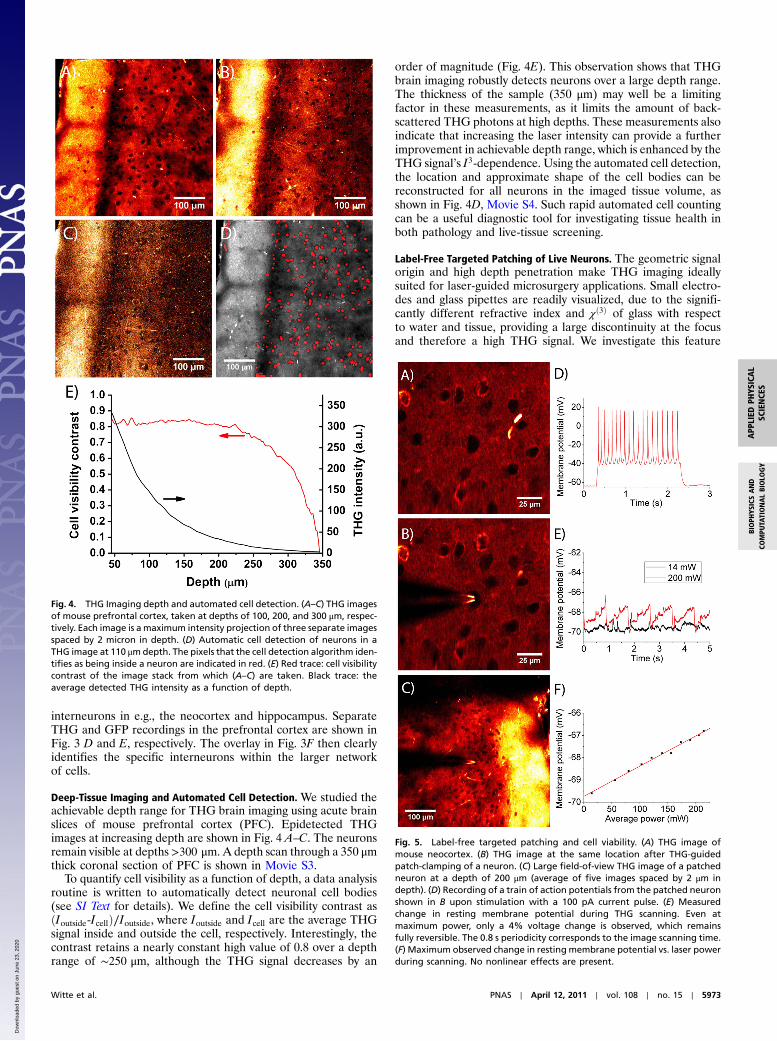
Deep-Tissue Imaging and Automated Cell Detection. We studied theachievable depth range for THG brain imaging using acute brainslices of mouse prefrontal cortex (PFC). Epidetected THGimages at increasing depth are shown in Fig. 4 A–C. The neuronsremain visible at depths >300 μm. A depth scan through a 350 μmthick coronal section of PFC is shown in Movie S3.
To quantify cell visibility as a function of depth, a data analysisroutine is written to automatically detect neuronal cell bodies(see SI Text for details). We define the cell visibility contrast asðIoutside-IcellÞ∕Ioutside, where Ioutside and Icell are the average THGsignal inside and outside the cell, respectively. Interestingly, thecontrast retains a nearly constant high value of 0.8 over a depthrange of ∼250 μm, although the THG signal decreases by an
order of magnitude (Fig. 4E). This observation shows that THGbrain imaging robustly detects neurons over a large depth range.The thickness of the sample (350 μm) may well be a limitingfactor in these measurements, as it limits the amount of back-scattered THG photons at high depths. These measurements alsoindicate that increasing the laser intensity can provide a furtherimprovement in achievable depth range, which is enhanced by theTHG signal’s I3-dependence. Using the automated cell detection,the location and approximate shape of the cell bodies can bereconstructed for all neurons in the imaged tissue volume, asshown in Fig. 4D, Movie S4. Such rapid automated cell countingcan be a useful diagnostic tool for investigating tissue health inboth pathology and live-tissue screening.
Label-Free Targeted Patching of Live Neurons. The geometric signalorigin and high depth penetration make THG imaging ideallysuited for laser-guided microsurgery applications. Small electro-des and glass pipettes are readily visualized, due to the signifi-cantly different refractive index and χð3Þ of glass with respectto water and tissue, providing a large discontinuity at the focusand therefore a high THG signal. We investigate this feature
Fig. 4. THG Imaging depth and automated cell detection. (A–C) THG imagesof mouse prefrontal cortex, taken at depths of 100, 200, and 300 μm, respec-tively. Each image is amaximum intensity projection of three separate imagesspaced by 2 micron in depth. (D) Automatic cell detection of neurons in aTHG image at 110 μmdepth. The pixels that the cell detection algorithm iden-tifies as being inside a neuron are indicated in red. (E) Red trace: cell visibilitycontrast of the image stack from which (A–C) are taken. Black trace: theaverage detected THG intensity as a function of depth.
Fig. 5. Label-free targeted patching and cell viability. (A) THG image ofmouse neocortex. (B) THG image at the same location after THG-guidedpatch-clamping of a neuron. (C) Large field-of-view THG image of a patchedneuron at a depth of 200 μm (average of five images spaced by 2 μm indepth). (D) Recording of a train of action potentials from the patched neuronshown in B upon stimulation with a 100 pA current pulse. (E) Measuredchange in resting membrane potential during THG scanning. Even atmaximum power, only a 4% voltage change is observed, which remainsfully reversible. The 0.8 s periodicity corresponds to the image scanning time.(F) Maximum observed change in resting membrane potential vs. laser powerduring scanning. No nonlinear effects are present.
Witte et al. PNAS ∣ April 12, 2011 ∣ vol. 108 ∣ no. 15 ∣ 5973
BIOPH
YSICSAND
COMPU
TATIONALBIOLO
GY
APP
LIED
PHYS
ICAL
SCIENCE
S
Dow
nloa
ded
by g
uest
on
June
23,
202
0

by performing label-free targeted patch-clamp recording, guidedby THG microscopy. This experiment demonstrates the capabil-ity to perform targeted patching in an epidetection geometrywithout the use of fluorescent dyes. With this approach, we havesuccessfully performed targeted patching at >200 micrometerdepths in unstained brain slices, using only epidetection. Signifi-cant advantages of our THG-guided patching technique overtwo-photon targeted patching (33, 34) using dye-filled pipettesare the ability to choose the target neuron before entering thetissue, the larger field-of-view, and the fact that potentially harm-ful dyes are not required. The main advantage, however, is thefact that THG-guiding is not limited to patch pipettes, but canbe extended to electrodes or even small surgical tools, whichopens up significant possibilities for laser-guided microsurgeryapplications.
The achieved imaging speed is sufficient for live-cell patching.Movie S5 displays a typical patching experiment at real-timespeed. Fig. 5A shows a cortical neuron before patching, whileFig. 5B shows the same neuron after successful patch-clamping.A large field-of-view image of a patched cell at a depth of 200 μmis presented in Fig. 5C. Fig. 5D displays an action potential re-cording from the patched neuron shown in Fig. 5B in responseto an injected current pulse.
A crucial issue for many applications is whether the high laserintensity influences the neurons in any way. The targeted patch-ing discussed above enables us to directly address this issue, as itallows real-time monitoring of the neuronal resting membranepotential during THG image acquisition. By monitoring the rest-ing potential, any effect of the light on the cell would be observedas a deviation from the equilibrium value. Any laser-induceddamage to the cell would directly show up as an irreversiblechange in membrane potential. We perform this experiment byrepeatedly recording THG images of a patched cell while mon-itoring its membrane potential through the patch pipette. Thisexperiment has been repeated at increasing laser intensities, withtypical results as shown in Fig. 5E. During scanning, only a smallincrease in membrane potential is observed, which remains fullyreversible even at high laser intensity. The fact that the observedmembrane potential changes are both reversible and reproduci-ble demonstrates that, while the THG beam does influence thecell slightly, it does not introduce photodamage. It should bestressed here that only part of the 200 mW laser power actuallyreaches the focus due to scattering by the tissue. Furthermore,a high-contrast image of the cell could already be obtained atsignificantly lower power in this case (∼50 μm depth), so that thechange in membrane potential remains at or below the 1%-levelfor typical imaging conditions.
Fig. 5F shows the maximum observed change in resting mem-brane potential as a function of incident laser power. The obser-vation that the resting membrane potential changes slightly uponillumination indicates that the permeability of the membrane ismodified by the light. This effect could have several explanations,which include thermal gradients across the cell or possible (non-linear) excitation of membrane proteins. It is difficult to conclu-sively identify the cause of this signal, because the influence ofpossible molecular excitation on the neuronal membrane poten-tial is unknown. However, the linear dependence on laser inten-sity seems to indicate that nonlinear effects such as two-photonexcitation of endogenous molecules are a less likely cause. It isworth noting that this measurement may well overestimate theinfluence of the laser light, because also the patch pipette mayheat up, causing additional stress on the seal between pipetteand cell membrane. A degradation of this seal could easily leadto an increased leak current, which would mimic a change inmembrane potential.
Furthermore, we have patched neurons after continuousTHG imaging for >5 minutes, and typically observed normal cellbehavior and resting membrane potentials, indicating that the
cells have not been adversely affected by the incident light. Theseresults clearly show that THG microscopy preserves cell viabilityeven after extended imaging.
In Vivo THG Imaging. To investigate the feasibility of in vivo THGbrain imaging, we performed experiments on living, anesthetizedmice. A craniotomy provided access to the brain. High-contrastimages were obtained, as shown in Fig. S4A. The achieved depthrange was ∼200 micrometers, limited by the laser power and thepresence of extended vasculature above the imaging location. Anin vivo THG image of blood vessels is shown in Fig. 2F. Althoughthe current setup limits the imaging range to layer 2∕3 neurons,our in vitro experiments discussed above (see Fig. 4) indicate thata higher pulse intensity could enable a significant improvementin the achievable depth range.
To obtain more information about the origin of the THG sig-nal, transgenic mice expressing GFP in neuronal membraneswere used. A high degree of correlation is found between theTHG and the GFP images (displayed in Fig. S4 A and B, respec-tively). While these experiments do not prove beyond doubtthat the observed shadow features are in fact neurons, their shapeand size, as well as the THG-GFP correlation provide significantevidence to this end. More importantly, these measurementsdemonstrate our ability to achieve good contrast and resolutionin the brain of a living animal, paving the way for more extensivein vivo studies, as well as various biomedical applications.
Conclusions and Outlook. In conclusion, we demonstrate thatoptical phase-matching-based contrast mechanisms provide apowerful alternative to fluorescence-based techniques, especiallyin biomedical applications where the use of dyes may be proble-matic. By controlling the laser beam parameters, the structure ofbrain tissue can be used effectively for the generation of intrinsicoptical nonlinear contrast, through partial phase matching ofTHG. THG imaging thus provides a powerful tool for noninva-sive optical biopsies of unstained live brain tissue. We anticipatevarious biomedical applications, such as the use of THG imagingfor real-time diagnostic tissue screening during brain surgery,and possibly even for guiding microscopic surgical tools with sub-cellular precision.
The sensitivity of THG imaging to lipid structures is intriguing,as various diseases in the human brain are accompanied orcaused by alterations in lipid metabolism. Abnormal concentra-tions of lipid droplets have been observed in human brain tu-mours of various grades (35). Accumulations of cholesterol arefound in senile plaques that characterize Alzheimer’s disease(36), while various other neurodegenerative disorders are asso-ciated with abnormal lipid metabolism (37). The ability to imagelipids with intrinsic contrast at cellular resolution may thereforebe promising to visualize and study such disorders.
Materials and MethodsTHG Imaging. For the THG imaging experiments, we use a commercialtwo-photon laser-scanning microscope (TrimScope, Lavision BioTec GmbH).The light source is an optical parametric oscillator (Mira-OPO, APE), pumpedat 810 nm by a modelocked Ti:Sapphire laser (Coherent Chameleon Ultra II).The light is focused onto the sample using a 20×, 0.95 N.A. water-dippingobjective (Olympus XLUMPFL-IR).
The THG experiments described in this paper are performed using anepidetection geometry. The back-scattered THG photons are separated fromthe incoming laser beam using a dichroic mirror (Chroma T800lpxrxt), andfiltered by a band-pass filter at the THG wavelength (Chroma HQ390-70X).
The detector is a GaAsP high-sensitivity photomultiplier tube (HamamatsuH7422-40), with a quantum efficiency of 25% at 400 nm. Typical imageacquisition times are 1.6 s for the highest resolution images (1;024×1;024 pixels), and 0.6 s for 512 × 512 pixel images, which we used for thetargeted patching experiments.
For a comparison with forward-detection, a custom transmission portis used. This port employs a 1.4 N.A. oil immersion condenser, a long-pass
5974 ∣ www.pnas.org/cgi/doi/10.1073/pnas.1018743108 Witte et al.
Dow
nloa
ded
by g
uest
on
June
23,
202
0

dichroic mirror (UQG optics), and a narrow-band interference filter at400 nm (Optosigma).
For the combined THG and SR-101 experiments, we use the OPO at1,200 nm to produce both signals simultaneously. The SR-101 fluorescenceis separated from the THG signal using a dichroic mirror with a cutoff at561 nm and a band-pass filter at 594 nm. The SR-101 signal is detected witha PMT (Hamamatsu H6780-20). Combined Nile Red and THG imaging is alsoperformed by simultaneous excitation using the OPO at 1,200 nm. In thisparticular case, the THG is measured with the transmission port, while theNile Red fluorescence is epidetected through a 593∕40 nm band-pass filter.
For combined THG and GFP imaging, the Ti:Sapphire laser used to pumpthe OPO is tuned to 970 nm and coupled into the microscope. The GFP fluor-escence and THG signal of a tissue volume are then measured consecutively,using the same detector, but with a different band-pass filter (561∕40 nm) forthe GFP.
Data acquisition is done with the microscope software (Imspector Pro),and images are stored in 16-bit tiff-format. Images are analyzed using ImageJ(MacBioPhotonics).
Electrophysiology. Whole-cell patch-clamp recordings are taken using anEPC-8 amplifier (HEKA), and digitized with an ITC-8 data acquisition unit.Patch pipettes (3–6 MΩ tip resistance) are drawn from borosilicate glass,fire-polished, and filled with an intracellular solution containing: 120 mMK-gluconate, 10 mM KCl, 10 mM Hepes, 10 mM K-phosphocreatine, 4 mMATP-Mg, 0.4 mM GTP, and pH adjusted to 7.3 with KOH, final osmolarity270–285 mOsm. All experiments are performed at room temperature.
All THG-guided label-free targeted patching experiments are performedusing an epidetection geometry. We successfully patched >30 cells usingthis technique, of which seven at a depth >200 μm.
Animal Handling. Brains of C57/BL6 wild-types or Somatostatin-eGFPconjugated GFP-expressing inhibitory neuron line (32) were rapidly removedand dissected in ice-cold artificial cerebrospinal fluid (aCSF) containing thefollowing: 110 mM choline chloride; 11.6 mM sodium ascorbate; 7 mMMgCl2; 3.1 mM Na-pyruvate; 2.5 mM KCl; 1.25 mM NaH2PO4; 0.5 mM CaCl2;26 mM NaHCO3; and 10 mM glucose (∼300 mOsm).
Coronal slices of various parts of the brain were cut on a vibrating micro-tome at 300–350 μm thickness and then placed in a submerged-style holdingchamber in aCSF, bubbled with carbogen (95% O2, 5% CO2) containing thefollowing: 126 mM NaCl; 3 mM KCl; 1 mM NaH2PO4; 1 mM MgSO4; 2 mMCaCl2; 26 mM NaHCO3; and 10 mM glucose. Slices were allowed to recoverfor 20 min at 33 °C followed by 40 min at room temperature.
For the in vivo experiments, adult EGFP-tKras mice (38) (>5 months old,30–35 g) are anesthetized using urethane (1.6 g∕kg) in 0.9% NaCl. Depthof anaesthesia is checked by both foot and eyelid reflex and vibrissaemovements. The animal’s temperature is monitored with a rectal probe andmaintained at 37 °C by a thermostatically controlled heating pad. Imagingexperiments are performed on neocortex relatively free of blood vesselsto facilitate THG imaging (usually 10 mm posterior and 1 mm lateral frombregma). A craniotomy of 0.5 by 0.5 mm is made covering the area of interestwith the dura removed.
All experimental procedures were carried out according to the animalwelfare guidelines of the VU University Amsterdam, the Netherlands.
ACKNOWLEDGMENTS. We acknowledge Dr. R.M. Meredith for experimentalassistance, and R. Poorthuis, M. Groen, T. Cijsouw, and Dr. R.F.G. Toonenfor providing samples. This work was supported by grants from theNetherlands Organization for Scientific Research (NWO) (917.76.360),Neuroscience Campus Amsterdam, VU University Board (Stg. VU-ERC), andNeurobsik to H.D.M.
1. Tearney GJ, et al. (1997) In vivo endoscopic optical biopsy with optical coherencetomography. Science 276:2037–2039.
2. Tsai PS, et al. (2003) All-optical histology using ultrashort laser pulses. Neuron39:27–41.
3. Denk W, Strickler JH, Webb WW (1990) 2-photon laser scanning fluorescence micro-scopy. Science 248:73–76.
4. Helmchen F, Denk W (2005) Deep tissue two-photon microscopy. Nat Methods2:932–940.
5. Dombeck DA, Sacconi L, Blanchard-Desce M, Webb WW (2005) Optical recordingof fast neuronal membrane potential transients in acute mammalian brain slices bysecond-harmonic generation microscopy. J Neurophysiol 94:3628–3636.
6. Barad Y, Eisenberg H, Horowitz M, Silberberg Y (1997) Nonlinear scanning lasermicroscopy by third harmonic generation. Appl Phys Lett 70:922–924.
7. Squier JA, Muller M, Brakenhoff GJ, Wilson KR (1998) Third harmonic generationmicroscopy. Opt Express 3:315–324.
8. Yelin D, Silberberg Y (1999) Laser scanning third-harmonic-generation microscopy inbiology. Opt Express 5:169–175.
9. Debarre D, et al. (2006) Imaging lipid bodies in cells and tissues using third-harmonicgeneration microscopy. Nat Methods 3:47–53.
10. Hsieh CS, et al. (2008) Higher harmonic generation microscopy of in vitro culturedmammal oocytes and embryos. Opt Express 16:11574–11588.
11. Evans CL, et al. (2005) Chemical imaging of tissue in vivo with video-rate coherentanti-Stokes Raman scattering microscopy. Proc Natl Acad Sci USA 102:16807–16812.
12. Jurna M, et al. (2009) Vibrational phase contrast microscopy by use of coherentanti-Stokes Raman scattering. Phys Rev Lett 103:043905.
13. Freudiger CW, et al. (2008) Label-free biomedical imaging with high sensitivity bystimulated Raman scattering microscopy. Science 322:1857–1861.
14. Ward JF, New GHC (1969) Optical third harmonic generation in gases by a focusedlaser beam. Phys Rev 185:57–72.
15. Muller M, Squier J, Wilson KR, Brakenhoff GJ (1998) 3D microscopy of transparentobjects using third-harmonic generation. J Microsc 191:266–274.
16. Lee JH, et al. (2009) Noninvasive in vitro and in vivo assessment of epidermalhyperkeratosis and dermal fibrosis in atopic dermatitis. J Biomed Opt 14:014008.
17. Tai SP, et al. (2006) In vivo optical biopsy of hamster oral cavity with epi-third-harmo-nic-generation microscopy. Opt Express 14:6178–6187.
18. Olivier N, et al. (2010) Cell lineage reconstruction of early Zebrafish embryos usinglabel-free nonlinear microscopy. Science 329:967–971.
19. Chen SY, et al. (2006) Noninvasive harmonics optical microscopy for long-term obser-vation of embryonic nervous system development in vivo. J Biomed Opt 11:054022.
20. Andresen V, et al. (2009) Infrared multiphoton microscopy: subcellular-resolved deeptissue imaging. Curr Opin Biotechnol 20:54–62.
21. Debarre D, Supatto W, Beaurepaire E (2005) Structure sensitivity in third-harmonicgeneration microscopy. Opt Lett 30:2134–2136.
22. Barazany D, Basser PJ, Assaf Y (2009) In vivo measurement of axon diameter distribu-tion in the Corpus Callosum of rat brain. Brain 132:1210–1220.
23. Cornelisse LN, et al. (2007) High speed two-photon imaging of calcium dynamics indendritic spines: consequences for spine calcium kinetics and buffer capacity. PLoSONE 2:e1073.
24. Debarre D, Olivier N, Beaurepaire E (2007) Signal epidetection in third-harmonicgeneration microscopy of turbid media. Opt Express 15:8913–8924.
25. Greenspan P, Mayer EP, Fowler SD (1985) Nile Red—a selective fluorescent stain forintracellular lipid droplets. J Cell Biol 100:965–973.
26. Dombeck DA, et al. (2003) Uniform polarity microtubule assemblies imaged in nativebrain tissue by second-harmonic generation microscopy. Proc Natl Acad Sci USA100:7081–7086.
27. Evans CL, et al. (2007) Chemically-selective imaging of brain structures with CARSmicroscopy. Opt Express 15:12076–12087.
28. Kleinfeld D, Mitra PP, Helmchen F, Denk W (1998) Fluctuations and stimulus-inducedchanges in blood flow observed in individual capillaries in layers 2 through 4 of ratneocortex. Proc Natl Acad Sci USA 95:15741–15746.
29. Clay GO, Schaffer CB, Kleinfeld D (2007) Large two-photon absorptivity of hemoglobinin the infrared range of 780–880 nm. J Chem Phys 126:025102.
30. Chu SW, et al. (2005) High-resolution simultaneous three-photon fluorescence andthird-Harmonic-generation microscopy. Microsc Res Tech 66:193–197.
31. Nimmerjahn A, Kirchhoff F, Kerr JND, Helmchen F (2004) Sulforhodamine 101 as aspecific marker of astroglia in the neocortex in vivo. Nat Methods 1:31–37.
32. Ma YY, et al. (2006) Distinct subtypes of somatostatin-containing neocorticalinterneurons revealed in transgenic mice. J Neurosci 26:5069–5082.
33. Kitamura K, et al. (2008) Targeted patch-clamp recordings and single-cell electropora-tion of unlabeled neurons in vivo. Nat Methods 5:61–67.
34. Komai S, et al. (2006) Two-photon targeted patching (TPTP) in vivo. Nat Protoc1:647–652.
35. Opstad KS, Bel BA, Griffiths JR, Howe FA (2008) An investigation of human brain tumorlipids by high-resolution magic angle spinning H-1 MRS and histological analysis. NMRBiomed 21:677–685.
36. Mori T, et al. (2001) Cholesterol accumulates in senile plaques of Alzheimer diseasepatients and in transgenic APP(sw) mice. J Neuropathol Exp Neurol 60:778–785.
37. Liu JP, et al. (2010) Cholesterol involvement in the pathogenesis of neurodegenerativediseases. Mol Cell Neurosci 43:33–42.
38. Roelandse M, et al. (2003) Focal motility determines the geometry of dendritic spines.Neuroscience 121:39–49.
Witte et al. PNAS ∣ April 12, 2011 ∣ vol. 108 ∣ no. 15 ∣ 5975
BIOPH
YSICSAND
COMPU
TATIONALBIOLO
GY
APP
LIED
PHYS
ICAL
SCIENCE
S
Dow
nloa
ded
by g
uest
on
June
23,
202
0