Lab42 - A Closer Look at Healthcare Q1 2014
15
A CLOSER LOOK AT: HEALTHCARE and THE AFFORDABLE CARE ACT
-
Upload
robert-maihofer -
Category
Documents
-
view
18 -
download
0
Transcript of Lab42 - A Closer Look at Healthcare Q1 2014
A CLOSER LOOK AT:
HEALTHCAREand
THE AFFORDABLECARE ACT
A CLOSER LOOK AT:HEALTHCARE AND THE AFFORDABLE CARE ACT 2014
1lab42.com | [email protected]
TABLE OF CONTENTS02
03
04
05
07
09
10
11
12
13
14
Introduction
Respondent Segmentation
Finding - Plan Package Type
Finding - Behavioral Potential
FInding - Brand Name
Finding - Pre-existing Conditions
Finding - Debt
Finding - Value
Finding - Confusion
Other Key Findings
Sources, Methodology, About Lab42
A CLOSER LOOK AT:HEALTHCARE AND THE AFFORDABLE CARE ACT 2014
2lab42.com | [email protected]
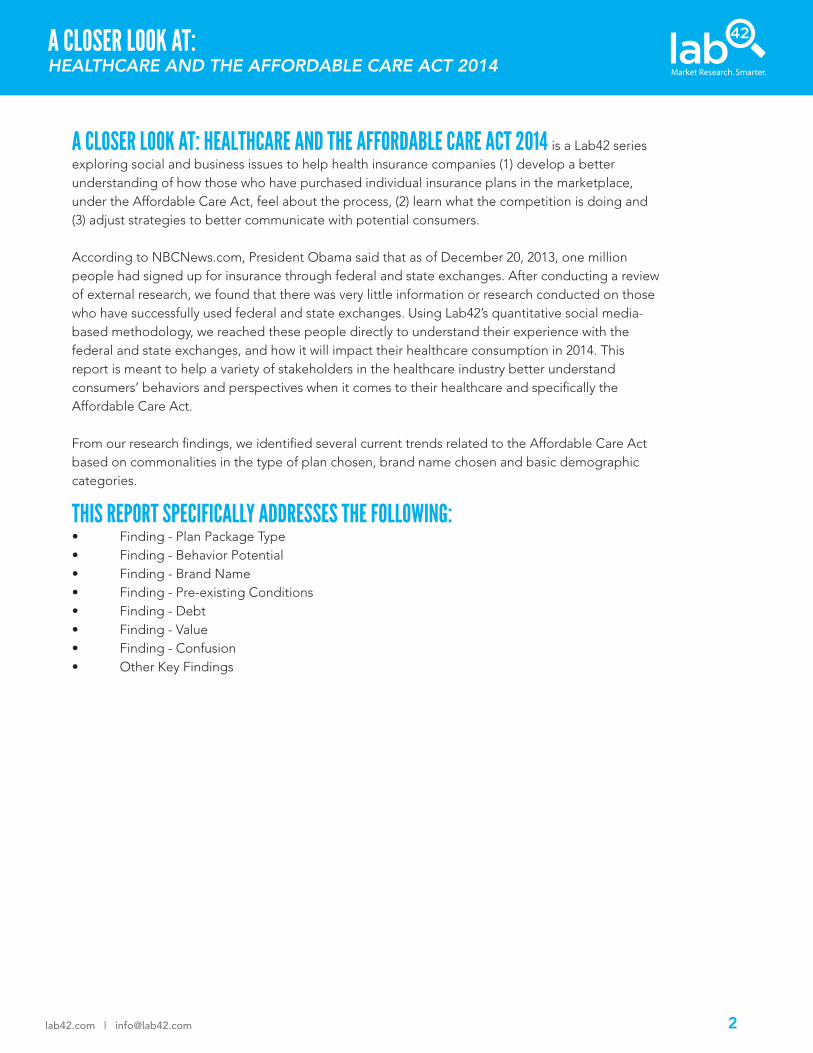
A CLOSER LOOK AT: HEALTHCARE AND THE AFFORDABLE CARE ACT 2014 is a Lab42 series exploring social and business issues to help health insurance companies (1) develop a better understanding of how those who have purchased individual insurance plans in the marketplace, under the Affordable Care Act, feel about the process, (2) learn what the competition is doing and (3) adjust strategies to better communicate with potential consumers.
According to NBCNews.com, President Obama said that as of December 20, 2013, one million people had signed up for insurance through federal and state exchanges. After conducting a review of external research, we found that there was very little information or research conducted on those who have successfully used federal and state exchanges. Using Lab42’s quantitative social media-based methodology, we reached these people directly to understand their experience with the federal and state exchanges, and how it will impact their healthcare consumption in 2014. This report is meant to help a variety of stakeholders in the healthcare industry better understand consumers’ behaviors and perspectives when it comes to their healthcare and specifically the Affordable Care Act.
From our research findings, we identified several current trends related to the Affordable Care Act based on commonalities in the type of plan chosen, brand name chosen and basic demographic categories.
THIS REPORT SPECIFICALLY ADDRESSES THE FOLLOWING:• Finding - Plan Package Type• Finding - Behavior Potential• Finding - Brand Name• Finding - Pre-existing Conditions• Finding - Debt• Finding - Value• Finding - Confusion• Other Key Findings
A CLOSER LOOK AT:HEALTHCARE AND THE AFFORDABLE CARE ACT 2014
3lab42.com | [email protected]
RESPONDENT SEGMENTATIONMuch of the current, publicly available literature on the healthcare industry and Affordable Care Act cover these topics broadly as a whole without probing those who are using the exchanges. While it is essential to understand the background of the Affordable Care Act, Lab42 believes understanding how people specifically interact with the exchanges is important for the healthcare industry in order to improve its product offerings and consumer experience. Lab42 used a direct approach in identifying 500 respondents who have successfully used an exchange to sign up for the Affordable Care Act, allowing participants to self-classify themselves. This sample, due to the methodology, may under represent those with limited internet access or those who are unable to read American English. In order to reach these 500 respondents, 11,886 people were screened. There is a fairly even split between gender: 45% males and 55% females.
MAJOR FINDINGSWhile it may take years, or even decades, to assess the full impact of the Affordable Care Act, below are some initial findings that offer a glimpse into how consumers are responding to the healthcare exchanges and how they are making decisions regarding level of coverage, insurance carrier, and more.
For this inaugural 2013-2014 open enrollment period, Lab42 uncovered:• A strong plurality, 40%, selected a Silver-level program. The least expensive offered option, the restricted Catastrophic-level program (open to a very limited group) garnered a small 2.8% market share. The second least expensive and more widely available Bronze- level still only accounted for 23% of the total initial sign-ups.• For sign-ups, Blue Cross Blue Shield, with its nearly universal market presence, dominated other major competitors with a 52% market share. On a state-by-state level, though, some competitors garnered a larger market share. • Since the ACA’s marketplace launch, news media from across the political spectrum have reported potentially serious issues with the online sign-up process. Yet, 72% of these successful exchange users were satisfied with their experience, compared to 16% who were dissatisfied with their experience.
A CLOSER LOOK AT:HEALTHCARE AND THE AFFORDABLE CARE ACT 2014
4lab42.com | [email protected]
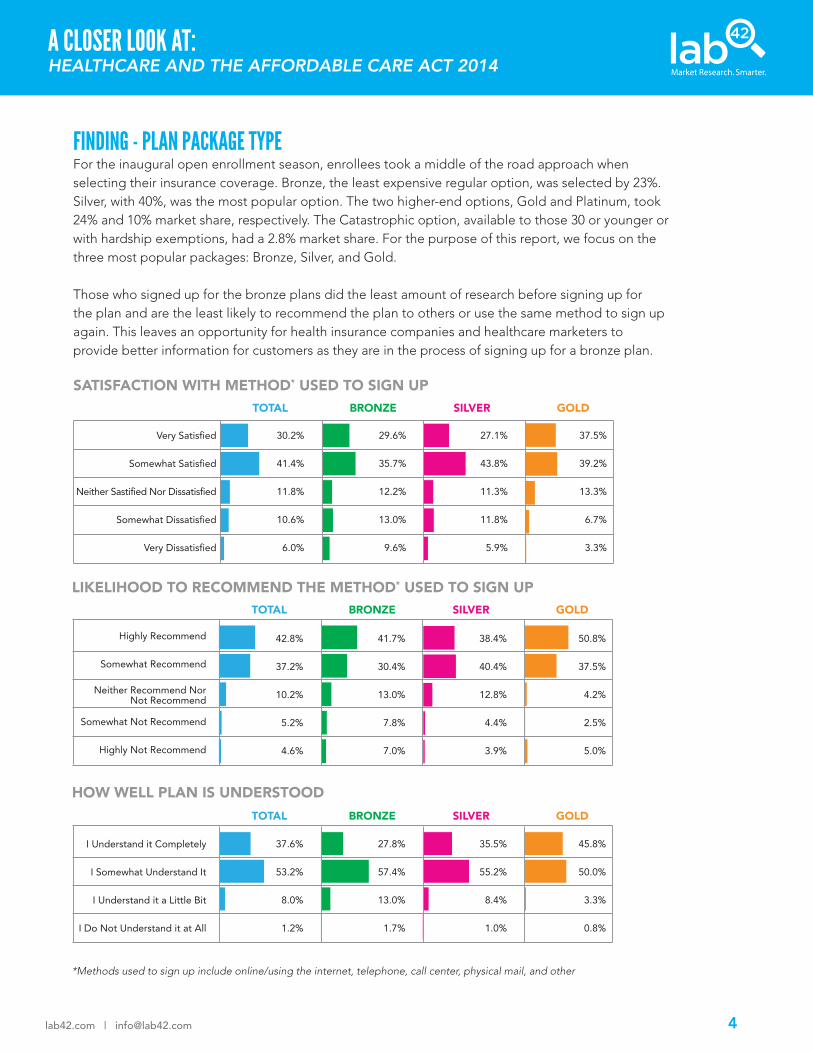
FINDING - PLAN PACKAGE TYPEFor the inaugural open enrollment season, enrollees took a middle of the road approach when selecting their insurance coverage. Bronze, the least expensive regular option, was selected by 23%. Silver, with 40%, was the most popular option. The two higher-end options, Gold and Platinum, took 24% and 10% market share, respectively. The Catastrophic option, available to those 30 or younger or with hardship exemptions, had a 2.8% market share. For the purpose of this report, we focus on the three most popular packages: Bronze, Silver, and Gold.
Those who signed up for the bronze plans did the least amount of research before signing up for the plan and are the least likely to recommend the plan to others or use the same method to sign up again. This leaves an opportunity for health insurance companies and healthcare marketers to provide better information for customers as they are in the process of signing up for a bronze plan.
Satisfaction With Method They Used to Sign Up
Very Satisfied
Somewhat Satisfied
Neither Sastified Nor Dissatisfied
Somewhat Dissatisfied
Very Dissatisfied
30.2%
41.4%
11.8%
10.6%
6.0%
29.6%
35.7%
12.2%
13.0%
9.6%
27.1%
43.8%
11.3%
11.8%
5.9%
37.5%
39.2%
13.3%
6.7%
3.3%
TOTAL BRONZE SILVER GOLD
SATISFACTION WITH METHOD* USED TO SIGN UP
TOTAL BRONZE SILVER GOLD
Highly Recommend
Somewhat Recommend
Neither Recommend NorNot Recommend
Somewhat Not Recommend
Highly Not Recommend
42.8%
37.2%
10.2%
5.2%
4.6%
41.7%
30.4%
13.0%
7.8%
7.0%
38.4%
40.4%
12.8%
4.4%
3.9%
50.8%
37.5%
4.2%
2.5%
5.0%
TOTAL BRONZE SILVER GOLD
How Well They Know Their Plan
I Understand it Completely
I Somewhat Understand It
I Understand it a Little Bit
I Do Not Understand it at All
37.6%
53.2%
8.0%
1.2%
27.8%
57.4%
13.0%
1.7%
35.5%
55.2%
8.4%
1.0%
45.8%
50.0%
3.3%
0.8%
LIKELIHOOD TO RECOMMEND THE METHOD* USED TO SIGN UP
HOW WELL PLAN IS UNDERSTOOD
*Methods used to sign up include online/using the internet, telephone, call center, physical mail, and other
A CLOSER LOOK AT:HEALTHCARE AND THE AFFORDABLE CARE ACT 2014
5lab42.com | [email protected]
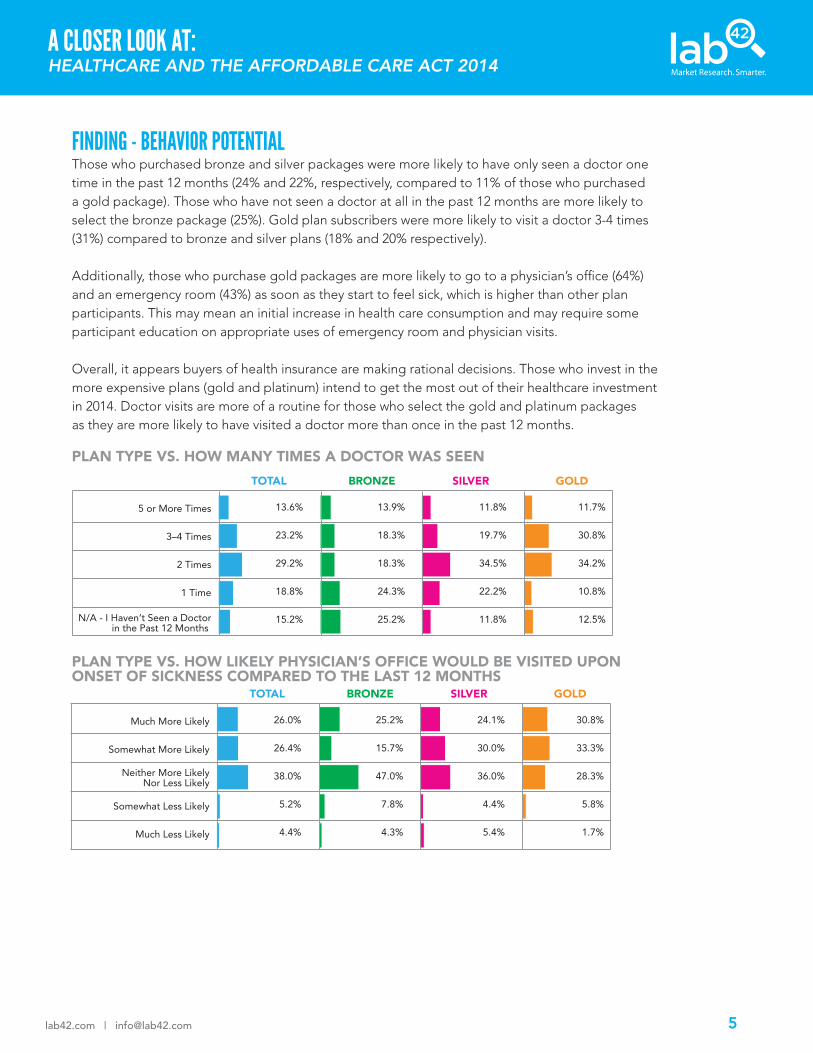
FINDING - BEHAVIOR POTENTIALThose who purchased bronze and silver packages were more likely to have only seen a doctor one time in the past 12 months (24% and 22%, respectively, compared to 11% of those who purchased a gold package). Those who have not seen a doctor at all in the past 12 months are more likely to select the bronze package (25%). Gold plan subscribers were more likely to visit a doctor 3-4 times (31%) compared to bronze and silver plans (18% and 20% respectively).
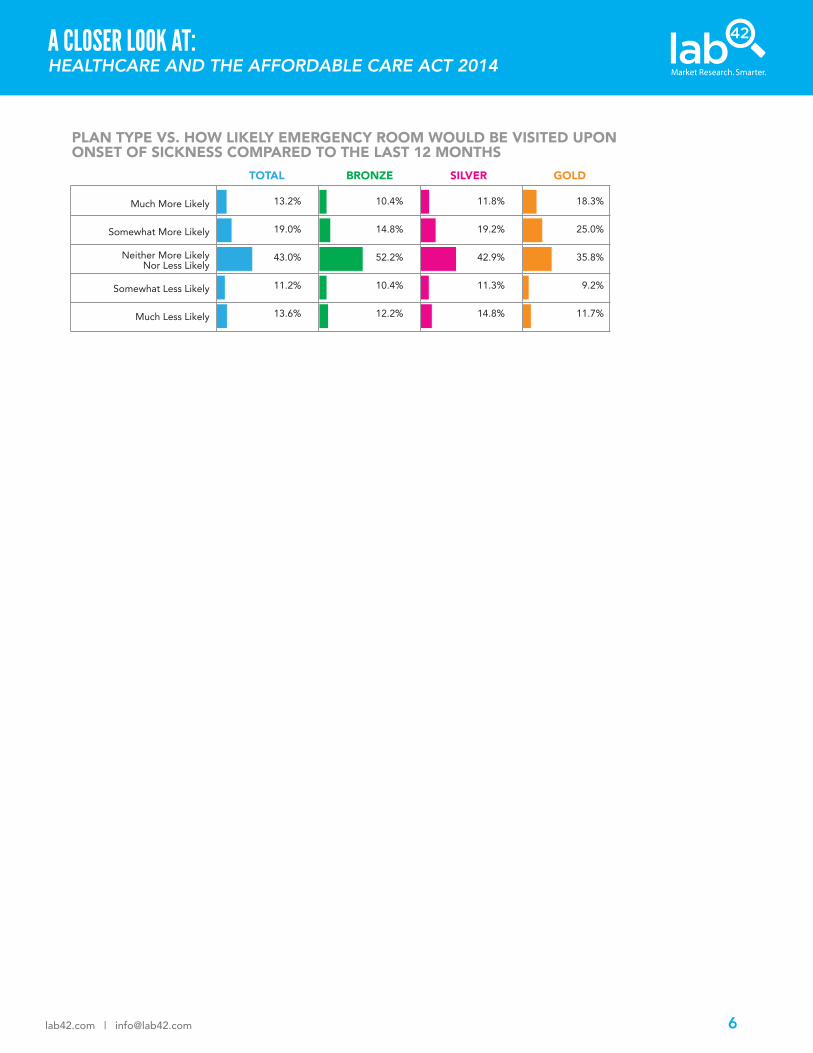
Additionally, those who purchase gold packages are more likely to go to a physician’s office (64%) and an emergency room (43%) as soon as they start to feel sick, which is higher than other plan participants. This may mean an initial increase in health care consumption and may require some participant education on appropriate uses of emergency room and physician visits.
Overall, it appears buyers of health insurance are making rational decisions. Those who invest in the more expensive plans (gold and platinum) intend to get the most out of their healthcare investment in 2014. Doctor visits are more of a routine for those who select the gold and platinum packages as they are more likely to have visited a doctor more than once in the past 12 months.
TOTAL BRONZE SILVER GOLD
5 or More Times
3–4 Times
2 Times
1 Time
N/A - I Haven’t Seen a Doctorin the Past 12 Months
13.6%
23.2%
29.2%
18.8%
15.2%
13.9%
18.3%
18.3%
24.3%
25.2%
11.8%
19.7%
34.5%
22.2%
11.8%
11.7%
30.8%
34.2%
10.8%
12.5%
TOTAL BRONZE SILVER GOLD
Much More Likely
Somewhat More Likely
Neither More LikelyNor Less Likely
Somewhat Less Likely
Much Less Likely
26.0%
26.4%
38.0%
5.2%
4.4%
25.2%
15.7%
47.0%
7.8%
4.3%
24.1%
30.0%
36.0%
4.4%
5.4%
30.8%
33.3%
28.3%
5.8%
1.7%
PLAN TYPE VS. HOW MANY TIMES A DOCTOR WAS SEEN
PLAN TYPE VS. HOW LIKELY PHYSICIAN’S OFFICE WOULD BE VISITED UPON ONSET OF SICKNESS COMPARED TO THE LAST 12 MONTHS
A CLOSER LOOK AT:HEALTHCARE AND THE AFFORDABLE CARE ACT 2014
6lab42.com | [email protected]
Much More Likely
Somewhat More Likely
Neither More LikelyNor Less Likely
Somewhat Less Likely
Much Less Likely
13.2%
19.0%
43.0%
11.2%
13.6%
10.4%
14.8%
52.2%
10.4%
12.2%
11.8%
19.2%
42.9%
11.3%
14.8%
18.3%
25.0%
35.8%
9.2%
11.7%
TOTAL BRONZE SILVER GOLD
PLAN TYPE VS. HOW LIKELY EMERGENCY ROOM WOULD BE VISITED UPON ONSET OF SICKNESS COMPARED TO THE LAST 12 MONTHS
A CLOSER LOOK AT:HEALTHCARE AND THE AFFORDABLE CARE ACT 2014
7lab42.com | [email protected]
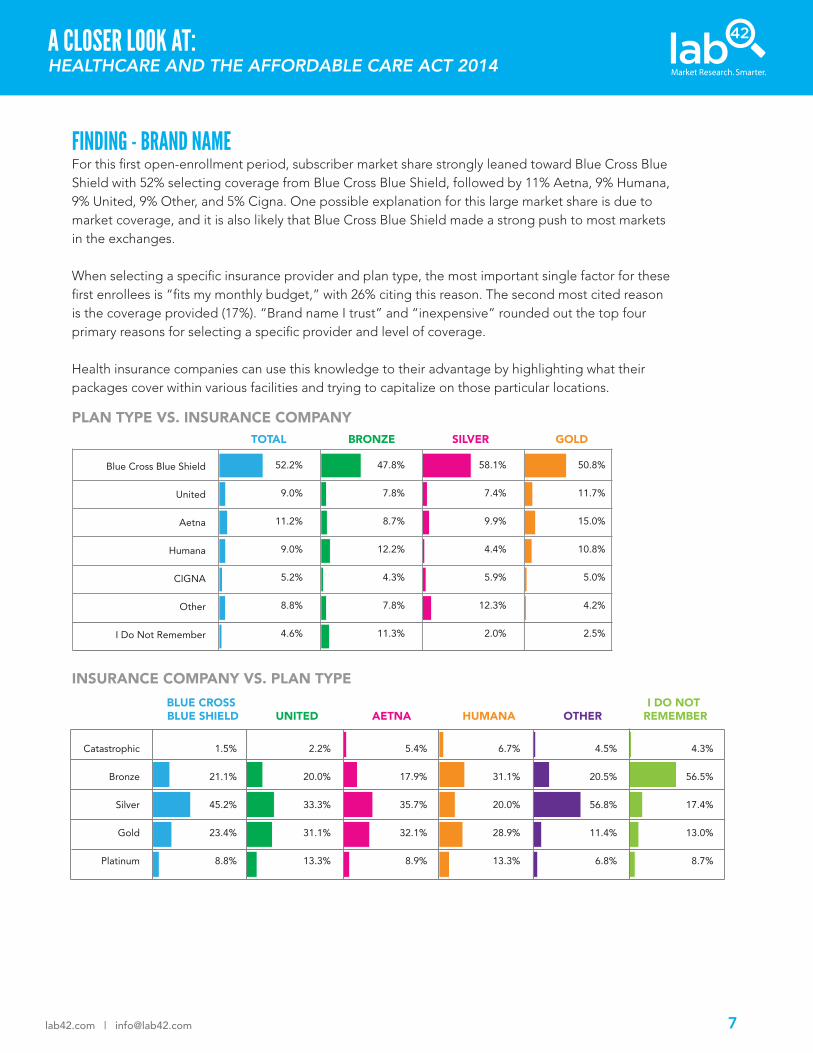
FINDING - BRAND NAMEFor this first open-enrollment period, subscriber market share strongly leaned toward Blue Cross Blue Shield with 52% selecting coverage from Blue Cross Blue Shield, followed by 11% Aetna, 9% Humana, 9% United, 9% Other, and 5% Cigna. One possible explanation for this large market share is due to market coverage, and it is also likely that Blue Cross Blue Shield made a strong push to most markets in the exchanges.
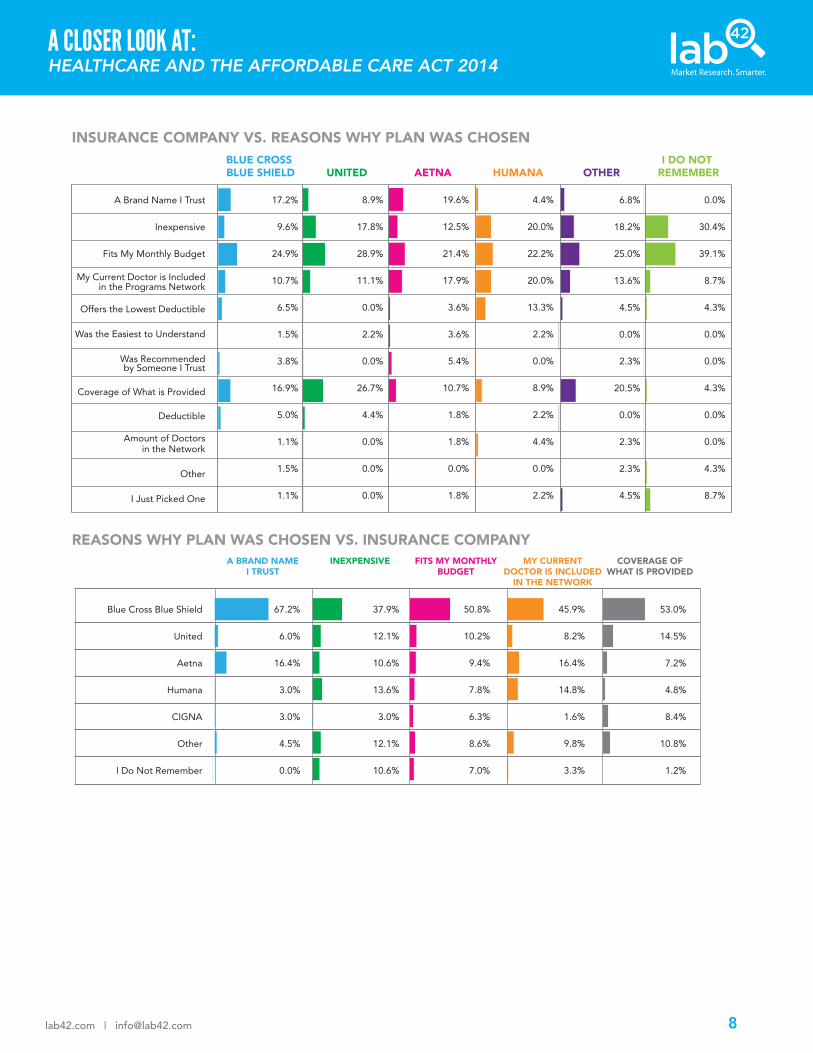
When selecting a specific insurance provider and plan type, the most important single factor for these first enrollees is “fits my monthly budget,” with 26% citing this reason. The second most cited reason is the coverage provided (17%). “Brand name I trust” and “inexpensive” rounded out the top four primary reasons for selecting a specific provider and level of coverage.
Health insurance companies can use this knowledge to their advantage by highlighting what their packages cover within various facilities and trying to capitalize on those particular locations. Plan Type vs. Insurance Company
TOTAL BRONZE SILVER GOLD
Blue Cross Blue Shield
United
Aetna
Humana
CIGNA
Other
I Do Not Remember
52.2%
9.0%
11.2%
9.0%
5.2%
8.8%
4.6%
47.8%
7.8%
8.7%
12.2%
4.3%
7.8%
11.3%
58.1%
7.4%
9.9%
4.4%
5.9%
12.3%
2.0%
50.8%
11.7%
15.0%
10.8%
5.0%
4.2%
2.5%
Insurance Company vs. Plan TypeBLUE CROSS BLUE SHIELD UNITED AETNA HUMANA
Catastrophic
Bronze
Silver
Gold
Platinum
1.5%
21.1%
45.2%
23.4%
8.8%
2.2%
20.0%
33.3%
31.1%
13.3%
5.4%
17.9%
35.7%
32.1%
8.9%
6.7%
31.1%
20.0%
28.9%
13.3%
OTHERI DO NOT
REMEMBER
4.5%
20.5%
56.8%
11.4%
6.8%
4.3%
56.5%
17.4%
13.0%
8.7%
PLAN TYPE VS. INSURANCE COMPANY
INSURANCE COMPANY VS. PLAN TYPE
A CLOSER LOOK AT:HEALTHCARE AND THE AFFORDABLE CARE ACT 2014
8lab42.com | [email protected]
Insurance Company vs. Reasons Why Plan Was ChosenBLUE CROSS BLUE SHIELD UNITED AETNA HUMANA
A Brand Name I Trust
Inexpensive
Fits My Monthly Budget
My Current Doctor is Includedin the Programs Network
Offers the Lowest Deductible
Was the Easiest to Understand
Was Recommendedby Someone I Trust
Coverage of What is Provided
Deductible
Amount of Doctorsin the Network
Other
I Just Picked One
17.2%
9.6%
24.9%
10.7%
6.5%
1.5%
3.8%
16.9%
5.0%
1.1%
1.5%
1.1%
8.9%
17.8%
28.9%
11.1%
0.0%
2.2%
0.0%
26.7%
4.4%
0.0%
0.0%
0.0%
19.6%
12.5%
21.4%
17.9%
3.6%
3.6%
5.4%
10.7%
1.8%
1.8%
0.0%
1.8%
4.4%
20.0%
22.2%
20.0%
13.3%
2.2%
0.0%
8.9%
2.2%
4.4%
0.0%
2.2%
OTHERI DO NOT
REMEMBER
6.8%
18.2%
25.0%
13.6%
4.5%
0.0%
2.3%
20.5%
0.0%
2.3%
2.3%
4.5%
0.0%
30.4%
39.1%
8.7%
4.3%
0.0%
0.0%
4.3%
0.0%
0.0%
4.3%
8.7%
Reasons Why Plan Was Chosen vs. Insurance CompanyA BRAND NAME
I TRUSTINEXPENSIVE FITS MY MONTHLY
BUDGETMY CURRENT
DOCTOR IS INCLUDEDIN THE NETWORK
Blue Cross Blue Shield
United
Aetna
Humana
CIGNA
Other
I Do Not Remember
67.2%
6.0%
16.4%
3.0%
3.0%
4.5%
0.0%
37.9%
12.1%
10.6%
13.6%
3.0%
12.1%
10.6%
50.8%
10.2%
9.4%
7.8%
6.3%
8.6%
7.0%
45.9%
8.2%
16.4%
14.8%
1.6%
9.8%
3.3%
COVERAGE OFWHAT IS PROVIDED
53.0%
14.5%
7.2%
4.8%
8.4%
10.8%
1.2%
INSURANCE COMPANY VS. REASONS WHY PLAN WAS CHOSEN
REASONS WHY PLAN WAS CHOSEN VS. INSURANCE COMPANY
A CLOSER LOOK AT:HEALTHCARE AND THE AFFORDABLE CARE ACT 2014
9lab42.com | [email protected]
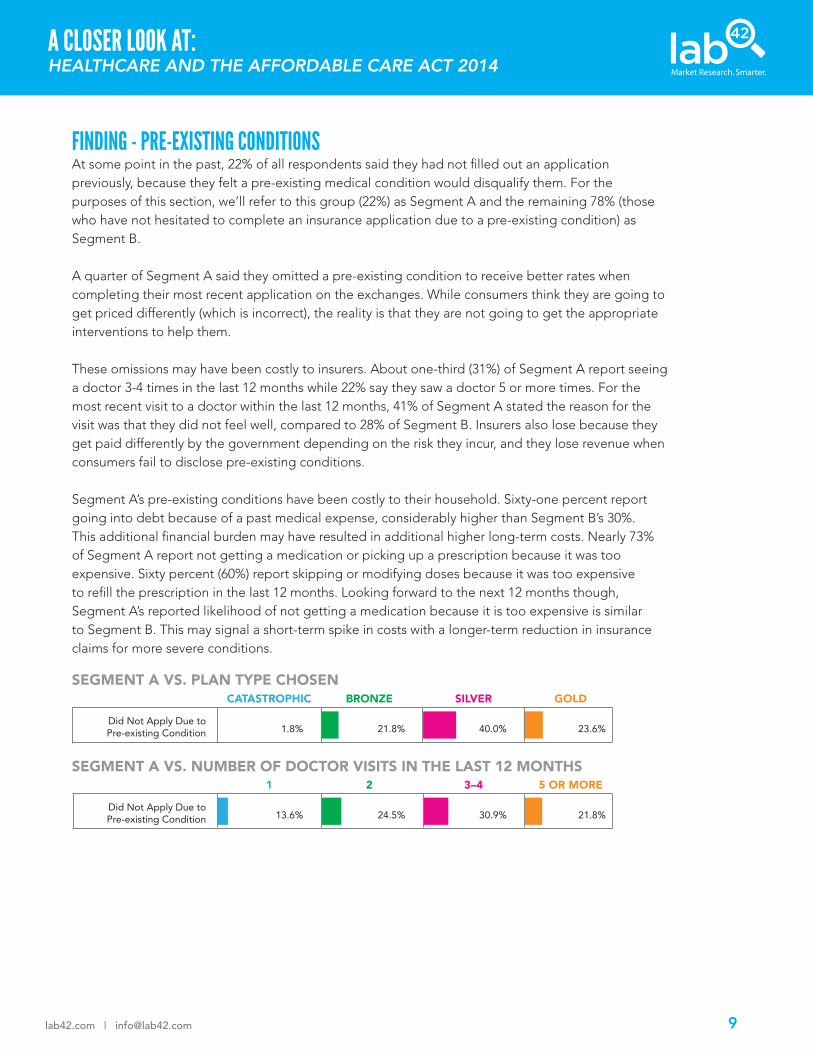
FINDING - PRE-EXISTING CONDITIONSAt some point in the past, 22% of all respondents said they had not filled out an application previously, because they felt a pre-existing medical condition would disqualify them. For the purposes of this section, we’ll refer to this group (22%) as Segment A and the remaining 78% (those who have not hesitated to complete an insurance application due to a pre-existing condition) as Segment B.
A quarter of Segment A said they omitted a pre-existing condition to receive better rates when completing their most recent application on the exchanges. While consumers think they are going to get priced differently (which is incorrect), the reality is that they are not going to get the appropriate interventions to help them.
These omissions may have been costly to insurers. About one-third (31%) of Segment A report seeing a doctor 3-4 times in the last 12 months while 22% say they saw a doctor 5 or more times. For the most recent visit to a doctor within the last 12 months, 41% of Segment A stated the reason for the visit was that they did not feel well, compared to 28% of Segment B. Insurers also lose because they get paid differently by the government depending on the risk they incur, and they lose revenue when consumers fail to disclose pre-existing conditions.
Segment A’s pre-existing conditions have been costly to their household. Sixty-one percent report going into debt because of a past medical expense, considerably higher than Segment B’s 30%. This additional financial burden may have resulted in additional higher long-term costs. Nearly 73% of Segment A report not getting a medication or picking up a prescription because it was too expensive. Sixty percent (60%) report skipping or modifying doses because it was too expensive to refill the prescription in the last 12 months. Looking forward to the next 12 months though, Segment A’s reported likelihood of not getting a medication because it is too expensive is similar to Segment B. This may signal a short-term spike in costs with a longer-term reduction in insurance claims for more severe conditions.
Those Who Never Applied Due to Pre-existing Condition vs. Plan Type Chosen
CATASTROPHIC BRONZE SILVER GOLD
Did Not Apply Due toPre-existing Condition 1.8% 21.8% 40.0% 23.6%
Those Who Never Applied Due to Pre-existing Condition vs. How Often They Go1 2 3–4 5 OR MORE
Did Not Apply Due toPre-existing Condition 13.6% 24.5% 30.9% 21.8%
SEGMENT A VS. PLAN TYPE CHOSEN
SEGMENT A VS. NUMBER OF DOCTOR VISITS IN THE LAST 12 MONTHS
A CLOSER LOOK AT:HEALTHCARE AND THE AFFORDABLE CARE ACT 2014
10lab42.com | [email protected]
$$$$$
$$$$$
$$$$$
$$$$$
$$$$$
FINDING - DEBTThirty-six percent of all respondents have gone into debt in the past due to a medical expense. Those who have gone into debt in the past were more likely to choose Humana for their new coverage over competitors Blue Cross Blue Shield, United and Aetna.
Humana has a key opportunity in the healthcare market to reach those who have previously been in debt because of a past medical expense, but all insurance companies can benefit from this knowledge, as healthcare becomes more consumer-driven. To help consumers manage their medical expenses, plans could offer financial products or tools geared toward their members.

A CLOSER LOOK AT:HEALTHCARE AND THE AFFORDABLE CARE ACT 2014
11lab42.com | [email protected]
FINDING - VALUEOverall, 17% feel the plan they selected is an excellent value, while 42% describe it as a good value. Thirty-one percent (31%) labeled their plan as a fair value. About 10% feel the package they selected is a poor value.
Of the four options to describe the value of their package (Excellent, Good, Fair, or Poor), those who select the bronze package are less likely to think their package is a good value. Fifteen percent (15%) thought it was a poor value, compared to 5% of those with a gold package. Those who selected the silver and gold packages are more likely to think it is a good or excellent value (59% and 70% respectively) compared to 45% bronze.
A possible explanation of why bronze members may be less likely to think their package is a good value is that those who select a bronze package are not as familiar with the plan and what it may entail. There is an opportunity to educate potential customers on the breakdown of plans and how each plan provides value, with the goal of instilling confidence that the correct plan was selected for their particular situation.
Value vs. Insurance Company
BLUE CROSS BLUE SHIELD UNITED AETNA HUMANA
Excellent Value
Good Value
Fair Value
Poor Value
18.0%
44.1%
27.2%
10.7%
11.1%
46.7%
37.8%
4.4%
16.1%
46.4%
32.1%
5.4%
24.4%
37.8%
28.9%
8.9%
OTHERI DO NOT
REMEMBER
13.6%
38.6%
36.4%
11.4%
13.0%
26.1%
39.1%
21.7%
Value vs. Plan TypeTOTAL BRONZE SILVER GOLD
Excellent Value
Good Value
Fair Value
Poor Value
17.2%
42.2%
31.0%
9.6%
14.8%
30.4%
40.0%
14.8%
14.8%
44.3%
32.0%
8.9%
21.7%
48.3%
25.0%
5.0%
Value vs. How Often They Go to the DoctorTOTAL 1 2 3–4
Excellent Value
Good Value
Fair Value
Poor Value
17.2%
42.2%
31.0%
9.6%
5.0%
41.3%
41.3%
12.4%
18.9%
49.7%
23.8%
7.7%
21.1%
45.3%
30.5%
3.1%
7.7%
17.9%
33.3%
41.0%
N/A
VALUE VS. INSURANCE COMPANY
VALUE VS. PLAN TYPE
VALUE VS. HOW OFTEN THEY GO TO THE DOCTOR
A CLOSER LOOK AT:HEALTHCARE AND THE AFFORDABLE CARE ACT 2014
12lab42.com | [email protected]
FINDING - CONFUSIONThe anticipated experience with the healthcare system has a noticeable impact on feelings of confusion with the sign-up process, even if an enrollee had insurance prior to using the exchanges. Those planning five or more visits to the doctor yearly found the process somewhat simpler than previous times they switched insurance, compared to those planning fewer doctor visits. Fifty three percent (53%) of those not planning any visits to the doctor found the process much more confusing than previous times they switchedinsurance. This would suggest that consumers who are more familiar with the healthcare system found the process easier than those who are less familiar with it.
Among those who have switched insurance in the past, 35% of those who signed up for their current coverage using a non-online method found it more confusing than their previous switch. Those who purchased silver and gold plans found the process of signing up for insurance under the Affordable Care Act somewhat more simple (38% and 43% respectively) than those who signed up for the bronze plan (19%).
A key opportunity for health insurance companies lies in their ability to make consumers feel more at ease and informed about their healthcare decisions and plans, especially those who use outlets other than the Internet to sign up for health insurance. Those signing up for the bronze program, specifically, are not as knowledgeable about insurance and find the process confusing. After consumers complete the sign-up process, insurers could offer education tools and services to 1) better explain the plan’s coverage and 2) reassure consumers that they made the right decision.
A CLOSER LOOK AT:HEALTHCARE AND THE AFFORDABLE CARE ACT 2014
13lab42.com | [email protected]
OTHER KEY FINDINGS 49% of all respondents think their healthcare insurance is better than it was 12 months ago; 20% think it is worse 53% of those who have switched healthcare plans in the past think signing up for healthcare under the Affordable Care Act was more confusing; 47% thought it was simpler Since the 1 October launch, there has been considerable news coverage of exchange web site issues, especially Healthcare.gov. Yet, for all the media coverage, 80% would highly or some what recommend using the online option, statistically identical to those who used other options. This pattern was also seen in satisfaction with the online option with 71% Very or Somewhat Satisfied, also similar to other options. Finally, 87% said they are Highly or Somewhat Likely to use the method again. Not surprisingly, satisfaction with the process of purchasing healthcare insurance does seem to be linked to an enrollee’s political affiliation. Those identifying as Democrats were more positive about their enrollment experience. Nearly 82% were satisfied with their method for purchasing healthcare insurance. Sixty-four percent (64%) of Independents and 61% of Republicans were satisfied. This was also reflected at the negative end of the scale, with 27% of Republicans and 23% of Independents dissatisfied with their experience.
A CLOSER LOOK AT:HEALTHCARE AND THE AFFORDABLE CARE ACT 2014
14lab42.com | [email protected]
METHODOLOGYThe Lab42 survey was fielded among 500 adults in the United States, ages 18 and up, who used a federal or state health exchange to sign up for health insurance under the Affordable Care Act. The survey was conducted from December 16 - 28, 2013.
ADDITIONAL SOURCEShttp://www.nbcnews.com/health/deadline-looms-obamacare-2D11792133http://affordablehealthca.com/history-affordable-care-act/http://www.apha.org/advocacy/Health+Reform/ACAbasics/
ABOUT LAB42 Lab42 is a quantitative market research firm that helps businesses accomplish and prioritize their goals through targeted social media-based research. By providing fast and affordable insights and customized infographics, Lab42 makes market research more accessible for companies of all sizes, ranging from small businesses to Fortune 500 companies. For more information, visit www.lab42.com.