Lab. Meat Processing and Quality Control Technology
45
Dequan Zhang Ph.D/Professor Lab. of Meat Science and Technology Institute of Agro-Food Science and Technology(IAFST) Chinese Academy of Agriculture Science(CAAS) The Research of Meat Science and Technology in IAFST
Transcript of Lab. Meat Processing and Quality Control Technology

Dequan Zhang Ph.D/Professor
Lab. of Meat Science and Technology
Institute of Agro-Food Science and Technology(IAFST)
Chinese Academy of Agriculture Science(CAAS)
The Research of Meat Science and Technology in IAFST

OUTLINE
About IAFST
Introduction of meat science and
technology in IASFT

Basic situation
Founded in 2003.
Staff Composition: 98 on-the-job staff
members (72 scientists and technicians)
15 professors
20 associate professors
9 Ph.D. supervisors
17 master supervisors
About IASFT

Mission
Key technologies for
agricultural products
processing
Food science &
Technology
Food quality and
safety technology
Education and training
About IASFT

Main Areas of Activities:
Cereal & Oil Processing and Functional
Food
Vegetable & Fruit Processing and Quality
Control
Meat Processing and Quality Control
Dairy Processing and Quality Control
Food Preservation and Logistics
Food Quality and Safety
About IASFT

Introduction of meat
science and
technology
1 Eating Quality and Quality Control
2 Development of the New Products and
Utilization of offals

1 Evaluation of eating quality
and control
1.1 Prediction of eating quality by NIR
1.2 Nondestructive carcass grading technology
1.3 Influence of DPCD on the quality of meat
products

1.1 Prediction of eating quality by NIR
Study the relationship between the
instrumental parameters and eating
quality of meat by means of the CA
(Correlation analysis), SPA(sensory
Profile Analysis), PCA (Principal
component analysis ) and others
methods to build up the prediction
model of eating quality of meat by NIR.

Prediction of tenderness of
meat by NIR
Firstly, detect the tenderness of
meat by TPA;
Secondly, scan the meat by NIR
and acquire the NIR spectrum;
Build up the prediction model of
mutton tenderness by NIR to
TPA with difference partial
least squares (PLS) factors.
Use coefficient of determination
(R2) & root mean square error of
calibration (RMSECV) to
determine the predict ion model.
Rank:8 preprocessing method: Vector Normalization
Wave region: 11995 – 5446, 4601 – 4246cm-1
R2=0.71 RMSECV=0.46
Prediction of the tenderness of mutton (shear force ) by NIR
1.1 Prediction of eating quality by NIR

Prediction of color of meat
by NIR
Firstly, detect the color of meat
by color meter;
Secondly, scan the meat by NIR
and acquire the NIR spectrum;
Build up the prediction model of
mutton color by NIR with PLS
factors.
Use R2 and RMSECV to
determine the predict ion model.
1.1 Prediction of eating quality by NIR
Rank:6 preprocessing method: Mix-max Normalization
Wave region:11995.5 – 4597.6cm-1
R2=0.77 RMSECV=0.45
Prediction of the color of mutton by NIR
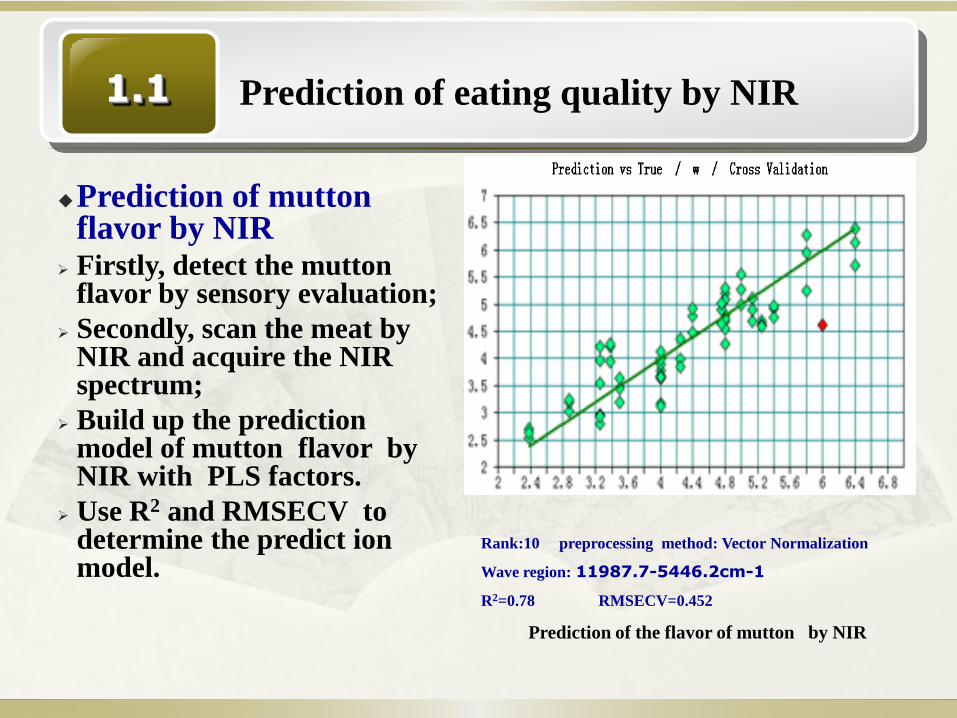
Prediction of mutton flavor by NIR
Firstly, detect the mutton flavor by sensory evaluation;
Secondly, scan the meat by NIR and acquire the NIR spectrum;
Build up the prediction model of mutton flavor by NIR with PLS factors.
Use R2 and RMSECV to determine the predict ion model.
1.1 Prediction of eating quality by NIR
Rank:10 preprocessing method: Vector Normalization
Wave region: 11987.7-5446.2cm-1
R2=0.78 RMSECV=0.452
Prediction of the flavor of mutton by NIR

Prediction of juiciness of meat by NIR
Firstly, detect the mutton juiciness by sensory evaluation;
Secondly, scan the meat by NIR and acquire the NIR spectrum;
Build up the prediction model of mutton juiciness by NIR with PLS factors.
Use R2 and RMSECV to determine the predict ion model.
1.1 Prediction of eating quality by NIR
Rank:8 preprocessing method: Vector Normalization
Wave region: 11987.7-4246.6cm-1
R2=0.734 RMSECV=0.435
Prediction of the juiciness of mutton by NIR

Investigate the automatic grading technology of carcass by uses of the
novel instrumental methods, such as NIR, Ultrasonic .
1.2Nondestructive carcass grading
technology by NIR
Carcass NIRsample
tenderness
texture
muscle color
fat color
marble
Quality grading
Spectra Model
Sa
mp
les
we
re
sc
an
ne
d b
y N
IR
Th
e d
ata
we
re p
ut
into
the c
om
pu
ter
Th
e p
red
ictio
n
mo
del w
ere
bu
ilt
Prediction the carcass grade
carcass weight
back-fat thickness
carcass muscle
age
Yield grading

1.2Nondestructive carcass grading
technology by NIR
Study on the grade of lamb carcass by
NIR
Yield grading
Quality grading

(1) Establish yield grade model by NIR
Screen yield grade indicators
statistic of lamb carcasscharacter indicato
r
N Max Min Mean S.D. CV% S.E.
Carcass weight x1 40 18.6000000 10.500000 14.5587500 1.8819619 12.926672 0.2975643
Leg score x2 40 12.0000000 10.000000 10.650000 0.8638020 8.1108166 0.1365791
split carcass meat weight
x3 40 6.6850000 3.0440000 5.0047000 0.7855061 15.695368 0.1241994
meat ratio x4 40 75.3400000 57.9800000 68.527250 3.1597517 4.6109419 0.4996006
Meat weight after trimming
x5 40 12.1280000 6.2640000 9.3409250 1.4638962 15.6718547 0.2314623
Back thickness x6 40 11.2500000 2.8000000 5.4145000 1.8699595 34.6361433 0.2956666
Rib thickness x7 40 26.3400000 11.030000 17.4045000 3.2844224 18.8711104 0.5193128
Body wall x8 40 25.3800000 10.540000 16.3412500 3.0797862 18.846699 0.4869570
Eye loin area x9 40 12.7000000 5.8000000 9.1372500 1.3776699 15.0775111 0.217828

correlation between nine indicators
x1 x2 x3 x4 x5 x6 x7 x8 x9
x1 1.00000
x2 0.61707 1.00000
x3 0.97256 0.61967 1.00000
x4 0.56376 0.38509 0.73673 1.00000
x5 0.91278 0.63204 0.89239 0.53220 1.00000
x6 0.55261 0.52262 0.57233 0.40026 0.49349 1.00000
x7 0.62262 0.58821 0.60029 0.34894 0.57195 0.57847 1.00000
x8 0.61494 0.59765 0.59847 0.36453 0.58080 0.56032 0.97201 1.00000
x9 0.55424 0.47427 0.56995 0.44737 0.48571 0.40115 0.64443 0.68655 1.00000
(1) Establish yield grade model by NIR

eigenvalue(λ) proportion(%) cumulative(%)
1 28.2419375 0.6614 0.6614
2 8.2389854 0.1930 0.8544
3 2.5106489 0.0588 0.9132
4 1.9283840 0.0452 0.9583
5 0.9187587 0.0215 0.9798
6 0.3965102 0.0093 0.9891
7 0.2751738 0.0064 0.9956
8 0.1879367 0.0044 1.0000
9 0.0008780 0.0000 1.0000
principal component analysis between nine indicators
Morrison considers that cumulative greater than 85% can explain the most information.
(1) Establish yield grade model by NIR

Factor 1 Factor 2
x1 0.279883 0.149989
x2 0.109546 0.006031
x3 0.120335 0.109746
x4 0.367819 0.838103
x5 0.204248 0.115483
x6 0.237468 0.028309
x7 0.576542 -.372227
x8 0.542152 -.332135
x9 0.188296 0.001307
eigenvalue 28.2419375 8.2389854
proportion(%) 0.6614 0.1930
cumulative(%) 0.6614 0.8544
0.9720
body wall= 0.91145*lib
thickness + 0.47788
(R2=0.9448)
So, lib thickness
can be used to
predict the yield
grade.
(1) Establish yield grade model by NIR
eigenvectors

model formula R2
1 y=ax+b Y=62.68465+0.33569x 0.1214
2 Y=a+bx2 Y= 65.91694+ 0.00833x2 0.0960
3 Y=a+bx3 Y= 67.05149+ 67.0514x3 0.0706
4 y=b0+b1x+b2x2 y= 44.81241+2.42034x -0.05874x2 0.2009
5 y=b0+b1*x+b2x2+b3 x3 y= 54.09022+ 0.80604 x+ 0.03164 x2 -
0.00163 x3
0.2021
6 y=1/(a+bx) Y=1/( 0.01596 -0.00007685x) 0.1301
7 y=1/(a+b*exp(-x)) y=1/( 0.01456+ 66.04731*exp(-x)) 0.0717
8 y=1/(a+bx*x) y=1/( 0.01522 -0.00000192x*x) 0.1036
9 y=1/(a+bx*x*x) y=1/( 0.01497 -5.86613*10-8x*x*x) 0.0773
10 y=a*exp(bx) y=e4.13791*exp(0.00507x) 0.1262
11 y=a*exp(bx*x) y= e4.18663*exp(0.00012615x*x) 0.1000
12 y=(a+bx)/x y=( -80.44133 + 73.35198 x)/x 0.9614
13 y=x/(a+bx) y=x/( 0.01864+ 0.01351x) 0.9485
14 y=a+b*√x y= 56.3979+2.92024^√x 0.1337
15 y=1/(a+b*√x) y=1/( 0.01739 -0.00066709*√x) 0.1422
Establish yield grade evaluation equation

Meat ratio(Y) range:57.98~75.34
Grade one:Y≥72%
Grade two:67%≤Y<72%
Grade three:62%≤Y<67%
Grade four:57%≤Y<62%
Grade five:Y<57%
-80.44133 + 73.35198*lib thickness
Meat ratio(Y) =-----------------------------------------------*100%
lib thickness
(1) Establish yield grade model by NIR

(1) Establish yield grade model by NIR
Lamb yield grade model by NIR
Rank:8, preprocessing method: No Spectral Data
Preprocessing, Wave region:11995.5 – 4597.6cm-1
R2=0.73, RMSECV=4.62
Prediction of the Lamb grade by NIR

Related coefficient
L a b ΔE
Sensory score -0.83176 0.79101 0.55469 0.91369
Correlation analysis between sensory score and color
value by color meter
(2) Establish quality grade model by NIR
⊿E=√(L-L0)2+(a-a0)
2+(b-b0)2
Make the Muscle and fat color board

0
10
20
30
40
50
60
70
80
0 100 200 300 400 500
70.46
49.07
1 2 3 4 5 6
Muscle color board(392 data)

Fat color board (368 data)
1 2 3 4 5 6
0
5
10
15
20
25
30
35
40
0 100 200 300 400
Serie1
13.65
37.37

Marbling standard board (181data)
Take a picture for lamb marble samples and measure fat rate with Matlab.
1 2 3 4 5
6

(2) Establish quality grade model by NIR

Mode of processing
Current situation
To date, most studies focus on the inactivation of DPCD to microorganisms in liquid culture medium and foods such as juice and milk, the studies about solid food such as meat products is less.
Dense phase CO2(DPCD)
Definition
DPCD is the supercritical state (31.1 ℃,7.38MPa) or subcritical state CO2, use DPCD
to kill microorganisms in food was called DPCD sterilization technology.
1.3Influence of DPCD on the quality of meat
products
Can DPCD be used to sterilize in
low-temperature sausage?

The inactivation of bacteria by DPCDThe inactivation curve
Bacteria of low-temperature sausages were effectively
inactivated by DPCD.
The inactivation rate of bacteria increased with
increment of treatment pressure, treatment temperature
and exposure time.
The maximal drop of the total viable counts was 4.8 lg
cfu/g at 75℃, 50MPa and 30min.
Under the same temperature, the increment of pressure
can strengthen the inactivation of bacteria by DPCD
obviously, vice versa.

model R2 RMSE
linear 0.834-0.985 0.004-0.899
Weibull 0.986-0.999 0.001-0.089
Log-Logistic 0.939-0.998 0.006-0.187
The fitting effect of Linear, Weibull and Log-Logistic models to
the inactivation curves by DPCD
The inactivation of bacteria by DPCD
The non-linear model could fit to bacterial inactivation
kinetics curve by DPCD better than Linear model. Especially,
the Weibull model could fit to the bacterial inactivation
kinetics curve best.

treatment protein
(g/)
lipid
(%)
pH water-holding
capacity(%)
acid value
(mgKOH/g)
TVB-N
(mg/)
control 18.80±0.27 10.63±0.33 6.13±0.09 32.69±4.38 2.26±0.24 5.1±0.59
45℃ thermal tratment 18.76±0.22 10.38±0.24 6.15±0.11 27.16±5.09 2.33±0.22 4.3±0.64
15MPa、20min 18.74±0.21 10.21±0.25 6.14±0.09 26.86±4.12 2.28±0.19 4.2±0.78
25MPa、20min 18.71±0.27 10.01±0.19 6.13±0.18 27.75±5.20 2.18±0.27 3.2±0.72
35MPa、20min 18.76±0.25 9.87±0.33 6.13±0.10 26.24±4.71 2.17±0.35 3.7±0.67
45MPa、20min 18.73±0.24 10.08±0.24 6.12±0.11 25.87±5.16 ― ―
50MPa、20min 18.72±0.35 9.66±0.34 6.11±0.17 24.43±5.32 ― ―
control 18.79±0.24 11.16±0.27 5.98±0.17 29.24±4.04 2.38±0.23 6.2±0.64
55℃ thermal tratment 18.73±0.28 10.75±0.22 6.01±0.15 23.47±4.73 2.45±0.19 5.1±0.58
15MPa、20min 18.78±0.17 10.26±0.31 6.00±0.13 23.46±4.36 2.23±0.28 4.4±0.73
25MPa、20min 18.70±0.26 10.14±0.42 6.00±0.21 21.78±5.11 2.17±0.37 3.6±0.79
35MPa、20min 18.72±0.21 10.02±0.33 5.98±0.16 22.24±5.43 2.14±0.26 2.8±0.56
45MPa、20min 18.67±0.33 9.82±0.28 6.01±0.12 21.92±5.78 ― ―
50MPa、20min 18.65±0.23 9.86±0.27 5.99±0.09 20.80±5.92 ― ―
Influence of DPCD on the quality of low-temperature sausage

treatment protein
(g/)
lipid
(%)
pH water-holding
capacity(%)
acid value
(mgKOH/g)
TVB-N
(mg/)
control 18.82±0.27 10.89±0.29 6.10±0.11 31.08±4.82 2.43±0.26 7.3±0.53
60℃ thermal tratment 18.87±0.21 10.42±0.34 6.14±0.09 23.31±6.74 2.51±0.28 6.5±0.48
15MPa、20min 18.76±0.26 10.27±0.26 6.13±0.13 22.73±4.38 2.23±0.32 5.1±0.55
25MPa、20min 18.67±0.23 10.04±0.24 6.12±0.12 22.48±5.29 2.18±0.27 3.6±0.67
35MPa、20min 18.69±0.31 9.98±0.32 6.12±0.14 21.64±4.71 2.14±0.33 4.2±0.49
45MPa、20min 18.71±0.37 9.76±0.28 6.11±0.11 20.38±6.45 ― ―
50MPa、20min 18.68±0.24 9.68±0.35 6.12±0.06 19.15±4.54 ― ―
control 18.77±0.16 10.82±0.21 6.11±0.21 32.14±3.21 2.28±0.25 7.3±0.52
65℃ thermal tratment 18.75±0.23 10.44±0.23 6.14±0.16 22.25±5.34 2.52±0.26 6.4±0.66
15MPa、20min 18.71±0.27 10.28±0.30 6.15±0.18 21.83±4.56 2.24±0.29 5.1±0.47
25MPa、20min 18.64±0.29 10.19±0.26 6.13±0.12 20.36±3.63 2.07±0.38 4.4±0.58
35MPa、20min 18.69±0.25 10.11±0.34 6.12±0.08 19.34±4.55 2.01±0.35 3.7±0.55
45MPa、20min 18.57±0.27 9.77±0.37 6.13±0.15 20.87±4.78 ― ―
50MPa、20min 18.60±0.34 9.62±0.45 6.10±0.08 18.05±5.25 ― ―
Influence of DPCD on the quality of low-temperature sausage

treatment protein
(g/)
lipid
(%)
pH water-holding
capacity(%)
acid value
(mgKOH/g)
TVB-N
(mg/)
control 18.91±0.28 10.13±0.18 6.11±0.18 34.58±5.33 2.26±0.27 8.1±0.48
70℃ thermal tratment 18.87±0.25 9.57±0.22 6.15±0.23 23.73±5.18 2.52±0.36 7.2±0.63
15MPa、15min 18.83±0.22 9.21±0.21 6.14±0.07 22.41±4.65 2.15±0.32 3.4±0.54
25MPa、15min 18.78±0.31 9.01±0.27 6.13±0.11 19.35±6.34 2.00±0.28 4.2±0.65
35MPa、15min 18.67±0.26 8.86±0.38 6.13±0.15 20.17±4.77 1.97±0.37 4.4±0.71
45MPa、15min 18.74±0.25 8.95±0.24 6.12±0.13 19.23±4.46 ― ―
50MPa、15min 18.69±0.34 8.82±0.36 6.11±0.17 18.65±5.91 ― ―
control 18.75±0.22 10.29±0.26 6.14±0.20 31.44±5.12 2.43±0.25 9.4±0.57
75℃ thermal tratment 18.72±0.37 9.65±0.31 6.17±0.19 20.38±4.35 2.64±0.33 7.3±0.74
15MPa、15min 18.63±0.24 9.22±0.33 6.15±0.17 21.51±5.61 1.79±0.38 5.1±0.45
25MPa、15min 18.59±0.25 9.08±0.28 6.16±0.18 19.10±4.72 1.73±0.34 4.6±0.56
35MPa、15min 18.56±0.28 9.05±0.34 6.15±0.17 17.39±4.34 1.61±0.29 3.6±0.62
45MPa、15min 18.51±0.28 8.76±0.39 6.14±0.15 17.88±5.13 ― ―
50MPa、15min 18.53±0.19 8.91±0.25 6.14±0.12 18.43±5.89 ― ―
Influence of DPCD on the quality of low-temperature sausage

• The pH value, protein content and water-holding
capacity of low-temperature sausages had not change
markedly after DPCD treatment.
• The fat content drop obviously with the increment
of treatment pressure and treatment temperature of
DPCD.
• The acid value and TVB-N all dropped markedly
after DPCD treatment.
Influence of DPCD on the quality of low-temperature sausage

Influence of DPCD on the flavor
SPME-GC-MS of low-temperature sausage
control Thermal treatment
HDCD处理DPCD treatment

0
10
20
30
40
50
aldehyde
hydrocarbon
alcohol
ester
acid
keton
others
Compound kind
Relative content
60℃
15 MPa
25 MPa
Influence of DPCD on the flavor
0
10
20
30
40
50
60
aldehyde
hydrocarbon
alcohol
ester
acid
keton
others
Compound kind
Relative content
70℃ 15 MPa
25 MPa

62 kinds of flavor compounds were detected in
low-temperature sausage treated by heat or DPCD.
The main volatile components were the aldehydes,
hydrocarbons, esters and alcohols.
DPCD has no significant effect on the main volatile
aldehydes and alcohols of low-temperature
sausages.
When the pressure of DPCD increase from 15MPa
to 25MPa, hydrocarbons in low-temperature
sausage increased significantly, the exact cause is
unclear.
Influence of DPCD on the flavor

Summary
Bacteria can be inactivated markedly by DPCD.
The inactivation curve of DPCD follow the non-linear
model, especially the Weibull model can fit to the
inactivation curve of DPCD in low-temperature sausage.
DPCD can hold and improve the nutrition quality and
flavor of low-temperature sausage .
It is feasible that the DPCD was used to sterilize the
low-temperature sausage.

How to inactivate the bacteria by DPCD?

Control 30MPa
Fig. SEM of E.coli ×5000
Study the influence of DPCD on the cell morphology of bacteria with
SEM/TEM. The result showed that DPCD can destroy the cell membrane
and make the inner material of cell leak out, So lead to bacteria die.
Study the influence of DPCD on the protein secondary structure of E. coli
with CD(circular dichroism) and NIR. The results showed that the α-helix
and the corner could change to β-pleated after different pressures (10-
50MPa,37℃,30min) DPCD treatment, when the pressure was up to 50MPa,
the content of β-pleated was 75.63% which increased 26.7% more than
control.
Fig. The FTIR spectra of E. coli protein powder
treated or untreated by dense phase CO2
wave number(cm-1)
tran
sm
ittan
ce(%
)

2 Development of the New Products
and Utilization of offals

Prepared meals and microwave meat
products
Fermented meat products
Chinese traditional meat products (salt,
bittern, soy sauce)
2.1 Development of the new products

Study the technology of the by-products such as skin,
discarded meat into the restructured meat products.
Study the new products from by-products such as bone
powder and extracts for flavors and dressings.
2.2 Utilization of offals
Chondroitin sulfate
羊骨源硫酸软骨素制备技术
超声辅助 超滤 冷冻干燥碱-酶

Interests of Cooperation
Nondestructive evaluation of eating quality by NIR or other
technology.
Non-thermal technology in meat processing such as DPCD,
HPP.
Meat fermentation technology such as salami and ham.
Our team Dr. Dequan Zhang Dr. Chunhui Zhang
Dr. Juan Li
Chunhong Li,Technician
Jie Zhu,Technician
Weili Rao, Technician
6-10 Master and Ph.D students

Thanks for
your attention!