Lab 4 (Thermofluids Lab)
36
UNIVERSITI TEKNOLOGI MARA FAKULTI KEJURUTERAAN KIMIA THERMOFLUIDS LABORATORY (CGE 536) No. Title Allocated Marks (%) Marks 1 Abstract/Summary 5 2 Introduction 5 3 Aims/Objectives 5 4 Theory 5 5 Apparatus 5 6 Procedures 10 7 Result 10 8 Calculations 10 9 Discussion 20 10 Conclusion 10 11 Recommendations 5 12 References 5 13 Appendices 5 TOTAL MARKS 100 NAME : 1) MUHAMMAD ROZAIRY BIN ROSLAN (2015829256) 2) MUHAMMAD QAYYUM BIN AZMAN (2015840046) 3) MUHAMAD ADNAN BIN ZAINAL ABIDIN (201520891204) 4) RABIATUL ADAWIYAH BINTI HAMDI (2015238424) 5) MOHAMMAD FITRI BIN ABU BAKAR (2015674008) EXPERIMENT : FLOWMETER DEMONSTRATION DATE PERFORMED: 29 TH MARCH 2016
-
Upload
adnan-nanda -
Category
Documents
-
view
84 -
download
6
description
CGE
Transcript of Lab 4 (Thermofluids Lab)

UNIVERSITI TEKNOLOGI MARA FAKULTI KEJURUTERAAN KIMIA THERMOFLUIDS LABORATORY
(CGE 536)
No. Title Allocated Marks (%) Marks1 Abstract/Summary 5 2 Introduction 5 3 Aims/Objectives 5 4 Theory 5 5 Apparatus 5 6 Procedures 10 7 Result 10 8 Calculations 10 9 Discussion 20 10 Conclusion 10 11 Recommendations 5 12 References 5 13 Appendices 5
TOTAL MARKS 100
Remarks:
Checked by :
Date :
NAME : 1) MUHAMMAD ROZAIRY BIN ROSLAN (2015829256)
2) MUHAMMAD QAYYUM BIN AZMAN (2015840046)
3) MUHAMAD ADNAN BIN ZAINAL ABIDIN (201520891204)
4) RABIATUL ADAWIYAH BINTI HAMDI (2015238424)
5) MOHAMMAD FITRI BIN ABU BAKAR (2015674008)
EXPERIMENT : FLOWMETER DEMONSTRATION
DATE PERFORMED: 29TH MARCH 2016
GROUP : GROUP 3 (EH2433B)

ABSTRACT
The aim of this experiment is to investigate and demonstrate the operation and characteristic
three type of flow meter including its accuracy and energy losses. The hydraulic bench as
well as the Flow Meter Demonstration Unit was used as the apparatus in this experiment.
There are three different type of flow meter which is the Orifice Meter, Venturi Meter, and
Rotameter that we need to identified at the beginning of the experiment. All three flow meter
were placed in the unit and each flow meter was different from the other two in term of area
and flow rates. In Venturi meter and Orifice meter, the output is not linear with the flow rate,
Q as both can only measure the output. On the other hand, Rotameter output which is directly
proportional to the flow rate can be measured and the pressure difference can be neglected.
The average timed flow rate, Qt was calculated to be 5.4022 L/min , while the average
Venturi Meter flow rate, Qv is 5.6581 L/min, the Rotameter average, Qr is calculated to be
5.4025 L/min and lastly the average flow rate for Orifice Meter, Qo approximately 5.1451
L/min. Hence, the average velocity and velocity head are 3.0012×10⁻² mm/s and 4.5908×10⁻⁵
mm respectively.

INTRODUCTION
Fluid mechanics has developed an analytical discipline from the application of the classical
laws of static, dynamics and thermodynamics. It was the situation in which fluids can be
treated as continuous media. The particular laws involved are those of the conversation of
mass. For the information, this law may be simplified in an attempt to describe quantitatively
the behaviour of the fluids.
The hydraulic bench service module (F1-10) provides the necessary facilities to
support a comprehensive range of hydraulic models each of which is designed to demonstrate
particular aspects of hydraulic theory.
The specific hydraulic model that is concerned for this experiment is the flow meter
test rig (F1-21). This consists of venture meter, variable area meter or rotameter and orifice
plate installed in a series of configurations to allow for direct comparisons.
Figure 1 Venturi meter

Figure 2 Orifice meter
Figure 3 Rotameter

Venturi meter
Venturi meter is a tube with constricted throat that increase velocity and decrease pressure.
Venturi meter is used to measure the flow rate of compressible and incompressible fluid in a
pipeline. When a fluid flows through a throat section, which has smaller cross section area
than in a pipe, the velocity of the fluid through a throat is higher than in the pipe. If velocity
higher, the pressure will drop. By measuring pressure drop, discharge may be calculated.
Beyond the throat, the fluid is decelerated in a pipe of slowly diverging section in order to
recover as much of the kinetic energy as possible. In order to understand the principles of
venturi meter, we must know the principle of Bernoulli’s equation.
Orifice plate
The orifice meter is also used in order to measure the flow rate of a reservoir or through a
pipe. The orifice meter consists of a flat plate with circular hole drilled in it. There is pressure
tap upstream from the orifice plate and another just downstream.
Rotameter
The rotameter is a simple, reliable, inexpensive and easy to install flow meter with low
pressure drop and no electrical connection that gives a direct reading of flow rate for a wide
range of liquids and gases.

OBJECTIVES
To investigate and contrast the operation and characteristics of three different basics
types of flow meter which venture, variable, and orifice including accuracy and
energy loss.
To measure a pressure drop at different segment of device.
To determine a flow rate through a pipe.

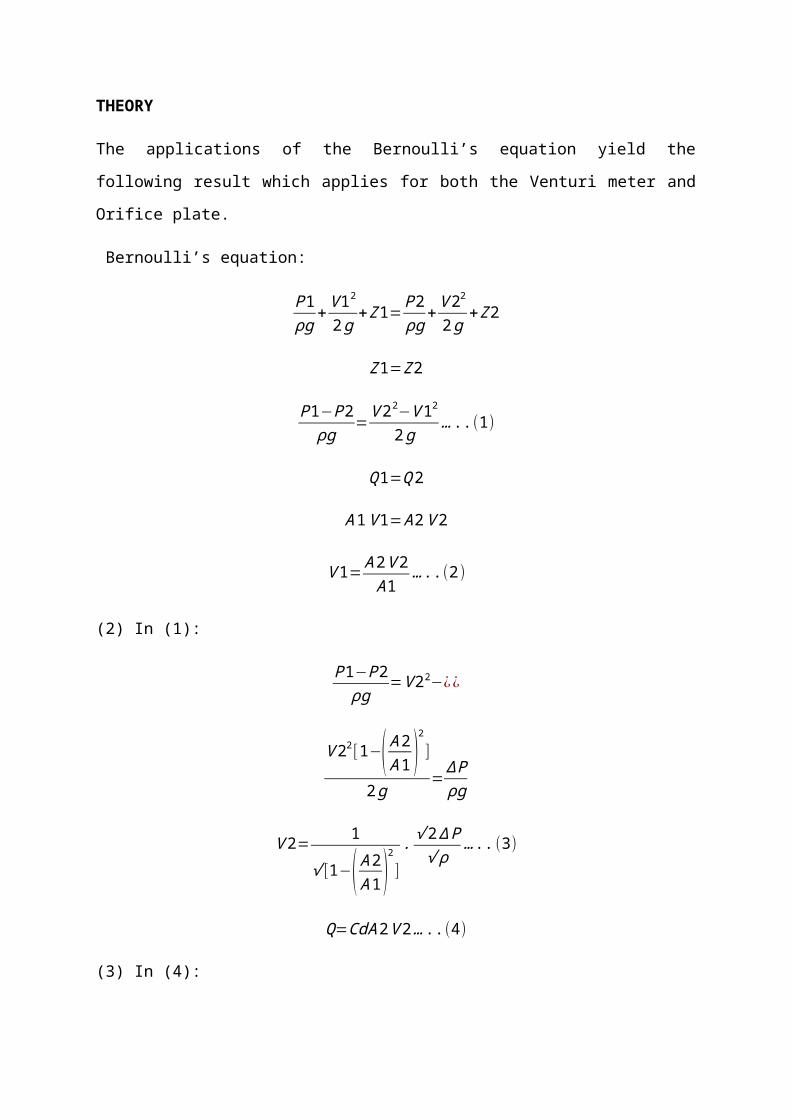
THEORY
The applications of the Bernoulli’s equation yield the following result which applies for both
the Venturi meter and Orifice plate.
Bernoulli’s equation:
P1ρg
+V 12
2 g+Z1=P2
ρg+V 22
2g+Z2
Z1=Z2
P1−P2ρg
=V 22−V 12
2g…..(1)
Q 1=Q2
A1V 1=A2V 2
V 1= A 2V 2A1
… ..(2)
(2) In (1):
P1−P2ρg
=V 22−¿¿
V 22[1−( A2A1 )
2
]
2g=∆Pρg
V 2= 1
√ [1−( A2A1 )
2
]. √2∆ P
√ ρ…..(3)
Q=CdA 2V 2… ..(4)
(3) In (4):
FLOW RATE ,QY= CdA 2
√ [1−( A2A1 )
2
]. √2 ∆P
√ ρ
√2∆ P=√2 g∆h√ ρ
∆h: head difference in meter from the manometer readings for the appropriate meter (m)
g: acceleration due to gravity (m/s2)
Cd: discharge coefficient for meter
A1: area of the test pipe upstream of the meter (m2)
A2: throat area of the meter (m2)
Use of discharge coefficient, Cd is necessary because of the simplifying assumptions
made when applying the Bernoulli’s equations. Values of this coefficient are determined by
experiment.
The energy loss that occurs in a pipe fitting is commonly expressed in term of head
loss and can determine from the manometer readings. For this experiment, head losses will be
compared against the square of the flow rate used. In addition, pressure loss for venturi and
rotameter are low and for orifice meter is medium.
APPARATUS

1. Manometer
2. Discharge Valve
3. Water outlet
4. Venturi meter
5. Staddle Valve
6. Rotameter
7. 90° Elbow
8. Orifice
9. Pump
PROCEDURES
2
1
3
4
9
8
7
5
6

General Start-up Procedures
The Flow meter Measurement Apparatus (Model: FM 101) is designed ready
for use and only requires connection to the Hydraulic Bench (Model: FM 110)
as follows:
a) The apparatus is placed on the top of a suitable hydraulic bench.
b) The apparatus on the bench top is level.
c) The hydraulic coupling is connected the outlet supply of the hydraulic
bench.
d) The discharge of the flow apparatus hose is connected to the collection
tank of the hydraulic bench.
e) The apparatus are ready to start.
Starting up the Apparatus:
1. The flow control valve of hydraulic bench is fully closed and the
discharge valve is fully opened.
2. Ensure that the discharge hose is properly directed to volumetric tank
of fiberglass before starting up system and that volumetric tank drain
valve is left opened to ensure flow discharge back into sump tank.
3. When step (b) is confirmed start up, the pump supply from hydraulic
bench. The bench valve is opened slowly. Then, the water flowing
were seen from hydraulic bench through to the flow apparatus and
discharge through into the volumetric tank of hydraulic bench and next
drained back into sump tank of hydraulic bench.
4. Next, the flow control valve is fully opened. When the flow in the pipe
is steady and there is no trapped bubble, then the bench valve start to
close to reduce the flow to the maximum measurable flow rate.

5. Then, the water level in the manometer board are seen that display the
different level water of heights. (If the water level in the manometer
board is too high where it is out of visible point, the water level is
adjusted by using the staddle valve. With the maximum measurable
flow rate, retain maximum readings on manometer.
6. At this point, slowly reduce the flow by controlling the flow discharge
valve of apparatus: the discharge valve totally closed.
7. The water level in the manometer board began seen to level into a
straight level. This level at the lower or at higher end of the
manometer board range. (Take note that the pump from the hydraulic
bench is at this time, still supplying water at a certain pressure in the
system).
8. Then, also be on the lookout for “Trapped Bubbles” in the glass tube or
plastic transfer tube. This should remove from the system for better
accuracy. Slowly “press the plastic tube to push the bubbles up or
lightly “tab” the glass tube to release the bubbles upwards.
Demonstration of the operation and characteristic of three different basic types
of flowmeter
Procedures:
1. The apparatus was placed on bench. The inlet pipe is connected to bench
supply while the outlet pipe is connected into volumetric tank.
2. The bench valve is fully closed and the discharge valve is fully opened,
then the pump supply was started from hydraulic bench.
3. The bench valve was slowly opened until it was fully opened.
4. When the flow in the pipe is steady and there is no trapped bubble, the
bench valve is started to close to reduce the flow to the maximum
measurable flow rate.

5. The water level in the manometer board was adjusted by using the air
bleed screw. The maximum readings on manometer were retained with the
measurable flow rate.
6. The readings on manometer (A-J), rotameter and measured flow rate were
noted.
7. Step 6 is repeated for different flow rates. The flow rates can be adjusted
by utilizing both bench valve and discharge valve.
8. To demonstrate similar flow rates at different system static pressures, the
bench and flow control valve are adjusted together and manometer level as
required.
Determination of the loss coefficient when fluid flows through a 90 degree elbow
Procedures:
1. The apparatus was placed on bench. The inlet pipe is connected to bench
supply while the outlet pipe is connected into volumetric tank.
2. The bench valve is fully closed and the discharge valve is fully opened,
then the pump supply was started from hydraulic bench.
3. The bench valve was slowly opened until it was fully opened.
4. When the flow in the pipe is steady and there is no trapped bubble, the
bench valve is started to close to reduce the flow to the maximum
measurable flow rate
5. The water level in the manometer board was adjusted by using the air
bleed screw. The maximum readings on manometer were retained with the
measurable flow rate
6. The readings on manometer (I and J) and measured flow rate were noted.
7. Step 6 is repeated for different flow rates. The flow rates were adjusted by
utilizing both bench valve and discharge valve.
8. The tables were completed below.
9. The graph H against
Vs2
2 g for 90 degree elbow was plotted to determine
the coefficient of losses.

General Shut-down Procedures
1. The water supply valve and venturi discharge valve was closed.
2. The water supply pump was turned off.
3. The water from the unit was drained off when not in used.

RESULTS
RotameterFlowrate (L/min)
Manometer Reading(mm)
A B C D E F G H I J5 239 238 229 236 238 240 240 220 228 22710 260 255 221 242 248 253 253 170 203 20115 312 300 232 276 286 295 295 126 190 18920 374 353 231 310 330 348 348 30 154 148
Table 1.1
RotameterFlowrate, Qt(L/min)
Volume(L) Time (s)
Flowrate,Qa
(L/min)
Flowrate Calculated Using
Bernoulli’s Equation, Qt
(L/min)T1 T2 T3 Average Venturi Orifice Venturi Orifice
5 3 30.57 34.01 35.39 33.32 5.4025 5.4025 5.6581 5.145110 3 15.94 15.94 18.28 16.72 10.7643 10.7643 11.1738 10.482015 3 10.59 12.47 12.94 12.00 15.0000 15.0000 16.0032 14.956220 3 7.64 8.44 9.38 8.47 21.2465 21.2465 21.3960 20.5158
Table 1.2
Volume
(L)
Time(s)
Time(min)
Flowrate,Qa
(L/min)
ManometerReading
(mm)
DifferentialPiezometerHead, Δh’
(mm)
V(mm/s)
V ²2g
(mm)
I J Elbow (hi – hj)3 33.32 0.5553 5.4025 228 227 1 3.0012 × 10⁻² 4.5908 × 10⁻⁵
3 16.72 0.2787 10.7643 203 201 2 1.1962 × 10⁻¹ 7.2930 × 10⁻⁴
3 12.00 0.2000 15.0000 190 189 1 8.3333 × 10⁻² 3.5394 × 10⁻⁴
3 8.47 0.1412 21.2465 154 148 6 7.0838 × 10⁻¹ 2.5576 × 10⁻²
Table 1.3

CALCULATIONS
1. Sample Calculations for Actual Flowrate, Qa
Flowrate, Q (L/min) = Volume(L)Time (min)
Rotameter Flowrate, Qt (L/min) Calculations
5
Flowrate, Q (L/min) = 3 L
0.5553min = 5.4025
10
Flowrate, Q (L/min) = 3 L
0.2787min = 10.7643
15
Flowrate, Q (L/min) = 3 L
0.2000min = 15.0000
20
Flowrate, Q (L/min) = 3L
0.1412min = 21.2465

2. Sample Calculation of Area of the Cross Section, A (A, B, C, D, E, F, G and H) Using
Continuity Equation
A1 = πD ²
4
A = Area of the cross section A, B, C, D, E, F, G and H (m²)
D = Diameter of the cross section A, B, C, D, E, F, G and H (m)
Water Head Area
AA1 =
π (0.0260m) ²4
= 5.3093 × 10⁻⁴m²
BA1 =
π (0.0216m) ²4
= 3.6644 × 10⁻⁴m²
CA1 =
π (0.0160m) ²4
= 2.0106 × 10⁻⁴m²
DA1 =
π (0.0200m) ²4
= 3.1416 × 10⁻⁴m²
EA1 = π (0.0220m) ²
4
= 3.8013 × 10⁻⁴m²
FA1 =
π (0.0260m) ²4
= 5.3093 × 10⁻⁴m²
GA1 = π (0.0260m) ²
4
= 5.3093 × 10⁻⁴m²
HA1 = π (0.0160m) ²
4
= 2.0106 × 10⁻⁴m²

3. Sample Calculation of Actual Flowrate for Venturi Meter Using Bernoulli’s and Continuity Equation
Qt = Cd × At × [ 1 - (AtA
) ² ¿−1/2 [2g (Ha – Hc)¿1 /2
Where,
Cd = Coefficient of discharge (0.98)
At = Throat area (16mm)
A = Inlet area (5.3093 × 10⁻⁴m²)
G = 9.81 m/s²
Ha = Manometer reading at A (m)
Hc = Manometer reading at C (m)
Example:
When the flowrate of rotameter is 5 L/min
Qt = 0.98 × 2.0106 × 10−4m² × [1 - ( 2.0106×10⁻⁴m ²5.3093×10⁻⁴m ²
)² ¿−1/2 [2(9.81 m/s²) (0.239 – 0.229)
¿1 /2
= 9.4301 × 10⁻⁵ m³/s
When the flowrate of rotameter is 10 L/min
Qt = 0.98 × 2.0106 × 10−4m² × [1 - ( 2.0106×10⁻⁴m ²5.3093×10⁻⁴m ²
)² ¿−1/2 [2(9.81 m/s²) (0.260 – 0.221)
¿1 /2
= 1.8623 × 10⁻⁴ m³/s
When the flowrate of rotameter is 15 L/min
Qt = 0.98 × 2.0106 × 10−4m² × [1 - ( 2.0106×10⁻⁴m ²5.3093×10⁻⁴m ²
)² ¿−1/2 [2(9.81 m/s²) (0.312 – 0.232)
¿1 /2
= 2.6672 × 10⁻⁴ m³/s
When the flowrate of rotameter is 20 L/min
Qt = 0.98 × 2.0106 × 10−4m² × [1 - ( 2.0106×10⁻⁴m ²5.3093×10⁻⁴m ²
)² ¿−1/2 [2(9.81 m/s²) (0.374 – 0.231)
¿1 /2
= 3.5660 × 10⁻⁴ m³/s

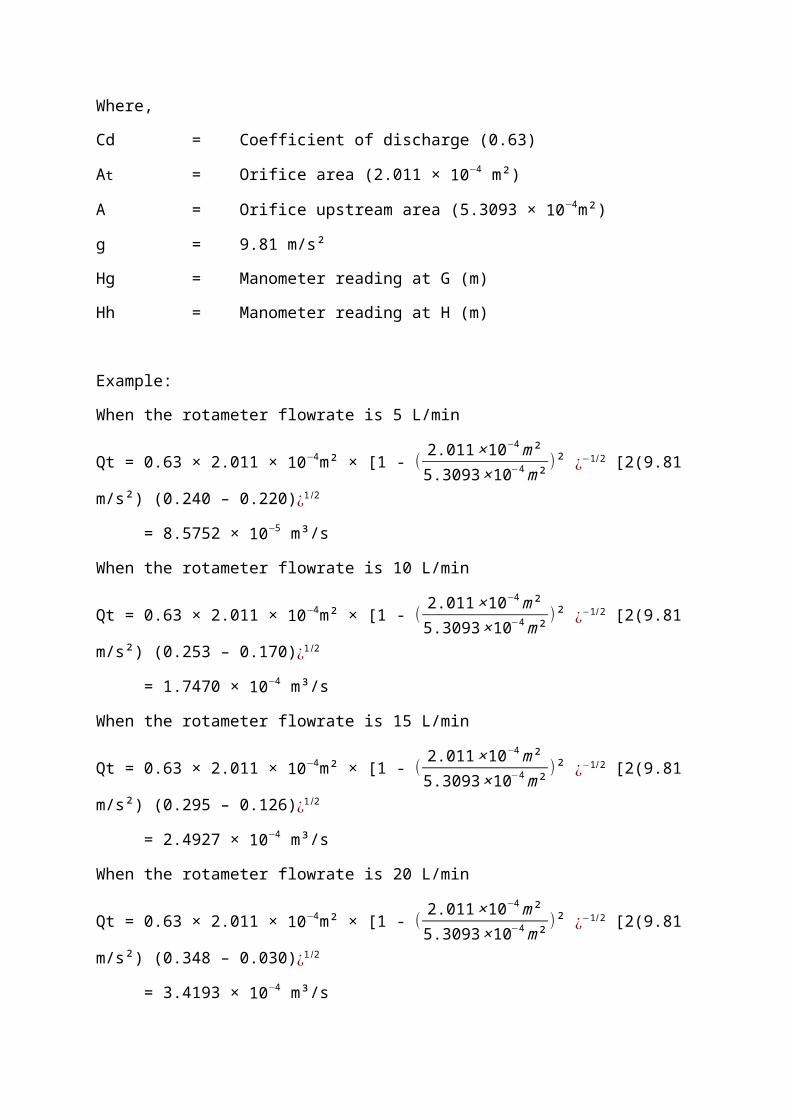
4. Sample Calculation of Actual Flowrate for Orifice Meter Using Bernoulli’s and
Continuity Equation
Qt = Cd × At × [ 1 - (AtA
) ² ¿−1/2 [2g (Hg – Hh)¿1 /2
Where,
Cd = Coefficient of discharge (0.63)
At = Orifice area (2.011 × 10⁻⁴ m²)
A = Orifice upstream area (5.3093 × 10⁻⁴m²)
g = 9.81 m/s²
Hg = Manometer reading at G (m)
Hh = Manometer reading at H (m)
Example:
When the rotameter flowrate is 5 L/min
Qt = 0.63 × 2.011 × 10−4m² × [1 - ( 2.011×10⁻⁴m ²5.3093×10⁻⁴m ²
) ² ¿−1/2 [2(9.81 m/s²) (0.240 – 0.220)¿1 /2
= 8.5752 × 10⁻⁵ m³/s
When the rotameter flowrate is 10 L/min
Qt = 0.63 × 2.011 × 10−4m² × [1 - ( 2.011×10⁻⁴m ²5.3093×10⁻⁴m ²
) ² ¿−1/2 [2(9.81 m/s²) (0.253 – 0.170)¿1 /2
= 1.7470 × 10⁻⁴ m³/s
When the rotameter flowrate is 15 L/min
Qt = 0.63 × 2.011 × 10−4m² × [1 - ( 2.011×10⁻⁴m ²5.3093×10⁻⁴m ²
) ² ¿−1/2 [2(9.81 m/s²) (0.295 – 0.126)¿1 /2
= 2.4927 × 10⁻⁴ m³/s
When the rotameter flowrate is 20 L/min

Qt = 0.63 × 2.011 × 10−4m² × [1 - ( 2.011×10⁻⁴m ²5.3093×10⁻⁴m ²
) ² ¿−1/2 [2(9.81 m/s²) (0.348 – 0.030)¿1 /2
= 3.4193 × 10⁻⁴ m³/s
5. Conversion of the flowrates obtained for Venturi and Orifice Meter from Qt (m³/s)
to Qt (L/min)
Example:
Venturi Meter
a. Qt = 9.4301 × 10⁻⁵ m³/s × (1000 L/1 m³) (60 s/1 min)
= 5.6581 L/min
b. Qt = 1.8623 × 10⁻⁴ m³/s × (1000 L/1 m³) (60 s/1 min)
= 11.1738 L/min
c. Qt = 2.6672 × 10⁻⁴ m³/s × (1000 L/1 m³) (60 s/1 min)
= 16.0032 L/min
d. Qt = 3.5660 × 10⁻⁴ m³/s × (1000 L/1 m³) (60 s/1 min)
= 21.3960 L/min
Orifice Meter
a. Qt = 8.5752 × 10⁻⁵ m³/s × (1000 L/1 m³) (60 s/1 min)
= 5.1451 L/min
b. Qt = 1.7470 × 10⁻⁴ m³/s × (1000 L/1 m³) (60 s/1 min)
= 10.4820 L/min
c. Qt = 2.4927 × 10⁻⁴ m³/s × (1000 L/1 m³) (60 s/1 min)
= 14.9562 L/min
d. Qt = 3.4193 × 10⁻⁴ m³/s × (1000 L/1 m³) (60 s/1 min)
= 20.5158 L/min

6. Sample Calculation for the Velocity of water Flowing through the 90⁰ Elbow
Velocity of Water (m/s) = DifferentialPiezometer Head , Δh' (mm)
Time(s)
Rotameter Flowrate, Qt (L/min) Calculations
5 V = 1mm
33.32 s
= 3.0012 × 10⁻² mm/s
10 V = 2mm
16.72 s
= 1.1962 × 10⁻¹ mm/s
15 V = 1mm
12.00 s
= 8.3333 × 10⁻² mm/s
20 V = 6mm8.47 s
= 7.0838 × 10⁻¹ mm/s
7. Sample Calculation for V ²2g
Rotameter Flowrate, Qt (L/min) Calculations
5V ²2g = (3.0012×10⁻²mm /s) ²
2(9810mm/ s ²)
= 4.5908 × 10⁻⁵mm
10V ²2g = (1.1962×10⁻¹mm/ s) ²
2(9810mm/ s ²)

= 7.2930 × 10⁻⁴mm
15V ²2g = (8.3333×10⁻²mm /s) ²
2(9810mm /s ²)
= 3.5394 × 10⁻⁴mm
20V ²2g = (7.0838×10⁻¹mm /s) ²
2(9810mm /s ²)
= 3.6105 × 10⁻²mm
DISCUSSION
The Flow Meter Demonstration is to demonstrate three different type of flow meter,
Rotameter, Venturi Meter and Orifice Meter. Based on the reading that was taken during the
experiment, the flow rate for all three flow meter can be calculated as well as the head
velocity.
In this experiment, the characteristic and operations of all three Venturi Meter,
Orifice Meter, and Rotameter can be seen. During the experiment, we can determine which
one of the flow meter gives the accurate value based on all the readings that have been
recorded. The value of flow rate of all three flow meter can be determined after the
experiments have been conducted. The results from this experiment give us the average flow
rate for Rotameter is 5.4025 L/min, Venturi Meter is 5.6581 L/min, and 5.1451 L/min for the
Orifice Meter.
Venturi Meter is more accurate than Orifice Meter and Rotameter theoretically. If
the result obtained differ from the theory, there must be some error occurs during the
experiment. One of the major factors that affect the reading is the bubble in pipeline or
manometer tubes. Besides that, if the eye is not perpendicular to the water level, an error
called the parallax error might occur during the reading was taken. More calibration along the
manometer will result in more accurate reading. Venturi Meter is the precise flow meter in
measuring flow rate of any fluid because of it diverge portion which increase the velocity and
reduces the friction loss of fluid that pass through it.
Generally, Orifice Meter which consist of orifice plate inherit the advantages of
being easy and inexpensive to replace, low cost maintenance, but initial installation may be
costly due to special orifice-plate flanges containing pressure taps. However, most important

advantages in Orifice Meter is that it has no moving parts and its differential pressure sensor
can easily being removed and replaced without shutting down the process. Meanwhile, the
advantages of Venturi Meter compared to Orifice Meter are the capacity of Venturi Meter to
handle more flow while imposing less permanent pressure loss on the system and also its
greater accuracy over a wider flow rate range with its ability to be used by fluid containing of
relatively high percentage entailer solids.
RECOMMENDATION
After conducting this experiment, we can say that value of flow rate and the flow rate
% error is different from the theoretical results. From the theory, the most accurate flow
meter is the venturi meter. So, it means that the most efficiency flow meter has a less value of
flow rate % error. In this experiment, the value of flow rate % error for venturi meter is
higher than the orifice meter. For the first recommendation for this experiment is make sure
that there is no bubble in the pipeline. The existence of bubble may cause less accuracy in the
reading of the flow meter. The second is to make sure there is no small particles or
contaminant in the fluid because some of the devices are very sensitive to these particles.
Besides that, during recording the manometer reading, make sure the position of our eyes is
parallel to the level of reading or the miniscus of the fluid level.
REFERENCES
1. Laboratory Manual CGE536, Faculty of Chemical Engineering, UiTM Shah Alam,
Malaysia
2. Fluid Mechanics, Fundamental and Applications, Yunus A. Cengel and John
M.Cimbala, Mc Graw Hill.
3. Engineering Fluid Mechanics, John Roberson & Clayton Crowe, Houghton Mifflin
Co, Chapter 13.
4. Yahoo and Google search engines (keyword: flowmeter, venturi meter, orifice meter)

APPENDICES