Lab 02 Diffusion Osmosis Permeability
18
Name _________________________ Exercise 2: Diffusion, Osmosis and Membrane Permeability Pre- Lab 1. In today's experiment, I predict, on the basis of Fick's law, that the order of the diffusion rates for the substances methylene blue, Alcian blue, ruthenium red, and methyl red (from the fastest to the slowest) will be 2. On the basis of Fick's law, I predict that the order of the diffusion rates for solu- tions of 0.3 mM methylene blue, 1 mM methylene blue, and 3 mM methylene blue (from the fastest to the slowest) will be 3. I predict that when red blood cells are placed in 0.9% NaCl, they will 4. I predict that when red blood cells are placed in deionized water, they will 5. I predict that when red blood cells are placed in 10% NaCl they will 6. What causes diffusion? What determines how rapidly it will proceed? Saturday, January 24, 2009 Page 17 7:05:05 PM
-
Upload
doreliasimona -
Category
Documents
-
view
195 -
download
4
Transcript of Lab 02 Diffusion Osmosis Permeability

Name _________________________
Exercise 2: Diffusion, Osmosis and Membrane Permeability Pre-Lab
1. In today's experiment, I predict, on the basis of Fick's law, that the order of the
diffusion rates for the substances methylene blue, Alcian blue, ruthenium red, and methyl red (from the fastest to the slowest) will be
2. On the basis of Fick's law, I predict that the order of the diffusion rates for solu-
tions of 0.3 mM methylene blue, 1 mM methylene blue, and 3 mM methylene blue (from the fastest to the slowest) will be
3. I predict that when red blood cells are placed in 0.9% NaCl, they will 4. I predict that when red blood cells are placed in deionized water, they will 5. I predict that when red blood cells are placed in 10% NaCl they will 6. What causes diffusion? What determines how rapidly it will proceed?
Saturday, January 24, 2009 Page 17 7:05:05 PM

BIOLOGY 204: INTRODUCTION TO PHYSIOLOGY — LABORATORY MANUAL EXERCISE 2: DIFFUSION, OSMOSIS, & MEMBRANE PERMEABILITY — PRE-LAB
7. Choose the correct answer: At a given temperature, the diffusion rate of large molecules is (greater than / less than) the diffusion rate of small molecules. Explain at the molecular level.
8. Why can we use hemolysis rate as an indication of membrane permeability? 9. Why is a hyperosmotic solution not necessarily hypertonic? 10. Indicate whether each of the solutions below is hypertonic, isotonic, or hypotonic
to mammalian red blood cells: 0.09% NaCl 0.9% NaCl 9% NaCl 11. Indicate whether the intracellular fluid of mammalian red blood cells is
hyperosmotic, isosmotic, or hyposmotic to each of the solutions below. 0.09% NaCl 0.9% NaCl 9% NaCl 12. How might diffusion rates affect the maximum size cells can attain, or, why is the
maximum distance between a cell and the nearest capillary typically no greater than 0.01 mm?
13. Choose the correct answer: A frog living in a freshwater pond is in an environ-
ment that is (hypertonic, isotonic, hypotonic) to the frog's tissues. 14. Assume that you are a health care practitioner who is treating an accident victim.
The patient had lost a good deal of blood, blood pressure is dangerously low, and the patient is going into shock. You decide to administer an intravenous infusion to restore blood volume and blood pressure. Why don't you choose sterile deionized water?
Saturday, January 24, 2009 Page 18 7:05:05 PM
Exercise 2: Diffusion, Osmosis and Membrane Permeability
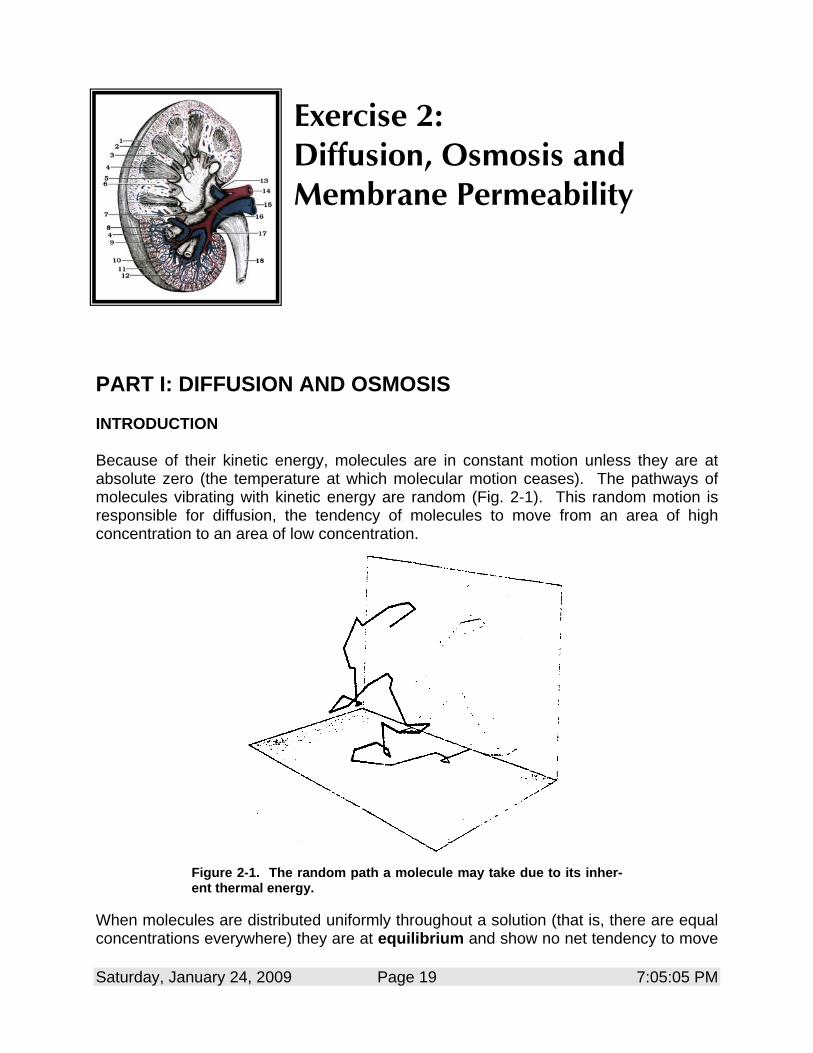
PART I: DIFFUSION AND OSMOSIS INTRODUCTION Because of their kinetic energy, molecules are in constant motion unless they are at absolute zero (the temperature at which molecular motion ceases). The pathways of molecules vibrating with kinetic energy are random (Fig. 2-1). This random motion is responsible for diffusion, the tendency of molecules to move from an area of high concentration to an area of low concentration.
Figure 2-1. The random path a molecule may take due to its inher-ent thermal energy.
When molecules are distributed uniformly throughout a solution (that is, there are equal concentrations everywhere) they are at equilibrium and show no net tendency to move
Saturday, January 24, 2009 Page 19 7:05:05 PM

BIOLOGY 204: INTRODUCTION TO PHYSIOLOGY — LABORATORY MANUAL EXERCISE 2: DIFFUSION, OSMOSIS, AND MEMBRANE PERMEABILITY
preferentially in any direction. However, when concentrations are not the same we say there is a concentration gradient between the two regions, and the molecules will diffuse spontaneously from the region of high concentration to the region of lower concentration until they reach equilibrium. A concentration gradient is defined as the difference in the concentrations of a substance at two separate points divided by the distance between the points, or (c1 – c2)/d, where c1 and c2 are the concentrations at points 1 and 2, and d is the distance between the two points. If a lump of sucrose is placed in a beaker of water (Fig. 2-2A), at first there will be unequal concentrations of sucrose in different parts of the vessel (Fig. 2-2B). Initially, some of the sucrose will dissolve in the water adjacent to it. This will result in a gradient of sucrose in the solution in the beaker (Fig. 2-2B and C). At any given instant, some sucrose will move toward the sides of the beaker, some toward the top, and some toward the bottom. Since the sucrose concentration is initially high near the bottom of the beaker, at first more sucrose molecules will move toward the top of the vessel than toward the bottom. After a while, more molecules will have moved toward the top of the vessel, and the concentration gradient will have diminished. Eventually, the sucrose will be uniformly distributed throughout the solution in the beaker (Fig. 2-2D). When this occurs there are no longer any differences in concentration, and the system will have reached equilibrium.
Figure 2-2. Dissolution of sucrose molecules from a lump of sugar dropped into a beaker of water. In practice, this would take a very long time, for diffusion in unstirred liquid systems tends to be surprisingly slow.
There are two important characteristics of this process that you should remember.
• When a difference in concentration exists diffusion will always occur, unless some barrier, like an impermeable membrane, is placed in the way.
• This molecular movement is passive and spontaneous. No work need be done to cause diffusion to occur. The energy for the movement is contained in the concen-tration difference and does not need to be supplied from the outside.
Saturday, January 24, 2009 Page 20 7:05:05 PM

BIOLOGY 204: INTRODUCTION TO PHYSIOLOGY — LABORATORY MANUAL EXERCISE 2: DIFFUSION, OSMOSIS, AND MEMBRANE PERMEABILITY
The rate of diffusion is affected by molecular weight, concentration gradient, and temperature as follows:
• Compounds with high molecular weights diffuse more slowly than compounds with low molecular weights.
• The greater the concentration gradient, the greater the rate of diffusion.
• The higher the temperature of the system, the greater the rate of diffusion. These and other ideas are summarized in Fick's law of diffusion:
C P AQMW X∆ × ×
=× ∆
where Q = net rate of diffusion ∆C = concentration gradient of substance P = permeability of the substance A = surface area of membrane MW = molecular weight of the substance ∆X = thickness of membrane In the first part of this exercise you will investigate the effects of molecular weight and concentration difference on the diffusion of solute molecules. You will also observe evidence of osmosis, the diffusion of water through a semipermeable membrane. A semipermeable membrane acts as a selective barrier, permitting some substances (in this case, water) to pass through it but not permitting others (in this case, certain solutes) to penetrate. The osmotic pressure of a solution is the opposing hydrostatic force developed by the difference in water concentration between two solutions. Although the diffusion of water is denoted by the special name osmosis, this process is simply a result of the tendency of molecules to move from a region of higher concentra-tion to a region of lower concentration. Osmosis is a type of diffusion that occurs when something prevents solute molecules from diffusing freely, even though their concentra-tions differ. For example, a membrane impermeable to solutes will prevent them from moving from a region of high concentration to a region of lower concentration. However, if water can move freely through the membrane, it moves into the compart-ment having the greatest concentration of solute (and lowest concentration of water). When solute concentrations differ, so do water concentrations; where solute concentra-tion is low, water concentration is high and vice versa. Water will diffuse from a region where its concentration is high (low solute concentration) to one where its concentration is low (high solute concentration). This movement of water decreases the difference between concentrations on the two sides of the membrane, both in terms of solute and solvent. If there were no opposing forces, the water would freely diffuse until the concentrated solution had expanded in volume and the dilute solution had shrunk in volume enough so that the concentration of solute (and water) on both sides of the membrane would be the same. But there are always opposing forces…
Saturday, January 24, 2009 Page 21 7:05:05 PM

BIOLOGY 204: INTRODUCTION TO PHYSIOLOGY — LABORATORY MANUAL EXERCISE 2: DIFFUSION, OSMOSIS, AND MEMBRANE PERMEABILITY
Let us look at an illustrative example in Fig. 2-3. Here we imagine a beaker containing 100 mL of water divided into two compartments by a semipermeable membrane. If 6 g of a solute to which the membrane is not permeable are added to compartment 1 and 4 g of the same solute are added to compartment 2, the concentration of solute will now be higher in 1 (which has 6 g in 50 mL) than in 2 (which has 4 g in 50 mL). Conse-quently, the concentration of water will be higher in side 2 than in side 1, and water will move by osmosis from 2 to 1 (Fig. 2-3A). But here's where the opposing force comes in. As the volume in compartment 1 increases due to osmosis, its level rises (Fig. 2-3B). This results in more hydrostatic pressure in compartment 1 than in compartment 2, and this opposes the osmotic flow of water from compartment 2 to compartment 1 by physically pushing the water back from compartment 1 to compartment 2. At equilib-rium, the hydrostatic pressure in compartment 1 is equal and opposite to the osmotic pressure created by the difference in water concentration between the two compart-ments, and there is no net flow of water through the membrane, in spite of the fact that the two compartments still have different solute concentrations. Thus at equilibrium the hydrostatic pressure is a means of measuring the osmotic pressure, and osmotic pres-sure is reported in units of hydrostatic pressure. The simplest way to do this is to this is to realize that the hydrostatic pressure difference is directly proportional to the differ-ence in height between the two solutions at equilibrium and to report the pressure in units of "cm of water pressure."
Figure 2-3. Effect of solute concentration on water distribution when a membrane is permeable to solvent but not to solute. At equilibrium, the difference in hydrostatic pressure between compart-
Saturday, January 24, 2009 Page 22 7:05:05 PM

BIOLOGY 204: INTRODUCTION TO PHYSIOLOGY — LABORATORY MANUAL EXERCISE 2: DIFFUSION, OSMOSIS, AND MEMBRANE PERMEABILITY
ments 1 and 2 is equal and opposite to the osmotic pressure brought about by the difference in solute and solvent concentrations.
Diffusion and osmosis are important processes in the body. Some (but not all) mole-cules are transferred from the environment into the blood (for instance, in the intestine) or from blood into the environment (as in the lungs) by diffusion. In addition, diffusion causes the movement of some molecules from the blood into a cell or from a cell into the blood. This transfer of molecules is very effective over extremely short distances (a fraction of a millimeter or less). However, over longer distances (e.g., centimeters) diffusion is too slow to deliver much material. Osmosis is responsible for the absorption of much water from the intestine and in the kidney (which would otherwise produce urine at an embarrassing rate!). On the other hand, if the concentration of blood proteins decreases (for instance, as a result of liver or kidney disease or severe malnutrition) the osmotic pressure of the blood decreases, and the result is the movement of water out of the blood and accumulation of fluid in the tissues (edema). If the concentration of solute molecules surrounding a cell is greater than the fluid inside the cell, the external fluid is said to be hyperosmotic to the cell. If the solute concen-tration in the external solution is lower than the concentration of solutes inside the cell, the cell is in a hyposmotic solution. If solute concentration is the same inside and outside of the cell, the cell is in an isosmotic solution. The concentration of solutes in red blood cells (erythrocytes) is osmotically equivalent to that of a 0.9% NaCl solution; consequently, a 0.9% NaCl solution would be isosmotic to red blood cells. (This infor-mation will be useful to you when you formulate predictions for the experiments you will do in this exercise.) Note that when comparing osmotic pressures, it is impor-tant to be clear about the point of reference. For instance, if a cell is in a hyperos-motic solution, that is, the external solution is hyperosmotic to the cell, then the cell must be hyposmotic to the solution. Note also that osmotic pressure is a function of the concentration of particles in solution, without regard to chemical identity, charge or molecular mass. Thus a 2 M solution of glucose (Mr = 180) is osmotically equivalent to a 2 M solution of sucrose (Mr = 342), to a solution that is 1 M in both glucose and sucrose, and also to a 1 M solution of NaCl (Mf = 58). Solutions can be said to have osmolarity, the number of moles of particles of solute per liter, without regard to chemical identity or charge. Osmolarity is measured in units of OsM, mOsM, etc. Three additional terms describe the effects of solutions on cell volume. If a cell shrinks when it is placed in a solution, the solution is hypertonic to the cell, and if there is no change in cell volume, the surrounding solution is isotonic. If a cell swells (and perhaps bursts) in a solution, then the solution is hypotonic to the cell. Although these three terms are often used synonymously with hyperosmotic, isosmotic, and hyp-osmotic, they are technically not interchangeable. As you will see, the effect of the concentration of extracellular solutes on a cell's volume depends on whether or not the cell membrane is permeable to the solutes in question. For example, a hyperosmotic solution of a solute that can penetrate the cell membrane might not make the cell shrivel, since the solute can quickly pass through the membrane and establish equal
Saturday, January 24, 2009 Page 23 7:05:05 PM

BIOLOGY 204: INTRODUCTION TO PHYSIOLOGY — LABORATORY MANUAL EXERCISE 2: DIFFUSION, OSMOSIS, AND MEMBRANE PERMEABILITY
concentrations on both sides. In fact, since the cell has a high concentration of proteins within the cell that cannot pass through the membrane, the cell may actually swell with solvent under these conditions. This is why it is necessary to have two separate sets of terms, one to compare osmotic pressures inside and outside the cell and one to describe a solution's effect on cells. When red blood cells are placed in a hypotonic solution, the bursting of cells that results is termed hemolysis. A suspension of intact red blood cells will scatter light passing through it; however, erythrocytes placed in a hypotonic solution will swell and burst and will, therefore, fail to scatter light, since the released hemoglobin forms a clear solution. No image of letters is formed on your retina when you view newsprint through a suspension of intact red blood cells, but a clear image appears when newsprint is examined through a suspension in which hemolysis has taken place. You will take advantage of this fact to determine whether or not test solutions are hypotonic to red blood cells. PROCEDURE: EFFECT OF MOLECULAR MASS ON RATE OF DIFFUSION 1. In this exercise you will use solutions of four different compounds at the same
concentration (1 mM). All of these compounds are brightly colored. This makes it possible to follow the progress of the molecules as they diffuse in a translucent medium. The four compounds are methyl red (269 g mol–1), methylene blue (374 g mol–1), ruthenium red (786 g mol–1), and alcian blue (1,300 g mol–1).
2. Obtain four test tubes, each containing 15 mL of agarose, a polysaccharide that forms a gel in aqueous media. This is essentially a column of water, stabilized by the agarose to prevent mixing and convection. Add 5 mL of one of the dye solutions to the top of each agarose column. Note that the interface between the colored solution and the agarose is sharp; no mixing occurs. Mark the interface with a piece of tape or a marker.
3. Record the time (T0) in Table 2-1. Observe that the dye molecules begin to move into the agarose as time passes.
4. At the end of the lab period measure the distance in mm between the top of the agarose and the farthest point at which you can see the color. Record both the distance and the time (T1) of your observation (Table 2-1).
5. Repeat the measurement 6 to 12 hr after the end of your laboratory period (T2) and then once each day for three more days (T3, T4, T5). Record your observa-tions in Table 2-1.
Saturday, January 24, 2009 Page 24 7:05:05 PM

BIOLOGY 204: INTRODUCTION TO PHYSIOLOGY — LABORATORY MANUAL EXERCISE 2: DIFFUSION, OSMOSIS, AND MEMBRANE PERMEABILITY
TABLE 2-1. EFFECT OF MOLECULAR MASS ON RATE OF DIFFUSION
Methyl Red (269 g mol–1)
Methylene Blue (374 g mol–1)
Ruthenium Red (786 g mol–1)
Alcian Blue (1,300 g mol–1)
Obser-vation Num-ber
Date and Time
Hours Elapsed
Migra-tion of Dye (mm)
Date and Time
Hours Elapsed
Migra-tion of Dye (mm)
Date and Time
Hours Elapsed
Migra-tion of Dye (mm)
Date and Time
Hours Elapsed
Migra-tion of Dye (mm)
0 1 2 3 4 5
ANALYSIS: EFFECT OF MOLECULAR MASS ON RATE OF DIFFUSION If the other variables, such as concentration and temperature, have been successfully held equal, your results in Table 2-1 would be expected to show how molecular size affects diffusion. Prepare a graph showing the effect of molecular mass on diffusion rate, either hand-drawn (boring!) or using spreadsheet software such as Excel® or SigmaPlot®. Time is your independent variable, so graph it on the abscissa (X-axis), using hours as your unit of measurement, and graph migration distance, your depend-ent variable, on the ordinate (Y-axis), using mm as your unit of measurement. Your graph should include four lines, one for each of the dyes. Distinguish the four lines, either by using different colors, different kinds of lines, or different symbols, or some combination thereof. Include a legend that explains what the different colors, lines, or symbols represent. Is the rate of diffusion (the slope of your lines) constant during your observation period, or does it slow down? The concentration gradient is sharpest at T0; it is here that you would expect to get your maximum rate of diffusion. Draw tangents to your curves at T0, and calculate their slopes: these are the initial rates of diffusion at T0 in mm day–1. Make a new graph of initial rates of diffusion as a function of the molecular masses of the four dyes. What is the relationship? Is Fick's law obeyed? How long would it take each of your dyes to diffuse 1 cm?
Saturday, January 24, 2009 Page 25 7:05:05 PM

BIOLOGY 204: INTRODUCTION TO PHYSIOLOGY — LABORATORY MANUAL EXERCISE 2: DIFFUSION, OSMOSIS, AND MEMBRANE PERMEABILITY
PROCEDURE: EFFECT OF CONCENTRATION GRADIENT ON RATE OF DIFFUSION You will compare the diffusion rates of three solutions of methylene blue at different concentrations (0.3 mM, 1 mM, and 3 mM). 1. Obtain three test tubes containing agarose. 2. Add the different methylene blue solutions to the top of the agarose column. 3. Make the same measurements as you made in the previous section, and record
your observations in Table 2-2. TABLE 2-2: EFFECT OF CONCENTRATION GRADIENT ON RATE OF DIFFUSION
Methylene Blue (0.3 mM)
Methylene Blue (1 mM)
Methylene Blue (3 mM)
Observa-tion Num-ber
Date and Time
Hours Elapsed
Migration of Dye (mm)
Date and Time
Hours Elapsed
Migration of Dye (mm)
Date and Time
Hours Elapsed
Migration of Dye (mm)
0 1 2 3 4 5
ANALYSIS: EFFECT OF CONCENTRATION GRADIENT ON RATE OF DIFFUSION Make a pair of graphs similar to the ones you made in the previous part. The first will of course only have three lines, since there are only three concentrations of methylene blue. Take slopes at T0 again, and plot their values (initial rates) as a function of concentration of dye in mM. What is the relationship? Is Fick's law obeyed? PROCEDURE: OSMOSIS 1. Obtain a whole blood sample and dilute 20 drops of blood into 10 mL of isotonic
saline (0.9% NaCl). This is your stock erythrocyte suspension and it is turbid because the cells scatter light. If you place a piece of paper with typed words behind the erythrocyte suspension you cannot distinguish any letters. However, with time the cells will settle to the bottom of the tube, so you need to keep the stock erythrocyte suspension gently mixed. If the cells gain water they will swell and rupture. There will be no cells to scatter the light and the solution will become transparent.
Saturday, January 24, 2009 Page 26 7:05:05 PM

BIOLOGY 204: INTRODUCTION TO PHYSIOLOGY — LABORATORY MANUAL EXERCISE 2: DIFFUSION, OSMOSIS, AND MEMBRANE PERMEABILITY
2. Get three 10 x 100-mm test tubes and add 2 mL of deionized water, 0.9% saline, or 10% saline to each. Label the tubes.
3. Add 3 drops of stock erythrocyte suspension and mix. 4. In Table 2-3 describe the turbidity of the three solutions. 5. Place a few drops of each solution on a microscope slide and note the appear-
ance of the cells. You might want to check the appearance of your stock solution for comparison. Identify which solutions were isotonic, hypertonic or hypotonic.
TABLE 2-3: OSMOSIS (RESULTS) Three drops stock
erythrocyte suspension in 2
mL of
Appearance of suspension
Microscopic appearance of
cells
Tonicity of solution
Deionized water
0.9% Saline
10% Saline
PART II: MEMBRANE PERMEABILITY INTRODUCTION The passive movement of materials across cell membranes is the result of a) the permeability of the membrane to the diffusing substance and b) the driving force. For uncharged compounds, the driving force is a concentration gradient between the inside and the outside of the cell. In the case of ionic diffusion, the driving force results from the concentration gradient and the electrical potential difference between the cell's inte-rior and its exterior. In general, biological membranes are far less permeable than an equivalent thickness of solvent, and they are completely impermeable to many compounds. Membrane perme-ability, active transport, and driving force determine the rate of movement of nutrients into and waste compounds out of the cell. The penetration rate of a cell membrane by a molecular species via diffusion is important in determining the chemical composition of the cell. A substance to which the membrane is impermeable will not be found in the cytoplasm unless it is produced there or actively transported into the cytoplasm. In this exercise, we will investigate the effects of lipid solubility and molecular weight on the permeability of red blood cell membranes. The structure of a cell membrane is shown in Fig. 2-4. This representation is referred to as the fluid mosaic model, because the membrane is a mosaic of phospholipids and proteins, and, in many cases, these constituents are free to move within the membrane.
Saturday, January 24, 2009 Page 27 7:05:05 PM

BIOLOGY 204: INTRODUCTION TO PHYSIOLOGY — LABORATORY MANUAL EXERCISE 2: DIFFUSION, OSMOSIS, AND MEMBRANE PERMEABILITY
Figure 2-4. Fluid mosaic model of a cell membrane composed of a lipid bilayer with proteins "floating" in the membrane. The nonpolar hydrophobic portion of each phospholipid molecule is directed toward the center of the membrane, and the polar hydrophilic portion is directed toward the water environment either outside or inside the cell. Intrinsic proteins partially or fully penetrate the membrane and may serve as transport or receptor molecules.
The cell membrane is a thin membrane of phospholipids studded with proteins. Phos-pholipids consist of two fatty acid chains and one polar, charged, phosphate group attached to a glycerol backbone (Fig. 2-5). When they are surrounded by water mole-cules, the hydrophilic (meaning "water-loving") ends of the phospholipid molecules face outward toward the water, while the hydrophobic (water-avoiding) hydrocarbon chains point away from the water. In the membranes of cells and organelles, this results in two layers of phospholipids, called a lipid bilayer. The hydrocarbon interior of the membrane constitutes a barrier to penetration of polar solutes, such as amino acids, sugars, and ions.
Saturday, January 24, 2009 Page 28 7:05:05 PM

BIOLOGY 204: INTRODUCTION TO PHYSIOLOGY — LABORATORY MANUAL EXERCISE 2: DIFFUSION, OSMOSIS, AND MEMBRANE PERMEABILITY
Figure 2-5. Phospholipids, composed of two fatty acid chains, glycerol, phosphoric acid, and an alcohol such as choline, all covalently joined, are usually oriented so that the polar portion extends towards one end of the molecule and the two fatty acid chains towards the opposite, so they are often represented diagrammatically as a polar ball with a nonpolar tail.
The mechanism by which a solute in the extracellular fluid enters a cell depends on the polarity of the solute. Nonpolar solutes pass directly through the membrane's lipid matrix. Therefore, within a group of chemically related, nonpolar compounds, those with high lipid solubility will enter the cell more readily than those with low lipid solubility. Most of the substances a cell comes in contact with have charged groups, and they are water-soluble. Therefore, they cannot pass through the lipid portions of membranes. These polar solutes must take specific avenues through lipid membranes. Molecules of low lipid solubility can pass through pores in the lipid membrane if they are small. On the other hand, large molecules of low lipid solubility will be excluded. Some solutes that are not lipid soluble can penetrate the cell membrane with the aid of proteins in the membrane. The simplest way for a polar solute to cross a cell membrane is by way of pores, or channels. A channel is a tube through a membrane formed by one or more intrinsic membrane proteins. On the outside of the tube, facing the phospholipids are many hydrophobic groups. The inside of the tube is lined with hydrophilic groups, allowing the channel to be filled with water. Thus, polar solutes can diffuse through the membrane in aqueous solution. A more complicated mechanism by which polar solutes enter cells involves membrane carriers, which undergo a cycle of binding and conformational change as solutes move across the membrane. To summarize, although the permeability of membranes is highly variable among organisms, two generalizations seem to be valid for all cells:
• For chemically related water-soluble compounds, the rate of diffusion across cell membranes decreases as molecular size increases (that is, small molecules enter the cell faster than large molecules).
Saturday, January 24, 2009 Page 29 7:05:05 PM
BIOLOGY 204: INTRODUCTION TO PHYSIOLOGY — LABORATORY MANUAL EXERCISE 2: DIFFUSION, OSMOSIS, AND MEMBRANE PERMEABILITY
• For chemically related, nonpolar compounds, the rate of diffusion across cell membranes increases with increasing lipid solubility and is (more or less) independ-ent of molecular size.
Because cell membranes are selectively permeable, we need to distinguish between the osmotic pressure of a solution and its effect on cells. Imagine that a cell is placed a solution having a total solute concentration equivalent to the concentration of solutes within the cell. The cell is therefore in an isosmotic solution. However, if the solute molecules in the external solution are not found inside the cell, or are found in lower concentrations, the effect of solute molecules in the solution surrounding a cell will depend on whether or not the membrane is permeable to them. If the membrane is not permeable to solute, there will be no net movement of water into or out of the cell. Thus the solution is isotonic with respect to the cell. However, if the solute can cross the membrane, it will enter the cell, because of the higher concentration of solute outside the cell. When solute enters, the osmotic pressure inside the cell increases, and water enters the cell. This influx of water causes the cell to swell, and it may burst. In this case the solution is hypotonic with regard to the cell, even though the solution is isos-motic. One of the best known preparations for studying membrane permeability is the mammalian erythrocyte. In Part I you saw that hemolysis occurs when red blood cells are placed in deionized water. For the reasons given in the preceding paragraph, hemolysis can also take place when a solute in the extracellular solution moves down its concentration gradient and enters a cell, increasing the internal osmotic pressure. When hemolysis occurs, the internal solutes, including hemoglobin, escape. This is the basis of our method for following the diffusion of solutes from the external bathing medium, into the cell. Recall that a suspension of blood cells (in plasma or in physio-logical saline) scatters light. A sharp image of a small object viewed through the suspension cannot be formed. Consequently, a thread or a piece of newsprint viewed through a suspension of blood cells will appear faint and fuzzy; it may not be seen at all if the suspension is dense. However, when the cells hemolyze, the solution becomes translucent and a sharp image can be seen. The faster a solute diffuses into the cell, the sooner it will hemolyze. Thus, the time taken for the solution to clear gives us a measure of membrane permeability to the solute in question, providing that the driving force remains the same. We will take advantage of this process to compare the permeability of the erythrocyte membrane to different solutes and water. We will record hemolysis time and calculate the hemolysis rate. To measure hemolysis time it is simply necessary to measure in seconds the time it takes for the cells to rupture and for the suspension to become transparent. Hemolysis rate is defined to be the reciprocal of the hemolysis time, so divide the hemolysis time into 1 to obtain the rate in units of sec–1. First you will determine what molarity of NaCl is isosmotic to erythrocytes. Then you will use compounds that have been prepared in isosmotic solutions (that is, the solutions have the same osmotic pressure as the cell interior), but each of the compounds have
Saturday, January 24, 2009 Page 30 7:05:05 PM

BIOLOGY 204: INTRODUCTION TO PHYSIOLOGY — LABORATORY MANUAL EXERCISE 2: DIFFUSION, OSMOSIS, AND MEMBRANE PERMEABILITY
different molecular weights and lipid solubilities. You will investigate how these two characteristics alter hemolysis time and rate. Before beginning the experiments that follow, be sure you understand why hemolysis time can be used as an indicator of membrane permeability and how solutes in an isosmotic solution can cause hemolysis to occur. You also should be aware that although erythrocytes are the cells of choice for this type of demonstration, they are unusual in some regards. The cells are shaped as bicon-cave discs (doughnuts of sorts with a thin section where the hole would be) (a bialy, for those of you who know from bialys). This shape gives them flexibility—the portion of the membrane that usually dips in the center can also flex out. Therefore these cells can stretch a certain amount. Solutions that are somewhat hyposmotic but not too hyposmotic can cause water to enter the cell and cause it to balloon out but not break. Keep this in mind during your experimental work. PROCEDURE: PERMEABILITY TO WATER 1. Your hemolysis apparatus will consist of a test tube rack placed in good light and
either a string or a piece of paper with writing that will come into sharp focus as lysis occurs.
2. Before you begin these experiments it is worthwhile to practice measuring hemolysis time using the stock erythrocyte solution from the previous experi-ment. Add 2 mL of deionized water to a test tube. Add 3 drops of stock erythro-cyte solution, note the time and mix. The solution will become transparent in a few seconds (record the hemolysis time in Table 2-4 and calculate the rate). Repeat the entire procedure until you are comfortable with your ability to accu-rately measure hemolysis time. This procedure is best done with a stopwatch, if you have one.
3. 0.05 M, 0.06 M, 0.07 M, 0.08 M, 0.09 M, and 0.10 M NaCl solutions will be avail-able. To each tube in the hemolysis apparatus add 2 mL of one of the NaCl solutions.
4. Noting the exact time of addition, add three drops of your well-mixed stock blood suspension to the first tube, mix rapidly, and check the solution for clarity. Record the time (in seconds) at which the solution clears. The time elapsed is the hemolysis time. Expect to see changes within seconds. Repeat two times and report the average of the three hemolysis times, and calculate the rate.
5. Repeat with each of the other tubes. Do no wait for more than a minute; if hemolysis has not occurred within that time, it probably won't occur at all. A hemolysis time of 60 seconds thus becomes a minimal estimate of the hemolysis time, and 1/60 sec–1 a maximal estimate of the hemolysis rate for such a sample.
Saturday, January 24, 2009 Page 31 7:05:05 PM

BIOLOGY 204: INTRODUCTION TO PHYSIOLOGY — LABORATORY MANUAL EXERCISE 2: DIFFUSION, OSMOSIS, AND MEMBRANE PERMEABILITY
TABLE 2-4: PERMEABILITY TO WATER (RESULTS) Concentration of
NaCl solution Hemolysis time
(sec) Average
hemolysis time (sec)
Hemolysis rate (sec–1)
0.00 M
0.05 M
0.10 M
0.15 M
0.20 M
ANALYSIS: PERMEABILITY TO WATER At what concentration do the NaCl solutions appear to become isotonic, i.e., at what concentration does the hemolysis time first become >120 seconds? What is the molarity of the famous 0.9% NaCl physiological saline solution? Does this agree with your results? PROCEDURE: PERMEABILITY TO VARIOUS ALCOHOLS 1. Obtain a whole blood sample and dilute 20 drops to 10 mL 0.9% NaCl. This is
your stock erythrocyte solution. As you know, it is turbid because the cells scat-ter light. Because the cells tend to settle to the bottom of the tube it is necessary to mix the stock before removing any material.
2. You will now repeat the previous protocol with several alcohol solutions that are 0.3 M in alcohol and 0.02 M in NaCl. These alcohol solutions have the same initial solute and water concentration as mammalian cytoplasm but the alcohols are not normally present in the cytoplasm of normal cells. Thus the solutions are
Saturday, January 24, 2009 Page 32 7:05:05 PM

BIOLOGY 204: INTRODUCTION TO PHYSIOLOGY — LABORATORY MANUAL EXERCISE 2: DIFFUSION, OSMOSIS, AND MEMBRANE PERMEABILITY
isosmotic with cells. For each of the alcohols (methanol, ethanol, propanol and butanol) perform the following in triplicate. Add 2 mL of each alcohol solution to separate 10 x 100-mm test tubes and label the tubes. Noting the exact time of addition, add three drops of your well-mixed stock blood suspension to the first tube, mix rapidly, and check the solution for clarity. Record the time (in seconds) at which the solution clears. The time elapsed is the hemolysis time. Repeat two times and report the average of the three hemolysis times in Table 2-5 and calculate the rates of hemolysis.
TABLE 2-5: PERMEABILITY TO VARIOUS ALCOHOLS (RESULTS)
Alcohol Hemolysis time (sec)
Average hemolysis time
(sec)
Hemolysis rate (sec–1)
Methanol
Ethanol
Propanol
Butanol
ANALYSIS: PERMEABILITY TO VARIOUS ALCOHOLS TABLE 2-6: PROPERTIES OF THE FOUR ALCOHOLS
Alcohol Molecular mass Structure Lipid solubility
Methanol 32 OH 80
Ethanol 46 OH 350
n-Propanol 60 OH
1,000
n-Butanol 74 OH 6,000
According to Fick's law, the rate of diffusion of these alcohols across the erythrocyte membrane should be directly proportional to the concentration gradient of the alcohol (constant in this experiment), the permeability of the alcohol (a variable in this experi-
Saturday, January 24, 2009 Page 33 7:05:05 PM

BIOLOGY 204: INTRODUCTION TO PHYSIOLOGY — LABORATORY MANUAL EXERCISE 2: DIFFUSION, OSMOSIS, AND MEMBRANE PERMEABILITY
ment), and the surface area of membrane (constant in this experiment). The rate is inversely proportional to the molecular mass of the substance (a variable in this experi-ment) and the thickness of the membrane (a constant in this experiment). To sort out the effects of two variables, one can plot the rate of diffusion (rate of hemolysis) against the molecular masses of the four alcohols. If the permeabilities of the four alcohols are all the same, you should see a steadily decreasing curve, something like what you saw in Part I. If you see something different, the permeabilities are exerting an effect. Make the plot. Do your results support the hypothesis that the permeabilities of these alcohols are function of their lipid solubilities?
Saturday, January 24, 2009 Page 34 7:05:05 PM