Coaching Youth Sports · PDF file2 Coaching Youth Sports Table of Contents CHAPTER 1: INTRODUCTION

LA84 Foundation Youth Sports Survey: Los Angeles County, 2016
©2016 LA84 Foundation 1

LA84 Foundation Youth Sports Survey: Los Angeles County, 2016
©2016 LA84 Foundation 2
TableofContents
SamplingMethodology–SurveySamplingInternational..........................................................................3
Methodology(cont.)................................................................................................................................4
ExecutiveSummary.....................................................................................................................................5
SportsParticipationTrends.........................................................................................................................7
FutureSportsParticipationInterest.........................................................................................................10
Inactivity*AmongLACountyYouth.........................................................................................................12
SportsParticipationRates&Profiles........................................................................................................14
Media.........................................................................................................................................................53
P.E./PhysicalActivityClasses....................................................................................................................54
SpecialNeedsChildren..............................................................................................................................57
HouseholdAdults:PhysicalFitnessStatus................................................................................................59
YouthProfile..............................................................................................................................................60
Respondent(Adult)Profile........................................................................................................................62

LA84 Foundation Youth Sports Survey: Los Angeles County, 2016
©2016 LA84 Foundation 3
SamplingMethodology–SurveySamplingInternational§ Thisprojectwascarriedoutusingacceptedmarketresearchtechniques.A
representativesampleofLosAngelesCountywascreatedsoresultscouldbeprojected.ThesamplesforthisstudywerecreatedbySurveySamplingInternational.
§ Allsurveysaresubjecttosomemarginoferror—thatis,thedegreetowhichtheresultsmightdifferfromthoseobtainedbyacompletecensusofeverypersonintheLAcountyarea.Forthissurvey,withasampleof957children,thereisanaverageconfidenceintervalofplusorminus2.96percentagepointsatthe95percentconfidencelevel.Forexample,ifthesurveyresultsshow30%oftherespondents,wecanbeconfident95timesoutof100thatthe“real”valueisbetween27.04%and32.96%
AboutSurveySamplingInternational
§ ForthisstudyweusedSurveySamplingInternational(SSI),aworldleaderinsamplecreationandprovision.Theyprovidesamplesforover2,500clientseachyear.
§ ProprietaryPanel:SSIpanelsarecomposedofsourcesthatareover90%proprietary,whichmeansthey’reconstantlyprotecting,growing,andoptimizingthem.Theyactivelymanageandlooktoimprovetherespondentexperiencetohavemoreloyalandengagedpanelmembers.
§ HighQuality:SSIsamplehasbeencitedforthehighestlevelofconsistencyandqualityinmoremarketsaroundtheworldthananyoneelse,asshownintheGrandMean™Project,theworld’slargestindependentassessmentofonlinesampling.
§ SSI’ssamplingprocesseshavebeensuccessfullyauditedeveryyearsince1998byErnst&Young.TheauditsareperformedaspartoftheannualMediaRatingsCouncilauditofsyndicatedratingsproducedbyArbitronInc.andScarboroughResearch.
§ SSIadherestoESOMARstandards
§ Surveyqualitycontrolmethodsincludedigitalfingerprinting,identifying“speedsters,”“straightliners,”andrewardclaimauthentication.

LA84 Foundation Youth Sports Survey: Los Angeles County, 2016
©2016 LA84 Foundation 4
Methodology(cont.)
§ Quotas:200screenedhouseholdspereachofthefiveLosAngelesCountyRegions
§ Interviewswerecompletedonlywithhouseholdswithchildrenage6-17
§ RegionsofLACountyweresetaccordingtotheirServicePlanningArea(SPA):
Region SPA
East 3,7
West 5,8(part)
Metro 4
South 6,8(part)
North 1,2
§ Originaltargetscreenedhouseholdinterviews:1000
– Actualhouseholdsscreened:1466
– Totalhouseholdswithkids6-17:600
– Totalkidsaged6to17:957
– TotalHispanichouseholdswithkids:126
– TotalHispanickidsaged6to17:211
– TotalhouseholdinterviewsinSpanish(withkids):43completes
§ Throughouttheanalysis,aweightingtechniquewasusedinorderforthedatatobetterrepresenttheLosAngelesCountyPopulationof10,069,036people(2014estimate—LosAngelesCountyDepartmentofHealth).
§ ProjectedparticipantsforeachsportwerederivedfromNielsencensusestimatesfor2016;visithttp://www.nielsen.com/content/dam/nielsen/en_us/documents/pdf/Fact%20Sheets%20II/Nielsen%20Demographic%20Data%20Overview.pdfformoreinformation.
§ NationalsportparticipationratecomparisonsaresourcedfromthePhysicalActivityCouncil,thenation’sdefinitivesourceforsportsparticipationdata.Visithttp://www.physicalactivitycouncil.com/formoreinformation.

LA84 Foundation Youth Sports Survey: Los Angeles County, 2016
©2016 LA84 Foundation 5
ExecutiveSummary
PARTICIPATION
§ Outdoorsoccerhasthehighestparticipationrateamongyouthages6-17inLosAngelesCounty,with29%ofchildrenhavingplayedinthepast12months.Swimming(27%),basketball(26%),baseball(23%),andrunning(17%)follow.
§ ActiveLAcountyyouthplayedonaverage2.67sportsinthepastyear.
§ Withanaverageof90timesperyear,skateboardinghasthehighest“playfrequency”ofallsportsamongkidsaged6-17,followedbytacklefootball(60timesperyear),cycling(59),basketball(55),andrunning(54).
§ Inaggregate,LAcountyyouthplayedsportsatanaverageof114timesoverthepastyear.
§ 18.5%ofLAcountyyouthdidnotparticipateinasportinthelastyear.Lackofinterestwasthemost-citedreason.Youngerchildrenages6-8andfemalesweresignificantlymorelikelytobeinactive.Householdswithinactivechildrenweremorelikelytohaveadultswithoccasionalornophysicalactivity.Additionally,householdswithparentsreceivinghigherincomesweremorelikelytohaveplayedasport,aswellaskidswhoareenrolledinP.E.classes.Whitechildrenwerealsomorelikelytohaveplayedasportinthepastyearwhencomparingrace/ethnicitybreakouts.
§ 65%ofLAcountyyouthwouldliketoplayasportinthenextyear;socceristhemostdesiredsporttoplayinthenextyearfollowedbyfootball,basketball,baseball,andtennis.
P.E.ENROLLMENT
§ 85%ofLAcountyyouthareenrolledinaP.E./physicalactivityclass;thoseaged9-14aremorelikelytobeenrolledcomparedtoyounger(6-8years)andolder(15-17years)children.
§ WhencomparingP.E.enrollmentbyrace/ethnicity,blackandAfrican-AmericanchildreninLAcountyaremorelikelytobeinaP.E.class(94%),withwhiteyouth(82%)aretheleastlikelycomparedtootherrace/ethnicgroups.
§ ForthoseenrolledinaP.E.orphysicalactivityclass,69%haveclassmorethanonceaweek;comparisonsbyhouseholdregionshowthoselivingintheNortharemorelikelytohavemorethanoneP.E.classaweek(80%),whilethoseresidingintheMetroregionaremorelikelytohaveonlyoneP.E.classaweek(56%).
SPECIALNEEDSSTATUS
§ 10%ofhouseholdsinLAcountyreporthavingaspecialneedschild.HouseholdsintheSouthandmetroregionshaveslightlyhigherlevelsofhouseholdswithaspecialneedschildcomparedtotheotherregions.

LA84 Foundation Youth Sports Survey: Los Angeles County, 2016
©2016 LA84 Foundation 6
§ Ofhouseholdswithspecialneedschildren,31%statetheirchildsuffersfromaphysicaldisability,42%intellectual/emotionaldisability,and27%reportachildwithbothaphysicalandintellectual/emotionaldisabilities.
HOUSEHOLDADULTPHYSICALFITNESSSTATUS
§ 50%ofhouseholdswithchildrenages6-17inLAcountyhaveadultswhoregularlyparticipateinphysicalactivity/sports;39.6%occasionallyparticipateand10.4%areinactive.
§ Accountingforhouseholdadultphysicalfitnessstatusbyrace/ethnicity,whitehouseholdsaremorelikelytobemoreactivewith57%regularlytakingpartinsportsorphysicalactivity;thisiscomparedtoHispanics(47%),Black/African-American(39%),andAsian(35%).Thosefallingintothe“other”race/ethnicitycategoryhave53%ofhouseholdswithadultsengaginginregularlyphysicalactivity.
§ HouseholdsintheSouthregionaremorelikelytoholdadultswhoregularlyparticipateat60%,anoticeableleadoverMetro(56%),West(53%),East(45%),andNorth(45%).
§ Householdswithadultseitheroccasionallyparticipatingornotparticipatingatallinphysicalactivitiesweremorelikelytohavechildrenthatdidnotplayasportinthepastyear.
MEDIA
§ YouTubeisthesocialmediaplatformmostoftenusedbyLAcountyyouth,withnearlyhalf(48%)usingitregularly—followedbyFacebook(37%),Instagram(32%),Snapchat(25%)andTwitter(24%).
§ Amongwebsites&publications,ESPNhasthehighestpercentageofregularusageat29%,withFoxSportssecond-mostat20%.

LA84 Foundation Youth Sports Survey: Los Angeles County, 2016
©2016 LA84 Foundation 7
SportsParticipationTrendsParticipationRatevs.ParticipationFrequency
Participationrateisameasureofthepercentageofacertaingrouptakingpartinthatactivityoverthelast12months,whileparticipationfrequencyistheaveragenumberofplayoccasions(timestheactivitywasparticipatedin)peryear.Forexample,theparticipationrateofbasketballinLAcountyamongyouths6-17yearsoldis26%whiletheaverageparticipationfrequencyis55;thismeans26%ofallyouthaged6-17playedbasketballatleastonce,andofthese26%ofyouththeaveragetimesbasketballisplayedperyearis55.
• OutdoorsocceristhemostplayedsportamongLAcountyyouth—29%ofallchildrenparticipatedinthepast12months.
• 18.5%ofLAcountyyouthdidnotplayasportinthepastyear.
• Mostcommonsportsspecifiedwhenanswering“Other”include:
• Gymnastics:1.3%
• Dance:1.1%
• Karate:1.1%
• Taekwondo:0.5%
• Golf:0.4%
• Skiing:0.4%
29% 27%
26% 23%
16% 11% 10%
10% 9% 8% 8%
8% 7% 7%
5% 4%
4% 3% 3% 3%
1% 19%
15% 13%
19% 14%
20% 8%
5% 5%
7% 6%
26% 4%
3% 2%
4% 1% 1%
4% 1%
1%
19%
0% 5% 10% 15% 20% 25% 30% 35% Soccer(outdoor)
SwimmingBasketballBaseballRunningTennis
Volleyball(court)Track&Field
SkateboardingFootball(tackle)
CyclingFootball(flag)
Softball(slow-pitch)Softball(fast-pitch)
Soccer(indoor)Volleyball(sand/beach)
SurfingSnowboarding
WrestlingWaterPolo
RugbyDidnotplay
Youth(Ages6-17)SportsParticipationRate- LACounty&National(ofthoseplaying)
LACounty National
*Inactivityadjustedfornationallevels(ages6-17)

LA84 Foundation Youth Sports Survey: Los Angeles County, 2016
©2016 LA84 Foundation 8
• Roughly82%ofLAcountyyouthplayedatleastonesportinthepast12months,with89%ofmalesand73%offemalesconsideredactivesportparticipants.
• OfLAcountyyouthsportparticipants,37%playedtwotothreesportsinthepastyear.
82% 89%
73% 72%
85% 87%
85% 89%
87% 90%
65% 86%
79%
0% 10% 20% 30% 40% 50% 60% 70% 80% 90% 100%
TotalMale
Female6~89~1112~1415~17
Male6~11Male12~14Male15~17Female6~11Female12~14Female15~17
ActiveLACountyYouthParticipationRate(thoseplayingatleastonesport)
19% 11% 27% 28%
15% 13% 15% 11% 13% 10% 35%
14% 21%
19% 19%
19% 19%
16% 21% 21% 17% 17% 24%
18%
25% 17%
37% 40%
33% 29% 43% 39% 38%
42% 38% 38% 28%
40% 39%
15% 17% 13% 15% 16% 14% 16% 18% 17% 15%
12% 11% 18% 10% 12% 7% 9% 10% 12% 9% 11% 15% 13% 7% 10% 5%
0% 10% 20% 30% 40% 50% 60% 70% 80% 90%
100%
Total Male Female 6~8 9~11 12~14 15~17 Male6~11
Male12~14
Male15~17
Female6~11
Female12~14
Female15~17
NumberofSportsPlayedbyLACountyYouth
Sixormoresports
Fourtofivesports
Twotothreesports
Onesport
None
*Breakoutsbyage/genderrequiredmergingagegroupsintolargerranges

LA84 Foundation Youth Sports Survey: Los Angeles County, 2016
©2016 LA84 Foundation 9
• LAcountyyouthoverthepastyearplayedanaverageof2.67sports.
ParticipationFrequency(DaysPerYear)
• SkateboardingisthesportwiththehighestaverageparticipationfrequencyperyearinLAcountyamongyouthat90timesevery12months,significantlyhigherthananyothersport.
2.673.03
2.262.35
2.812.88
2.693.01
3.172.94
2.042.61
2.35
0.00 0.50 1.00 1.50 2.00 2.50 3.00 3.50
TotalMale
Female6~89~11
12~1415~17
Male6~11Male12~14Male15~17Female6~11Female12~14Female15~17
AverageNumberofSportsPlayedbyLACountyYouth
9060
595554
5249
474444
42363534
3220
1818
1616
9
0 20 40 60 80 100
SkateboardingFootball(tackle)
CyclingBasketballRunning
Soccer(outdoor)Softball(slow-pitch)
Football(flag)Baseball
SwimmingSoftball(fast-pitch)
WrestlingTrack&Field
TennisVolleyball(court)
Volleyball(sand/beach)Soccer(indoor)
SurfingWaterPolo
SnowboardingRugby
YouthSportsParticipationAverageDaysPlayedPerYear(amongthoseparticipating)

LA84 Foundation Youth Sports Survey: Los Angeles County, 2016
©2016 LA84 Foundation 10
• Onaverage,LAcountyyouthparticipatedinsports114timesoverthelastyear.Asageincreases,averageparticipationfrequencyrisesaswell.
FutureSportsParticipationInterest
114
121
105
96
114
118
132
117
124
128
89
112
137
- 20 40 60 80 100 120 140 160
Total
Male
Female
6~8
9~11
12~14
15~17
Male6~11
Male12~14
Male15~17
Female6~11
Female12~14
Female15~17
YouthAverageSportParticipationFrequency(numberoftimessportsplayedperyear)
65% 67% 62% 67% 67% 69% 56%
35% 33% 38% 33% 33% 31% 44%
0%
20%
40%
60%
80%
100%
Allyouth Male Female 6~8 9~11 12~14 15~17
"Arethereanysportsyourchildwouldliketoplayinthenext12months?”Yes No

LA84 Foundation Youth Sports Survey: Los Angeles County, 2016
©2016 LA84 Foundation 11
• 65%ofLAcountyyouthwouldliketoplayasportinthenext12months
• SoccerisoverwhelminglythemostdesiredsporttoplayinthenextyearamongLAcountyyouth,followedbyfootball,basketball,baseball,andtennis.
FutureSportParticipationInterest:LatentDemandTable
Thefollowingtablewasmadebycomparingactivesportparticipantsbytheopen-endedresponsesprovidedwhenasked“Whatsportswouldyouliketoplay?”Responseswerecodedincategoriesofsports.Foranexampleofreadingthistable,considerthefirstcell;thisshouldbeinterpretedas53%ofoutdoorsoccerplayerswhoanswered“yes”(tointerestinsportsparticipationnextyear)specifiedbaseballasadesiredsport.
Resultsshouldnotbeinterpretedasameasureoflatentdemandasthisquestionwasnotrequiredtobeansweredbyparticipants.
SportsInterestedinPlayingintheNextYear Baseball Basketball Football Soccer Softball Swimming Tennis Volleyball Rugby Cycling Running Soccer(outdoor) 53% 34% 54% 45% 32% 31% 54% 44% 69% 50% 30% Basketball 40% 69% 54% 25% 29% 27% 43% 50% 48% 50% 29% Swimming 33% 29% 42% 26% 25% 49% 53% 33% 83% 50% 48% Baseball 61% 43% 52% 28% 6% 29% 23% 12% 59% 50% 11% Running 9% 17% 22% 20% 8% 26% 21% 44% 48% 33% 65% Tennis 12% 9% 8% 9% 28% 15% 42% 9% 48% 18% 7% Volleyball(court) 4% 10% 4% 9% 6% 12% 19% 41% 31% - 35% Skateboarding 18% 20% 20% 9% 6% 10% 3% 7% 24% - -Track&Field 8% 6% 18% 12% 10% 9% 5% 7% 17% - 31% Cycling 11% 7% 8% 8% 12% 36% 7% 17% 42% 68% 6% Football(tackle) 11% 5% 33% 2% - 8% 5% 1% 24% 15% 11% Softball(slowpitch) 10% 7% 9% 8% 16% 16% 6% 12% - - 12% Football(flag) 19% 12% 22% 10% 4% 8% 4% - 52% - 12% Softball(fastpitch) 2% 7% 4% 12% 36% 3% 8% 12% 17% - -Volleyball(sand/beach) 4% 2% 4% 3% 12% 3% 16% - 31% 33% -
Soccer(indoor) 3% 2% 6% 4% 8% 3% 6% 13% 10% - 5%
22% 12%
11% 11%
10% 7%
6% 5%
3%
0% 5% 10% 15% 20% 25%
Soccer
Football
Basketball
Baseball
Tennis
Volleyball
Swimming
Softball
Track&Field
"Whatsportswouldtheyliketoplay?"
SportsPlayedinth
ePa
stYea
r

LA84 Foundation Youth Sports Survey: Los Angeles County, 2016
©2016 LA84 Foundation 12
Inactivity*AmongLACountyYouth(*Inactive=notparticipatinginanyofthelistedsportsorspecifiedan“other”sport.)
ReasonsforInactivity
Forthosenotplayingasport,anopen-endedquestionwasasked:“Whydidn’tyouparticipateinanysportsinthepast12months?”Theresponseswerecodedintoseveralcategories,shownbelowbythepercentageofthosenotplaying.
• Forthosenotplayingsportsintheprevious12months,agenerallackofinterestwasmost-oftencited(39%).Adislikeofsportswasthenext-highestreasonstatedfornon-participation(16%).
Inactives:Profile
39% 16%
12% 6% 5% 5% 5% 5% 4% 3% 3% 3%
0% 10% 20% 30% 40% 50%
Notinterested
Doesn'tlikesports
Tooyoung
Toobusystudying
Other
Badexperience/Didn'twanttoplay…
Othernon-sportinterests
Didn'tsignupintime
Cost/Finances
Work
Healthproblems
Sportsnotavailable/offeredatschool
ReasonsforNotParticipatinginSportsinPastYearAmongLACountyYouth
19% 11%
27% 28%
15% 14%
15%
0% 5% 10% 15% 20% 25% 30%
Total
Male
Female
6~8
9~11
12~14
15~17
LACountyYouthNon-ParticipationRatesbyGender,Age

LA84 Foundation Youth Sports Survey: Los Angeles County, 2016
©2016 LA84 Foundation 13
• Aclearcorrelationexistsbetweenhouseholdswithachildnotparticipatinginsportsinthelastyearandparentincome.
• LAcountyyouthwithactiveparentsarelesslikelytohavenotplayedsports,similarlyasthosetakingP.E.classes.
11%
22%
29%
20% 16%
0%
10%
20%
30%
40%
White Hispanic Black Asian Other
LACountyYouthNon-ParticipationRatesbyRace/Ethnicity
25%
18%
19%
17%
16%
0% 5% 10% 15% 20% 25% 30%
North
South
East
West
Metro
LACountyYouthNon-ParticipationRatesbyRegion
22%
8%
4%
0% 5% 10% 15% 20% 25%
<$50k
$50~99k
$100k+
LACountyYouthNon-ParticipationRatesbyHouseholdIncome
33%
16%
17%
21%
0% 10% 20% 30% 40%
NoPE
PE
ActiveParents
Occ/NonParents
LACountyYouthNon-ParticipationRatesbyP.E.ClassEnrollmentStatus,PhysicalActivityofHouseholdAdults

LA84 Foundation Youth Sports Survey: Los Angeles County, 2016
©2016 LA84 Foundation 14
SportsParticipationRates&ProfilesReadingtheSportProfiles
Eachsportishighlightedintotwosections:participationrates/projections&profiles.Theprofilesectionprovidesabreakoutasapercentageoftotalparticipationwithinthesport.Forinstance,thebaseballincomeprofileshowshouseholdsover$100Kat40%;thisindicatesthat40%ofhouseholdswithabaseballplayerbetween6-17yearsoldmakeover$100k.Theindicesineachprofilecompareparticipationrate(%ofatotalgroup)withtheLAcountyyouthpopulationtomeasuretherelativelikelihoodofasportparticipantbeingamemberofthatdemographic.
BASEBALL
Total Male Female Ages
6~8 Ages 9~11
Ages 12~14
Ages 15~17
LAParticipationRate(%) 23.2% 37.5% 9.8% 18.5% 29.9% 23.8% 23.7% NationalParticipationRate(%) 13.7% 21.9% 4.3% 17.3% 16.4% 13.4% 10.9% AveragePlayFrequency(peryear) 44.5 48.8 28.2 27.1 57.1 45.9 44.6
ProjectedNumberofPlayers(byRegion) North South East West Metro Total ParticipationRate(%) 15.4% 26.6% 24.3% 19.7% 39.5% 23.2% xAge6-17Population 398,601 308,547 492,268 175,242 141,409 1,516,067 =ProjectedPlayers* 61,463 82,130 119,392 34,507 55,876 352,144
Casual/Pick-up,34%
Organized(school),31%
Organized(outsideofschool),34%
Other,1% TypeofBaseballPlayedAmongLA
CountyYouth
Publicfacility(park,
pool,field,court),52%
School,33%
College/University,3%
Private/Commercialfacility,7%
Privatenon-profit,4% Other,1%
WhereBaseballisPlayedAmongLACountyYouth
*Roundingmaycausedifferencesinprojectedplayerswhencomparingaggregatedregiontotalstototalparticipationrateand6-17population

LA84 Foundation Youth Sports Survey: Los Angeles County, 2016
©2016 LA84 Foundation 15
SportProfile:BASEBALL
Profile Index Male 146 Female 46 Ages6~8 87 Ages9~11 123 Ages12~14 95 Ages15~17 95 White 105 Hispanic/Latino 116 Black/African-American 42 Asian/PacificIslander 62 <$50K 60 $50k~99k 115 $100k+ 126
Male,79%
Female,21%
Gender
6~8, 25%
9~11,32%12~14,21%
15~17,23%
Age
White,34%
Hispanic/Latino,56%
Black/African-American,5%
Asian/PacificIslander,4%Other,2%
Ethnicity
<$50k,20%
$50k~99k,40%
$100k+,40%
Income
Playersofthissportarerelativelymorelikelytobe:
• Male• Ages9to11• Hispanic/Latino• Moreaffluent
Howtoreadthistable: • Anindexof110meansplayersofthissportare
10%MORElikelytofallintothatgroup• Anindexof90meansplayersofthissportare
10%LESSlikelytofallintothatgroup

LA84 Foundation Youth Sports Survey: Los Angeles County, 2016
©2016 LA84 Foundation 16
BASKETBALL
Total Male Female Ages
6~8 Ages 9~11
Ages 12~14
Ages 15~17
LAParticipationRate(%) 26.5% 37.0% 14.8% 15.6% 30.2% 31.6% 30.4% NationalParticipationRate(%) 18.9% 25.3% 11.6% 14.5% 20.9% 23.7% 18.0% AveragePlayFrequency(peryear) 54.7 47.9 71.1 52.0 38.1 53.5 75.1
ProjectedNumberofPlayers(byRegion) North South East West Metro Total ParticipationRate(%) 22.0% 26.9% 27.1% 23.5% 39.4% 26.5% xAge6-17Population 398,601 308,547 492,268 175,242 141,409 1,516,067 =ProjectedPlayers* 87,762 82,890 133,322 41,262 55,740 401,568
Publicfacility(park,pool,field,court),
31%
School,52%
College/University,4%
Private/Commercialfacility,6%
Privatenon-profit,5% Other,2%
WhereBasketballisPlayedAmongLACountyYouth
Casual/Pick-up,33%
Organized(school),48%
Organized(outsideofschool),18%
Other,1%
TypeofBasketballPlayedAmongLACountyYouth
*Roundingmaycausedifferencesinprojectedplayerswhencomparingaggregatedregiontotalstototalparticipationrateand6-17population

LA84 Foundation Youth Sports Survey: Los Angeles County, 2016
©2016 LA84 Foundation 17
SportProfile:BASKETBALL
Profile Index Male 131 Female 64 Ages6~8 68 Ages9~11 111 Ages12~14 113 Ages15~17 115 White 101 Hispanic/Latino 89 Black/African-American 136 Asian/PacificIslander 105 <$50K 86 $50k~99k 109 $100k+ 104
Male, 71%
Female,30%
Gender
6~8, 19%
9~11,28%
12~14, 25%
15~17,27%
Age
White,33%
Hispanic/Latino,43%
Black/African-American,17%
Asian/PacificIslander,6%Other,2%
Ethnicity
<$50k,28%
$50k~99k,38%
$100k+,33%
Income
Playersofthissportarerelativelymorelikelytobe:
• Male• Ages15to17• Black/African-American• Parentincomebetween$50to$99k
Howtoreadthistable: • Anindexof110meansplayersofthissportare
10%MORElikelytofallintothatgroup• Anindexof90meansplayersofthissportare
10%LESSlikelytofallintothatgroup

LA84 Foundation Youth Sports Survey: Los Angeles County, 2016
©2016 LA84 Foundation 18
SOFTBALL(SLOW-PITCH)
Total Male Female Ages
6~8 Ages 9~11
Ages 12~14
Ages 15~17
LAParticipationRate(%) 7.1% 5.7% 8.5% 6.6% 9.1% 7.8% 4.9% NationalParticipationRate(%) 3.2% 2.0% 4.7% 3.1% 3.0% 3.4% 4.2% AveragePlayFrequency(peryear) 49.3 55.3 45.6 67.3 44.7 23.3 64.6
ProjectedNumberofPlayers(byRegion) North South East West Metro Total ParticipationRate(%) 6.0% 5.9% 7.6% 8.2% 9.2% 7.1% xAge6-17Population 398,601 308,547 492,268 175,242 141,409 1,516,067 =ProjectedPlayers* 23,935 18,251 37,410 14,390 13,020 107,497
Casual/Pick-up,28%
Organized(school),35%
Organized(outsideofschool),36%
Other,2%
TypeofSoftball(Slow-Pitch)PlayedAmongLACountyYouth
Publicfacility(park,pool,field,court),
43%School,40%
College/University,7%
Private/Commercialfacility,1%
Privatenon-profit,8% Other,1%
WhereSoftball(slow-pitch)isPlayedAmongLACountyYouth
*Roundingmaycausedifferencesinprojectedplayerswhencomparingaggregatedregiontotalstototalparticipationrateand6-17population

LA84 Foundation Youth Sports Survey: Los Angeles County, 2016
©2016 LA84 Foundation 19
SportProfile:SOFTBALL(SOFT-PITCH)
Profile Index Male 72 Female 133 Ages6~8 103 Ages9~11 124 Ages12~14 106 Ages15~17 65 White 105 Hispanic/Latino 107 Black/African-American 70 Asian/PacificIslander 53 <$50K 67 $50k~99k 125 $100k+ 107
Male, 39%
Female,61%
Gender
6~8, 29%
9~11,32%
12~14,24%
15~17, 15%
Age
White,34%
Hispanic/Latino,52%
Black/African-American,9%
Asian/PacificIslander,3%Other,3%
Ethnicity
<$50k,22%
$50k~99k,44%
$100k+,34%
Income
Playersofthissportarerelativelymorelikelytobe:
• Female• Ages9to11• Hispanic/Latino• Parentincomebetween$50to$99k
Howtoreadthistable: • Anindexof110meansplayersofthissportare
10%MORElikelytofallintothatgroup• Anindexof90meansplayersofthissportare
10%LESSlikelytofallintothatgroup

LA84 Foundation Youth Sports Survey: Los Angeles County, 2016
©2016 LA84 Foundation 20
SOFTBALL(FAST-PITCH)
Total Male Female Ages
6~8 Ages 9~11
Ages 12~14
Ages 15~17
LAParticipationRate(%) 6.8% 5.6% 8.2% 4.8% 5.1% 12.0% 7.4% NationalParticipationRate(%) 1.9% 0.7% 3.3% 0.4% 2.2% 2.9% 2.2% AveragePlayFrequency(peryear) 41.9 16.0 59.2 27.0 32.8 41.0 63.6
ProjectedNumberofPlayers(byRegion) North South East West Metro Total ParticipationRate(%) 7.1% 7.6% 5.4% 5.1% 10.2% 6.8% xAge6-17Population 398,601 308,547 492,268 175,242 141,409 1,516,067 =ProjectedPlayers* 28,367 23,574 26,664 8,957 14,376 102,554
Casual/Pick-up,29%
Organized(school),40%
Organized(outsideofschool),30%
Other,1%
TypeofSoftball(Fast-Pitch)PlayedAmongLACountyYouth
Publicfacility(park,pool,field,court),
58%
School,28%
College/University,1%
Private/Commercialfacility,11%
Privatenon-profit,1% Other,1%
WhereSoftball(fast-pitch)isPlayedAmongLACountyYouth
*Roundingmaycausedifferencesinprojectedplayerswhencomparingaggregatedregiontotalstototalparticipationrateand6-17population

LA84 Foundation Youth Sports Survey: Los Angeles County, 2016
©2016 LA84 Foundation 21
SportProfile:SOFTBALL(FAST-PITCH)
Profile Index Male 74 Female 131 Ages6~8 78 Ages9~11 71 Ages12~14 160 Ages15~17 101 White 121 Hispanic/Latino 98 Black/African-American 91 Asian/PacificIslander 12 <$50K 63 $50k~99k 102 $100k+ 137
Male, 40%
Female,60%
Gender
6~8, 22%
9~11,18%
12~14, 36%
15~17,24%
Age
White,39%
Hispanic/Latino,47%
Black/African-American,11%
Asian/PacificIslander,1% Other,2%
Ethnicity
<$50k,21%
$50k~99k,36%
$100k+,43%
Income
Playersofthissportarerelativelymorelikelytobe:
• Female• Ages12to14• White• Moreaffluent
Howtoreadthistable: • Anindexof110meansplayersofthissportare
10%MORElikelytofallintothatgroup• Anindexof90meansplayersofthissportare
10%LESSlikelytofallintothatgroup

LA84 Foundation Youth Sports Survey: Los Angeles County, 2016
©2016 LA84 Foundation 22
SOCCER(OUTDOOR)
Total Male Female Ages
6~8 Ages 9~11
Ages 12~14
Ages 15~17
LAParticipationRate(%) 28.8% 36.2% 21.6% 24.5% 34.3% 32.3% 26.1% NationalParticipationRate(%) 14.7% 16.9% 12.2% 19.0% 18.3% 13.4% 10.9% AveragePlayFrequency(peryear) 52.0 47.9 58.8 39.6 40.0 62.4 73.8
ProjectedNumberofPlayers(byRegion) North South East West Metro Total ParticipationRate(%) 26.3% 25.5% 29.5% 29.9% 37.1% 28.8% xAge6-17Population 398,601 308,547 492,268 175,242 141,409 1,516,067 =ProjectedPlayers* 104,900 78,581 145,261 52,421 52,485 436,165
Casual/Pick-up,16%
Organized(school),39%
Organized(outsideofschool),44%
Other,1%
TypeofSoccer(outdoor)PlayedAmongLACountyYouth
Publicfacility(park,pool,field,court),
42%
School,36%
College/University,4%
Private/Commercialfacility,6%
Privatenon-profit,11% Other,1%
WhereSoccer(outdoor)isPlayedAmongLACountyYouth
*Roundingmaycausedifferencesinprojectedplayerswhencomparingaggregatedregiontotalstototalparticipationrateand6-17population

LA84 Foundation Youth Sports Survey: Los Angeles County, 2016
©2016 LA84 Foundation 23
SportProfile:SOCCER(OUTDOOR)
Profile Index Male 116 Female 82 Ages6~8 95 Ages9~11 114 Ages12~14 105 Ages15~17 87 White 99 Hispanic/Latino 118 Black/African-American 59 Asian/PacificIslander 38 <$50K 83 $50k~99k 95 $100k+ 124
6~8, 27%
9~11,29%12~14, 23%
15~17,21%
Age
Male,62%
Female,38%
Gender
White,32%
Hispanic/Latino,57%
Black/African-American,7%
Asian/PacificIslander,2% Other,2%
Ethnicity
<$50k,28%
$50k~99k,33%
$100k+,39%
Income
Playersofthissportarerelativelymorelikelytobe:
• Male• Ages9to11• Hispanic/Latino• Moreaffluent
Howtoreadthistable: • Anindexof110meansplayersofthissportare
10%MORElikelytofallintothatgroup• Anindexof90meansplayersofthissportare
10%LESSlikelytofallintothatgroup

LA84 Foundation Youth Sports Survey: Los Angeles County, 2016
©2016 LA84 Foundation 24
SOCCER(INDOOR)
Total Male Female Ages
6~8 Ages 9~11
Ages 12~14
Ages 15~17
LAParticipationRate(%) 4.6% 7.0% 2.3% 4.8% 5.1% 5.2% 3.3% NationalParticipationRate(%) 4.3% 4.7% 3.9% 4.2% 5.2% 4.4% 4.0% AveragePlayFrequency(peryear) 18.3 18.4 17.8 20.7 18.3 18.4 12.8
ProjectedNumberofPlayers(byRegion) North South East West Metro Total ParticipationRate(%) 2.9% 4.8% 2.3% 5.5% 14.7% 4.6% xAge6-17Population 398,601 308,547 492,268 175,242 141,409 1,516,067 =ProjectedPlayers* 11,524 14,956 11,541 9,691 20,750 69,193
Casual/Pick-up,10%
Organized(school),49%
Organized(outsideofschool),39%
Other,2%
TypeofSoccer(indoor)PlayedAmongLACountyYouth
Publicfacility(park,pool,field,court),
21%
School,43%College/University,4%
Private/Commercialfacility,13%
Privatenon-profit,16%
Other,3%
WhereSoccer(indoor)isPlayedAmongLACountyYouth
*Roundingmaycausedifferencesinprojectedplayerswhencomparingaggregatedregiontotalstototalparticipationrateand6-17population

LA84 Foundation Youth Sports Survey: Los Angeles County, 2016
©2016 LA84 Foundation 25
SportProfile:SOCCER(INDOOR)
Profile Index Male 140 Female 54 Ages6~8 116 Ages9~11 106 Ages12~14 107 Ages15~17 68 White 157 Hispanic/Latino 91 Black/African-American 35 Asian/PacificIslander 0 <$50K 59 $50k~99k 112 $100k+ 130
Male, 75%
Female,25%
Gender
6~8, 33%
9~11,27%
12~14,24%
15~17, 16%
Age
White,51%Hispanic/Latino,44%
Black/African-American,4%
Asian/PacificIslander,0% Other,1%
Ethnicity
<$50k,19%
$50k~99k,39%
$100k+,41%
Income
Playersofthissportarerelativelymorelikelytobe:
• Male• Ages6to8• White• Moreaffluent
Howtoreadthistable: • Anindexof110meansplayersofthissportare
10%MORElikelytofallintothatgroup• Anindexof90meansplayersofthissportare
10%LESSlikelytofallintothatgroup

LA84 Foundation Youth Sports Survey: Los Angeles County, 2016
©2016 LA84 Foundation 26
FOOTBALL(TACKLE)
Total Male Female Ages
6~8 Ages 9~11
Ages 12~14
Ages 15~17
LAParticipationRate(%) 8.4% 16.4% 0.7% 4.5% 4.8% 12.6% 14.6% NationalParticipationRate(%) 6.4% 11.3% 0.7% 2.1% 6.1% 9.3% 8.6% AveragePlayFrequency(peryear) 60.0 62.4 8.7 38.5 41.3 85.1 56.3
ProjectedNumberofPlayers(byRegion) North South East West Metro Total ParticipationRate(%) 7.7% 12.2% 4.8% 8.3% 14.3% 8.4% xAge6-17Population 398,601 308,547 492,268 175,242 141,409 1,516,067 =ProjectedPlayers* 30,731 37,516 23,481 14,537 20,208 127,266
Casual/Pick-up,24%
Organized(school),51%
Organized(outsideofschool),23%
Other,1%
TypeofFootball(tackle)PlayedAmongLACountyYouth
Publicfacility(park,pool,field,court),
20%
School,56%
College/University,10%
Private/Com…
Privatenon-… Other,2%
WhereFootball(tackle)isPlayedAmongLACountyYouth
*Roundingmaycausedifferencesinprojectedplayerswhencomparingaggregatedregiontotalstototalparticipationrateand6-17population
LA84 Foundation Youth Sports Survey: Los Angeles County, 2016
©2016 LA84 Foundation 27
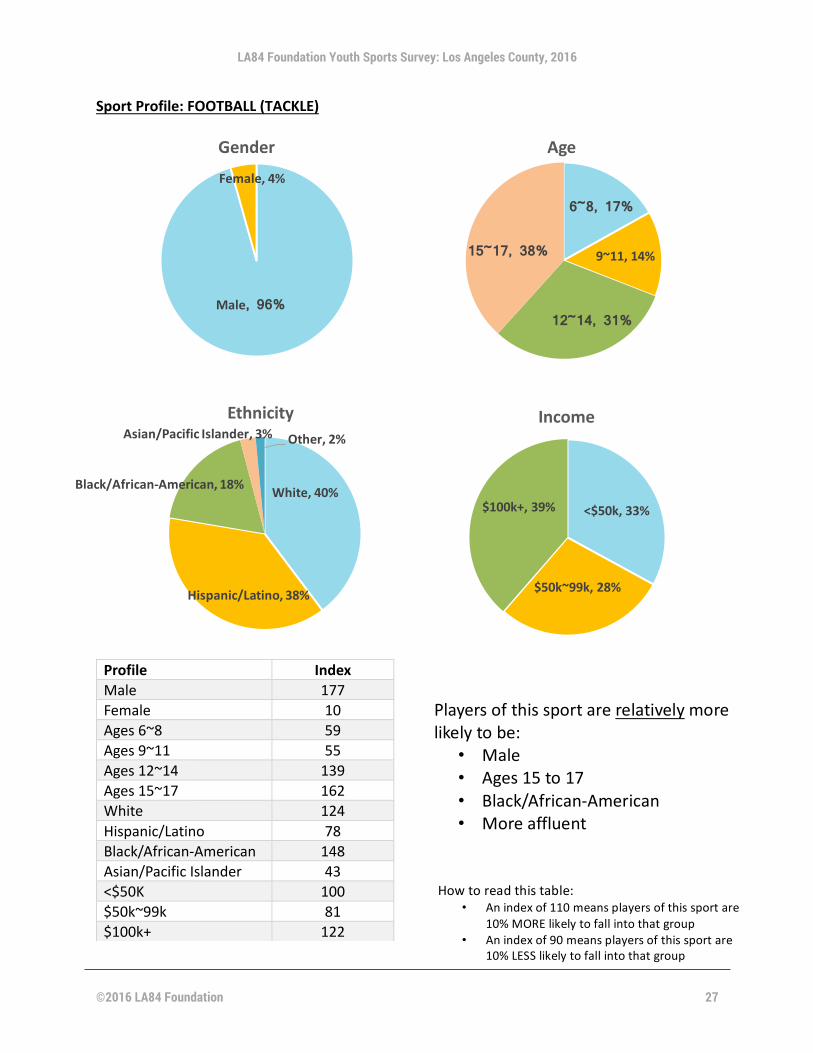
SportProfile:FOOTBALL(TACKLE)
Profile Index Male 177 Female 10 Ages6~8 59 Ages9~11 55 Ages12~14 139 Ages15~17 162 White 124 Hispanic/Latino 78 Black/African-American 148 Asian/PacificIslander 43 <$50K 100 $50k~99k 81 $100k+ 122
Male, 96%
Female,4%
Gender
6~8, 17%
9~11,14%
12~14, 31%
15~17, 38%
Age
White,40%
Hispanic/Latino,38%
Black/African-American,18%
Asian/PacificIslander,3% Other,2%
Ethnicity
<$50k,33%
$50k~99k,28%
$100k+,39%
Income
Playersofthissportarerelativelymorelikelytobe:
• Male• Ages15to17• Black/African-American• Moreaffluent
Howtoreadthistable: • Anindexof110meansplayersofthissportare
10%MORElikelytofallintothatgroup• Anindexof90meansplayersofthissportare
10%LESSlikelytofallintothatgroup

LA84 Foundation Youth Sports Survey: Los Angeles County, 2016
©2016 LA84 Foundation 28
FOOTBALL(FLAG)
Total Male Female Ages
6~8 Ages 9~11
Ages 12~14
Ages 15~17
LAParticipationRate(%) 7.6% 12.6% 2.8% 7.3% 6.1% 10.9% 7.0% NationalParticipationRate(%) 4.0% 6.4% 1.2% 4.0% 4.2% 5.4% 3.5% AveragePlayFrequency(peryear) 46.6 51.6 24.9 65.1 28.2 58.0 19.0
ProjectedNumberofPlayers(byRegion) North South East West Metro Total ParticipationRate(%) 5.7% 9.6% 6.1% 8.6% 12.3% 7.6% xAge6-17Population 398,601 308,547 492,268 175,242 141,409 1,516,067 =ProjectedPlayers* 22,753 29,658 29,848 15,124 17,360 114,910
Casual/Pick-up,16%
Organized(school),53%
Organized(outsideofschool),27%
Other,5%
TypeofFootball(flag)PlayedAmongLACountyYouth
Publicfacility(park,pool,field,
court),28%
School,47%
College/University,9%
Private/Commercialfacility,4%
Privatenon-profit,9% Other,4%
WhereFootball(flag)isPlayedAmongLACountyYouth
*Roundingmaycausedifferencesinprojectedplayerswhencomparingaggregatedregiontotalstototalparticipationrateand6-17population

LA84 Foundation Youth Sports Survey: Los Angeles County, 2016
©2016 LA84 Foundation 29
SportProfile:FOOTBALL(FLAG)
Profile Index Male 152 Female 40 Ages6~8 110 Ages9~11 76 Ages12~14 131 Ages15~17 85 White 120 Hispanic/Latino 94 Black/African-American 98 Asian/PacificIslander 27 <$50K 92 $50k~99k 92 $100k+ 116
6~8, 31%
9~11,20%12~14, 29%
15~17,20%
Age
Male, 82%
Female,18%
Gender
White,38%
Hispanic/Latino,46%
Black/African-American,12%
Asian/PacificIslander,2%Other,2%
Ethnicity
<$50k,31%
$50k~99k,33%
$100k+,37%
Income
Playersofthissportarerelativelymorelikelytobe:
• Male• Ages12to14• White• Moreaffluent
Howtoreadthistable: • Anindexof110meansplayersofthissportare
10%MORElikelytofallintothatgroup• Anindexof90meansplayersofthissportare
10%LESSlikelytofallintothatgroup

LA84 Foundation Youth Sports Survey: Los Angeles County, 2016
©2016 LA84 Foundation 30
VOLLEYBALL(COURT)
Total Male Female Ages
6~8 Ages 9~11
Ages 12~14
Ages 15~17
LAParticipationRate(%) 10.3% 6.7% 13.4% 5.5% 11.7% 15.4% 10.1% NationalParticipationRate(%) 5.2% 2.3% 8.4% 1.4% 4.8% 9.2% 5.4% AveragePlayFrequency(peryear) 32.0 18.3 38.3 26.2 33.3 31.8 35.0
ProjectedNumberofPlayers(byRegion) North South East West Metro Total ParticipationRate(%) 10.6% 6.2% 7.8% 12.1% 22.8% 10.3% xAge6-17Population 398,601 308,547 492,268 175,242 141,409 1,516,067 =ProjectedPlayers* 42,256 19,265 38,206 21,292 32,278 155,685
Casual/Pick-up,21%
Organized(school),55%
Organized(outsideofschool),23%
Other,1%
TypeofVolleyball(court)PlayedAmongLACountyYouth
Publicfacility(park,pool,field,court),
19%
School,54%
College/University,4%
Private/Commercialfacility,10%
Privatenon-profit,12%
Other,1%
WhereVolleyball(court)isPlayedAmongLACountyYouth
*Roundingmaycausedifferencesinprojectedplayerswhencomparingaggregatedregiontotalstototalparticipationrateand6-17population

LA84 Foundation Youth Sports Survey: Los Angeles County, 2016
©2016 LA84 Foundation 31
SportProfile:VOLLEYBALL(COURT)
Profile Index Male 59 Female 148 Ages6~8 60 Ages9~11 110 Ages12~14 141 Ages15~17 100 White 141 Hispanic/Latino 72 Black/African-American 100 Asian/PacificIslander 87 <$50K 54 $50k~99k 103 $100k+ 144
Male, 32%
Female,68%
Gender
6~8, 17%
9~11,28%
12~14, 31%
15~17,24%
Age
White,45%
Hispanic/Latino,35%
Black/African-American,12%
Asian/PacificIslander,5% Other,2%
Ethnicity
<$50k,18%
$50k~99k,36%
$100k+,46%
Income
Playersofthissportarerelativelymorelikelytobe:
• Female• Ages12to14• White• Moreaffluent
Howtoreadthistable: • Anindexof110meansplayersofthissportare
10%MORElikelytofallintothatgroup• Anindexof90meansplayersofthissportare
10%LESSlikelytofallintothatgroup
LA84 Foundation Youth Sports Survey: Los Angeles County, 2016
©2016 LA84 Foundation 32
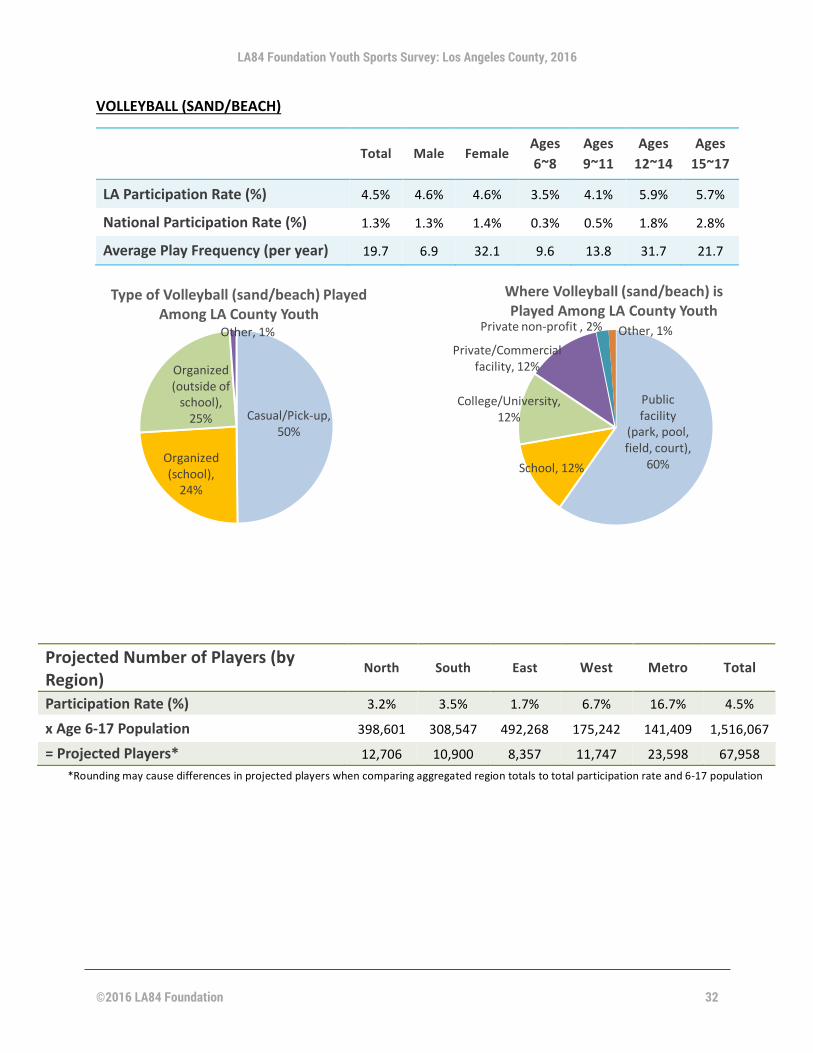
VOLLEYBALL(SAND/BEACH)
Total Male Female Ages
6~8 Ages 9~11
Ages 12~14
Ages 15~17
LAParticipationRate(%) 4.5% 4.6% 4.6% 3.5% 4.1% 5.9% 5.7% NationalParticipationRate(%) 1.3% 1.3% 1.4% 0.3% 0.5% 1.8% 2.8% AveragePlayFrequency(peryear) 19.7 6.9 32.1 9.6 13.8 31.7 21.7
ProjectedNumberofPlayers(byRegion) North South East West Metro Total ParticipationRate(%) 3.2% 3.5% 1.7% 6.7% 16.7% 4.5% xAge6-17Population 398,601 308,547 492,268 175,242 141,409 1,516,067 =ProjectedPlayers* 12,706 10,900 8,357 11,747 23,598 67,958
Casual/Pick-up,50%
Organized(school),24%
Organized(outsideofschool),25%
Other,1%
TypeofVolleyball(sand/beach)PlayedAmongLACountyYouth
Publicfacility
(park,pool,field,court),
60%School,12%
College/University,12%
Private/Commercialfacility,12%
Privatenon-profit,2% Other,1%
WhereVolleyball(sand/beach)isPlayedAmongLACountyYouth
*Roundingmaycausedifferencesinprojectedplayerswhencomparingaggregatedregiontotalstototalparticipationrateand6-17population

LA84 Foundation Youth Sports Survey: Los Angeles County, 2016
©2016 LA84 Foundation 33
SportProfile:VOLLEYBALL(SAND/BEACH)
Profile Index Male 92 Female 109 Ages6~8 83 Ages9~11 86 Ages12~14 119 Ages15~17 117 White 160 Hispanic/Latino 69 Black/African-American 76 Asian/PacificIslander 68 <$50K 33 $50k~99k 130 $100k+ 137
Male, 50% Female,50%
Gender
6~8, 24%
9~11,22%
12~14,26%
15~17, 28%
Age
White,51%
Hispanic/Latino,33%
Black/African-American,9%
Asian/PacificIslander,4% Other,2%
Ethnicity
<$50k,11%
$50k~99k,46%
$100k+,44%
Income
Playersofthissportarerelativelymorelikelytobe:
• Female• Ages12to14• White• Moreaffluent
Howtoreadthistable: • Anindexof110meansplayersofthissportare
10%MORElikelytofallintothatgroup• Anindexof90meansplayersofthissportare
10%LESSlikelytofallintothatgroup

LA84 Foundation Youth Sports Survey: Los Angeles County, 2016
©2016 LA84 Foundation 34
SWIMMING
Total Male Female Ages
6~8 Ages 9~11
Ages 12~14
Ages 15~17
LAParticipationRate(%) 27.1% 27.4% 25.9% 30.4% 32.1% 25.4% 17.1% NationalParticipationRate(%)* 12.9% 12.5% 13.4% 11.3% 14.1% 12.4% 13.7%
AveragePlayFrequency(peryear) 43.7 35.2 52.2 44.5 35.8 44.2 56.9
ProjectedNumberofPlayers(byRegion) North South East West Metro Total ParticipationRate(%) 23.8% 27.0% 24.8% 34.2% 34.3% 27.1% xAge6-17Population 398,601 308,547 492,268 175,242 141,409 1,516,067 =ProjectedPlayers* 94,854 83,397 122,178 59,910 48,552 411,453
Casual/Pick-up,39%
Organized(school),21%
Organized(outsideofschool),37%
Other,3%
TypeofSwimmingAmongLACountyYouth
Publicfacility
(park,pool,field,court),
33%
School,19%
College/University,3%
Private/Commercialfacility,21%
Privatenon-profit,16%
Other,7%
WhereSwimmingisAmongLACountyYouth
*Roundingmaycausedifferencesinprojectedplayerswhencomparingaggregatedregiontotalstototalparticipationrateand6-17population
*Thesenationalnumbersrepresent“swimmingonateam”and“swimmingforfitness”ascategorizedonPhysicalActivityCouncilparticipationdata.Forthisstudy,wejustasked“swimming”,sothisalsoincluderecreationalswimmers.Therefore,directcomparisonsareslightlymisleading.

LA84 Foundation Youth Sports Survey: Los Angeles County, 2016
©2016 LA84 Foundation 35
SportProfile:SWIMMING
Profile Index Male 93 Female 108 Ages6~8 124 Ages9~11 115 Ages12~14 90 Ages15~17 64 White 121 Hispanic/Latino 83 Black/African-American 106 Asian/PacificIslander 100 <$50K 71 $50k~99k 102 $100k+ 128
Male, 50% Female,50%
Gender
6~8, 35%
9~11,30%
12~14,20%
15~17, 15%
Age
White,39%
Hispanic/Latino,40%
Black/African-American,13%
Asian/PacificIslander,6% Other,2%
Ethnicity
<$50k,24%
$50k~99k,36%
$100k+,41%
Income
Playersofthissportarerelativelymorelikelytobe:
• Female• Ages6to8• White• Moreaffluent
Howtoreadthistable: • Anindexof110meansplayersofthissportare
10%MORElikelytofallintothatgroup• Anindexof90meansplayersofthissportare
10%LESSlikelytofallintothatgroup

LA84 Foundation Youth Sports Survey: Los Angeles County, 2016
©2016 LA84 Foundation 36
WATERPOLO
Total Male Female Ages
6~8 Ages 9~11
Ages 12~14
Ages 15~17
LAParticipationRate(%) 2.9% 4.0% 1.8% 2.1% 2.9% 2.3% 4.7% AveragePlayFrequency(peryear) 15.8 18.6 10.1 7.3 11.6 10.2 26.8
ProjectedNumberofPlayers(byRegion) North South East West Metro Total ParticipationRate(%) 1.4% 2.3% 2.2% 5.5% 7.5% 2.9% xAge6-17Population 398,601 308,547 492,268 175,242 141,409 1,516,067 =ProjectedPlayers* 5,614 7,098 10,745 9,691 10,578 44,481
Casual/Pick-up,20%
Organized(school),52%
Organized(outsideofschool),21%
Other,7%
TypeofWaterPoloPlayedAmongLACountyYouth
Publicfacility(park,pool,field,court),
34%
School,49%
College/University,8%
Private/Commercial…Privatenon-profit,
4%
Other,2%
WhereWaterPoloisPlayedAmongLACountyYouth
*Roundingmaycausedifferencesinprojectedplayerswhencomparingaggregatedregiontotalstototalparticipationrateand6-17population
*WaterPoloisnotincludedinthePhysicalActivityCouncil’snationalstudy.

LA84 Foundation Youth Sports Survey: Los Angeles County, 2016
©2016 LA84 Foundation 37
SportProfile:WATERPOLO
Profile Index Male 124 Female 72 Ages6~8 78 Ages9~11 94 Ages12~14 81 Ages15~17 150 White 157 Hispanic/Latino 81 Black/African-American 72 Asian/PacificIslander 0 <$50K 61 $50k~99k 85$100k+ 158
Male, 67%
Female,33%
Gender
6~8, 22%
9~11,24%
12~14,18%
15~17, 36%
Age
White,50%
Hispanic/Latino,39%
Black/African-American,9%
Asian/PacificIslander,0%Other,2%
Ethnicity
<$50k,20%
$50k~99k,30%
$100k+,50%
Income
Playersofthissportarerelativelymorelikelytobe:
• Male• Ages15to17• White• Moreaffluent
Howtoreadthistable: • Anindexof110meansplayersofthissportare
10%MORElikelytofallintothatgroup• Anindexof90meansplayersofthissportare
10%LESSlikelytofallintothatgroup

LA84 Foundation Youth Sports Survey: Los Angeles County, 2016
©2016 LA84 Foundation 38
WRESTLING
Total Male Female Ages
6~8 Ages 9~11
Ages 12~14
Ages 15~17
LAParticipationRate(%) 3.2% 4.8% 1.8% 1.4% 2.9% 2.7% 7.0% NationalParticipationRate(%) 1.5% 2.3% 0.5% 0.8% 1.4% 1.9% 2.5% AveragePlayFrequency(peryear) 35.7 45.1 10.7 4.6 49.6 13.3 46.5
ProjectedNumberofPlayers(byRegion) North South East West Metro Total ParticipationRate(%) 2.9% 3.2% 2.1% 4.7% 5.8% 3.2% xAge6-17Population 398,601 308,547 492,268 175,242 141,409 1,516,067 =ProjectedPlayers* 11,524 9,886 10,347 8,223 8,137 48,188
Casual/Pick-up,36%
Organized(school),53%
Organized(outsideofschool),3%
Other,8%
TypeofWrestlingPlayedAmongLACountyYouth
Publicfacility(park,
pool,field,court),19%
School,47%College/University,
2%
Private/Commercialfacility,3%
Privatenon-profit,14%
Other,16%
WhereWrestlingisPlayedAmongLACountyYouth
*Roundingmaycausedifferencesinprojectedplayerswhencomparingaggregatedregiontotalstototalparticipationrateand6-17population

LA84 Foundation Youth Sports Survey: Los Angeles County, 2016
©2016 LA84 Foundation 39
SportProfile:WRESTLING
Profile Index Male 135 Female 59 Ages6~8 48 Ages9~11 85 Ages12~14 76 Ages15~17 201 White 129 Hispanic/Latino 105 Black/African-American 53 Asian/PacificIslander 0 <$50K 31 $50k~99k 97$100k+ 175
Male, …
Female,27%
Gender
6~8, 14%
9~11,22%
12~14, 17%
15~17, 48%
Age
White,41%
Hispanic/Latino,51%
Black/African-American,7%
Asian/PacificIslander,0%Other,2%
Ethnicity
<$50k,10%
$50k~99k,34%
$100k+,55%
Income
Playersofthissportarerelativelymorelikelytobe:
• Male• Ages15to17• White• Moreaffluent
Howtoreadthistable: • Anindexof110meansplayersofthissportare
10%MORElikelytofallintothatgroup• Anindexof90meansplayersofthissportare
10%LESSlikelytofallintothatgroup

LA84 Foundation Youth Sports Survey: Los Angeles County, 2016
©2016 LA84 Foundation 40
SURFING
Total Male Female Ages
6~8 Ages 9~11
Ages 12~14
Ages 15~17
LAParticipationRate(%) 3.9% 5.0% 3.0% 2.2% 4.0% 5.1% 5.3% NationalParticipationRate(%) 1.4% 1.5% 1.2% 0.7% 1.2% 1.9% 1.7% AveragePlayFrequency(peryear) 18.2 17.5 19.4 10.1 11.3 33.5 15.9
PROFILE
ProjectedNumberofPlayers(byRegion) North South East West Metro Total ParticipationRate(%) 4.9% 2.9% 2.7% 5.1% 5.1% 3.9% xAge6-17Population 398,601 308,547 492,268 175,242 141,409 1,516,067 =ProjectedPlayers* 19,503 8,872 13,133 8,957 7,188 59,309
Profile Index Male 114 Female 83 Ages6~8 63 Ages9~11 98 Ages12~14 119 Ages15~17 128 White 206 Hispanic/Latino 45 Black/African-American 27 Asian/PacificIslander 35 <$50K 10 $50k~99k 112$100k+ 180
*Roundingmaycausedifferencesinprojectedplayerswhencomparingaggregatedregiontotalstototalparticipationrateand6-17population
Male,62%
Female,38%
Gender
6~8, 18%
9~11,25%
12~14,26%
15~17, 30%
Age
White,66%
Hispanic/Latino,22%
Black/African-American,3%
Asian/PacificIslander,2% Other,7%
Ethnicity<$50k,3%
$50k~99k,40%
$100k+,57%
Income
Playersofthissportarerelativelymorelikelytobe:
• Male• Ages15to17• White• Moreaffluent
Howtoreadthistable: • Anindexof110meansplayersofthissportare
10%MORElikelytofallintothatgroup• Anindexof90meansplayersofthissportare
10%LESSlikelytofallintothatgroup
**Type&LocationofParticipationwasnotaskedduetonatureofsport

LA84 Foundation Youth Sports Survey: Los Angeles County, 2016
©2016 LA84 Foundation 41
SKATEBOARDING
Total Male Female Ages
6~8 Ages 9~11
Ages 12~14
Ages 15~17
LAParticipationRate(%) 8.8% 13.8% 3.8% 6.6% 8.6% 8.8% 12.0% NationalParticipationRate(%) 6.9% 10.3% 3.0% 4.6% 6.7% 7.3% 5.8% AveragePlayFrequency(peryear) 90.2 95.2 72.5 74.2 88.6 93.9 102.1
PROFILE
ProjectedNumberofPlayers(byRegion) North South East West Metro Total ParticipationRate(%) 7.2% 9.9% 9.1% 8.6% 10.5% 8.8% xAge6-17Population 398,601 308,547 492,268 175,242 141,409 1,516,067 =ProjectedPlayers* 28,663 30,418 44,573 15,124 14,918 133,444
Profile Index Male 145 Female 48 Ages6~8 87 Ages9~11 93 Ages12~14 93 Ages15~17 129 White 86 Hispanic/Latino 107 Black/African-American 120 Asian/PacificIslander 48 <$50K 79 $50k~99k 90$100k+ 133
**Type&LocationofParticipationwasnotaskedduetonatureofsport
*Roundingmaycausedifferencesinprojectedplayerswhencomparingaggregatedregiontotalstototalparticipationrateand6-17population
Male, 78%
Female,22%
Gender
6~8, 25%
9~11,24%12~14,21%
15~17, 31%
Age
White,28%
Hispanic/Latino,52%
Black/African-American,15%
Asian/PacificIslander,3%
Other,3%
Ethnicity
<$50k,26%
$50k~99k,32%
$100k+,42%
Income
Playersofthissportarerelativelymorelikelytobe:
• Male• Ages15to17• Black/African-American• Moreaffluent
Howtoreadthistable: • Anindexof110meansplayersofthissportare
10%MORElikelytofallintothatgroup• Anindexof90meansplayersofthissportare
10%LESSlikelytofallintothatgroup

LA84 Foundation Youth Sports Survey: Los Angeles County, 2016
©2016 LA84 Foundation 42
SNOWBOARDING
Total Male Female Ages
6~8 Ages 9~11
Ages 12~14
Ages 15~17
LAParticipationRate(%) 3.3% 3.8% 2.7% 1.4% 2.1% 6.6% 4.1% NationalParticipationRate(%) 4.1% 5.8% 2.8% 1.6% 3.7% 5.0% 5.8% AveragePlayFrequency(peryear) 15.7 20.2 9.8 7.8 7.7 22.9 13.0
PROFILE
ProjectedNumberofPlayers(byRegion) North South East West Metro Total ParticipationRate(%) 3.4% 4.3% 1.7% 5.1% 3.1% 3.3% xAge6-17Population 398,601 308,547 492,268 175,242 141,409 1,516,067 =ProjectedPlayers* 13,593 13,181 8,357 8,957 4,340 49,424
Profile Index Male 106 Female 93 Ages6~8 49 Ages9~11 63 Ages12~14 191 Ages15~17 116 White 150 Hispanic/Latino 62 Black/African-American 34 Asian/PacificIslander 128 <$50K 4 $50k~99k 86$100k+ 216
*Roundingmaycausedifferencesinprojectedplayerswhencomparingaggregatedregiontotalstototalparticipationrateand6-17population
**Type&LocationofParticipationwasnotaskedduetonatureofsport
Male, 57% Female,43%
Gender
6~8, 14%
9~11,16%
12~14, 42%
15~17, 28%
Age
White,48%
Hispanic/Latino,30%
Black/African-American,4%
Asian/PacificIslander,8%
Other,10%
Ethnicity<$50k,1%
$50k~99k,30%
$100k+,69%
Income
Playersofthissportarerelativelymorelikelytobe:
• Male• Ages12to14• White• Moreaffluent
Howtoreadthistable: • Anindexof110meansplayersofthissportare
10%MORElikelytofallintothatgroup• Anindexof90meansplayersofthissportare
10%LESSlikelytofallintothatgroup

LA84 Foundation Youth Sports Survey: Los Angeles County, 2016
©2016 LA84 Foundation 43
TENNIS
Total Male Female Ages
6~8 Ages 9~11
Ages 12~14
Ages 15~17
LAParticipationRate(%) 10.6% 8.9% 12.3% 10.5% 11.0% 13.0% 8.2% NationalParticipationRate(%) 8.2% 8.7% 8.1% 5.2% 8.1% 8.5% 10.7% AveragePlayFrequency(peryear) 34.4 32.8 35.4 31.2 22.0 47.9 40.4
ProjectedNumberofPlayers(byRegion) North South East West Metro Total ParticipationRate(%) 6.6% 9.5% 7.1% 14.2% 31.3% 10.6% xAge6-17Population 398,601 308,547 492,268 175,242 141,409 1,516,067 =ProjectedPlayers* 26,299 29,404 35,022 24,816 44,213 160,627
Casual/Pick-up,42%
Organized(school),29%
Organized(outsideofschool),30%
TypeofTennisPlayedAmongLACountyYouth
Publicfacility(park,pool,field,court),
32%
School,31%
College/University,10%
Private/Commercialfacility,17%
Privatenon-profit,10%
WhereTennisisPlayedAmongLACountyYouth
*Roundingmaycausedifferencesinprojectedplayerswhencomparingaggregatedregiontotalstototalparticipationrateand6-17population

LA84 Foundation Youth Sports Survey: Los Angeles County, 2016
©2016 LA84 Foundation 44
SportProfile:TENNIS
Profile Index Male 79 Female 125 Ages6~8 109 Ages9~11 99 Ages12~14 112 Ages15~17 79 White 134 Hispanic/Latino 84 Black/African-American 41 Asian/PacificIslander 147 <$50K 35 $50k~99k 94$100k+ 175
Male, 43%
Female,57%
Gender
6~8, 31%
9~11,26%
12~14, 25%
15~17, 19%
Age
White,43%
Hispanic/Latino,41%
Black/African-American,5%
Asian/PacificIslander,9% Other,3%Ethnicity
<$50k,12%
$50k~99k,33%$100k+,56%
Income
Playersofthissportarerelativelymorelikelytobe:
• Female• Ages12to14• Asian/PacificIslander• Moreaffluent
Howtoreadthistable: • Anindexof110meansplayersofthissportare
10%MORElikelytofallintothatgroup• Anindexof90meansplayersofthissportare
10%LESSlikelytofallintothatgroup

LA84 Foundation Youth Sports Survey: Los Angeles County, 2016
©2016 LA84 Foundation 45
TRACK&FIELD
Total Male Female Ages
6~8 Ages 9~11
Ages 12~14
Ages 15~17
LAParticipationRate(%) 9.5% 10.6% 7.5% 4.2% 9.1% 14.0% 11.7% NationalParticipationRate(%) 4.5% 5.0% 3.9% 1.7% 3.0% 6.5% 7.6% AveragePlayFrequency(peryear) 35.2 31.0 40.2 16.7 30.2 44.5 40.0
ProjectedNumberofPlayers(byRegion) North South East West Metro Total ParticipationRate(%) 8.6% 13.0% 8.7% 6.7% 10.9% 9.5% xAge6-17Population 398,601 308,547 492,268 175,242 141,409 1,516,067 =ProjectedPlayers* 34,277 40,051 42,583 11,747 15,461 144,565
Casual/Pick-up,17%
Organized(school),69%
Organized(outsideofschool),13%
Other,1%
TypeofTrack&FieldPlayedAmongLACountyYouth
Publicfacility(park,pool,field,court),
13%
School,69%
College/University,9%
Private/Commercial…
Privatenon-profit,0% Other,2%
WhereTrack&FieldisPlayedAmongLACountyYouth
*Roundingmaycausedifferencesinprojectedplayerswhencomparingaggregatedregiontotalstototalparticipationrateand6-17population

LA84 Foundation Youth Sports Survey: Los Angeles County, 2016
©2016 LA84 Foundation 46
SportProfile:TRACK&FIELD
Profile Index Male 103 Female 97 Ages6~8 53 Ages9~11 98 Ages12~14 142 Ages15~17 120 White 88 Hispanic/Latino 97 Black/African-American 123 Asian/PacificIslander 117 <$50K 93 $50k~99k 93$100k+ 116
Male, 55% Female,45%
Gender
6~8, 15%
9~11,25%
12~14, 32%
15~17, 28%
Age
White,28%
Hispanic/Latino,47%
Black/African-American,15%
Asian/PacificIslander,7% Other,3%
Ethnicity
<$50k,31%
$50k~99k,33%
$100k+,37%
Income
Playersofthissportarerelativelymorelikelytobe:
• Male• Ages12to14• Black/African-American• Moreaffluent
Howtoreadthistable: • Anindexof110meansplayersofthissportare
10%MORElikelytofallintothatgroup• Anindexof90meansplayersofthissportare
10%LESSlikelytofallintothatgroup

LA84 Foundation Youth Sports Survey: Los Angeles County, 2016
©2016 LA84 Foundation 47
RUNNING
Total Male Female Ages
6~8 Ages 9~11
Ages 12~14
Ages 15~17
LAParticipationRate(%) 16.5% 16.9% 15.3% 13.6% 18.1% 15.4% 18.3% NationalParticipationRate(%) 20.2% 20.2% 20.2% 14.7% 16.2% 22.5% 27.7% AveragePlayFrequency(peryear) 53.9 44.2 64.4 39.0 40.2 72.5 68.9
ProjectedNumberofPlayers(byRegion) North South East West Metro Total ParticipationRate(%) 11.7% 21.1% 16.5% 17.7% 18.2% 16.5% xAge6-17Population 398,601 308,547 492,268 175,242 141,409 1,516,067 =ProjectedPlayers* 46,688 65,146 81,187 30,983 25,768 249,590
Casual/Pick-up,42%
Organized(school),47%
Organized(outsideofschool),9%
Other,2%
TypeofRunningPlayedAmongLACountyYouth
Publicfacility(park,pool,field,court),
34%
School,46%
College/University,5%
Private/Commercialfacility,4%
Privatenon-profit,5% Other,6%
WhereRunningisPlayedAmongLACountyYouth
*Roundingmaycausedifferencesinprojectedplayerswhencomparingaggregatedregiontotalstototalparticipationrateand6-17population

LA84 Foundation Youth Sports Survey: Los Angeles County, 2016
©2016 LA84 Foundation 48
SportProfile:RUNNING
Profile Index Male 95 Female 106 Ages6~8 94 Ages9~11 106 Ages12~14 92 Ages15~17 108 White 112 Hispanic/Latino 83 Black/African-American 102 Asian/PacificIslander 152 <$50K 112 $50k~99k 82$100k+ 108
Male, 51% Female,49%
Gender
6~8, 27%
9~11,27%12~14,20%
15~17,26%
Age
White,36%
Hispanic/Latino,40%
Black/African-American,13%
Asian/PacificIslander,9% Other,2%
Ethnicity
<$50k,37%
$50k~99k,29%
$100k+,34%
Income
Playersofthissportarerelativelymorelikelytobe:
• Female• Ages15to17• Asian/PacificIslander• Parentincomebelow$50k
Howtoreadthistable: • Anindexof110meansplayersofthissportare
10%MORElikelytofallintothatgroup• Anindexof90meansplayersofthissportare
10%LESSlikelytofallintothatgroup
LA84 Foundation Youth Sports Survey: Los Angeles County, 2016
©2016 LA84 Foundation 49
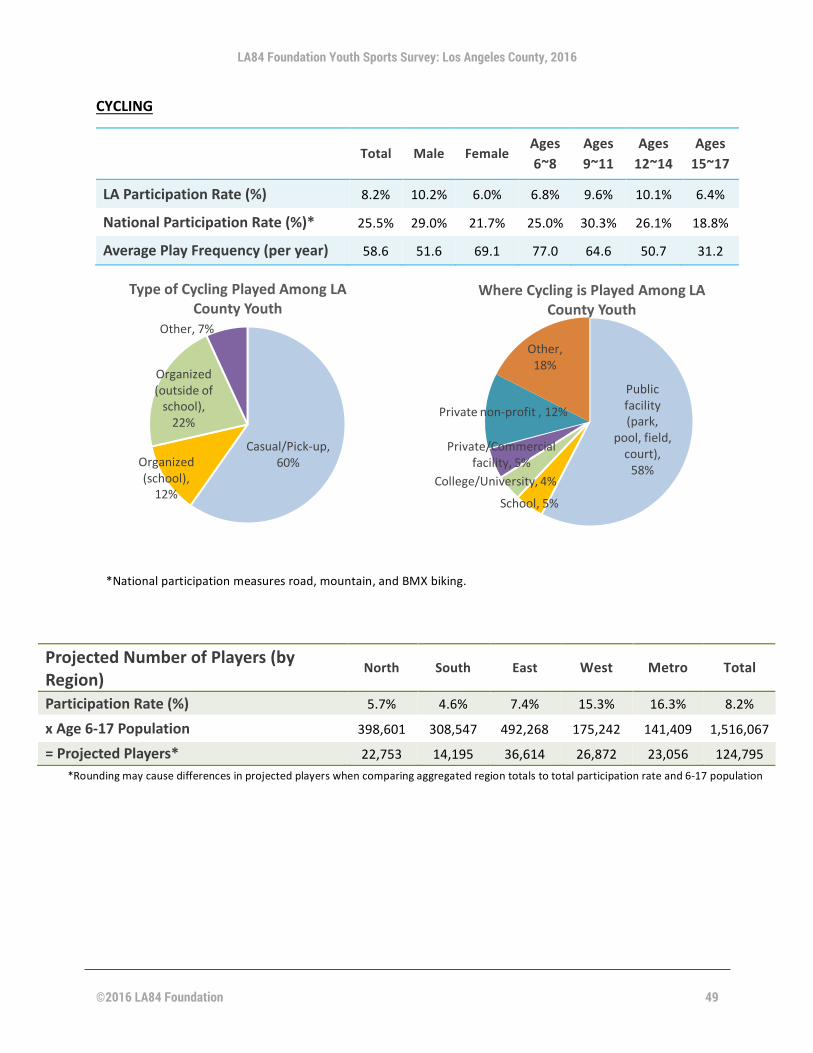
CYCLING
Total Male Female Ages
6~8 Ages 9~11
Ages 12~14
Ages 15~17
LAParticipationRate(%) 8.2% 10.2% 6.0% 6.8% 9.6% 10.1% 6.4% NationalParticipationRate(%)* 25.5% 29.0% 21.7% 25.0% 30.3% 26.1% 18.8% AveragePlayFrequency(peryear) 58.6 51.6 69.1 77.0 64.6 50.7 31.2
ProjectedNumberofPlayers(byRegion) North South East West Metro Total ParticipationRate(%) 5.7% 4.6% 7.4% 15.3% 16.3% 8.2% xAge6-17Population 398,601 308,547 492,268 175,242 141,409 1,516,067 =ProjectedPlayers* 22,753 14,195 36,614 26,872 23,056 124,795
Casual/Pick-up,60%Organized
(school),12%
Organized(outsideofschool),22%
Other,7%
TypeofCyclingPlayedAmongLACountyYouth
Publicfacility(park,
pool,field,court),58%
School,5%
College/University,4%
Private/Commercialfacility,5%
Privatenon-profit,12%
Other,18%
WhereCyclingisPlayedAmongLACountyYouth
*Roundingmaycausedifferencesinprojectedplayerswhencomparingaggregatedregiontotalstototalparticipationrateand6-17population
*Nationalparticipationmeasuresroad,mountain,andBMXbiking.

LA84 Foundation Youth Sports Survey: Los Angeles County, 2016
©2016 LA84 Foundation 50
SportProfile:CYCLING
Profile Index Male 113 Female 85 Ages6~8 94 Ages9~11 115 Ages12~14 119 Ages15~17 74 White 178 Hispanic/Latino 51 Black/African-American 70 Asian/PacificIslander 98 <$50K 63 $50k~99k 105$100k+ 133
Male, 61%
Female,39%
Gender
6~8, 27%
9~11,30%
12~14,26%
15~17,18%
Age
White,57%Hispanic/Latino,25%
Black/African-American,9%
Asian/PacificIslander,6%Other,4%
Ethnicity
<$50k,21%
$50k~99k,37%
$100k+,42%
Income
Playersofthissportarerelativelymorelikelytobe:
• Male• Ages12to14• White• Moreaffluent
Howtoreadthistable: • Anindexof110meansplayersofthissportare
10%MORElikelytofallintothatgroup• Anindexof90meansplayersofthissportare
10%LESSlikelytofallintothatgroup

LA84 Foundation Youth Sports Survey: Los Angeles County, 2016
©2016 LA84 Foundation 51
RUGBY
Total Male Female Ages
6~8 Ages 9~11
Ages 12~14
Ages 15~17
LAParticipationRate(%) 0.9% 1.2% 0.8% 0.5% 0.2% 1.7% 1.8% NationalParticipationRate(%) 0.6% 0.8% 0.4% 0.5% 0.5% 0.7% 0.6% AveragePlayFrequency(peryear) 9.0 6.4 12.5 5.3 8.0 4.7 15.3
ProjectedNumberofPlayers(byRegion) North South East West Metro Total ParticipationRate(%) 0.0% 0.8% 0.6% 1.9% 3.7% 0.9% xAge6-17Population 398,601 308,547 492,268 175,242 141,409 1,516,067 =ProjectedPlayers* 0 2,535 2,786 3,377 5,289 13,592
Casual/Pick-up,21%
Organized(school),54%
Organized(outsideofschool),20%
Other,6%
TypeofRugbyPlayedAmongLACountyYouth
Publicfacility(park,pool,field,
court),43%
School,15%
College/University,32%
Private/Commercialfacility,10%
Privatenon-profit
,0%
WhereRugbyisPlayedAmongLACountyYouth
*Roundingmaycausedifferencesinprojectedplayerswhencomparingaggregatedregiontotalstototalparticipationrateand6-17population

LA84 Foundation Youth Sports Survey: Los Angeles County, 2016
©2016 LA84 Foundation 52
SportProfile:RUGBY
Profile Index Male 109 Female 90 Ages6~8 60 Ages9~11 17 Ages12~14 166 Ages15~17 176 White 199 Hispanic/Latino 57 Black/African-American 28 Asian/PacificIslander 0 <$50K 13 $50k~99k 167$100k+ 116
Male, 59%
Female,41%
Gender
6~8, 17%
9~11,4%
12~14, 37%
15~17, 42%
Age
White,64%
Hispanic/Latino,28%
Black/African-American,3%
Asian/PacificIslander,0% Other,5%Ethnicity
<$50k,4%
$50k~99k,59%
$100k+,37%
Income
Playersofthissportarerelativelymorelikelytobe:
• Male• Ages15to17• White• Parentwithincomebetween$50k
and$99k
Howtoreadthistable: • Anindexof110meansplayersofthissportare
10%MORElikelytofallintothatgroup• Anindexof90meansplayersofthissportare
10%LESSlikelytofallintothatgroup

LA84 Foundation Youth Sports Survey: Los Angeles County, 2016
©2016 LA84 Foundation 53
Media
48% 37% 32% 25% 24%
4%
26%
20% 21% 22% 18%
4%
22% 40% 41% 46% 52%
59%
4% 4% 5% 7% 7%
33%
0% 10% 20% 30% 40% 50% 60% 70% 80% 90%
100%
Youtube Facebook Instagram Snapchat Twitter Other
FrequencyofSocialMediaUsageAmongLACountyYouth
Don'tknow/Notsure
Never
Occasionally
Regularly
29% 20% 18% 17% 17% 15% 14% 14%
2%
21% 25%
24% 23% 22% 24% 22% 25%
2%
45% 49%
49% 53% 52% 51% 54% 53%
60%
6% 5% 9% 7%
10% 11% 10% 9%
36%
0% 10% 20% 30% 40% 50% 60% 70% 80% 90% 100%
ESPN(website/magazine)FoxSports.com
ProleaguewebsiteSportsIllustrated(website/magazine)
GeneralnewspublicationsIndividualathletewebsite
Associationwebsite/magazineNBCSports.com
Other
FrequencyofWebsite/PublicationUsageAmongLACountyYouth
Regularly Occasionally Never Don'tknow/Notsure

LA84 Foundation Youth Sports Survey: Los Angeles County, 2016
©2016 LA84 Foundation 54
P.E./PhysicalActivityClasses
85% 86% 84% 78% 89% 93%
83%
11% 11% 11% 15% 8% 7%
15% 3% 2% 5% 7% 3% 1% 2%
0% 10% 20% 30% 40% 50% 60% 70% 80% 90%
100%
Allyouth Male Female 6~8 9~11 12~14 15~17
LACountyYouthP.E.EnrollmentStatus(Age&Gender)
NotsureNoYes
82%
89%
94%
76%
79%
15%
7%
6%
18%
21%
2%
4%
6%
0% 20% 40% 60% 80% 100%
White
Hispanic/Latino
Black/African-American
Asian/PacificIslander
Other
LACountyYouthP.E.EnrollmentStatus(Race/Ethnicity)Yes No Notsure
85% 87% 85%
8% 11% 14% 8% 2% 1%
0%
50%
100%
<$50k $50~99k $100k+
LACountyYouthP.E.EnrollementStatus(HouseholdIncome)
Notsure
No
Yes

LA84 Foundation Youth Sports Survey: Los Angeles County, 2016
©2016 LA84 Foundation 55
83% 91% 82% 85% 90%
15% 8% 11% 13% 8% 2% 1% 7% 2%
0%
50%
100%
North South East West Metro
LACountyYouthP.E.EnrollmentStatus(Region)
31% 34% 27% 46%
32% 20% 23%
69% 66% 73% 54%
68% 80% 77%
0%
20%
40%
60%
80%
100%
Allyouth Male Female 6~8 9~11 12~14 15~17
FrequencyofP.E.ClassAmongLACountyYouth(thoseenrolled)Onceaweek Morethanonceaweek
39%
26%
29%
26%
5%
61%
74%
71%
74%
95%
0% 10% 20% 30% 40% 50% 60% 70% 80% 90% 100%
White
Hispanic/Latino
Black/African-American
Asian/PacificIslander
Other
LACountyFrequencyofP.E.ClassbyRace/Ethnicity(thoseenrolled)
Onceaweek Morethanonceaweek

LA84 Foundation Youth Sports Survey: Los Angeles County, 2016
©2016 LA84 Foundation 56
27% 32% 33%
73% 68% 67%
0%
20%
40%
60%
80%
100%
<$50k $50~99k $100k+
FrequencyofP.E.ClassbyHouseholdIncomeOnceaweek Morethanonceaweek
20% 30% 27% 38% 56%
80% 70% 73% 62% 44%
0%
20%
40%
60%
80%
100%
North South East West Metro
FrequencyofP.E.ClassbyRegion(thoseenrolled)Onceaweek Morethanonceaweek

LA84 Foundation Youth Sports Survey: Los Angeles County, 2016
©2016 LA84 Foundation 57
SpecialNeedsChildren
10% 12% 7% 6% 12% 9% 11%
90% 88% 93% 94% 88% 91% 89%
0%
20%
40%
60%
80%
100%
Allyouth Male Female 6~8 9~11 12~14 15~17
"Isyourchildconsideredaspecialneedsstudent?"Yes No
16%
6%
2%
4%
0%
85%
94%
98%
97%
100%
0% 10% 20% 30% 40% 50% 60% 70% 80% 90% 100%
White
Hispanic/Latino
Black/African-American
Asian/PacificIslander
Other
"Isyourchildconsideredaspecialneedsstudent?"(byRace/Ethnicity)
Yes No
10% 6% 14%
91% 94% 86%
0%
100%
<$50k $50~99k $100k+
"Isyourchildconsideredaspecialneedsstudent?"(byHouseholdIncome)
Yes No

LA84 Foundation Youth Sports Survey: Los Angeles County, 2016
©2016 LA84 Foundation 58
31% 32% 27%
61%
28% 17% 25%
42% 44% 39%
36%
45%
33%
50%
27% 24% 34%
3%
27%
50%
25%
0% 10% 20% 30% 40% 50% 60% 70% 80% 90%
100%
Allyouth Male Female 6~8 9~11 12~14 15~17
TypeofDisability/DisabilitiesAmongLACountyYouth(thosewithdisabilities)
Physical Intellectual/emotional Both
18% 33%
10%
56% 46%
66% 57%
20%
11% 14%
16% 10%
70%
33% 40%
0%
20%
40%
60%
80%
100%
North South East West Metro
TypeofDisability/DisabilitiesAmongLACountyYouth(thosewithdisabilities)byRegion
Physical Intellectual/emotional Both

LA84 Foundation Youth Sports Survey: Los Angeles County, 2016
©2016 LA84 Foundation 59
HouseholdAdults:PhysicalFitnessStatus
• Householdswithadultseitheroccasionallyparticipatingornotparticipatingatallinphysicalactivitiesweremorelikelytohavechildrenthatdidnotplayasportinthepastyear.
50% 53% 46% 57%
47% 39% 34%
53% 45%
60% 45%
53% 56%
40% 40% 39%
36% 41%
50% 40%
47% 45%
30%
40% 39%
43%
10% 7% 14% 7% 11% 11% 25%
0% 10% 10% 15% 8% 1%
0%
10%
20%
30%
40%
50%
60%
70%
80%
90%
100%
Total Male Female White Hispanic Black Asian Other North South East West Metro
Howoftendotheadultsinthehouseparticipateinphysicalactivity/sports?
Regularly Occasionally Never

LA84 Foundation Youth Sports Survey: Los Angeles County, 2016
©2016 LA84 Foundation 60
YouthProfile
Male, 54% Female,46%
Gender
6~8, 29%
9~11,26%12~14,22%
15~17,24%
Age
White,32%
Hispanic,49%
Black/African-American,12%
Asian/PacificIslander,6%
Other,1%
Race/Ethnicity
North,26%
South,20%
East, 31%
West, 13%
Metro,11%
Region
<$50k,33%
$50-99k,35%
$100k+,32%
HouseholdIncome
AverageAge:11years’old

LA84 Foundation Youth Sports Survey: Los Angeles County, 2016
©2016 LA84 Foundation 61
52% 57% 48% 58%
48% 43% 52% 42%
0%
50%
100%
6~8 9~11 12~14 15~17
Age(byGender)Male Female
54% 57% 53%
46% 43% 47%
0%
20%
40%
60%
80%
100%
<$50k $50~99k $100k+
HouseholdIncome(byGender)Male Female

LA84 Foundation Youth Sports Survey: Los Angeles County, 2016
©2016 LA84 Foundation 62
Respondent(Adult)Profile
Male, 45% Female,55%
Gender
24orunder,7%
25~34, 35%
35~44, 37%
45~54, 18%
55~64, 3% 65+, 0%
Parent(Respondent)Age
White,32%
Hispanic,49%
Black/African-American,12%
Asian/PacificIslander,6% Other,1%
Race/Ethnicity
30%
24%
17%
14%
8%
4%
3%
0%
0% 5% 10% 15% 20% 25% 30% 35%
Bachelor'sdegree
Somecollege,nodegree
Post-Graduatedegree(MA,MS,MBA,MD,JD,PhD)
Highschoolgraduate
Associatedegree-occupational/vocational…
Associatedegree- academicprogram
Somehighschool
Gradeschoolorless
EducationLevelofParent
9%
10%
14%
18%
18%
21%
6%
4%
0% 5% 10% 15% 20% 25%
Lessthan$25,000
$25,000~$34,999
$35,000~$49,999
$50,000~$74,999
$75,000~$99,999
$100,000~$149,999
$150,000~$199,999
$200,000ormore
Income
59%ofhouseholdsrepresentedcontainedatleastoneparentattainingaminimumofanassociate’sdegree.
Averagehouseholdincome:$83,702
LA84 Foundation Youth Sports Survey: Los Angeles County, 2016
©2016 LA84 Foundation 63
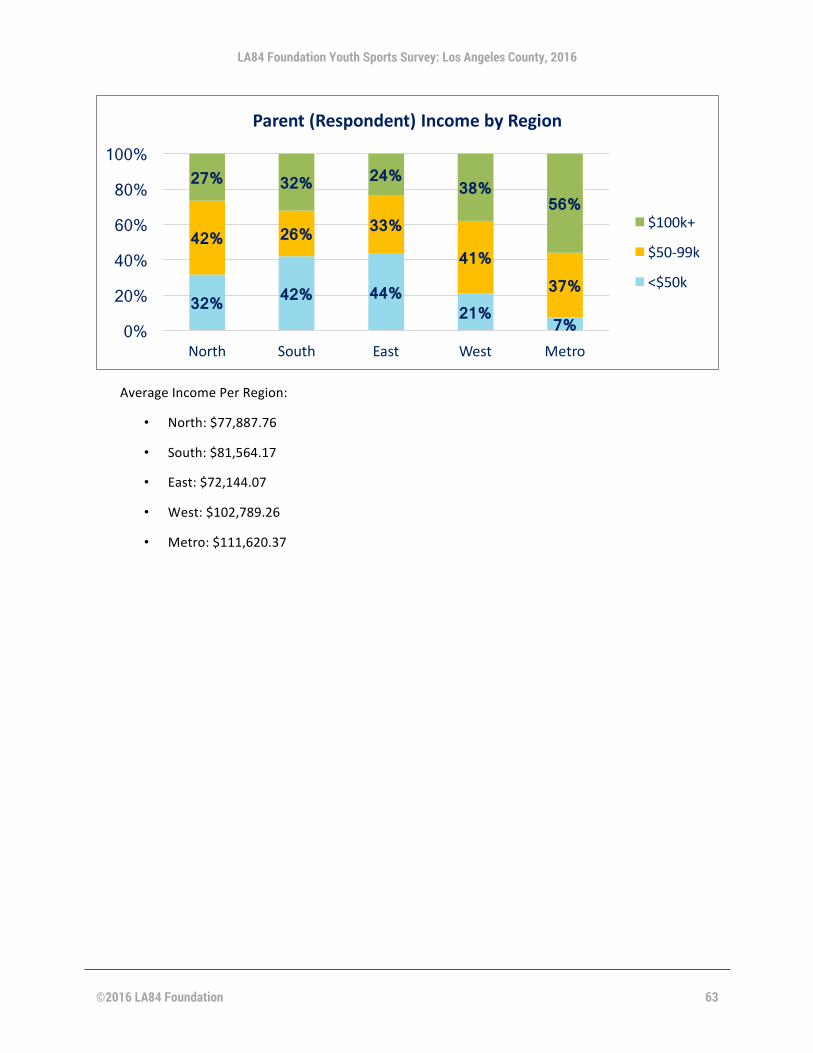
AverageIncomePerRegion:
• North:$77,887.76
• South:$81,564.17
• East:$72,144.07
• West:$102,789.26
• Metro:$111,620.37
32% 42% 44% 21% 7%
42% 26% 33%
41% 37%
27% 32% 24% 38%
56%
0%
20%
40%
60%
80%
100%
North South East West Metro
Parent(Respondent)IncomebyRegion
$100k+
$50-99k
<$50k

LA84 Foundation Youth Sports Survey: Los Angeles County, 2016
©2016 LA84 Foundation 64
Using Sports Marketing Surveys Data:
Disclaimer: While proper due care and diligence has been taken in the preparation of this document, Sports Marketing Surveys cannot guarantee the accuracy of the information contained and does not accept any liability for any loss or damage caused as a result of using information or recommendations contained within this document.
6650WestIndiantownRoad,Suite220 Jupiter,FL33458 p:561.427.0647 f:561.427.0678
e:[email protected] www.sportsmarketingsurveysusa.com
AboutSportsMarketingSurveys:Since1985,SportsMarketingSurveyshadledthewayinbeingtheinformed,experiencedanduniquelypositionedsourcetoassistwithanycustomresearchprojects.Weunderstandthepressuresandconstraintsbeingputonyourbudgetsandwecandesignamethodologythatgetsyoutheanswersyouneed,atacostthatyourbudgetscanlivewith.Whetherit’sadealerstudytogetsomefeedbackfromyourretailpartnersoraninternetbasedconsumerstudytomeasurethestrengthofyourbrandamongthechangingAmericanconsumer,SportsMarketingSurveysconductsquantitativeandqualitativemarketingresearchandinformationformanyoftheleadingmanufacturersandorganizationsthroughouttheindustry.
AboutLA84Foundation:Asalegacyofthe1984OlympicGames,theLA84Foundationcontinuestobeanationallyrecognizedleaderinsupportofyouthsportprogramsandelevatingtheimportanceofsportsinpositiveyouthdevelopment.LA84seekstoprovideanopportunityforeverychildtoparticipateinsportsandexperiencethewiderangeofpositiveoutcomesassociatedwithyouthsportparticipation.Sinceitslaunchin1985,LA84hasinvestedmillionsinthecommunitiesthatsupportedtheGames,reachingmorethan3millionyouththroughoutSouthernCalifornia,fromSantaBarbaratoSanDiegoCounty.TheLA84Foundationcontinuestopromotethespiritofthe1984OlympicGamesbyconveningandengaginglocal,nationalandinternationalaudiencesabouttheroleofsportinsociety,andtheimpactoftheOlympicGamesonhostcities,especiallyaswelookaheadtothe2024Games.LA84’sheadquartersislocatedinthehistoricBrittHouseneardowntownLosAngeles,whereithousesmeetingfacilitiesandtheworld’spremiersportslibrary.Formoreinformation,pleasevisitwww.la84.org.