L.A. Lesmana Department of Medicine, University of Indonesia, Jakarta.
30
L.A. Lesmana Department of Medicine, University of Indonesia , Jakarta HEPATITIS VIRAL INFECTION and NON-ALCOHOLIC FATTY LIVER DISEASE (NAFLD) : AN UPDATE
-
Upload
tania-gradwell -
Category
Documents
-
view
220 -
download
1
Transcript of L.A. Lesmana Department of Medicine, University of Indonesia, Jakarta.

L.A. LesmanaDepartment of Medicine, University of Indonesia , Jakarta
HEPATITIS VIRAL INFECTION and NON-ALCOHOLIC FATTY LIVER DISEASE
(NAFLD) : AN UPDATE

NALFD – AASLD definition 2012 Evidence of hepatic steatosis, by imaging or
by histology,No causes for secondary hepatic fat
accumulation
Chalasani N, et al. Gastroenterology 2012;142:1592-1609.

Prevalence of NAFLD in the Asia-Pacific region
Country Percentage of NAFLD
Japan 9 – 30%China 5 – 18%Korea 18 %India 5 – 28%Indonesia 30%Malaysia 17 %Singapore 5%
Amarapurkar. Asia Pacific Working Party on NAFLD 2006
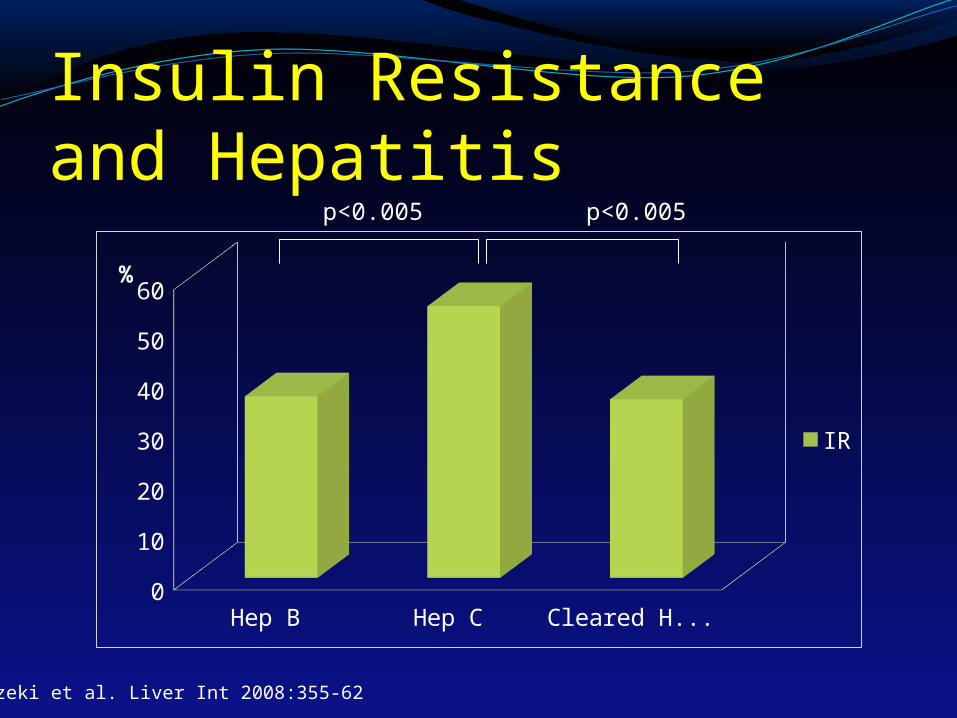
Insulin Resistance and Hepatitis
Hep B Hep C Cleared Hep C
0
10
20
30
40
50
60
IR
%
p<0.005 p<0.005
Imazeki et al. Liver Int 2008:355-62

Chronic Hepatitis B (CHB) and NAFLDCurrent Evidence
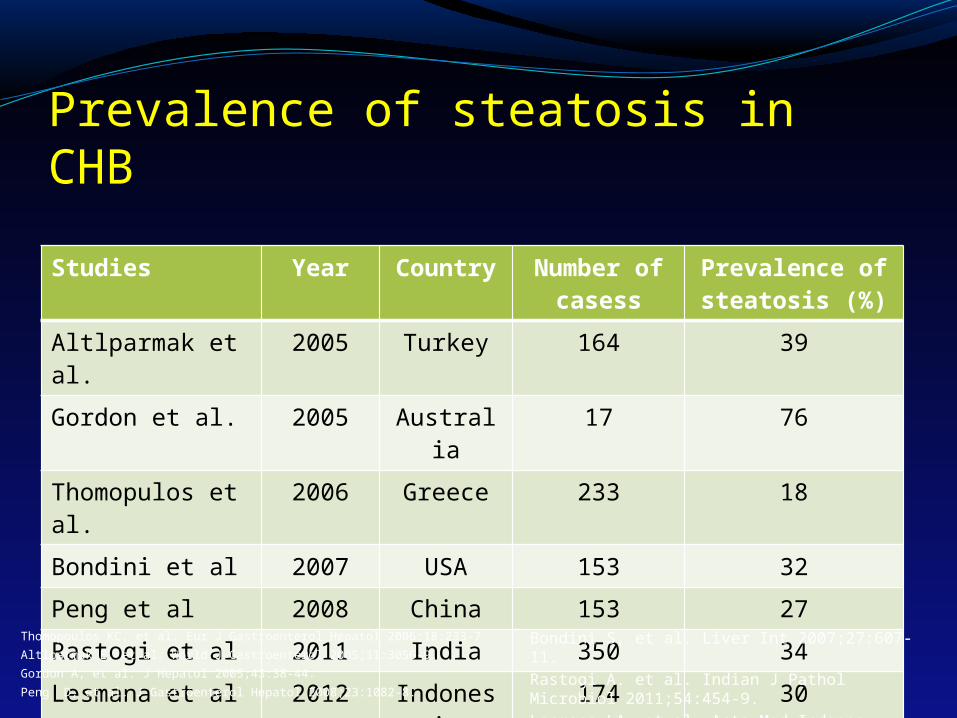
Prevalence of steatosis in CHBStudies Year Country Number of
casessPrevalence of steatosis (%)
Altlparmak et al.
2005 Turkey 164 39
Gordon et al. 2005 Australia 17 76
Thomopulos et al.
2006 Greece 233 18
Bondini et al 2007 USA 153 32
Peng et al 2008 China 153 27
Rastogi et al 2011 India 350 34
Lesmana et al 2012 Indonesia
174 30Thomopoulos KC, et al. Eur J Gastroenterol Hepatol 2006;18:233-7Altlparmak E, et al. World J Gastroenterol 2005;11:3056-9.Gordon A, et al. J Hepatol 2005;43:38-44.Peng D, et al. J Gastroenterol Hepatol 2008;23:1082-8.
Bondini S, et al. Liver Int 2007;27:607-11.Rastogi A. et al. Indian J Pathol Microbiol 2011;54:454-9.Lesmana LA, et al. Acta Med Indones 2012;44:35-9.

Factors associated with FL in CHBFatty Liver (-)
(n=100)Fatty Liver (+)
(n=64)p-value
Mean age (years) 33.2 + 11.70 37.9 + 10.09 0.006
Mean BMI (kg/m2) 25.3 + 3.93 27.8 + 3.70 0.000
Male sex, n(%) 60 (53.1) 53 (46.9) 0.008
Mean AST (U/L) 76.5 + 56.14 70.0 + 54.61 0.469
Mean ALT (U/L) 131.6 + 109.39 113.5 + 68.19 0.686
Mean cholesterol (mg/dL) 162.2 + 38.8) 184.9 + 34.5 0.000
Mean triglyceride (mg/dL) 102.5 + 44.66 133.7 + 65.96 0.004
HBeAg positive, n(%) 42 (41.4) 17 (27.0) 0.059
Mean viral load (pg/mL) 1,628.24 781.55 0.067
Fibrosis stage 2-3, n(%) 20 (20) 11 (17.2) 0.754
HAI 9-17, n(%) 36 (36) 23 (35.9) 0.772
Altlrmak E , et al. World J Gastroenterol 2005;11:3056-9.

Insulin Resistance in CHBHOMA-IR
<1.64(n=35)
HOMA-IR > 1.64
(n=34)
p-value
Mean BMI (kg/m2) 21.8 + 3.7 24.0 + 4.4 0.029
Mean waist circumference (cm)
80.1 + 8.6 85.1 + 10.2 0.089
Median triglyceride (mg/dL) 90.0 110.0 0.016
Median fasting insulin (μU/mL)
5.0 11.7 <0.001
Fasting glucose (mg/dL) 85 53 <0.001
Fibrosis F2-F4, n(%) 21 (60.0) 15 (54.2) 0.232
HAI >6, n(%) 11 (31.4) 10 (29.4) 0.717
Steatosis grade 1-2 20 (57.2) 21 (61.8) 0.873
Median HBV-DNA (log copies/mL)
5.14 6.2 0.324
HBeAg positive, n(%) 13 (37.1) 13 (38.2) 1.000Kumar M, et al. Am J Gastroenterol 2009;104:76-82.

Demographic FactorsVariable Steatosis (+)
(n=118)Steatosis (-)
(n=232)p value
Mean age 35.5 + 10.5 27.9 + 14.0 <0.001
Male : Female 108 : 10 192 : 40 0.045
Rastogi A. et al. Indian J Pathol Microbiol 2011;54:454-9.
Variable Steatosis (+)
(n=52)
Steatosis (-)
(n=122)
p value OR(95%CI)
Mean age 42.6 + 10.5
40.0 + 11.2 0.150 -
Male : Female (%)
73.1 : 26.9 49.2 : 50.8 0.004 2.81 (1,38-5,69)
Medistra Hospital. Unpublished data 2007-2009

Biochemical and Viral FactorsVariable Steatosis
(+)(n=118)
Steatosis (-)(n=232)
p value
Median ALT (U/mL) 62 68 0.620
HBeAg positive (%) 48.8 57.2 0.106
Median DNA (copies/mL)
69 x 104 750 x 104 0.025
HBV genotypes (n=80):ABCDA+CA+DA+C+D
12.6%00
81.2%3.1%3.1%
0
14.5%2.1%2.1%64.6%2.1%12.5%2.1%
0.567
Rastogi A. et al. Indian J Pathol Microbiol 2011;54:454-9.

Metabolic Parameters Variable Steatosis
(+)(n=118)
Steatosis (-)(n=232)
p value
Mean BMI (kg/m2) 25.2 + 4.8 20.4 + 3.5 <0.01
Mean FBS (mg/dL) 94.1 + 19.6 86.9 + 13.9 0.091
Mean TG (mg/dL) 138.8 + 62.1 88.0 + 27.9 0.002
Mean cholesterol (mg/dL)
171.8 + 43.5 139.3 + 37.6 0.017
Mean insulin (IU/L) 13.0 + 9.1 9.1 + 6.0 0.027
Median HOMA-IR 2.7 (0.96-11.75)
1.9 (0.19-6.7) 0.048
Rastogi A. et al. Indian J Pathol Microbiol 2011;54:454-9.
BMI: body mass index; FBS: fasting blood sugar; TG: triglycerides;HOMA-IR: Homeostatic Model of Assessment – Insulin Resistance

Histological Features
Rastogi A. et al. Indian J Pathol Microbiol 2011;54:454-9.
Variable Steatosis (+)(n=118)
Steatosis (-)(n=232)
p value
Mean HAI score 4.8 + 2.6 4.5 + 2.9 0.286
Mean fibrosis score 1.7 + 1.1 1.5 + 1.1 0.170
HAI: histological activity index

Data in Medistra HospitalVariable Steatosis
(+)(n=118)
Steatosis (-)(n=232)
p value
Mean BMI (kg/m2) 25.1 + 3.7 22.7 + 3.3 <0.001
Waist circumference (cm)
88.3 + 11.0 79.0 + 10.1 <0.001
Mean ALT (U/L) 49.8 + 26.7 71.7 + 102.9 0.132
Log HBV-DNA (copies/mL)
5.92 + 1.99 6.07 + 2.08 0.675
Liver stiffness (kPa) 8.3 + 6.3 9.5 + 10.2 0.468
HBeAg-positive (%) 42.3 45.1 0.736
Genotype C (%) 32.4 19.8 0.138
Lesmana LA, et al. Acta Med Indones 2012;44:35-9.
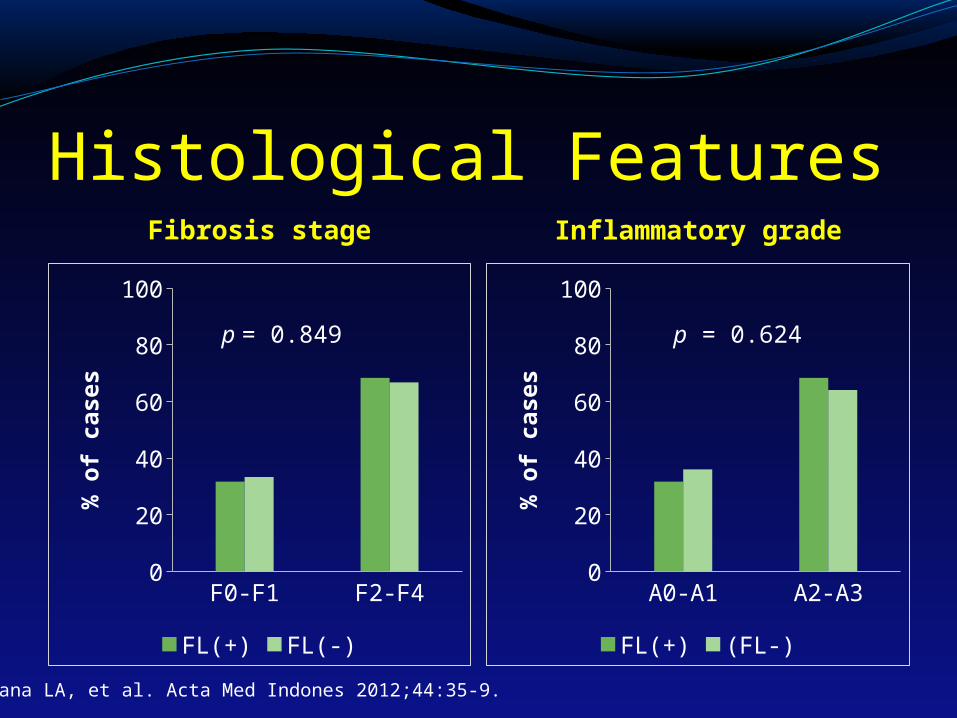
Histological FeaturesFibrosis stage Inflammatory grade
F0-F1 F2-F40
102030405060708090
100
FL(+) FL(-)
% o
f case
s
A0-A1 A2-A30
20
40
60
80
100
FL(+) (FL-)
% o
f case
s
p = 0.849 p = 0.624
Lesmana LA, et al. Acta Med Indones 2012;44:35-9.

Predictors of Steatosis in CHBCountr
yN Steatos
isPredictors
Altlparmak, et al (2005)
Turkey 164
39% Older age, BMI, high cholesterol and triglyceride
Gordon, et al (2005) Australia
17 76% Waist circumference, FPG, C-peptide
Thomopoulos, et al (2006)
Greece 233
18% FPG, BMI> 25 kg/m2
Bondini, et al (2007) USA 64 19% Obesity, waist circumference, hypergension, dyslipidemia, older age
Cindoruk, et al (2007) Turkey 140
34% BMI, total cholesterol, hypertriglyceridemia
Peng, et al (2008) China 153
27% BMI, Age ALT
Rastogi, et al (2011) India 350
34% Triglyceride
Lesmana, et al (2012) Indonesia
174
30% Waist circumference

Fatty Liver vs. SVR Rates
Cindoruk M, et al. J Clin Gastroenterol 2007;41:513-7.
HBeAg (-) HBeAg (+)0%
10%
20%
30%
40%
36.20%39.60%
31.50% 33.30%
With steatosis Without steatosis
FL did not affect IFN-based treatment outcomes (p > 0.005)

ALT
HBeAg+
HBV DNA
Immune Escape/Reactivation
Inactive Carrier Status
HBeAg – Chronic HBV
HBeAg +Chronic Hepatitis B
Immune Tolerant
ImmuneControl
Immune Clearance
Immune control – treatment not required
Immune control – inactive disease
HBeAg–

Summary: NAFLD in CHBNAFLD is commonly found in about one-third of
patients.NAFLD in CHB is strongly associated with
metabolic factors, e.g.: body mass index (BMI), obesity, insulin resistance, dyslipidemia.
NAFLD is not associated with liver fibrosis or histological activity index.
NAFLD may not affect treatment response.In patients with CHB and NAFLD with elevated
ALT in clinical practice is not easy to distinguish whether the high ALT is due to CHB or NAFLD.

Chronic Hepatitis C (CHC) and NAFLDCurrent Evidence
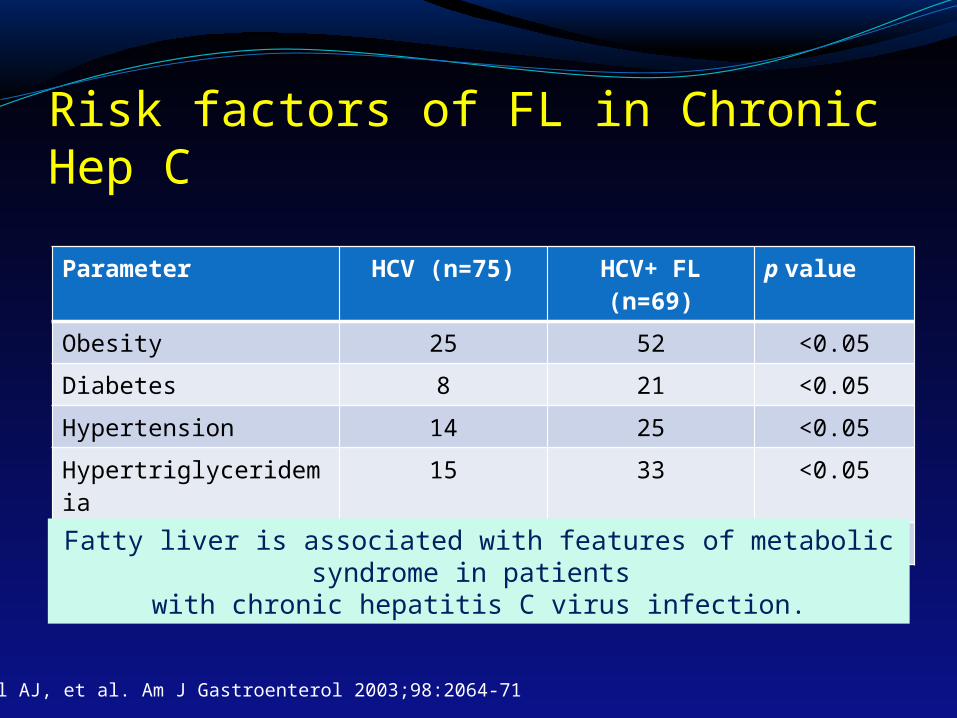
Risk factors of FL in Chronic Hep C
Parameter HCV (n=75) HCV+ FL (n=69)
p value
Obesity 25 52 <0.05
Diabetes 8 21 <0.05
Hypertension 14 25 <0.05
Hypertriglyceridemia 15 33 <0.05
Metabolic syndrome 28 63 <0.001
Fatty liver is associated with features of metabolic syndrome in patients
with chronic hepatitis C virus infection.
Sanyal AJ, et al. Am J Gastroenterol 2003;98:2064-71

IR and Liver Fibrosis in CHC
F0-F1 F2-F40
102030405060708090
100
9
91
33
67
HOMA-R >2.5HOMA-R <2.5
% o
f case
s
Taura N, et al. Am J Gastroenterol 2006;101:2752-9.
Insulin resistance is associated with more advanced fibrosis in patients with chronic hepatitis C virus infection
p = 0.002

HCV GENOTYPE DISTRIBUTION
1a 1b 1c 2a 2e 2f 3a 3k0
5
10
15
20
25
30
35
40
45
50
6.7
47.3
18.7
105.3
0.7 0.7
10.7
HCV genotype 1b is predominant in Indonesia
Utama A, et al. Liver Int 2010;30:1152-60.
Subjects: 68 chronic hepatitis, 48 cirrhosis, and 34 HCCMethod: core sequence analyses
%

Relapse rate are higher in patients infected with HCV genotype 3 who have an RVR
RVR SVR Relapse0
102030405060708090
86.7 84.3
10.1
79.6 79.2
15.6
Genotype 2 (n=427)Genotype 3 (n=505)
Resp
on
ders
(%
)
Shah SR, et al. Clin Gastroenterol Hepatol 2011;9:688-93.
RVR: rapid virologic response (HCV RNA <43 IU/mL at week-4 ) SVR: sustained virologic response (HCV RNA <15 IU/mL at week-48
p=0.001
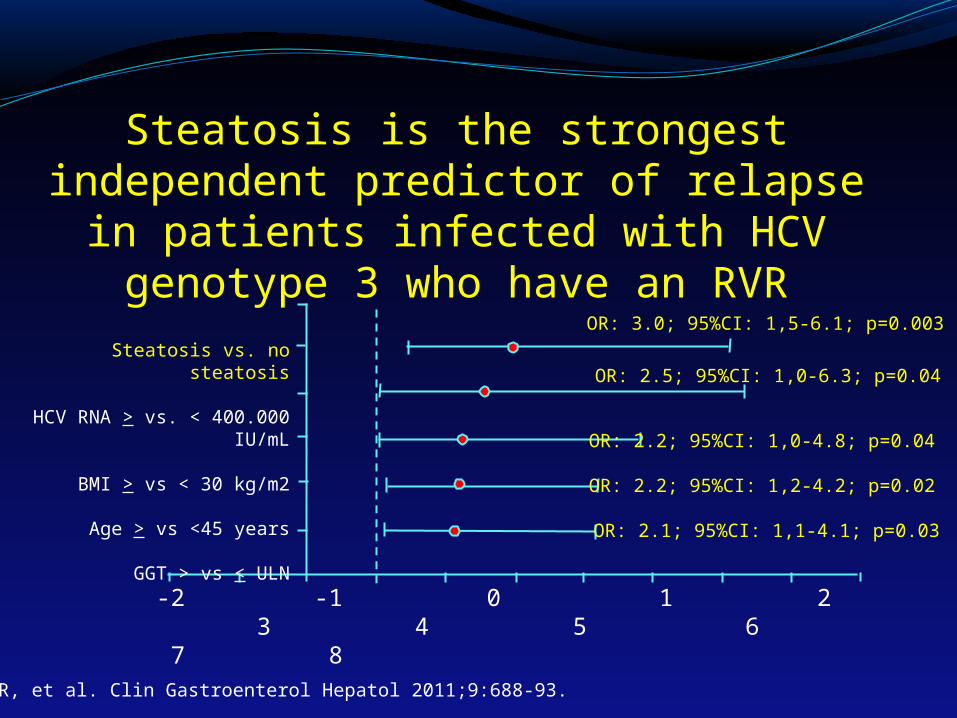
Steatosis is the strongest independent predictor of relapse in patients infected with HCV
genotype 3 who have an RVR
Shah SR, et al. Clin Gastroenterol Hepatol 2011;9:688-93.
OR: 3.0; 95%CI: 1,5-6.1; p=0.003 Steatosis vs. no steatosis
HCV RNA > vs. < 400.000 IU/mL
BMI > vs < 30 kg/m2
Age > vs <45 years
GGT > vs < ULN
OR: 2.5; 95%CI: 1,0-6.3; p=0.04
OR: 2.2; 95%CI: 1,0-4.8; p=0.04
OR: 2.2; 95%CI: 1,2-4.2; p=0.02
OR: 2.1; 95%CI: 1,1-4.1; p=0.03
-2 -1 0 1 2 3 4 5 6 7 8
HCV infection and Metabolic Syndrome
There is no evidence for association between HCV infection and metabolic syndrome.
The 2 conditions occur together at a higher rate than would occur by chance, although HCV infection has been associated with type2 diabetes mellitus.
The serum lipid profile of patients with HCV infections is characterized by decreased level of cholesterol and sometimes triglycerides,in contrast to metabolic syndrome
Negro F. Gastroenterology 2012;142:1288-92

HCV and Lipid Metabolism that may lead to steatosis of hepatocytes
Negro F. Gastroenterology 2012;142:1288-92.

HCV might affect insulin signaling in hepatocytes contributing to Insulin Resistance
Negro F. Gastroenterology 2012;142:1288-92.

Possible Clinical Outcomes Insulin resistance in CHC
have substantial impact on the morbidity and mortality :Accelerated progression
of liver fibrosis Increase type 2 diabetesReduced virological
response to antiviral therapy
Increase incidence of cardiovascular events need further study
Bugianesi E, et al. J Hepatol 2012;56(Suppl ):S56-S65
Summary: NAFLD in CHCNAFLD is frequently found in CHCIts present is genotype specific, mostly
genotype 1 and 3Alcohol, central obesity, raised BMI are
associated with more activity and more severe fibrosis
Obesity reduces response to IFN-based treatment
NAFLD may increase relapse rate among previously rapid virologic responders

THANK YOU