LA-II Thermal Coating Validation Report - EO-1 Home · LA-II Thermal Coating Validation Report...
22
LA-II Thermal Coating Validation Report February 15, 2002 Nicholas M. Teti Swales Aerospace Beltsville, Maryland 20705 NASA/GSFC
Transcript of LA-II Thermal Coating Validation Report - EO-1 Home · LA-II Thermal Coating Validation Report...
LA-II Thermal Coating Validation Report
February 15, 2002
Nicholas M. Teti Swales Aerospace Beltsville, Maryland 20705
NASA/GSFC
ii
Table of Contents 1. INTRODUCTION ........................................................................................................................... 1 2. TECHNOLOGY DESCRIPTION ................................................................................................... 1 3. TECHNOLOGY VALIDATION .................................................................................................... 2
3.1 Ground Test Verification .................................................................................................... 4 3.2 On-Orbit Test Validation .................................................................................................... 5
3.2.1 Overview................................................................................................................ 7 3.2.2 Technology Validation Approach........................................................................ 10 3.2.3 Observable Trends in the Calorimeter Flight Data .............................................. 10 3.2.3 Model Correlation ................................................................................................. 13
3.3 On-Orbit Usage Experience.............................................................................................. 18 4. NEW APPLICATION POSSIBILITIES ....................................................................................... 18 5. FUTURE MISSION INFUSION OPPORTUNITIES ................................................................... 18 6. LESSONS LEARNED................................................................................................................... 18 7. CONTACT INFORMATION........................................................................................................ 18 8. SUMMARY................................................................................................................................... 19 9. CONCLUSIONS ........................................................................................................................... 19 10. TECHNICAL REFERENCES....................................................................................................... 19
List of Illustrations Figure 1. Flight Calorimeters ........................................................................................................................ 1 Figure 2. Final Configuration of the EO-1 Calorimeters .............................................................................. 1 Figure 3. Common Mounting Bracket .......................................................................................................... 2 Figure 4. Relationship Between the Calorimeter Sensor Disk and Housing ................................................ 3 Figure 5. Protective Shields .......................................................................................................................... 4 Figure 6. Thermal Model Ground Test Correlation ...................................................................................... 4 Figure 7. Location and Final Closeout of Calorimeters ................................................................................ 5 Figure 8. Results of Flight Tests ................................................................................................................... 6 Figure 9. Z93 Test Results ............................................................................................................................ 7 Figure 10. LA-II Test Results ....................................................................................................................... 7 Figure 11. EO-1 TSS Thermal Model........................................................................................................... 8 Figure 12. EO-1 TSS Thermal Model vs Flight Data ................................................................................... 8 Figure 13. Early On-Orbit Flight Data for Z93 Paint Sample....................................................................... 9 Figure 14. Early On-Orbit Flight Data for LA-II Paint Sample.................................................................... 9 Figure 15. Summary of Flight Data for Z93, November 21, 2000 – November 21, 2001.......................... 11 Figure 16. Summary of Flight Data for LA-II, November 21, 2000 – November 21, 2001....................... 11 Figure 17. Calorimeter Flight Data 12-Month Comparison........................................................................ 13 Figure 18. EO-1 Thermal Model and Flight Data Comparison, November 21, 2001 Winter
(Hot Orbital Season) ........................................................................................................................... 15 Figure 19. EO-1 Thermal Model and Flight Data Comparison, November 21, 2001, Single Orbit
Winter (Hot Orbital Season) ............................................................................................................... 15 Figure 20. EO-1 Thermal Model and Flight Data Comparison, February 21, 2002, Nominal ................... 16 Figure 21. EO-1 Thermal Model and Flight Data Comparison, February 21, 2002, Single Orbit,
Nominal .............................................................................................................................................. 16 Figure 22. EO-1 Thermal Model and Flight Data Comparison, June 21, 2001 Summer (Cold Orbital
Season)................................................................................................................................................ 17 Figure 23. EO-1 Thermal Model and Flight Data Comparison, June 21, 2001, Single Orbit Summer
(Cold Orbital Season) ......................................................................................................................... 17

iii
List of Tables
Table 1. Values Used To Verify the SINDA Thermal Model ...................................................................... 3 Table 2. BOL Measured Properties............................................................................................................... 3 Table 3. Calorimeter Sample Flight Data 12-Month Comparison (ºC) ...................................................... 12

1
1. INTRODUCTION The purpose of this technology demonstration is to validate the thermal performance of an improved white thermal control coating developed by AZ Technology, Inc. The thermal control coating referred to as LA-II, is a low absorptance inorganic white paint. A low absorptance thermal coating will allow radiators to run cooler when exposed to an ultraviolet (UV) environment and thereby provide improved performance for space radiators. Two flight calorimeters, shown in Figure 1, were built by Swales Aerospace and flown on the Earth Observing-1 (EO-1) spacecraft. Using the known NASA/GSFC Z93P White Paint as a baseline for comparison, the data provided from the calorimeters was used to validate the performance of the LA-II low alpha inorganic white paint.
Figure 1. Flight Calorimeters
2. TECHNOLOGY DESCRIPTION The photos in Figure 2 represent the final configuration of the EO-1 calorimeters. Calorimeter (S/N 032) was coated with Z93P white paint by Grace Miller of Swales Aerospace and Calorimeter (S/N 033) was coated with LA-II low alpha inorganic white paint by Steve Jones of AZ Technology, Inc. Both coatings were developed by AZ Technology, Inc. Two flight thermistors were added to the EO-1 flight telemetry, TCALEXP1T for LA-II (S/N 033) and TCALEXP2T for Z93P (S/N 032).
Z93
LA-II
Z93
LA-II
Figure 2. Final Configuration of the EO-1 Calorimeters

2
3. TECHNOLOGY VALIDATION There are several key elements and requirements that must be identified and implemented properly to give merit to the technology validation of the LA-II white paint. These include:
• A clear view to the space environment • Thermal resistance (calibration) between calorimeter disc and the EO-1 equipment bay panel
interface • A minimum of 500 sun hours • Beginning of Life (BOL) measured thermal properties • End of Life (EOL) assumed thermal properties • Contamination control through launch
Calorimeter Location
The calorimeters were mounted on a common aluminum bracket that was attached to the EO-1 equipment bay panel, Bay 4 (Carbon-Carbon Radiator panel) as shown in Figures 3 and 7. In addition to providing a structural mount to the spacecraft, the bracket allowed the disc samples to reside above the radiator surface, thereby increasing the view factor to space and reducing inputs from other spacecraft components.
Figure 3. Common Mounting Bracket
Calibration
The calorimeters were calibrated prior to installation on the EO-1 spacecraft. This data defined a starting point for determining the degradation (if any) of the test samples. Parasitic conductive paths, while minimized with the Swales calorimeter, can never be completely eliminated. Figure 4 illustrates the relationship between the calorimeter sensor disk and housing. The external surface of the sensor disc contains the thermal coating, and the internal surface contains the temperature sensor that is intended to record a sample temperature based solely upon the radiative environment and the thermo-optical properties of the sensor disc. Due to the conductive influences between the sensor and housing, the recorded sensor disc temperature is a balance between the environment heat input and the housing temperature. Therefore, both calorimeters (Z93 and LA-II) were calibrated to determine the interface conductance (h) between the calorimeter sensor disc and housing and the relationship between the recorded disc temperatures and the disc theoretical temperatures represented by the test chamber shroud temperature. These values are listed in Table 1 and were used to verify the Systems Improved Numerical Differencing Analyzer (SINDA) thermal model.
Mounting Bracket

3
Calorimeter Housing
Sensor Disk
Thermal Coating
Temperature Sensor
Figure 4. Relationship Between the Calorimeter Sensor Disk and Housing
Table 1. Values Used To Verify the SINDA Thermal Model
Calorimeter S/N Housing Temp, K
Sensor Disc Temp, K
Shroud Temp, K
Interface Conductance –h Disc-Housing (W/cm2-°C)
#32 (Z93) 280 189 123 .0000479 #33 (LA-II) 280 198 123 .0000665
Sun Angle
The total sun hours that thermal coatings are exposed to have the largest influence on the rate of UV degradation. Experience indicates that measurable UV degradation of similar coatings occurs after a minimum of 500 equivalent sun hours. The EO-1 calorimeters had an orbit average sun angle exposure of about 20° in a 66% sun-time orbit. The total equivalent sun hours from 11/21/00 through 11/12/01 can be computed as follows:
Total Sun Hours = 356 day x 24 hour/day x .67 orbits/hour x sin 20° x 0.66 = 1324 hours
BOL Optical/Thermal Properties
The BOL measured properties for the Z93P control coating and the LA-II technology coating are shown in Table 2.
Table 2. BOL Measured Properties
Description Solar Absorptance, αS (BOL) IR Emittance, εH (BOL) Z93P (S/N 032) .17 .87
AZW/LA-II (S/N 033) .11 .86
Contamination Control
It was imperative that the disc thermal coating properties remained clean throughout the integration and test process prior to launch. The test samples were very small, and therefore, a small amount of contamination could have a large effect on the optical/thermal properties of the disc samples. The EO-1 calorimeters were fitted with a protective shield (Figure 5) to aid in protecting the samples through integration and test and on the launch pad.

4
Calorimeter Contamination Control Protective Shields
Figure 5. Protective Shields
3.1 Ground Test Verification The flight calorimeters were not included in the spacecraft-level thermal vacuum test. However, thermistors, calorimeter mounting bracket, and representative calorimeter mass hardware were included. The solar absorptance and IR emittance for each calorimeter samples were measured prior to integrating onto the EO-1 spacecraft. The measured values are shown in Table 2. The calorimeter bracket hardware (Figure 3) was mounted on the EO-1 equipment bay panel, Bay 4 (Carbon/Carbon Radiator Panel). The calorimeter mounting bracket and calorimeter mass simulators, which were used in the spacecraft thermal vacuum test, provided temperature data that was used to verify the spacecraft thermal model. Figure 6 shows the excellent thermal model correlation of the Bay 4 equipment panel and EO-1 Hot thermal balance test data. In addition, telemetry data for the calorimeter bracket obtained during the test indicates that a 4-degree Celsius temperature differential existed between the calorimeter bracket and Bay 4 equipment panel. Although this information is useful for thermal model correlation, the trend cannot be verified by flight data since there were no corresponding flight thermistors for the calorimeter bracket.
Figure 6. Thermal Model Ground Test Correlation
5
The 4-degree gradient observed between thermocouple TC-4 located at center of the Bay 4 equipment panel and the thermocouple located at the interface of the calorimeter bracket and the Bay 4 panel in the HOT thermal balance test data is assumed to be the gradient that would be observed in flight if thermistor data were available.
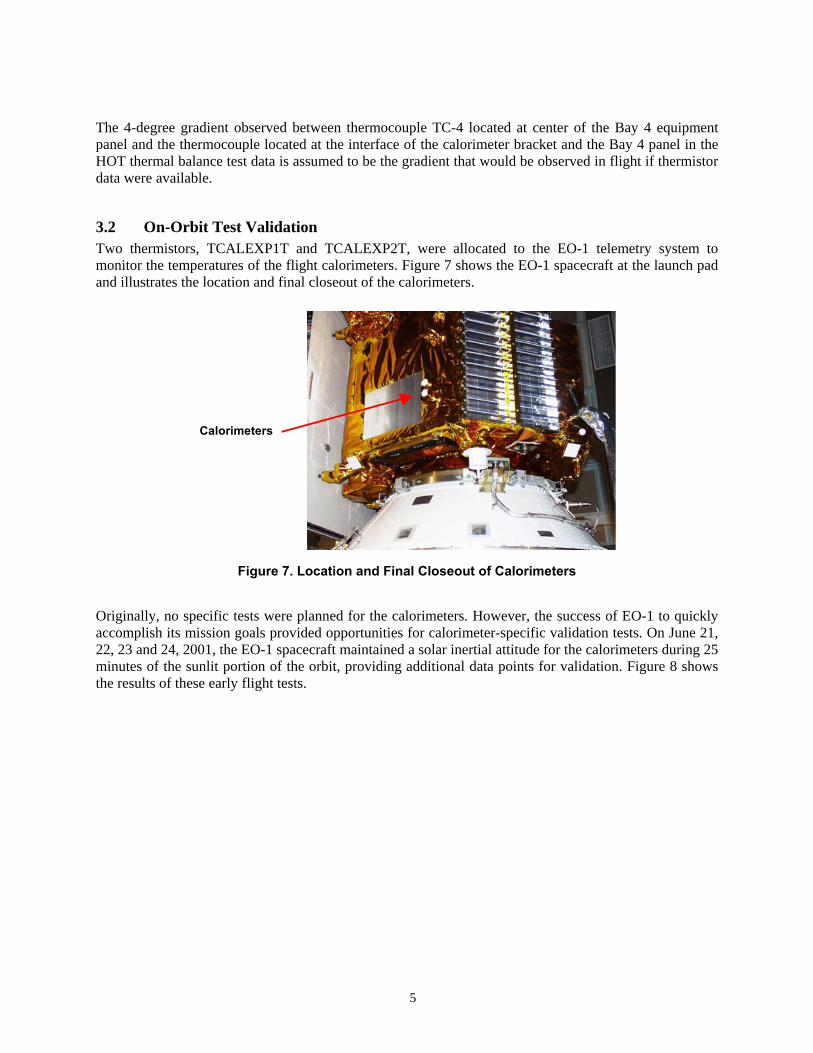
3.2 On-Orbit Test Validation Two thermistors, TCALEXP1T and TCALEXP2T, were allocated to the EO-1 telemetry system to monitor the temperatures of the flight calorimeters. Figure 7 shows the EO-1 spacecraft at the launch pad and illustrates the location and final closeout of the calorimeters.
Calorimeters
Figure 7. Location and Final Closeout of Calorimeters
Originally, no specific tests were planned for the calorimeters. However, the success of EO-1 to quickly accomplish its mission goals provided opportunities for calorimeter-specific validation tests. On June 21, 22, 23 and 24, 2001, the EO-1 spacecraft maintained a solar inertial attitude for the calorimeters during 25 minutes of the sunlit portion of the orbit, providing additional data points for validation. Figure 8 shows the results of these early flight tests.

6
Sun Normal
Figure 8. Results of Early Flight Tests
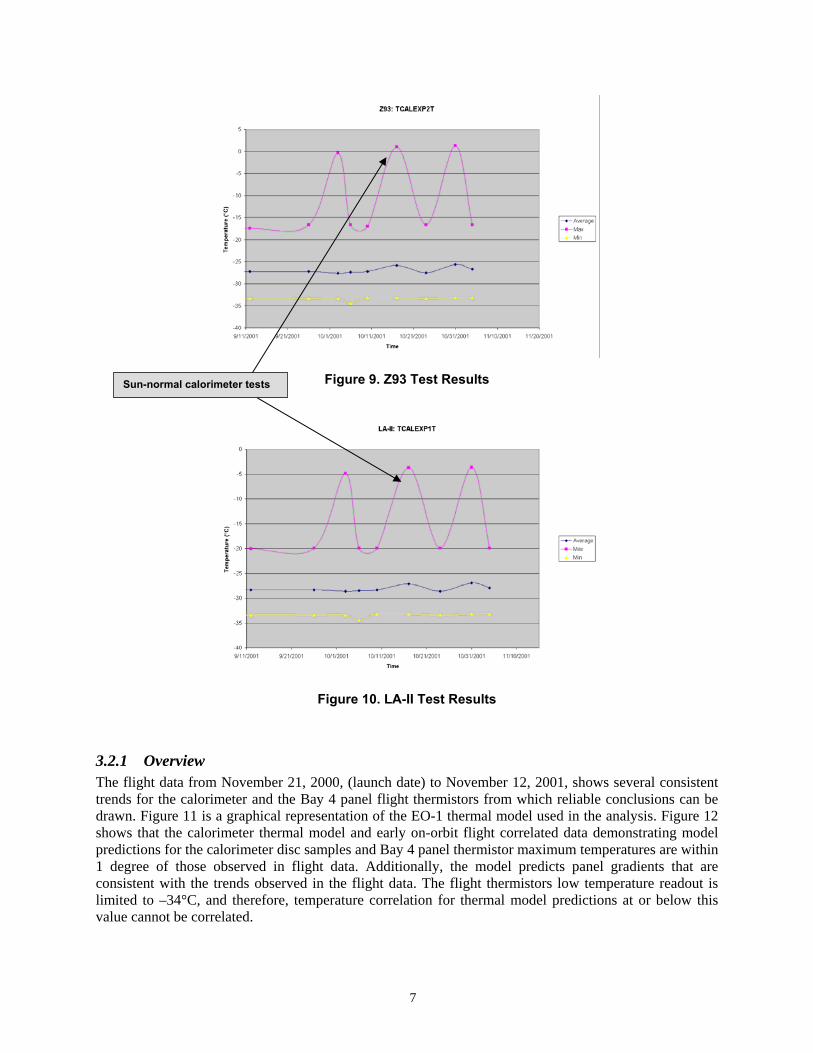
The plots shown in Figure 8 were taken from the early on-orbit flight tests and provided significant data points for evaluating the optical properties of the Z93 and LA-II calorimeter disc samples. The dark blue line indicates the sun angle with respect to Bay 4 (Bay 4 is the spacecraft panel where the calorimeters are mounted). When the sun is directly normal to the disc samples, the sun angle is zero. In addition to gaining additional sun exposure on the paint samples, the flight data was useful in determining the effects this spacecraft attitude and maneuver had on the rest of the spacecraft thermal control. The results of the first sun-pointing tests shown in Figure 8 demonstrate that the calorimeter samples did not reach steady-state temperature. Other spacecraft temperature telemetry was reviewed and a conclusion made that the spacecraft could maintain a continuous sun-pointing attitude for the entire 60-minute sun portion of the orbit. In an effort to increase the sun hours on the calorimeter samples, the sun exposure times were increased from 20 to 60 minutes for all of the remaining sun-normal calorimeter tests. Figures 9 and 10 show the response from three 60-minute sun-normal tests performed in October 2001.
7
Figure 9. Z93 Test Results
Figure 10. LA-II Test Results
3.2.1 Overview The flight data from November 21, 2000, (launch date) to November 12, 2001, shows several consistent trends for the calorimeter and the Bay 4 panel flight thermistors from which reliable conclusions can be drawn. Figure 11 is a graphical representation of the EO-1 thermal model used in the analysis. Figure 12 shows that the calorimeter thermal model and early on-orbit flight correlated data demonstrating model predictions for the calorimeter disc samples and Bay 4 panel thermistor maximum temperatures are within 1 degree of those observed in flight data. Additionally, the model predicts panel gradients that are consistent with the trends observed in the flight data. The flight thermistors low temperature readout is limited to –34°C, and therefore, temperature correlation for thermal model predictions at or below this value cannot be correlated.
Sun-normal calorimeter tests

8
Figure 11. EO-1 TSS Thermal Model
Figure 12. EO-1 TSS Thermal Model vs Flight Data
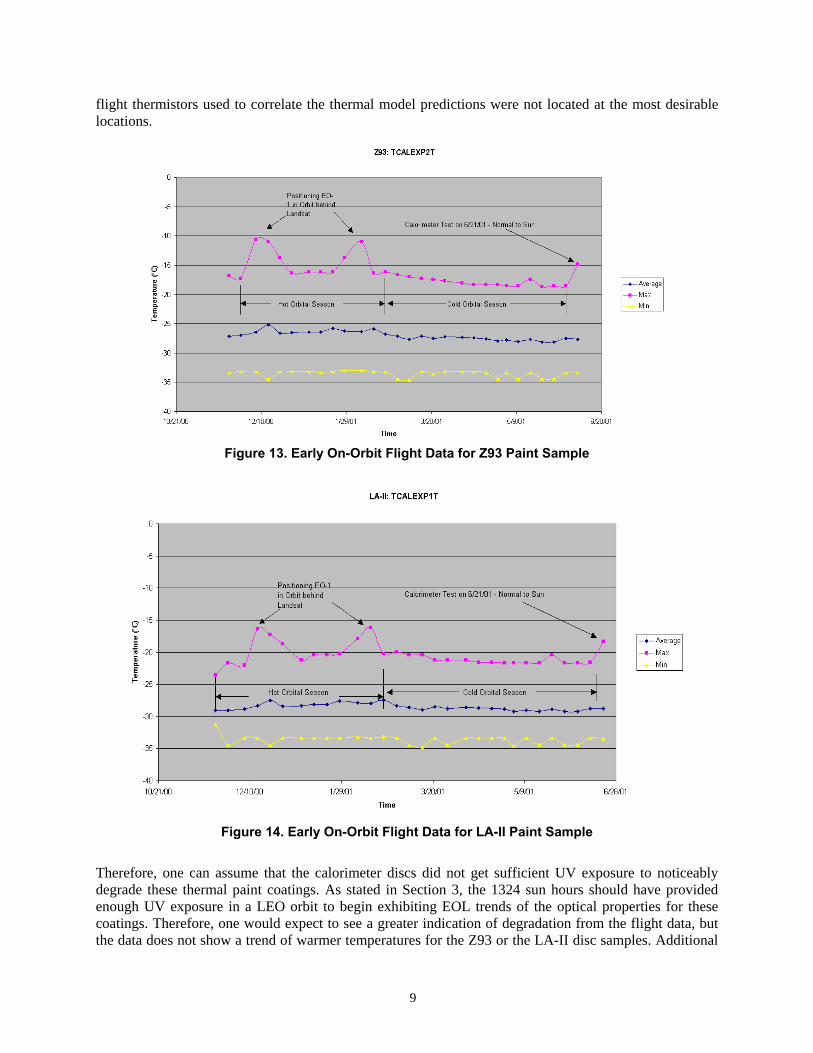
Figures 13 and 14 represent the early on-orbit flight data for the Z93 and LA-II paint samples, respectively. The change in maximum temperature for the calorimeter discs can be attributed to seasonal variations and/or a slight degradation in optical properties for the Z93 and LA-II thermal coatings. When comparing flight results with the analytical model results it appears that the degradation is mainly attributed to seasonal variations; however, it is difficult to produce a conclusive analytical assessment of the level of degradation that the calorimeters have experienced. EO-1 had a limited number of thermistors available to accommodate the LA-II thermal coating technology demonstration, and the location of the
9
flight thermistors used to correlate the thermal model predictions were not located at the most desirable locations.
Figure 13. Early On-Orbit Flight Data for Z93 Paint Sample
Figure 14. Early On-Orbit Flight Data for LA-II Paint Sample
Therefore, one can assume that the calorimeter discs did not get sufficient UV exposure to noticeably degrade these thermal paint coatings. As stated in Section 3, the 1324 sun hours should have provided enough UV exposure in a LEO orbit to begin exhibiting EOL trends of the optical properties for these coatings. Therefore, one would expect to see a greater indication of degradation from the flight data, but the data does not show a trend of warmer temperatures for the Z93 or the LA-II disc samples. Additional
10
data collection may provide a better knowledge for determining the level of degradation for these coatings.
3.2.2 Technology Validation Approach The following is the approach taken to analytically validate the flight results and provide an engineering assessment of the calorimeter flight data.
• Analyze the flight data for the period November 21, 2000, through November 21, 2001, and note observable trends.
• Correlate the SINDA model to predict the temperatures and trends observed during the EO-1 12-month mission life. o Update the SINDA model with most current thermal conductivity values for Carbon/Carbon
Radiator Panel (Bay 4 Equipment Panel) reported in the Carbon/Carbon Radiator Panel Technology Report.
o Use the calibrated h value (see Table 1) obtained from the Calorimeter Thermal Vacuum Test Report (dated: March 3, 2000; author: John Winchester) for Z93 and LA-II
o Make assumptions for unknowns in environmental conditions, panel gradients, calorimeter bracket temperatures, etc. (see below)
• Analyze cases using different combinations of environmental conditions and BOL optical properties for the 705-km, 98° inclination, 10:01 a.m. sun-synchronous (beta angle = 30°), EO-1 orbit. The following are the values used in the analysis:
• From the relationship, Earth IR Constant = (1-Albedo Factor)*Solar Constant/4 o Winter Environmental Constants (hot):
Solar Constant: 1419 W/m2-°C Albedo Factor: 0.35 Earth IR Constant: 230 W/m2-°C
o Summer Environmental Constants (cold): Solar Constant: 1340 W/m2-°C Albedo Factor: 0.30 Earth IR Constant: 234 W/m2-°C
o Use provided BOL properties Z93: alpha = 0.17, hemispherical emissivity = 0.87 LA-II: alpha = 0.11, hemispherical emissivity = 0.86
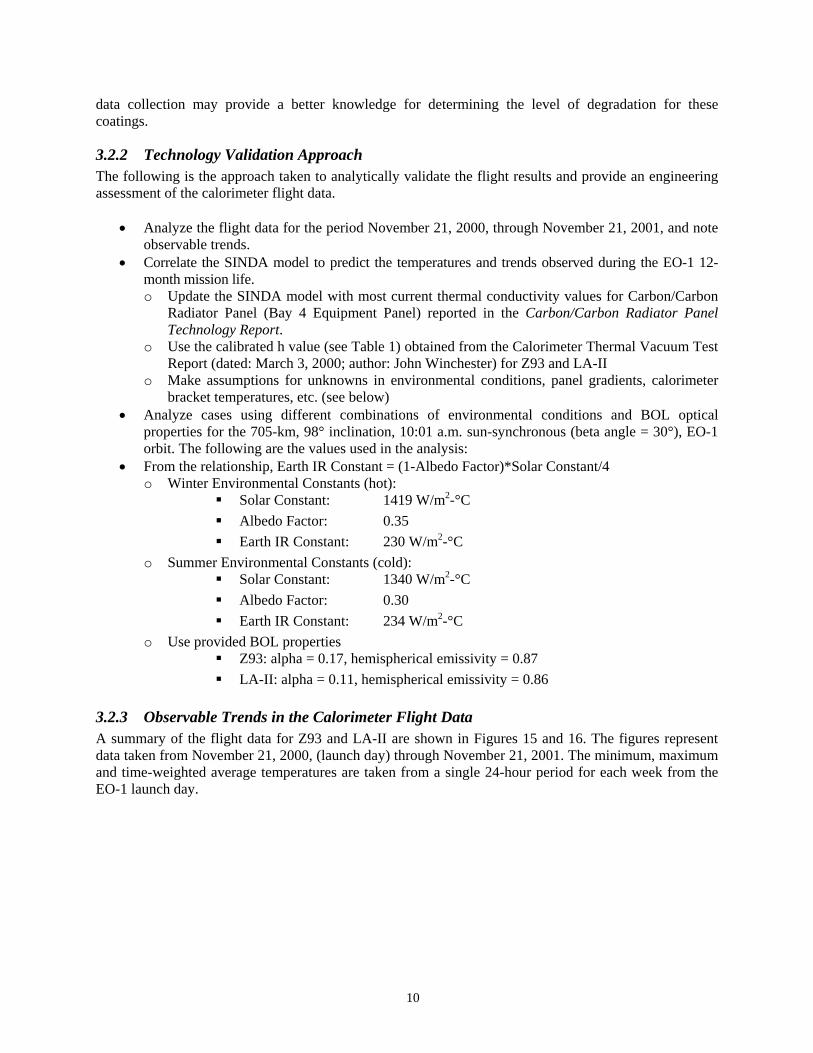
3.2.3 Observable Trends in the Calorimeter Flight Data A summary of the flight data for Z93 and LA-II are shown in Figures 15 and 16. The figures represent data taken from November 21, 2000, (launch day) through November 21, 2001. The minimum, maximum and time-weighted average temperatures are taken from a single 24-hour period for each week from the EO-1 launch day.
11
Figure 15. Summary of Flight Data for Z93, November 21, 2000 – November 21, 2001
Figure 16. Summary of Flight Data for LA-II, November 21, 2000 – November 21, 2001

12
The following observed trends are deduced from the summary of EO-1 flight data.
• The temperature trends for the disc samples represent seasonal variations in solar constant, Earth IR and Albedo.
• The LA-II sample is approximately 5°C cooler than the Z93 sample during the sunlit portion of the orbit.
• The gradient between the maximum temperatures of the two calorimeters is consistently 5-6°C. • The gradient between the minimum temperatures of the calorimeters is consistently
approximately 0.2°C. • Neither disc samples shows any appreciable change in temperature when comparing the data
from one season to the next. • Maximum orbital temperatures occur when Bay 4 sun angle is approximately between +63°C and
+70°C. • Minimum orbital temperatures occur when Bay 4 sun angle is approximately between +24°C and
+30°C. • The slope of the temperature change observed during the “sun normal experiment” is greater for
the Z93 disk. • Neither calorimeter reached steady-state temperatures during the “sun normal experiment.”
The summary of data values presented in Table 3 and Figure 17 provides a 12-month temperature comparison for the calorimeter samples. At first, the less than 1°C change in average temperature for this 12-month period appears to indicate that there is no appreciable degradation in the thermal properties for these coatings. However, there is an increase of more 1°C for the LA-II thermal coating. The consistent increase in peak temperatures for the LA-II coating is clearly visible in Figure 17.
Table 3. Calorimeter Sample Flight Data 12-Month Comparison (°C) LA-II (2/21/2001) Z93 (2/21/2001) LA-II (2/21/2002) Z93 (2/21/2002) TCALEXP1T TCALEXP2T Δ Temp Δ Temp TCALEXP1T TCALEXP2T 2/21/2001 2/21/2001 LA-II Z93 02/21/02 02/21/02
Total Weighted Average -27.46 -25.85 -0.21 0.54 -27.67 -26.39 Max -20.24 -16.37 1.11 0.15 -19.13 -16.22 Min -33.17 -33.17 -0.20 0.00 -33.37 -33.17
Absolute Average -27.90 -26.33 -0.35 0.09 -27.55 -26.24

13
Figure 17. Calorimeter Flight Data 12-Month Comparison
For most of the 96-minute orbit, the coatings are not exposed directly to the UV environment. Therefore, the maximum temperature that occurs during the sunlit portion of the mission may be “washed out” by the non-UV-exposed orbital temperatures and not show up in the time-weighted orbital average temperatures. The maximum temperatures occur as the calorimeters “sweep through the sun” and obtain the highest UV exposure during the orbit. Comparing temperatures for the same seasonal time period (12 months apart), an increase in temperature would indicate that the coating has degraded with an increase in the solar absorptance. The thermal model correlation that was used to verify the on-orbit temperature results is presented in Section 3.2.4.
3.2.3 Model Correlation
3.2.3.1 Available and Known Data Values 1. Flight data for November 21, 2000 to November 21, 2001 for eight thermistors
a. Z93 calorimeter disk (TCALEXP2T) b. LA-II calorimeter disk (TCALEXP1T) c. Bay 4 panel external side (TBAY4T) d. Bay 4 panel internal side (TRADCC2T through TRADCC6T) e. Bay 4 sun angle (for much of the time period)
2. BOL optical properties for Z93 and LA-II 3. Material properties for the paints and carbon-carbon composite 4. Calibrated h value for the calorimeters listed in Table 1 5. Thermal balance test data 6. Electronics box power dissipations 7. Altitude and orbital inclination of EO-1

14
3.2.3.2 Unknown Data Values 1. Environmental conditions (solar constant, albedo, Earth IR, and beta angle) for any given day of
flight 2. Degradation in emissivity 3. Temperature of the calorimeter bracket 4. Temperature of the Bay 4 panel underneath the calorimeter bracket 5. Temperature of the calorimeter cups 6. The dimensions of the flight calorimeter disks 7. Panel gradient in the external side of the Bay 4 panel
Boundary conditions and analysis constants are listed in Section 3.2.2.
3.2.3.3 Additional Assumptions Additional assumptions made are as follows: 1. The sun intensity is greatest during winter solstice (December/January timeframe) and lowest during
summer solstice (June/July timeframe), and therefore, the values for the solar constant, Earth IR constant and albedo factor are varied to represent the changes in season.
2. The emissivity for both paints is close to 0.90 and known to be stable, and therefore, the value for emissivity is not changed for either paint.
3. According to the calorimeter thermal vacuum test report (March 3, 2000--J. Winchester), the conduction coupling between the calorimeter cup and the calorimeter disk is small. Therefore, the heat input from the cup to the disk is assumed to be negligible, and is ignored.
4. The dimensions of the calorimeters are taken from the EO-1 TSS model. (Radius of the disk = 1.9 cm)
5. A beta angle of 30° is used for all analysis cases. 6. The thermal conductivity (k) for the Bay 4 equipment panel is based on the results reported in the
“Carbon/Carbon Radiator Panel Technology Report,” section 3.3. The 4-degree gradient observed between thermocouple TC-4 located at center of Bay 4 equipment panel and the thermocouple located at the interface of the calorimeter bracket and the Bay 4 panel in the HOT thermal balance test data is assumed to be the gradient that would be observed in flight if thermistor data were available.
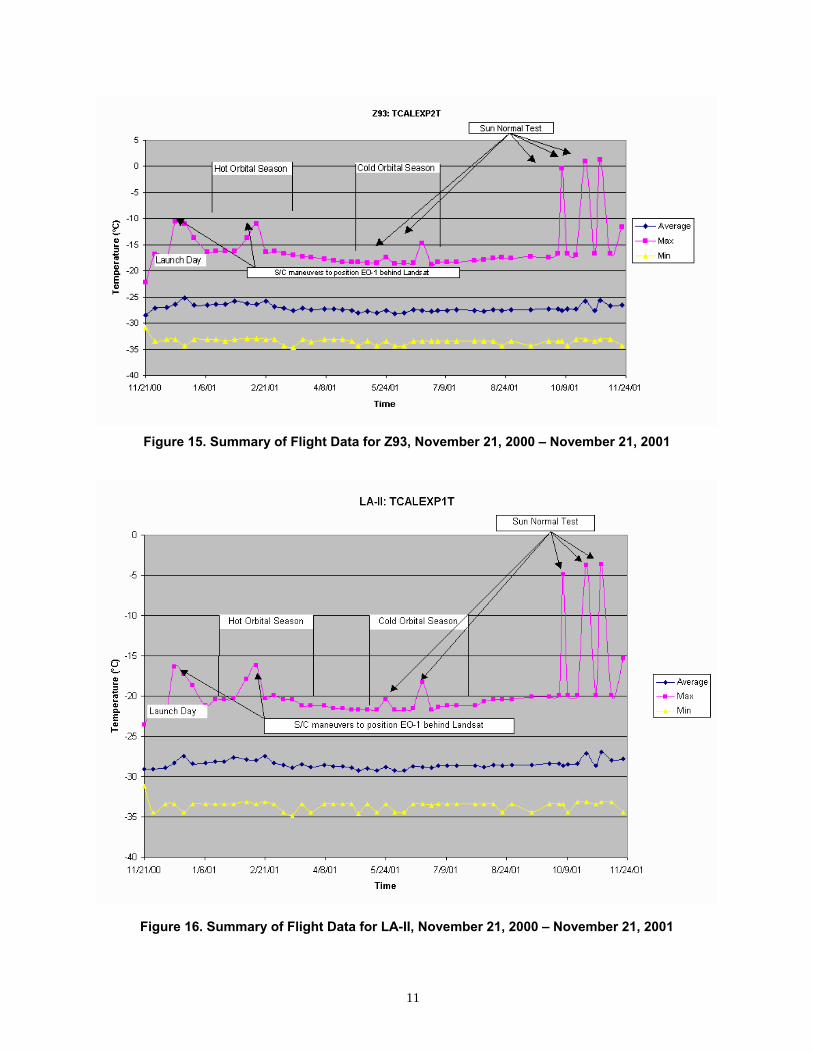
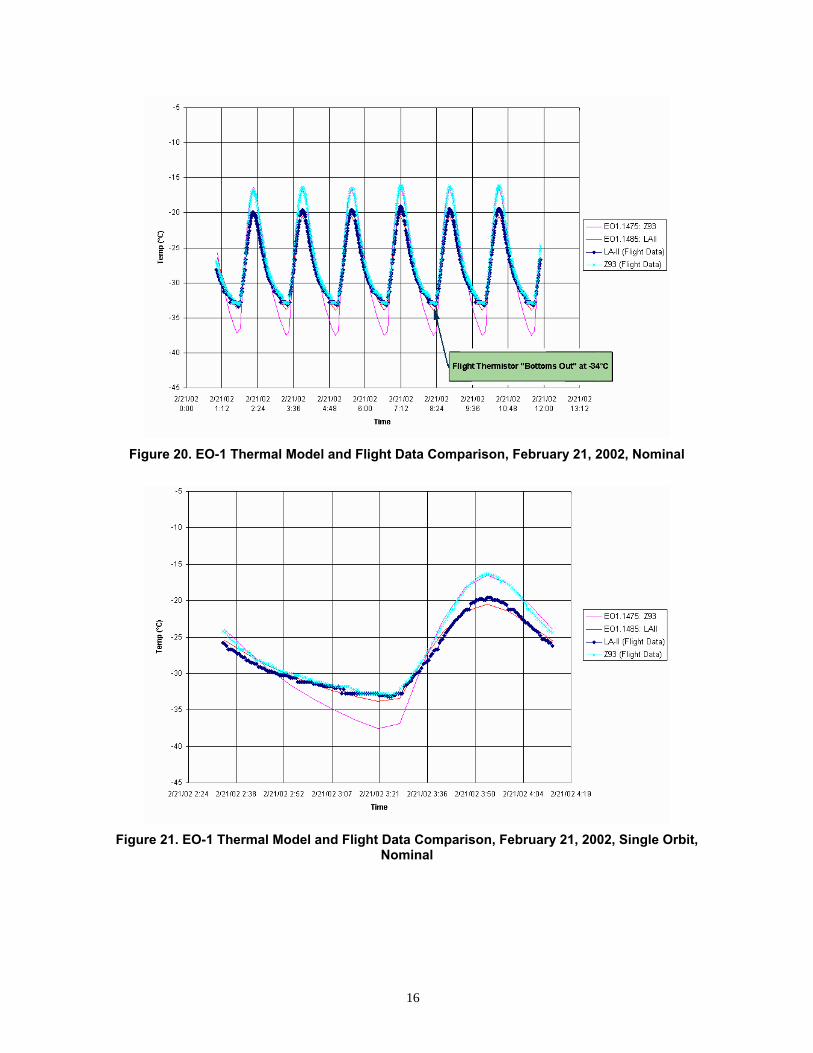
3.2.3.4 Summary of Model Correlation The reduced EO-1 thermal model representing the two flight calorimeters provided excellent correlation with the flight data. The information outlined in Section 3.2.2 was used to generate the results presented in Figures 18 through 23. Note: The flight thermistors’ low temperature limit is –34°C.

15
Figure 18. EO-1 Thermal Model and Flight Data Comparison, November 21, 2001
Winter (Hot Orbital Season)
Figure 19. EO-1 Thermal Model and Flight Data Comparison, November 21, 2001, Single Orbit
Winter (Hot Orbital Season)
16
Figure 20. EO-1 Thermal Model and Flight Data Comparison, February 21, 2002, Nominal
Figure 21. EO-1 Thermal Model and Flight Data Comparison, February 21, 2002, Single Orbit,
Nominal
17
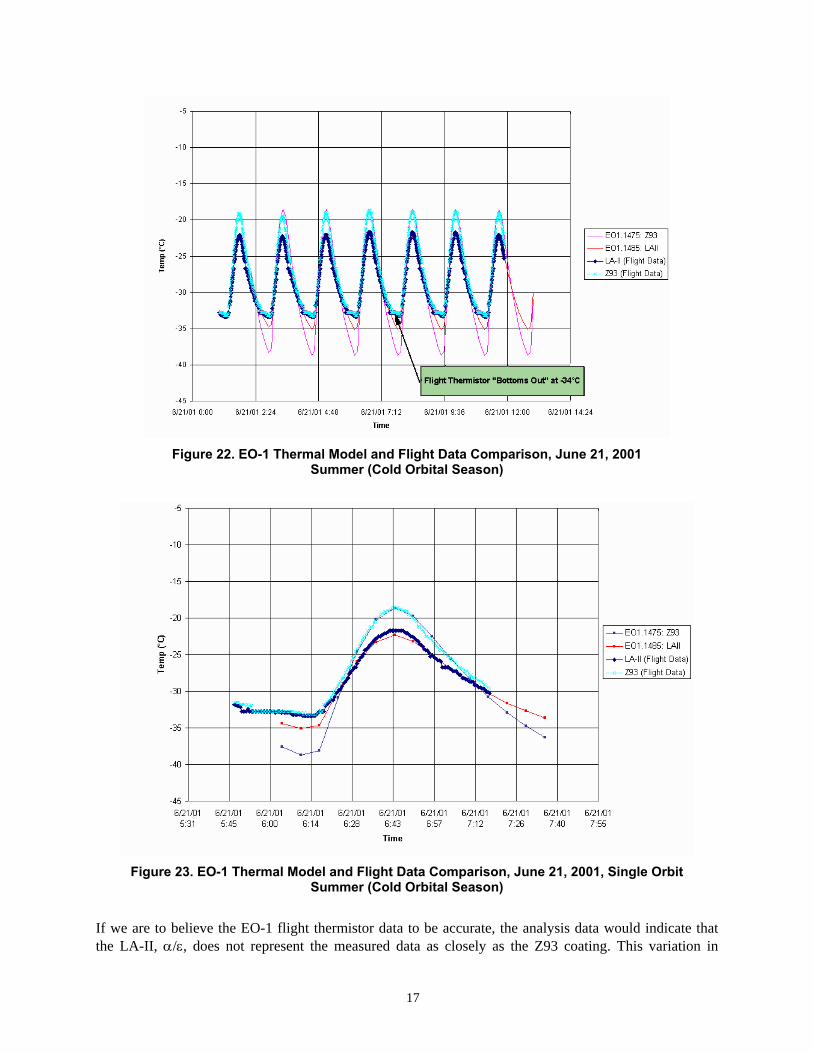
Figure 22. EO-1 Thermal Model and Flight Data Comparison, June 21, 2001
Summer (Cold Orbital Season)
Figure 23. EO-1 Thermal Model and Flight Data Comparison, June 21, 2001, Single Orbit
Summer (Cold Orbital Season)
If we are to believe the EO-1 flight thermistor data to be accurate, the analysis data would indicate that the LA-II, α/ε, does not represent the measured data as closely as the Z93 coating. This variation in

18
temperature for the LA-II coating is most likely attributed to an increase in solar absorptance. However, the variation is so close (less than 0.5°C), it may be attributed to the accuracy of the thermistor. An important observation is that both coatings have remained stable beyond the 12-month mission life with the LA-II maintaining a lower α/ε than its Z93 counterpart.
3.3 On-Orbit Usage Experience The LA-II paint showed no appreciable property degradation. However, additional calorimeter normal to the sun vector testing would allow for more data points and provide a more substantial number of sun hours or UV exposure on the LA-II sample. The LA-II coating has been selected as the baseline for the NASA SWIFT mission as a radiator coating.
4. NEW APPLICATION POSSIBILITIES The LA-II paint will be used as an external radiator thermal control coating by NASA/GSFC on the SWIFT spacecraft.
5. FUTURE MISSION INFUSION OPPORTUNITIES The paint will be implemented on future missions as the requirements for specific missions are determined and the need arises.
6. LESSONS LEARNED
• Verified that LA-II paint optical properties maintain their stability with improved solar absorptivity vs. Z93 paint
• LA-II paint may provide cooler radiator temperatures when exposed to UV. (Data shows 5°C cooler in UV)
• Protect thermal coatings from being contaminated during integration and testing. Due to a dirty environment exposure that contaminated the EO-1 sample thermal coatings, spare calorimeters were flown.
7. CONTACT INFORMATION
Nicholas M. Teti Swales Aerospace 5050 Powder Mill Road Beltsville, MD 20705 301-902-4100 [email protected]
Dennis Hewitt NASA/GSFC Greenbelt, MD 20771 301-286-5115 [email protected]

19
8. SUMMARY The transient behavior of both coatings remains constant, indicating a similar response to the on-orbit environment. The small change in temperature for the LA-II and Z93 coatings over the 12-month on-orbit data collection period indicates that there is no substantial degradation Excellent thermal model correlation with the BOL α/ε values for both coatings indicates that little or no degradation has occurred with the Z93 coating. However, the increase in maximum temperature values of about 1°C for the LA-II coating over the 12-month period indicates that, although small, there may be some degradation in the solar absorptance for the LA-II coating. Additional data points are necessary before a conclusive determination of the degradation can be made. In general, however, the LA-II coating still maintains a better α/ε than the Z93 after 12 months.
9. CONCLUSIONS Additional calorimeter normal to the sun vector testing would allow for more data points and provide a more substantial number of sun hours or UV exposure on the calorimeter samples. Data for the EO-1 mission is scheduled to continue past the 12-month mission goal, with at least an additional six months of data projected. The plan is to monitor the performance of the two paint samples to the end of the EO-1 mission and provide an updated report to NASA/GSFC.
10. TECHNICAL REFERENCES [1] AZ Technology, Inc., “Coatings and Optical Instruments,” Proceedings 2001 Spacecraft
Contamination and Coatings Workshop, University of Maryland, College Park, MD, August 1-2, 2001.