La Crosse 2019 Water Quality Report- FINAL 6-18-20 · high-quality, and dependable drinking water...
6
least through the year 2020. A new study is currently underway. Fluoride and chlorine are added to the water as it is pumped into the distribu on system. City-wide, in 2019 fluoride and chlorine dosages from all City wells averaged 0.71 PPM and 1.01 PPM, respec vely. The Water U lity also doses a polyphosphate addi ve at seven wells to control problems related to manganese in the water. For the seven treated wells, in 2019 polyphosphate dosage at these wells averaged 0.86 PPM of total phosphate. Samples from the water distribu on system in 2019 averaged 0.07 PPM of total phosphorus. We are proud to report that our drinking water is safe and meets all Federal and State requirements. The La Crosse Water U lity is pleased to present you with its annual Water Quality Report that provides a complete summary of water quality informa on from 2019. We are commi ed to providing safe, high-quality, and dependable drinking water supply. We have an extensive water quality monitoring and treatment program in accordance with Federal and State laws. All water supplied to City of La Crosse is groundwater, drawn by wells from an unconsolidated sand and gravel aquifer approximately 170 feet below the City. The aquifer is an impressive source of water, easily producing millions of gallons of water daily. The Water U lity operates thirteen ac ve high capacity wells which range in depth between 100 to 160 feet deep and have pumping capaci es of up to 3,500 gallons per minute (gpm). Water use in the city of La Crosse averaged 9.53 million gallons per day (MGD) in 2019, as compared to 9.19 MGD in 2018. Maximum water produc on in 2019 was 15.068 MGD on July 15th. The City’s all- me maximum produc on of 37.3 MGD occurred on June 6, 1988. Normal water pressure to La Crosse customers ranges between 35 and 100 psi. A water system study completed in 1999 indicated that the exis ng water supply system has adequate capacity to meet projected demands for water at The La Crosse Water U lity operates under the direc on of the City’s Board of Public Works and Common Council. The Board of Public Works usually meets weekly and considers a wide variety of issues related to Water U lity opera ons. Agendas for Board of Public Works mee ngs are posted in City Hall, and are also available on the City’s Web Site: www.cityoflacrosse.org. If you have ques ons regarding this report or concerning the La Crosse water system, please call: Bernard Lenz, U li es Manager, 400 La Crosse Street, La Crosse, WI 54601 (608-789-7536). Hydrant Flushing 2020 Insuring the integrity of the water system and providing high quality water Our Water Supply Who oversees the Water Utility La Crosse Water Utility 2019 Water Quality Report DISTRIBUTED JUNE 2020 SPECIAL POINTS OF INTEREST FOUND IN THIS REPORT: Health Information How to protect our water Cross Connection Control Water Quality Hydrant Flushing and Hydrant Use Conservation YOUR WATER UTILITY The La Crosse Water Utility is made up of and maintains: 13 Wells 2 Reservoirs 220.2 Miles of Water Main 2,976 Valves 16,543 Services 2,018 Fire Hydrants 16,456 Meters In order to maintain a safe and dependable water supply, the U lity con nually makes improvements to benefit all of its customers. This includes replacing old water mains, fire hydrants, service lines and valves. Tsab ntawv xov xwm tseem ceeb no has txog haus dej nyob rau hauv lub zog La Crosse. Tsab ntawv xov xwm no yuav muaj txhais ua lus Hmoob rau lub rau hli ntuj m 30, 2020. Thov hu rau U li es Office 608-789-7536 chaw ua hauj lwm yog koj xav tau dlaim ntawv xov xwm txhais lus no. Visit the Water U lity webpage online at www.cityoflacrosse.org/water for more informa on related to the water system.
Transcript of La Crosse 2019 Water Quality Report- FINAL 6-18-20 · high-quality, and dependable drinking water...

least through the year 2020. Anew study is currently underway.Fluoride and chlorine are added tothe water as it is pumped into thedistribu� on system. City-wide, in2019 fluoride and chlorine dosages from all City wells averaged 0.71PPM and 1.01 PPM, respec� vely.The Water U� lity also doses a polyphosphate addi� ve at seven wells to control problems relatedto manganese in the water. Forthe seven treated wells, in 2019polyphosphate dosage at thesewells averaged 0.86 PPM of totalphosphate. Samples from thewater distribu� on system in 2019 averaged 0.07 PPM of totalphosphorus.
We are proud to report that ourdrinking water is safe and meets allFederal and State requirements.
The La Crosse Water U� lity is pleased to present you with itsannual Water Quality Reportthat provides a completesummary of water qualityinforma� on from 2019. We are commi� ed to providing safe, high-quality, and dependabledrinking water supply. We havean extensive water qualitymonitoring and treatmentprogram in accordance withFederal and State laws.
All water supplied to City of LaCrosse is groundwater, drawn bywells from an unconsolidatedsand and gravel aquiferapproximately 170 feet belowthe City. The aquifer is animpressive source of water,easily producing millions ofgallons of water daily. TheWater U� lity operates thirteen ac� ve high capacity wells which range in depth between 100 to160 feet deep and have pumpingcapaci� es of up to 3,500 gallons per minute (gpm).
Water use in the city of La Crosseaveraged 9.53 million gallons perday (MGD) in 2019, as comparedto 9.19 MGD in 2018. Maximumwater produc� on in 2019 was 15.068 MGD on July 15th. TheCity’s all- � me maximum produc� on of 37.3 MGD occurred on June 6, 1988.
Normal water pressure toLa Crosse customers rangesbetween 35 and 100 psi. Awater system study completed in1999 indicated that the exis� ng water supply system hasadequate capacity to meetprojected demands for water at
The La Crosse Water U� lity operates under the direc� on of the City’s Board of PublicWorks and Common Council.The Board of Public Worksusually meets weekly andconsiders a wide variety ofissues related to WaterU� lity opera� ons. Agendas for Board of Public Worksmee� ngs are posted in City
Hall, and are also available onthe City’s Web Site:www.cityoflacrosse.org. If you have ques� ons regarding this report or concerning theLa Crosse water system,please call: Bernard Lenz,U� li� es Manager, 400 La Crosse Street, La Crosse, WI54601 (608-789-7536).
Hydrant Flushing 2020
Insuring the integrity of the water
system and providing high quality water
Our Water Supply
Who oversees the Water Utility
La Crosse Water Utility
2019 Water Quality ReportD I S T R I B U T E D J U N E 2 0 2 0
S P E C I A L
P O I N T S O F
I N T E R E S T
F O U N D I N
T H I S R E P O R T :
Health
Information
How to protect
our water
Cross
Connection
Control
Water Quality
Hydrant
Flushing and
Hydrant Use
Conservation
Y O U R
W A T E R
U T I L I T Y
The La Crosse
Water Utility is
made up of and
maintains:
13 Wells
2 Reservoirs
220.2 Miles of
Water Main
2,976 Valves
16,543 Services
2,018 Fire
Hydrants
16,456 Meters
In order to maintain a safe anddependable water supply, the U� lity con� nually makes improvements to benefit all of its customers. This includes replacing old water mains,fire hydrants, service lines and valves.
Tsab ntawv xov xwm tseem ceeb nohas txog haus dej nyob rau hauvlub zog La Crosse. Tsab ntawv xovxwm no yuav muaj txhais ua lusHmoob rau lub rau hli ntuj � m 30, 2020. Thov hu rau U� li� es Office 608-789-7536 chaw ua hauj lwm yogkoj xav tau dlaim ntawv xov xwmtxhais lus no.
Visit the Water U� lity webpage online at www.cityoflacrosse.org/water for more informa� on related to the water system.

Substances That Could Be in Water
Important Health InformationDrinking water, including bo� led water, may reasonably be expected to contain at leastsmall amounts of some contaminants. Thepresence of contaminants does notnecessarily indicate that water poses a healthrisk. More informa� on about contaminants and poten� al health effects can be obtained by calling the Environmental Protec� on Agency's Safe Drinking Water Hotline (800-426-4791), or by visi� ng their Office of Water website at www.epa.gov/OW.
Some people may be more vulnerable tocontaminants in drinking water than the
general popula� on. Immuno-compromisedpersons such as persons with cancerundergoing chemotherapy, persons whohave undergone organ transplants, peoplewith HIV/AIDS or other immune systemdisorders, some elderly, and infants can bepar� cularly at risk from infec� ons. These people should seek advice about drinkingwater from their health care providers. EPA/Centers for Disease Control (CDC) guidelineson appropriate means to lessen the risk ofinfec� on by Cryptosporidium and other microbial contaminants are available fromthe environmental protec� on agency’s Safe
Water Drinking Hotline (800-426-4791).
The La Crosse Water U� lity vigilantly tests and monitors the City’s water supply toassure the end quality to consumers. Testresults have detected some contaminants.The Water Quality Data Table sec� on of this report provides informa� on showing that all water quality criteria met or exceeded Fed-eral and State requirements in 2019. TheEPA has determined that City of La Crossewater is safe at the levels detected.
Radon: Radon is a radioac� ve gas that you can't see,
taste, or smell. It is found throughout the U.S. Radon
can move up through the ground and into a home
through cracks and holes in the founda� on. Radon can
build up to high levels in all types of homes. Radon can
also get into indoor air when released from tap water
from showering, washing dishes, and other household
ac� vi� es. Compared to radon entering the home
through soil, radon entering the home through tap
water will in most cases be a small source of radon in
indoor air. Radon is a known human carcinogen.
Breathing air containing radon can lead to lung cancer.
Drinking water containing radon may also cause
increased risk of stomach cancer. If you are concerned
about radon in your home, test the air in your home.
Tes� ng is inexpensive and easy. Fix your home if the
level of radon in your air is 4 Picocuries per liter of air
(pCi/L) or higher. There are simple ways to fix a radon
problem that aren’t too costly. For addi� onal
informa� on, call your state radon program or call EPA's
Radon Hotline (800-SOS-RADON);
Nitrates: Nitrates in drinking water at levels above 10
ppm is a health risk for infants of less than six months
of age. High nitrate levels in drinking water can cause
blue baby syndrome. Nitrate levels may rise quickly for
short periods of � me because of rainfall or agricultural
ac� vity. If you are caring for an infant you should ask
advice from your health care provider;
Lead: Infants and children who drink water containing
lead in excess of the ac� on level could experience delays
in their physical or mental development. Children could
show slight deficits in a� en� on span and learning abili� es.
Adults who drink this water over many years could
develop kidney problems or high blood pressure.
For more informa� on about contaminants and
poten� al health effects, call the U.S. EPA’s Safe
Drinking Water Hotline at (800) 426-4791.
The sources of drinking water (both tap water and
bo� led water) include rivers, lakes, streams, ponds,
springs, reservoirs, and wells. As water travels over
the surface of the land or through the ground, it
dissolves naturally occurring minerals and
substances resul� ng from the presence of animals or
human ac� vity.
To ensure that tap water is safe to drink, the U.S.
EPA prescribes regula� ons limi� ng the amount of
certain contaminants in water provided by public
water systems. U.S. Food and Drug Administra� on
regula� ons establish limits for contaminants in
bo� led water that must provide the same
protec� on for public health.
Substances that may be present in source water
include:
Microbial Contaminants, such as viruses and bacteria,
which may come from sewage treatment plants, sep� c
systems, agricultural livestock opera� ons, or wildlife;
Inorganic Contaminants, such as salts and metals,
which can be naturally occurring or may result from
urban stormwater runoff, industrial or domes� c
wastewater discharges, oil and gas produc� on,
mining, or farming;
Pes� cides and Herbicides, which may come from a
variety of sources such as agriculture, urban
stormwater runoff, and residen� al uses;
Organic Chemical Contaminants, including synthe� c
and vola� le organic chemicals, which are by-products
of industrial processes and petroleum produc� on and
may also come from gas sta� ons, urban stormwater
runoff, and sep� c systems;
Radioac� ve Contaminants, which can be naturally
occurring or may be the result of oil and gas
produc� on and mining ac� vi� es;
MICROBIAL
TESTING
To ensure drinking watersafety, rou� ne bacterio-logical tests are conduct-ed. Over 60 samples fromthe distribu� on system and wells are collectedeach month from repre-senta� ve loca� ons. Sam-ples are tested for coli-form bacteria, indicatorsof poten� al contamina-� on. In 2019 the Water U� lity collected 761 sam-ples. None tested posi� ve for coliform bacteria. Theabsence of coliform posi-� ve samples reflects good source water quality andadequate disinfec� on maintained in the distri-bu� on system.
In 2019, the WaterU� lity pumped 3,478,480 gallons ofwater.
The cost of a gallonof water from thetap in 2019 was$0.04375.
Current Water Rates can
be found on the back of
your quarterly bill or are
available online at
www.cityoflacrosse.org.

Contaminant Reporting DefinitionsMCL (Maximum Contaminant Level): The highest levelof a contaminant that is allowed in drinking water. MCLsare set as close to the MCLGs as feasible using the bestavailable treatment technology.
MCLG (Maximum Contaminant Level Goal): The level ofa contaminant in drinking water below which there is noknown or expected risk to health. MCLGs allow for amargin of safety.
MCLs are set at very stringent levels. To understand thepossible health effects described for many regulated contaminants, a person would have to consume 2 liters ofwater every day at the MCL level for a life� me to have a one-in-a-million chance of having the described healtheffect.
AL (Ac� on Level): The concentra� on of a contaminant which, if exceeded, triggers a treatment or otherrequirement which a water system must follow.
V & E (Variances & Exemp� ons): State or EPA permis-sion not to meet an MCL or a treatment technique undercertain condi� ons.
90th Percen� le: 90% of samples are equal to or lessthan the number on the chart.
n/d (Non-Detects): Laboratory analysis indicates thecons� tuent is not present.
n/a (Not-Applicable): Limits do not apply.
NR (Not-Regulated): State or EPA has not established alimit.
ppm- (Parts per million) or mg/l (Milligrams per liter):One part per million corresponds to one minute in twoyears or one penny in $10,000.
ppb (Parts per billion) or ug/l (Micrograms per liter ):One part per billion corresponds to one minute in 2,000years or one penny in $10,000,000.
pCi/L (Picocuries per liter ): Picocuries per liter is ameasure of the radioac� vity in water.
TCR (Total Coliform Rule): Refers to EPA regula� ons for microbiological standards.
TT (Treatment Technique): A required processintended to reduce the level of a contaminant indrinking water.
INDICATOR SAMPLES AT THE WELLS
Samples are taken periodically at City wells to monitor concentration of several common indicators. The information
shown below shows ranges of results of water samples taken directly from the City’s thirteen active wells, in accordance
with sampling requirements and schedule provided by the DNR.
Ideal Goal(MCLG)
Ac� on Level (AL)
90th Percen� le # of samplesgreater than AL
SampleDate
Copper (ppm) 1.3 1.3 .646 0 2017
Lead (ppb) 0 15 2.27 0 2017
ExceedsAL
No
No
# of SamplesCollected
30
30
Indicator Sample Date Range of Results Average
Alkalinity 2017 114 to 341 ppm 234 ppm
Aluminum 2017 0 to 0.032 ppm .007ppm
Calcium 2017 35.4 to 87.6 ppm 70.1 ppm
Chloride 2017 8.9 to 161 ppm 61.0 ppm
Hardness 2017 64 to 397 ppm 282 ppm
Iron 2017 0 to .14 ppm .04 ppm
Magnesium 2017 9.4 to 41.4 ppm 26.9 ppm
Manganese 2017 0 to 0.253 ppm 0.057ppm
pH 2017 7.22 to 7.75 S.U. 7.5 S.U.
Total Dissolved Solids 2017 163 to 596 ppm 395 ppm
IMPORTANT NOTE ABOUT THEWATER QUALITY DATA TABLE:
Our water is tested for many con-taminants. The Water QualityTable, see insert provided, listsonly those contaminants whichwere detected in our water. Somecontaminants are tested forannually, while others are donemore or less frequently. The reportincludes the minimum andmaximum levels found for eachsubstance found in at least onewell or sampling site within thepast 5 years. Contaminants couldbe found at only one well and notany others. Contamina� on levels found in the table may not berepresenta� ve of the water quali-ty at your home.
See Insert labeledWater QualityData Table Insert
LEAD AND COPPERLead and Copper found in drinking water is typically caused from corrosion of household plumbing; leaching, and
erosion of natural deposits. Lead and Copper are tested every three years.
The treatment method
using a polyphosphate
additive to sequester or
“tie-up” iron and
manganese in the drinking
water has been very
successful in preventing
customer problems related
HYDRANT FLUSHING
The Water U� lity flushes the en� re water system annually to purge naturally occurring mineralsand sediments that accumulateover � me. These materials do not pose a health hazard but candiscolor the water when thesystem is disrupted. Most systemflushing is done at night, which allows use of wells that arenormally off during the day and makes almost the full systemcapacity available for flushing. Night flushing has been very successful in significantly reducing day� me problems when water demand is highest. If youexperience discolored water as aresult of water system flushing, these materials can usually beflushed out of home plumbing systems by running cold waterfrom an outside hose bib, aninterior basement faucet, or into abathtub.
Public Notice
As part of lead and copper sampling in 2017, the U� lity was required to conduct special Water Quality Parameter Sampling during the specified
monitoring period of June 1 – September 30, 2017. Although all of the required sampling was completed with results submi� ed and accepted by
WDNR, some of the sampling was conducted prior to the specified monitoring � meframe, which resulted in issuance of a No� ce of Noncompli-
ance by the WDNR. The situa� on was resolved and no addi� onal sampling was required by WDNR.
WATER CONSERVATION TIP
Don’t flush money down the toilet
If your toilet is running a� er you flush it, you could be was� ng about 26 gallons of water a day, which means hard-earned money is going right down the old toilet. Check your toilet for leaksby adding food coloring to the tank and seeing if color appears in the bowl within 15 minutes. Ifso, you have a leak and it needs to be fixed.
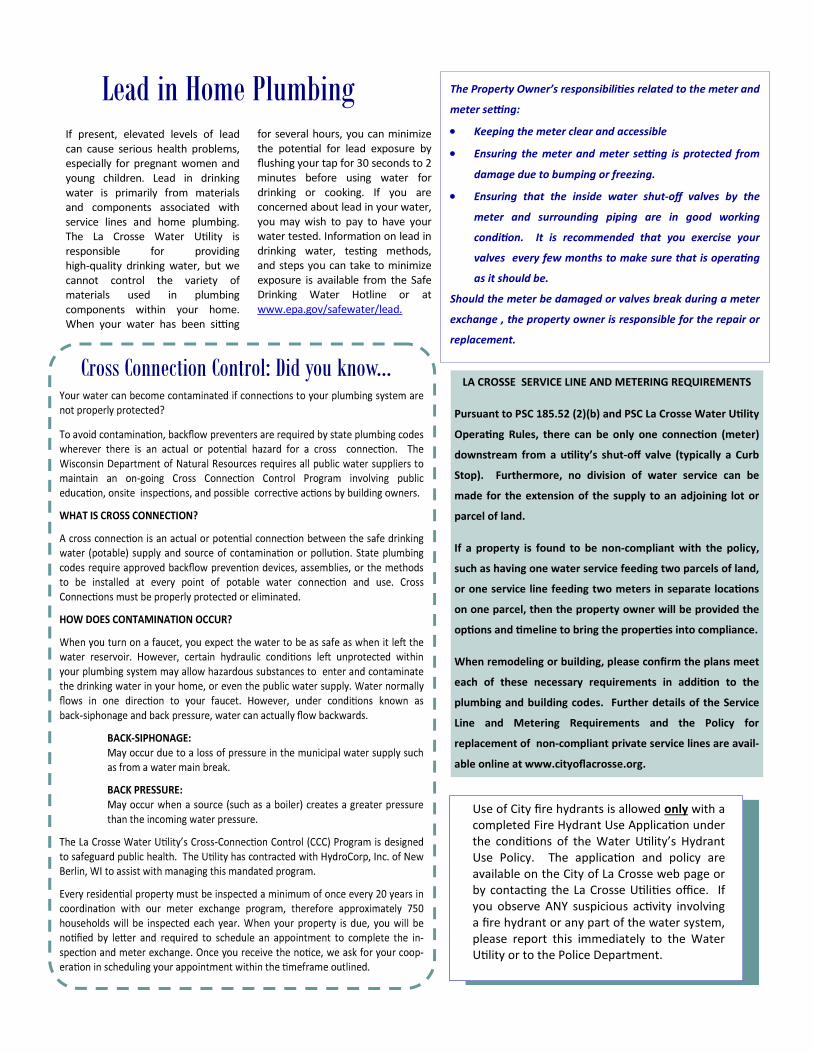
Lead in Home PlumbingIf present, elevated levels of leadcan cause serious health problems,especially for pregnant women andyoung children. Lead in drinkingwater is primarily from materialsand components associated withservice lines and home plumbing.The La Crosse Water U� lity is responsible for providinghigh-quality drinking water, but wecannot control the variety ofmaterials used in plumbingcomponents within your home.When your water has been si� ng
for several hours, you can minimizethe poten� al for lead exposure by flushing your tap for 30 seconds to 2 minutes before using water fordrinking or cooking. If you areconcerned about lead in your water,you may wish to pay to have yourwater tested. Informa� on on lead in drinking water, tes� ng methods, and steps you can take to minimizeexposure is available from the SafeDrinking Water Hotline or atwww.epa.gov/safewater/lead.
Cross Connection Control: Did you know...
The Property Owner’s responsibili� es related to the meter and
meter se� ng:
Keeping the meter clear and accessible
Ensuring the meter and meter se� ng is protected from
damage due to bumping or freezing.
Ensuring that the inside water shut-off valves by the
meter and surrounding piping are in good working
condi� on. It is recommended that you exercise your
valves every few months to make sure that is opera� ng
as it should be.
Should the meter be damaged or valves break during a meter
exchange , the property owner is responsible for the repair or
replacement.
LA CROSSE SERVICE LINE AND METERING REQUIREMENTS
Pursuant to PSC 185.52 (2)(b) and PSC La Crosse Water U� lity
Opera� ng Rules, there can be only one connec� on (meter)
downstream from a u� lity’s shut-off valve (typically a Curb
Stop). Furthermore, no division of water service can be
made for the extension of the supply to an adjoining lot or
parcel of land.
If a property is found to be non-compliant with the policy,
such as having one water service feeding two parcels of land,
or one service line feeding two meters in separate loca� ons
on one parcel, then the property owner will be provided the
op� ons and � meline to bring the proper� es into compliance.
When remodeling or building, please confirm the plans meet
each of these necessary requirements in addi� on to the
plumbing and building codes. Further details of the Service
Line and Metering Requirements and the Policy for
replacement of non-compliant private service lines are avail-
able online at www.cityoflacrosse.org.
Use of City fire hydrants is allowed only with acompleted Fire Hydrant Use Applica� on under the condi� ons of the Water U� lity’s Hydrant Use Policy. The applica� on and policy are available on the City of La Crosse web page orby contac� ng the La Crosse U� li� es office. If you observe ANY suspicious ac� vity involving a fire hydrant or any part of the water system, please report this immediately to the WaterU� lity or to the Police Department.
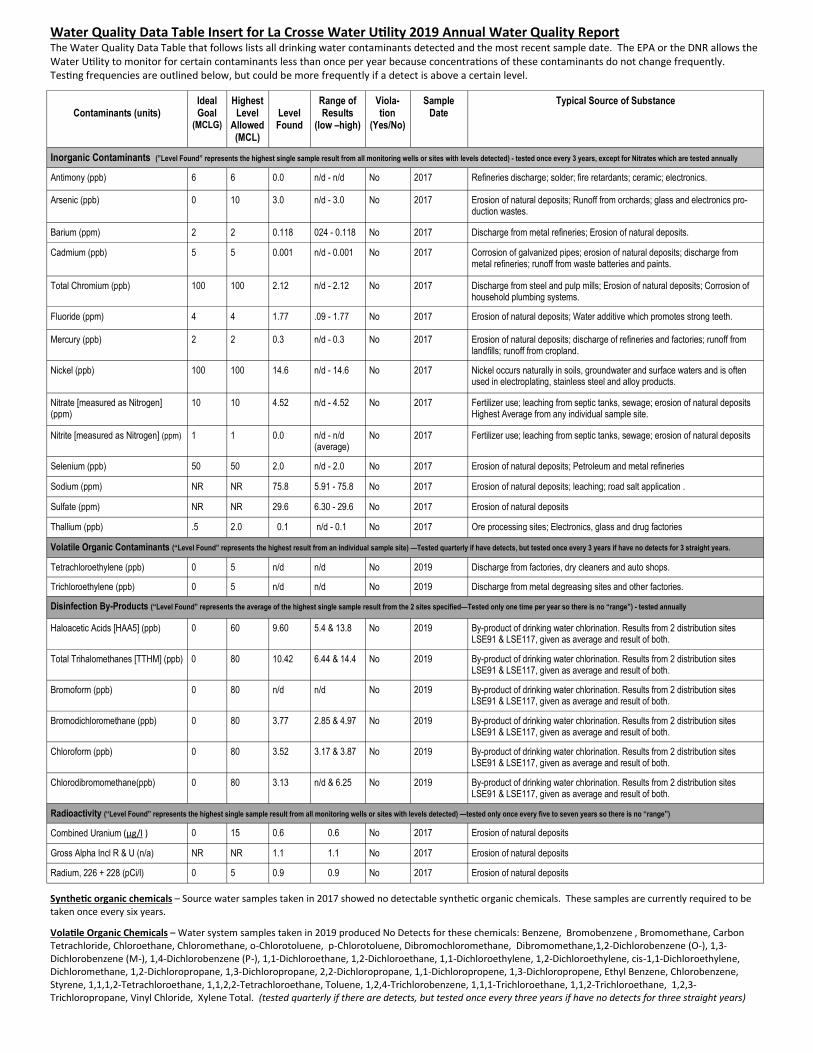
Water Quality Data Table Insert for La Crosse Water U� lity 2019 Annual Water Quality ReportThe Water Quality Data Table that follows lists all drinking water contaminants detected and the most recent sample date. The EPA or the DNR allows theWater U� lity to monitor for certain contaminants less than once per year because concentra� ons of these contaminants do not change frequently. Tes� ng frequencies are outlined below, but could be more frequently if a detect is above a certain level.
Contaminants (units)IdealGoal
(MCLG)
HighestLevel
Allowed(MCL)
LevelFound
Range ofResults
(low –high)
Viola-tion
(Yes/No)
SampleDate
Typical Source of Substance
Inorganic Contaminants (”Level Found” represents the highest single sample result from all monitoring wells or sites with levels detected) - tested once every 3 years, except for Nitrates which are tested annually
Antimony (ppb) 6 6 0.0 n/d - n/d No 2017 Refineries discharge; solder; fire retardants; ceramic; electronics.
Arsenic (ppb) 0 10 3.0 n/d - 3.0 No 2017 Erosion of natural deposits; Runoff from orchards; glass and electronics pro-duction wastes.
Barium (ppm) 2 2 0.118 024 - 0.118 No 2017 Discharge from metal refineries; Erosion of natural deposits.
Cadmium (ppb) 5 5 0.001 n/d - 0.001 No 2017 Corrosion of galvanized pipes; erosion of natural deposits; discharge frommetal refineries; runoff from waste batteries and paints.
Total Chromium (ppb) 100 100 2.12 n/d - 2.12 No 2017 Discharge from steel and pulp mills; Erosion of natural deposits; Corrosion ofhousehold plumbing systems.
Fluoride (ppm) 4 4 1.77 .09 - 1.77 No 2017 Erosion of natural deposits; Water additive which promotes strong teeth.
Mercury (ppb) 2 2 0.3 n/d - 0.3 No 2017 Erosion of natural deposits; discharge of refineries and factories; runoff fromlandfills; runoff from cropland.
Nickel (ppb) 100 100 14.6 n/d - 14.6 No 2017 Nickel occurs naturally in soils, groundwater and surface waters and is oftenused in electroplating, stainless steel and alloy products.
Nitrate [measured as Nitrogen](ppm)
10 10 4.52 n/d - 4.52 No 2017 Fertilizer use; leaching from septic tanks, sewage; erosion of natural depositsHighest Average from any individual sample site.
Nitrite [measured as Nitrogen] (ppm) 1 1 0.0 n/d - n/d(average)
No 2017 Fertilizer use; leaching from septic tanks, sewage; erosion of natural deposits
Selenium (ppb) 50 50 2.0 n/d - 2.0 No 2017 Erosion of natural deposits; Petroleum and metal refineries
Sodium (ppm) NR NR 75.8 5.91 - 75.8 No 2017 Erosion of natural deposits; leaching; road salt application .
Sulfate (ppm) NR NR 29.6 6.30 - 29.6 No 2017 Erosion of natural deposits
Thallium (ppb) .5 2.0 0.1 n/d - 0.1 No 2017 Ore processing sites; Electronics, glass and drug factories
Volatile Organic Contaminants (“Level Found” represents the highest result from an individual sample site) —Tested quarterly if have detects, but tested once every 3 years if have no detects for 3 straight years.
Tetrachloroethylene (ppb) 0 5 n/d n/d No 2019 Discharge from factories, dry cleaners and auto shops.
Trichloroethylene (ppb) 0 5 n/d n/d No 2019 Discharge from metal degreasing sites and other factories.
Disinfection By-Products (“Level Found” represents the average of the highest single sample result from the 2 sites specified—Tested only one time per year so there is no “range”) - tested annually
Haloacetic Acids [HAA5] (ppb) 0 60 9.60 5.4 & 13.8 No 2019 By-product of drinking water chlorination. Results from 2 distribution sitesLSE91 & LSE117, given as average and result of both.
Total Trihalomethanes [TTHM] (ppb) 0 80 10.42 6.44 & 14.4 No 2019 By-product of drinking water chlorination. Results from 2 distribution sitesLSE91 & LSE117, given as average and result of both.
Bromoform (ppb) 0 80 n/d n/d No 2019 By-product of drinking water chlorination. Results from 2 distribution sitesLSE91 & LSE117, given as average and result of both.
Bromodichloromethane (ppb) 0 80 3.77 2.85 & 4.97 No 2019 By-product of drinking water chlorination. Results from 2 distribution sitesLSE91 & LSE117, given as average and result of both.
Chloroform (ppb) 0 80 3.52 3.17 & 3.87 No 2019 By-product of drinking water chlorination. Results from 2 distribution sitesLSE91 & LSE117, given as average and result of both.
Chlorodibromomethane(ppb) 0 80 3.13 n/d & 6.25 No 2019 By-product of drinking water chlorination. Results from 2 distribution sitesLSE91 & LSE117, given as average and result of both.
Radioactivity (“Level Found” represents the highest single sample result from all monitoring wells or sites with levels detected) —tested only once every five to seven years so there is no “range”)
Combined Uranium (µg/l ) 0 15 0.6 0.6 No 2017 Erosion of natural deposits
Gross Alpha Incl R & U (n/a) NR NR 1.1 1.1 No 2017 Erosion of natural deposits
Radium, 226 + 228 (pCi/l) 0 5 0.9 0.9 No 2017 Erosion of natural deposits
Synthe� c organic chemicals – Source water samples taken in 2017 showed no detectable synthe� c organic chemicals. These samples are currently required to be taken once every six years.
Vola� le Organic Chemicals – Water system samples taken in 2019 produced No Detects for these chemicals: Benzene, Bromobenzene , Bromomethane, CarbonTetrachloride, Chloroethane, Chloromethane, o-Chlorotoluene, p-Chlorotoluene, Dibromochloromethane, Dibromomethane,1,2-Dichlorobenzene (O-), 1,3-Dichlorobenzene (M-), 1,4-Dichlorobenzene (P-), 1,1-Dichloroethane, 1,2-Dichloroethane, 1,1-Dichloroethylene, 1,2-Dichloroethylene, cis-1,1-Dichloroethylene,Dichloromethane, 1,2-Dichloropropane, 1,3-Dichloropropane, 2,2-Dichloropropane, 1,1-Dichloropropene, 1,3-Dichloropropene, Ethyl Benzene, Chlorobenzene,Styrene, 1,1,1,2-Tetrachloroethane, 1,1,2,2-Tetrachloroethane, Toluene, 1,2,4-Trichlorobenzene, 1,1,1-Trichloroethane, 1,1,2-Trichloroethane, 1,2,3-Trichloropropane, Vinyl Chloride, Xylene Total. (tested quarterly if there are detects, but tested once every three years if have no detects for three straight years)

UCMR4 Addi� onal Sampling Program Data Table -La Crosse Water U� lity 2019 Annual Water Quality Report (See Reverse side for Annual Water Quality Data Table)
The La Crosse Water U� lity was selected to par� cipate in the 4th cycle of sampling required by USEPA's Unregulated Contaminant Monitoring Rule (UCMR4). This sampling program is in addi� on to annual sampling required by the Wisconsin DNR. The purpose of this addi� onal sampling is to monitory currently unregulated contaminants in drinking water and to provide data to the USEPS to support decisions concerning whetherfuture regula� ons of these contaminants is required to protect public health. UCMR4 samples were taken at all City wells and from the water distribu� on system, star� ng in 2018 and finishing in 2019. Please contact Bernard Lenz, U� li� es Manager, at the La Crosse U� li� es Office, 400 La Crosse Street, La Crosse, WI 54601 or at (608) 789-7536, with any ques� ons.
The following data represents the results of the Water U� lity's par� cipa� on in EPA's third round of samples under the Unregulated Contaminant Monitoring Rule (UCMR4).
Notes:
1. “Range” reflects results from all monitoring sites or distribu� on system loca� ons. 2. “Highest Single Sample” reflects highest single sample result from all monitoring well sites or distribu� on system loca� ons. 3. “Average” value reflects calculated average of all sample units. 4. The USEPA has issued a Drinking Water Health Advisory for Perfluoro Octanesulfonic Acid (PFOAs), at an advisory level of 70 ng/l (parts per
trillion.) One City well (Well 23) had one sample result over the advisory level and was removed from opera� on in 2016. Note, that all samples from the water distribu� on system, taken concurrently with samples from Well 23, had no reportable levels of PFOAs.
Contaminants (units) MinimumReporting
Level(MRL)
MedianLevelFound
HighestSingleSample
Range ofResults
(low –high)
SampleDate
Violation(Yes/No)
Source and sampling information Notes
Samples Taken from Wells
Germanium (ppb) 0.300 n/d n/d n/d - n/d 2018-2019 No Samples from all 13 active city wells 1,2,3
Manganese (ppb) 0.400 90.08 482 n/d - 482 2018-2019 No Samples from all 13 active city wells 1,2,3
Alpha-Hexachlorocyclohexane (ppb) 0.010 n/d n/d n/d - n/d 2018-2019 No Samples from all 13 active city wells 1,2,3
Chlorpyrifos (ppb) 0.030 n/d n/d n/d - n/d 2018-2019 No Samples from all 13 active city wells 1,2,3
Dimethipin (ppb) 0.200 n/d n/d n/d - n/d 2018-2019 No Samples from all 13 active city wells 1,2,3
Ethoprop (ppb) 0.030 n/d n/d n/d - n/d 2018-2019 No Samples from all 13 active city wells 1,2,3
Oxyfluorfen (ppb) 0.050 n/d n/d n/d - n/d 2018-2019 No Samples from all 13 active city wells 1,2,3
Profenofos (ppb) 0.300 n/d n/d n/d - n/d 2018-2019 No Samples from all 13 active city wells 1,2,3
Tebuconazole (ppb) 0.200 n/d n/d n/d - n/d 2018-2019 No Samples from all 13 active city wells 1,2,3
Permethrin, CIS & TRANS (ppb) 0.040 n/d n/d n/d - n/d 2018-2019 No Samples from all 13 active city wells 1,2,3
Tribufos (ppb) 0.070 n/d n/d n/d - n/d 2018-2019 No Samples from all 13 active city wells 1,2,3
Butyated Hydroxyanisole (ppb) 0.030 n/d n/d n/d - n/d 2018-2019 No Samples from all 13 active city wells 1,2,3
O-Toluidine (ppb) 0.007 .0008 .0222 n/d - .0222 2018-2019 No Samples from all 13 active city wells 1,2,3
Quinoline (ppb) 0.020 n/d n/d n/d - n/d 2018-2019 No Samples from all 13 active city wells 1,2,3
1-Butanol (ppb) 2.000 n/d n/d n/d - n/d 2018-2019 No Samples from all 13 active city wells 1,2,3
2-Methoxyethanol (ppb) 0.400 n/d n/d n/d - n/d 2018-2019 No Samples from all 13 active city wells 1,2,3
2-Propen-1-OL (ppb) 0.500 n/d n/d n/d - n/d 2018-2019 No Samples from all 13 active city wells 1,2,3
Bromide (ppb) 20.0 42.5 82.4 20.8 - 82.4 2018-2019 No Samples from all 13 active city wells 1,2,3
Total Organic Carbon (TOC) (ppb) 1000 568.85 2020 n/d - 2020 2018-2019 No Samples from all 13 active city wells 1,2,3
Samples taken from Distribution System
Bromochloroacetic Acid (ppb) 0.300 1.22 2.75 n/d - 2.75 2018-2019 No Samples from 4 distribution system locations 1,2,3
Bromodichloroacetic Acid (ppb) 0.500 0.823 1.74 n/d - 1.74 2018-2019 No Samples from 4 distribution system locations 1,2,3
Chlorodibromoacetic Acid(ppb) 0.300 1.19 1.90 0.493 - 1.90 2018-2019 No Samples from 4 distribution system locations 1,2,3
Dibromoacetic Acid(ppb) 0.300 1.30 2.81 0.302 - 2.81 2018-2019 No Samples from 4 distribution system locations 1,2,3
Dichloroacetic Acid (ppb) 0.200 0.687 1.28 n/d - 1.28 2018-2019 No Samples from 4 distribution system locations 1,2,3
Monobromoacetic Acid (ppb) 0.300 n/d n/d n/d - n/d 2018-2019 No Samples from 4 distribution system locations 1,2,3
Monochloroacetic Acid (ppb) 2.000 n/d n/d n/d - n/d 2018-2019 No Samples from 4 distribution system locations 1,2,3
Tribromoacetic Acid (ppb) 2.000 n/d n/d n/d - n/d 2018-2019 No Samples from 4 distribution system locations 1,2,3
Trichloroacetic Acid (ppb) 0.500 0.450 1.09 n/d - 1.09 2018-2019 No Samples from 4 distribution system locations 1,2,3