L-325 Sagebrush Habitat Mitigation Project: Final ... · 1 L-325 compensation mitigation area ......
20
PNNL-22809 Prepared for the U.S. Department of Energy under Contract DE-AC05-76RL01830 L-325 Sagebrush Habitat Mitigation Project: Final Compensation Area Monitoring Report RE Durham JM Becker September 2013
-
Upload
duongthuan -
Category
Documents
-
view
215 -
download
0
Transcript of L-325 Sagebrush Habitat Mitigation Project: Final ... · 1 L-325 compensation mitigation area ......
PNNL-22809
Prepared for the U.S. Department of Energy under Contract DE-AC05-76RL01830
L-325 Sagebrush Habitat Mitigation Project: Final Compensation Area Monitoring Report RE Durham JM Becker September 2013
DISCLAIMER
PNNL-22809
L-325 Sagebrush Habitat Mitigation Project: Final Compensation Area Monitoring Report RE Durham JM Becker September 2013 Prepared for the U.S. Department of Energy under Contract DE-AC05-76RL01830 Pacific Northwest National Laboratory Richland, Washington 99352

iii
Summary
This document provides a review and status of activities conducted in support of the Fluor Daniel Hanford Company (Fluor), now Mission Support Alliance (MSA), Mitigation Action Plan (MAP) for Project L-325, Electrical Utility Upgrades (2007). Three plantings have been installed on a 4.5-hectare mitigation area to date. This review provides a description and chronology of events, monitoring results, and mitigative actions through fiscal year (FY) 2012. Also provided is a review of the monitoring methods, transect layout, and FY 2012 monitoring activities and results for all planting years.
Planting densities and performance criteria stipulated in the MAP were aimed at a desired future condition (DFC) of 10 percent mature sagebrush (Artemisia tridentata ssp wyomingensis) cover. Current recommendations for yielding this DFC are based upon a conceptual model planting of 1000 plants/ha (400/ac) exhibiting a 60-percent survival rate after 5 monitoring years (DOE 2003). Accordingly, a DFC after 5 monitoring years would not be less than 600 plants/ha (240/ac).
To date, about 8700 sagebrush plants have been grown and transplanted onto the mitigation site. Harsh site conditions and low seedling survival have resulted in an estimated 489 transplants/ha on the mitigation site, which is 111 plants/ha short of the target DFC. Despite this apparent shortcoming, 71, 91, and 24 percent of the surviving seedlings planted in FY 2007 and FY 2008 and FY 2010, respectively, showed signs of blooming in FY 2012. Blooming status may be a positive indication of future sagebrush recruitment, and is therefore a potential source for reaching the target DFC of 600 plants/ha on this mitigation site over time.
Because of the difficulty establishing small transplants on this site, we propose that no additional plantings be considered for this mitigation area and to rely upon the potential recruitment by established seedlings to achieve the mitigation commitment set forth in the MAP of 600 plants/ha.

v
Contents
Summary ............................................................................................................................................... iii 1.0 Introduction .................................................................................................................................. 1 2.0 Background ................................................................................................................................... 1 3.0 Methods ........................................................................................................................................ 3
3.1 Transect Layout .................................................................................................................... 3 3.2 Time-Zero Mapping ............................................................................................................. 3 3.3 Annual Monitoring ............................................................................................................... 4
4.0 Results .......................................................................................................................................... 4 4.1 Time-Zero Planting Densities .............................................................................................. 4 4.2 Transplant Survival .............................................................................................................. 5 4.3 Transplant Height ................................................................................................................. 6
5.0 Discussion ..................................................................................................................................... 7 6.0 Conclusions .................................................................................................................................. 8 7.0 References .................................................................................................................................... 8
Figures
1 L-325 compensation mitigation area ............................................................................................ 2 2 Conceptual monitoring layout and areas planted in fiscal years 2007, 2008, and 2010 ............... 4 3 Transplant survival by planting year and monitoring season ....................................................... 5 4 FY 2012 blooming status by planting year across the L-325 mitigation planting site.................. 6 5 Average transplant height over time by planting year .................................................................. 7 6 Estimated number of established transplants per hectare across the L-325 mitigation site
over time ....................................................................................................................................... 8

1
1.0 Introduction
This document provides a final review of activities conducted in support of the Fluor Daniel Hanford Company (Fluor), now Mission Support Alliance (MSA), Mitigation Action Plan (MAP) for Project L-325, Electrical Utility Upgrades (2007). Annual monitoring results are presented for planting activities conducted in February 2007, January 2008, and December 2009. A discussion outlines the recommendations for completion of the U.S. Department of Energy (DOE) habitat mitigation commitments stipulated in the MAP for this project.
2.0 Background
Installation of the new 13.8-kV electrical distribution line on the Hanford Site between the 251-W substation and the 100-K Area resulted in the loss of nearly 1.5 ha (3.7 ac) of mature sagebrush habitat. Hanford Site biological resource management guidelines in place at the time of the installation stipulated compensatory mitigation via habitat replacement for this level and type of disturbance (DOE 2001, 2003). In response, a MAP was prepared to outline the goals and measures needed to compensate for these ecological resource losses (Fluor 2007).
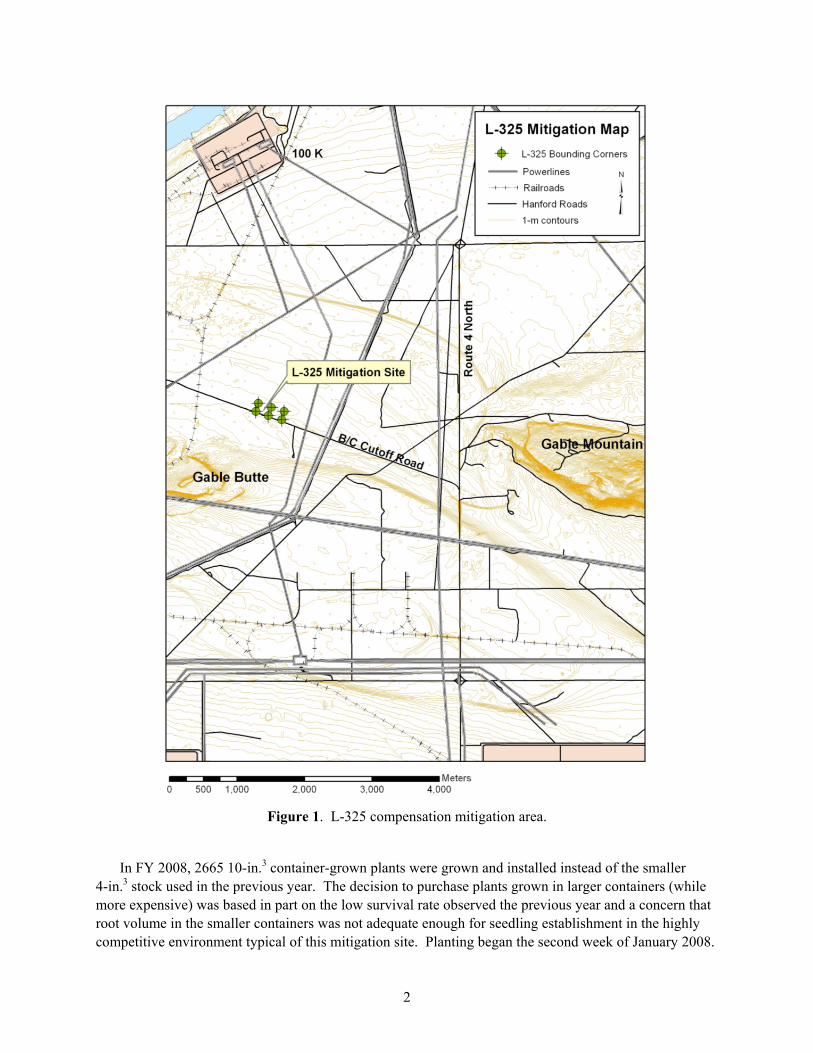
An area replacement ratio of 3:1 was identified in the MAP. As a result, a 4.5-ha (11-ac) site was designated for the compensation mitigation area. The site is located north of the B/C cutoff road and west of the L-325 site of disturbance (Figure 1). Planting densities and performance criteria were aimed at a desired future condition (DFC) of 10 percent mature sagebrush (Artemisia tridentata ssp wyomingensis) cover. Recommendations for yielding this DFC were based upon a conceptual model planting of 1,000 plants/ha (400/ac) yielding a 60-percent survival rate after 5 monitoring years (DOE 2003). Accordingly, a DFC would consist of not less than 600 plants/ha (240/ac). A 5-year monitoring period was stipulated along with a commitment to rectify deficiencies (except for losses due to natural disasters such as fire) with appropriate mitigative actions in the event that transplant survival failed to meet the target DFC of 600 plants/ha (Fluor 2007). Three separate plantings were installed on the mitigation area as a result of low seedling establishment. A chronology of events, including monitoring results and mitigative actions are presented below.
An initial contract was placed with a local grower in 2006 to produce 5000 4-in.3 container-grown Wyoming big sagebrush plants for outplanting during the early winter months of fiscal year (FY) 2007. About 1000 seedlings did not meet minimum quality specifications and were rejected at delivery. This shortfall resulted in planting less than 4000 plants in FY 2007. Other problems were experienced after the ground froze in early December and rescheduling conflicts prevented planting until the last week of February. First-year survival was low across the planting area (27 percent), most likely due to the late-season planting which left insufficient time for transplant establishment prior to spring warm up and the onset of resource competition (Durham and Sackschewsky 2007a). Similar low transplant survival was experienced by other projects using 4-in.3 transplant stock on similar planting sites during the same time period (Durham and Sackschewsky 2007b; Lindsey and Gano 2008).
2
Figure 1. L-325 compensation mitigation area.
In FY 2008, 2665 10-in.3 container-grown plants were grown and installed instead of the smaller
4-in.3 stock used in the previous year. The decision to purchase plants grown in larger containers (while more expensive) was based in part on the low survival rate observed the previous year and a concern that root volume in the smaller containers was not adequate enough for seedling establishment in the highly competitive environment typical of this mitigation site. Planting began the second week of January 2008.
3
Survival after one growing season totaled 73 percent. Survival on the FY 2007 planting dropped another 16 percent to total 11 percent after two monitoring seasons. A DFC of 600 live transplants/ha would not be possible based upon these values, which cumulatively totaled an estimated 530 transplants/ha at the end of FY 2008 (Durham and Sackschewsky 2008).
In FY 2009, seeds were collected and arrangements were made with a local grower to produce 2500 10-in.3 sagebrush seedlings for an early-winter (December) planting in FY 2010. A shortfall of nearly 500 transplants was experienced by the grower during the course of plant production. A total of 2064 10-in.3 seedlings were delivered and planted into deeply moist soil after a two-week hard freeze on December 22, 2009. The ground froze again within a few days after planting with no added precipitation until December 28. The ground remained frozen into the month of January 2010. Survival after one growing season totaled about 20 percent.
Transect layouts and monitoring methods for all planting years are reviewed in Section 3. Monitoring results for all planting years are presented in Section 4, followed by an evaluation of the project’s performance in Section 5. Recommendations to conclude this project are presented in Section 6.
3.0 Methods
3.1 Transect Layout
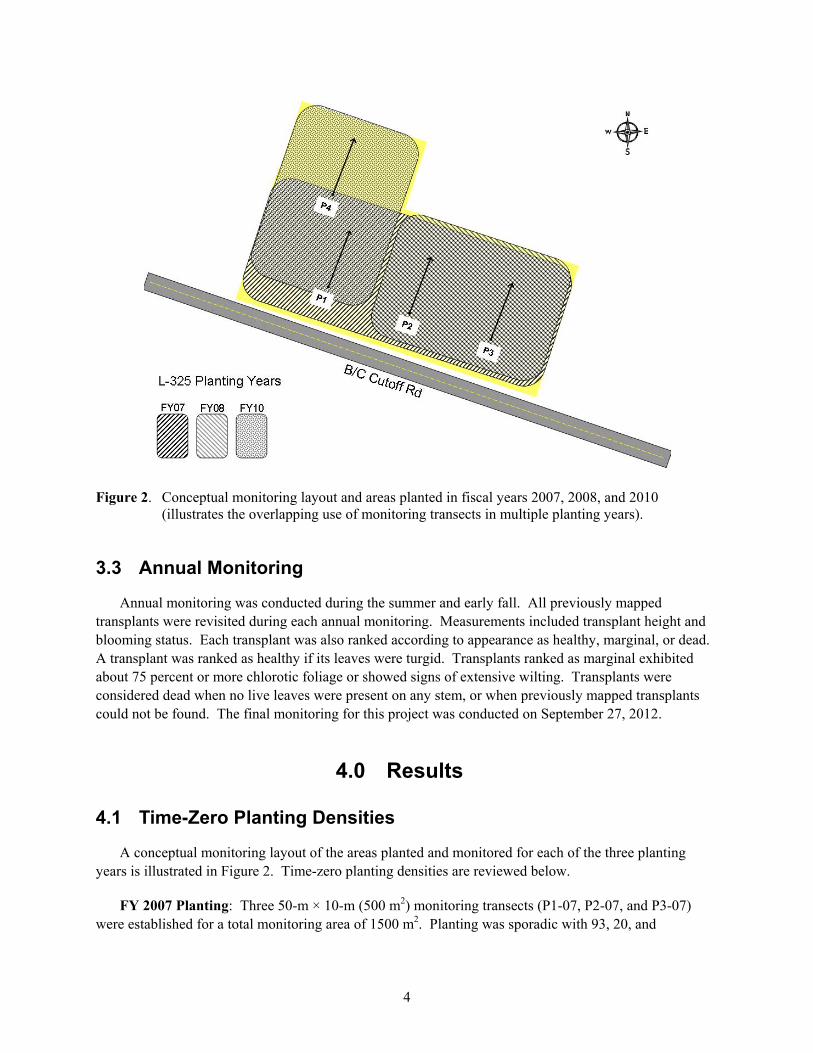
Four permanent monitoring transects were set up in 2006 prior to the first planting in February 2007. Transects were distributed systematically across the mitigation area, each measuring 50 m in length (numbered P1, P2, P3, and P4) (Figure 2). As shown in Figure 2, planting in FY 2007 covered the area represented by transects P1, P2, and P3; in FY 2008, the area surrounding P2 and P3 was replanted; and in FY 2010, the area surrounding P1 was replanted and the area surrounding P4 was planted for the first time. Monitoring transect numbers were labeled with an extension to represent the planting year.
3.2 Time-Zero Mapping
Time-zero mapping was conducted on or near planting day in each planting year to confirm planting quality and a nominal planting density of at least 1000 plants/ha. Transect widths are either 10 m (500 m2) or 20 m (1000 m2) depending on planting year. Two-point coordinates were assigned for each transplant by measuring its distance along the line (point 1), and its distance from the line (point 2). Transplants mapped on the right side of the belt transect (relative to the B/C cutoff road) were assigned positive distance values from the line. Seedlings on the left side were assigned negative distance values. Baseline measurements included seedling height and blooming status. Other measurements taken that were not reported but which are available in the data include two perpendicular canopy widths. Planting densities across the mitigation area were estimated based on the number of seedlings mapped within the area of each transect.
To accommodate multiple plantings on individual monitoring transects, previously mapped transplants were flagged before mapping new transplants.
4
Figure 2. Conceptual monitoring layout and areas planted in fiscal years 2007, 2008, and 2010 (illustrates the overlapping use of monitoring transects in multiple planting years).
3.3 Annual Monitoring
Annual monitoring was conducted during the summer and early fall. All previously mapped transplants were revisited during each annual monitoring. Measurements included transplant height and blooming status. Each transplant was also ranked according to appearance as healthy, marginal, or dead. A transplant was ranked as healthy if its leaves were turgid. Transplants ranked as marginal exhibited about 75 percent or more chlorotic foliage or showed signs of extensive wilting. Transplants were considered dead when no live leaves were present on any stem, or when previously mapped transplants could not be found. The final monitoring for this project was conducted on September 27, 2012.
4.0 Results
4.1 Time-Zero Planting Densities
A conceptual monitoring layout of the areas planted and monitored for each of the three planting years is illustrated in Figure 2. Time-zero planting densities are reviewed below.
FY 2007 Planting: Three 50-m × 10-m (500 m2) monitoring transects (P1-07, P2-07, and P3-07) were established for a total monitoring area of 1500 m2. Planting was sporadic with 93, 20, and
5
34 transplants mapped, respectively. These values suggested an estimated variable rate between 400 to 1860 transplants per hectare at the time of planting (Durham and Sackschewsky 2007a).
FY 2008 Planting: Two, 50-m by 20-m transects (1,000 m2) (P2-08 and P3-08) were centered directly atop the lines established in FY07 (P2-07 and P3-07) for a total monitoring area of 2,000 m2. The number of newly transplanted seedlings along transects P2-08 and P3-08 totaled 89 and 111, respectively. A planting density of 1000 plants/ha was estimated based upon the number of new transplants mapped within the monitoring area (Durham and Sackschewsky 2008).
FY 2010 Planting: Two, 50-m by 10-m transects (500 m2) (P1-10 and P4-10) were mapped for a total monitoring area of 1000 m2. Transect P1-10 was centered atop P1-07. Mapping identified 127 transplants (62 and 65 transplants on transects P1 and P4, respectively). A planting density of 1270 plants/ha was estimated based upon the number of transplants mapped within the monitoring area (Durham and Sackschewsky 2010).
4.2 Transplant Survival
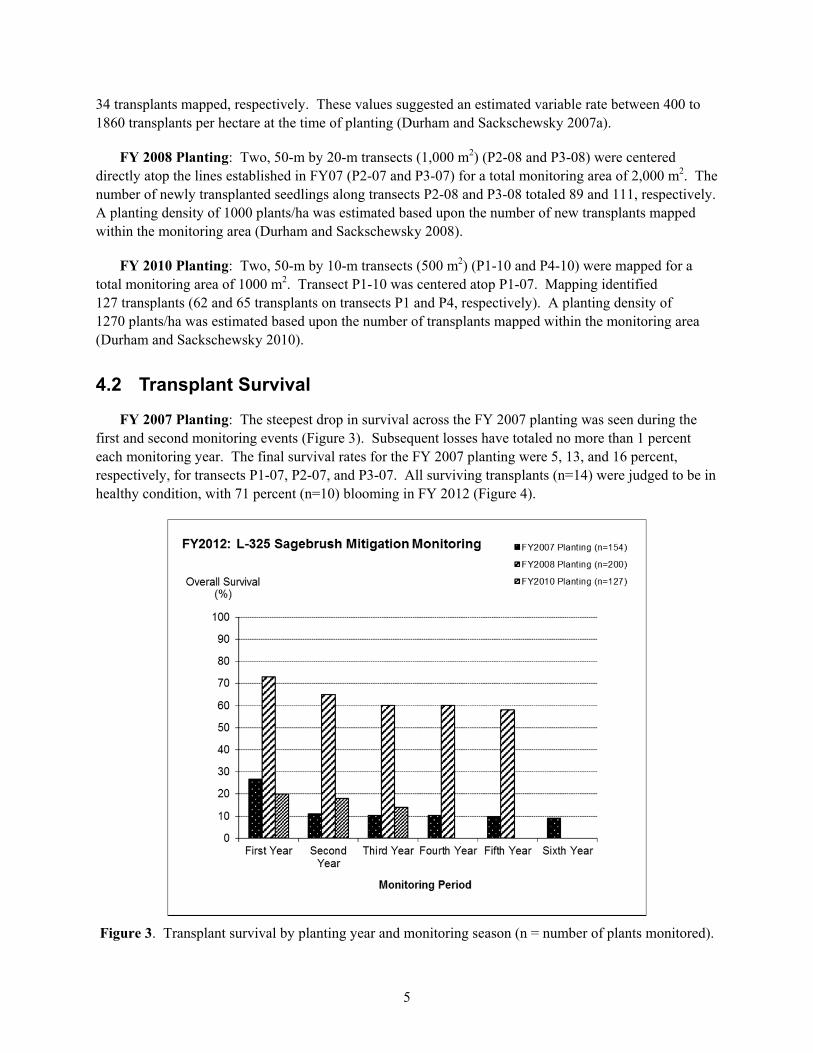
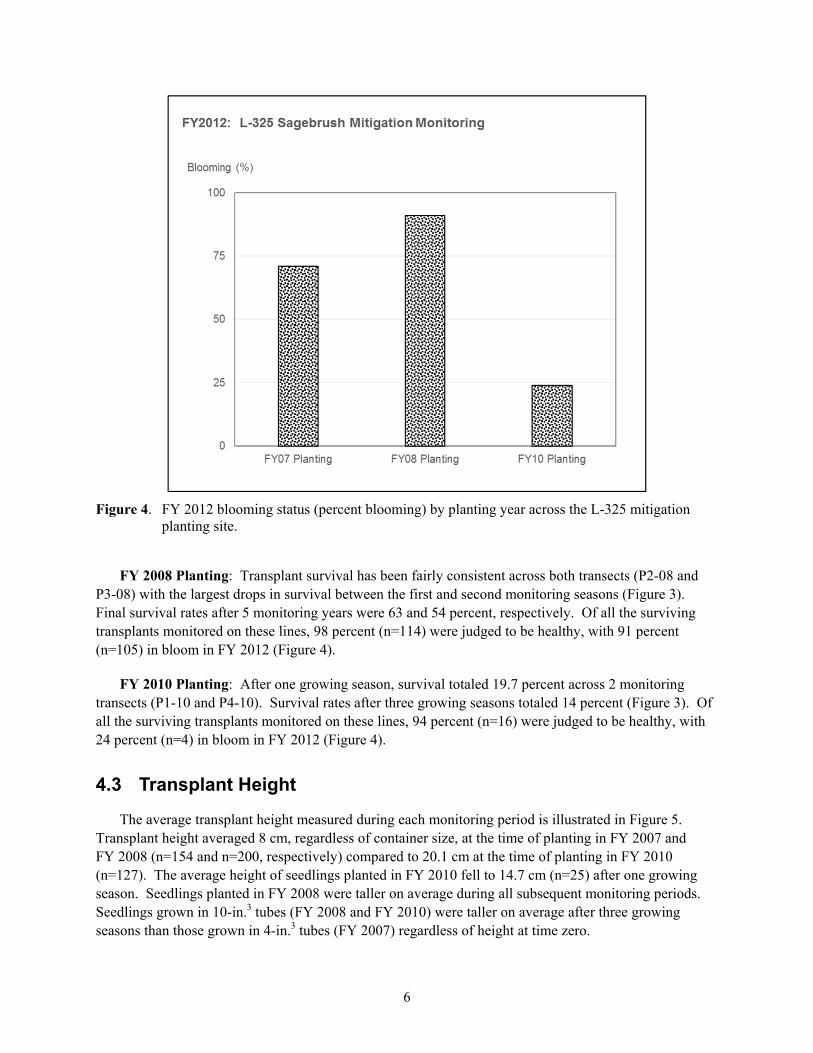
FY 2007 Planting: The steepest drop in survival across the FY 2007 planting was seen during the first and second monitoring events (Figure 3). Subsequent losses have totaled no more than 1 percent each monitoring year. The final survival rates for the FY 2007 planting were 5, 13, and 16 percent, respectively, for transects P1-07, P2-07, and P3-07. All surviving transplants (n=14) were judged to be in healthy condition, with 71 percent (n=10) blooming in FY 2012 (Figure 4).
Figure 3. Transplant survival by planting year and monitoring season (n = number of plants monitored).
6
Figure 4. FY 2012 blooming status (percent blooming) by planting year across the L-325 mitigation planting site.
FY 2008 Planting: Transplant survival has been fairly consistent across both transects (P2-08 and
P3-08) with the largest drops in survival between the first and second monitoring seasons (Figure 3). Final survival rates after 5 monitoring years were 63 and 54 percent, respectively. Of all the surviving transplants monitored on these lines, 98 percent (n=114) were judged to be healthy, with 91 percent (n=105) in bloom in FY 2012 (Figure 4).
FY 2010 Planting: After one growing season, survival totaled 19.7 percent across 2 monitoring transects (P1-10 and P4-10). Survival rates after three growing seasons totaled 14 percent (Figure 3). Of all the surviving transplants monitored on these lines, 94 percent (n=16) were judged to be healthy, with 24 percent (n=4) in bloom in FY 2012 (Figure 4).
4.3 Transplant Height
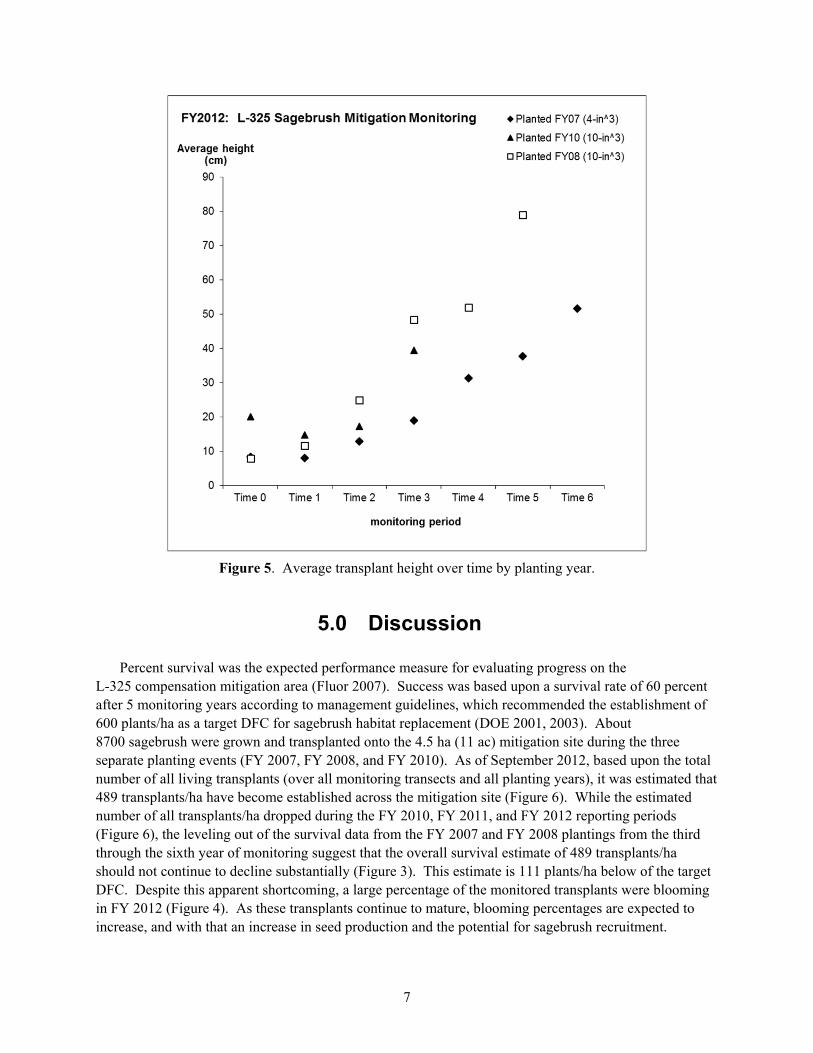
The average transplant height measured during each monitoring period is illustrated in Figure 5. Transplant height averaged 8 cm, regardless of container size, at the time of planting in FY 2007 and FY 2008 (n=154 and n=200, respectively) compared to 20.1 cm at the time of planting in FY 2010 (n=127). The average height of seedlings planted in FY 2010 fell to 14.7 cm (n=25) after one growing season. Seedlings planted in FY 2008 were taller on average during all subsequent monitoring periods. Seedlings grown in 10-in.3 tubes (FY 2008 and FY 2010) were taller on average after three growing seasons than those grown in 4-in.3 tubes (FY 2007) regardless of height at time zero.
7
Figure 5. Average transplant height over time by planting year.
5.0 Discussion
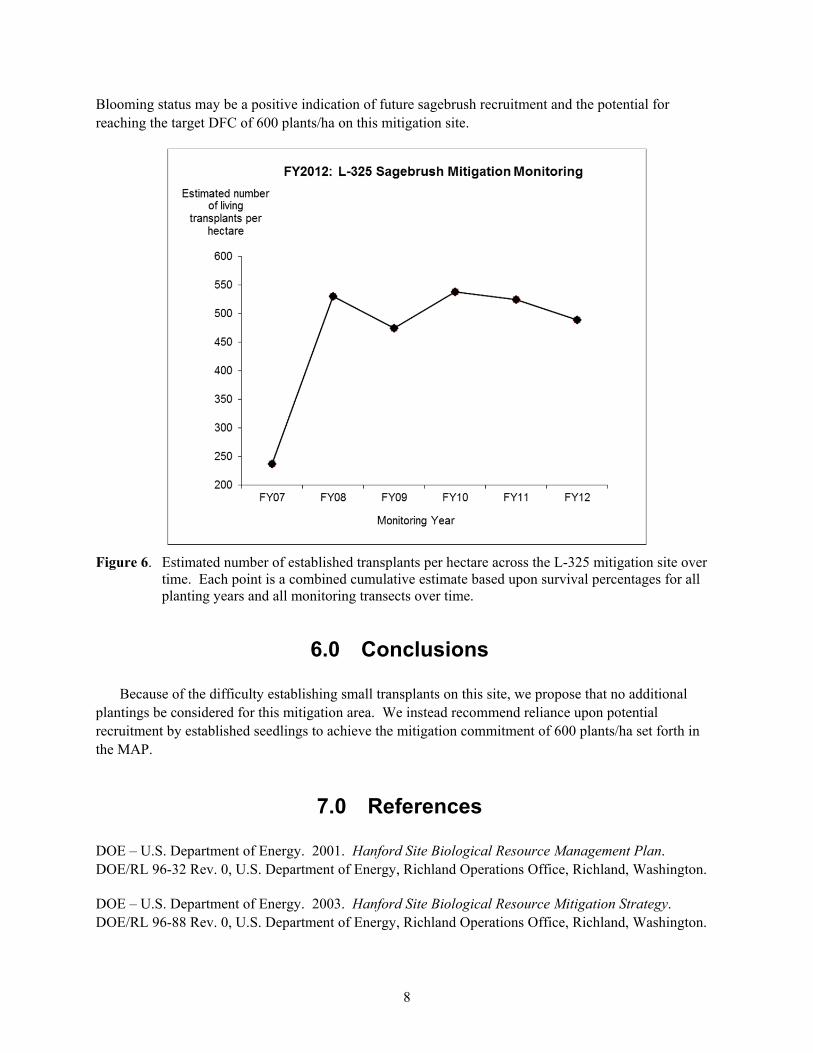
Percent survival was the expected performance measure for evaluating progress on the L-325 compensation mitigation area (Fluor 2007). Success was based upon a survival rate of 60 percent after 5 monitoring years according to management guidelines, which recommended the establishment of 600 plants/ha as a target DFC for sagebrush habitat replacement (DOE 2001, 2003). About 8700 sagebrush were grown and transplanted onto the 4.5 ha (11 ac) mitigation site during the three separate planting events (FY 2007, FY 2008, and FY 2010). As of September 2012, based upon the total number of all living transplants (over all monitoring transects and all planting years), it was estimated that 489 transplants/ha have become established across the mitigation site (Figure 6). While the estimated number of all transplants/ha dropped during the FY 2010, FY 2011, and FY 2012 reporting periods (Figure 6), the leveling out of the survival data from the FY 2007 and FY 2008 plantings from the third through the sixth year of monitoring suggest that the overall survival estimate of 489 transplants/ha should not continue to decline substantially (Figure 3). This estimate is 111 plants/ha below of the target DFC. Despite this apparent shortcoming, a large percentage of the monitored transplants were blooming in FY 2012 (Figure 4). As these transplants continue to mature, blooming percentages are expected to increase, and with that an increase in seed production and the potential for sagebrush recruitment.
8
Blooming status may be a positive indication of future sagebrush recruitment and the potential for reaching the target DFC of 600 plants/ha on this mitigation site.
Figure 6. Estimated number of established transplants per hectare across the L-325 mitigation site over time. Each point is a combined cumulative estimate based upon survival percentages for all planting years and all monitoring transects over time.
6.0 Conclusions
Because of the difficulty establishing small transplants on this site, we propose that no additional plantings be considered for this mitigation area. We instead recommend reliance upon potential recruitment by established seedlings to achieve the mitigation commitment of 600 plants/ha set forth in the MAP.
7.0 References
DOE – U.S. Department of Energy. 2001. Hanford Site Biological Resource Management Plan. DOE/RL 96-32 Rev. 0, U.S. Department of Energy, Richland Operations Office, Richland, Washington.
DOE – U.S. Department of Energy. 2003. Hanford Site Biological Resource Mitigation Strategy. DOE/RL 96-88 Rev. 0, U.S. Department of Energy, Richland Operations Office, Richland, Washington.
9
Durham RE and MR Sackschewsky. 2007a. L-325 Sagebrush Habitat Mitigation Project: FY2007 Compensation Area Monitoring Report. PNNL-16975. Pacific Northwest National Laboratory, Richland, Washington.
Durham RE and MR Sackschewsky. 2007b. IDF Sagebrush Habitat Mitigation Project: FY2007 Compensation Area Monitoring Report. PNNL-16976, Pacific Northwest National Laboratory, Richland, Washington.
Durham RE and MR Sackschewsky. 2008. L-325 Sagebrush Habitat Mitigation Project: FY2008 Compensation Area Monitoring Report. PNNL-17926. Pacific Northwest National Laboratory, Richland, Washington.
Durham RE and MR Sackschewsky. 2010. L-325 Sagebrush Habitat Mitigation Project: FY2010 Compensation Area Monitoring Report. PNNL-19959, Pacific Northwest National Laboratory, Richland, Washington.
Fluor – Fluor Daniel Hanford Company. 2007. Mitigation Action Plan for Project L-325, Electrical Utility Upgrades. HNF-31621, Fluor Daniels Hanford Company, Richland, Washington.
Lindsey CT and KA Gano. 2008. 2008 River Corridor Closure Contractor Revegetation Monitoring Report. WCH-288, Rev. 0, Washington Closure Hanford, Richland, Washington.