Kyuwon Kim, Wonjin Yun, and Rick Kim
5
1 Clustering Music by Genres Using Supervised and Unsupervised Algorithms Kyuwon Kim, Wonjin Yun, and Rick Kim Abstract—This report describes classification methods that recognize the genres of music using both supervised and unsuper- vised learning techniques. The five genres, classical(C), EDM(E), hip-hop(H), jazz(J) and rock(R), were examined and classified. As a feature selection method, discrete Fourier transform (DFT) converted the raw wave signals of each song into the signal amplitude ordered by their frequencies. Based on the analysis of the characteristics of data set, final feature set were collected by averaging the amplitudes of corresponding two different frequency division (XL and XM). For supervised learning, a training set (mtrain = 50/genre) was used to train the CART (Classification and Regression Tree), and the performance of the genre prediction by CART classifier was evaluated using a test set (mtest = 10/genre). A recognition rate of 86.7% for three genre classification (C, H, and R) was observed, and 60.7% for five genre classification (C, E, H, J, and R) was obtained. For unsupervised learning algorithm, K-means clustering was performed on an unlabeled set of data (m = 60/genre) to cluster the music into genres, and showed purity of 84.4% for three genre classification, and 62.0% for five genre classification. Index Terms—Music clustering, K-means, CART I. I NTRODUCTION Most music websites have song recommender systems. There are two commonly used mechanisms in most websites: collaborative filtering and content-based filtering. In collabo- rative filtering, websites gather information about their users’ behavior and preferences to recommend similar items for a user based on peer users’ choices. On the other hand, in content-based filtering, keywords of music such as year, genre and musician are required to predict similar songs. While these mechanisms are effective in recommending similar songs for a user, both mechanisms require a large amount of external data. Collaborative filtering needs sufficient peer users’ data, and content-based filtering requires pre-processed labels on the music. Here, we explore methods to cluster similar songs only using their raw wave files. A genre is a label often used to group similar types of music. Although genres of music are usually determined manually by human, we attempt to predict genres of music without any pre- processed labels or peer choices. In this paper, we have tried to construct models that cluster songs based on their components of raw wave signals and test how well these models can predict the genres determined by human. Given an unknown music file, we aim to implement automatic classification by genres using machine learning techniques. K.Kim is with the Department of Mechanical Engineering, Stanford Uni- versity. W.Yun is with the Department of Energy Resource Engineering, Stanford University. R.Kim is with the Department of Biology, Stanford University. Both supervised and unsupervised learning methods were tested in our study. In the supervised learning test, we used Classification And Regression Tree (CART) to find a model that can effectively classify a new piece of music using some features from the wave signals. In the unsupervised learning test, we used k-means clustering to cluster a set of unlabeled songs into groups of similar features. Confusion matrices and the purity of classification were used to evaluate the performance of the clustering. II. RELATED WORKS There have been a number of studies on predicting the genre of music using features in the wave signals of a music file. The temporal structure of a music piece was often used to recognize the genre of a music. Soltau et al. used the sequence of activation in hidden units and a neural network to classify rock, pop, techno and classical[1]. Shao et al. used a hidden Markov model with sequences of features such as Mel-frequency cepstral coefficients(MFCCs) to cluster pop, country, jazz and classical [4]. Some approaches focused on the direct similarity between the feature sets than the temporal structures. Cilibrasi et al. used a distance function between feature vectors and generated trees by the distances to visualize the similarity between samples of classical, rock and jazz[3]. Peng et al. used features from the signals to perform a k-means clustering, and used some labels as constraints to perform a constraint-based clustering to group a set of songs by their artists.[5]. Tsai et al. used a hierarchial agglomerative clustering method which sequentially merges similar pieces of music[6]. MFCCs were commonly used in many studies, because the Mel-scale represents the perceptual scale of pitches for a person’s hearing. However, some studies also introduced new features such as linear prediction coefficients(LPCs)[4] and Renyi Entropy Cepstral Coefficients(RECCs)[6]. Short- term Fourier Transform features were also used to capture the timbral textures from wave signals[5]. III. METHODOLOGY A. Data and Feature selection Five different genres of music were chosen as our data classes: classical, EDM, hip-hop, jazz and rock. 60 samples from each genre were randomly streamed from YouTube. Each song was sampled using a sampling rate of 44.1kHz, and stereo wave signals were merged to mono wave signals. The whole data set (m = 60/genre) was used without labels to test the unsupervised learning algorithm. For the supervised learning
Transcript of Kyuwon Kim, Wonjin Yun, and Rick Kim

1
Clustering Music by Genres Using Supervised andUnsupervised Algorithms
Kyuwon Kim, Wonjin Yun, and Rick Kim
Abstract—This report describes classification methods thatrecognize the genres of music using both supervised and unsuper-vised learning techniques. The five genres, classical(C), EDM(E),hip-hop(H), jazz(J) and rock(R), were examined and classified.As a feature selection method, discrete Fourier transform (DFT)converted the raw wave signals of each song into the signalamplitude ordered by their frequencies. Based on the analysisof the characteristics of data set, final feature set were collectedby averaging the amplitudes of corresponding two differentfrequency division (XL and XM ). For supervised learning, atraining set (mtrain = 50/genre) was used to train the CART(Classification and Regression Tree), and the performance of thegenre prediction by CART classifier was evaluated using a testset (mtest = 10/genre). A recognition rate of 86.7% for threegenre classification (C, H, and R) was observed, and 60.7%for five genre classification (C, E, H, J, and R) was obtained.For unsupervised learning algorithm, K-means clustering wasperformed on an unlabeled set of data (m = 60/genre) to clusterthe music into genres, and showed purity of 84.4% for three genreclassification, and 62.0% for five genre classification.
Index Terms—Music clustering, K-means, CART
I. INTRODUCTION
Most music websites have song recommender systems.There are two commonly used mechanisms in most websites:collaborative filtering and content-based filtering. In collabo-rative filtering, websites gather information about their users’behavior and preferences to recommend similar items for auser based on peer users’ choices. On the other hand, incontent-based filtering, keywords of music such as year, genreand musician are required to predict similar songs. While thesemechanisms are effective in recommending similar songs fora user, both mechanisms require a large amount of externaldata. Collaborative filtering needs sufficient peer users’ data,and content-based filtering requires pre-processed labels on themusic. Here, we explore methods to cluster similar songs onlyusing their raw wave files.
A genre is a label often used to group similar types of music.Although genres of music are usually determined manually byhuman, we attempt to predict genres of music without any pre-processed labels or peer choices. In this paper, we have tried toconstruct models that cluster songs based on their componentsof raw wave signals and test how well these models can predictthe genres determined by human. Given an unknown musicfile, we aim to implement automatic classification by genresusing machine learning techniques.
K.Kim is with the Department of Mechanical Engineering, Stanford Uni-versity.
W.Yun is with the Department of Energy Resource Engineering, StanfordUniversity.
R.Kim is with the Department of Biology, Stanford University.
Both supervised and unsupervised learning methods weretested in our study. In the supervised learning test, we usedClassification And Regression Tree (CART) to find a modelthat can effectively classify a new piece of music using somefeatures from the wave signals. In the unsupervised learningtest, we used k-means clustering to cluster a set of unlabeledsongs into groups of similar features. Confusion matricesand the purity of classification were used to evaluate theperformance of the clustering.
II. RELATED WORKS
There have been a number of studies on predicting thegenre of music using features in the wave signals of a musicfile. The temporal structure of a music piece was often usedto recognize the genre of a music. Soltau et al. used thesequence of activation in hidden units and a neural networkto classify rock, pop, techno and classical[1]. Shao et al. useda hidden Markov model with sequences of features such asMel-frequency cepstral coefficients(MFCCs) to cluster pop,country, jazz and classical [4].
Some approaches focused on the direct similarity betweenthe feature sets than the temporal structures. Cilibrasi etal. used a distance function between feature vectors andgenerated trees by the distances to visualize the similaritybetween samples of classical, rock and jazz[3]. Peng et al. usedfeatures from the signals to perform a k-means clustering, andused some labels as constraints to perform a constraint-basedclustering to group a set of songs by their artists.[5]. Tsai etal. used a hierarchial agglomerative clustering method whichsequentially merges similar pieces of music[6].
MFCCs were commonly used in many studies, becausethe Mel-scale represents the perceptual scale of pitches fora person’s hearing. However, some studies also introducednew features such as linear prediction coefficients(LPCs)[4]and Renyi Entropy Cepstral Coefficients(RECCs)[6]. Short-term Fourier Transform features were also used to capture thetimbral textures from wave signals[5].
III. METHODOLOGY
A. Data and Feature selection
Five different genres of music were chosen as our dataclasses: classical, EDM, hip-hop, jazz and rock. 60 samplesfrom each genre were randomly streamed from YouTube. Eachsong was sampled using a sampling rate of 44.1kHz, and stereowave signals were merged to mono wave signals. The wholedata set (m = 60/genre) was used without labels to test theunsupervised learning algorithm. For the supervised learning

2
algorithm, 10 samples from each genre were randomly chosenas our test set (mtest = 10/genre), and the remaining datawere used as our training set (mtrain = 50/genre).
To collect features from each sample, Discrete FourierTransform (DFT) was performed on each sample. An array offrequencies {fj}j were defined to divide our frequency rangeof interest into frequency bands of Bj = [fj , fj+1]. Given anarray {fj}j with length n+1, and a raw wave data w(i), ourfeature vector x(i) ∈ Rn is defined as the following :
x(i)j =
∫hj(s)DFT (w
(i))ds (1)
x(i) = x(i)/||x(i)||2 (2)
hj(s) =
{1 if s ∈ Bj
0 otherwise (3)
Each feature vector was normalized to satisfy ||x(i)|| = 1.Two different feature sets XL and XM were used for our testas illustrated in Fig. 1. Initially, we generated 10 frequencybands in (0 ∼ 5000 Hz), and the contribution of each featureto classification of the songs was assessed by CART as shownin Section. III-B and Table. I. Since the lower frequency regionwas found to show more impact on determining the genres inour preliminary results, XL uses the average values of 20 lowfrequency bands (0 ∼ 200Hz) with bandwidth of 10 Hz, and7 mid/high frequency bands (200 ∼ 5000 Hz) with bandwidthof 100 ∼ 1000 Hz. On the other hand, XM uses the averagevalues of a Mel-scale frequency division for 20 ∼ 2000 Hz(20 bands).
B. Supervised Learning
CART, a conceptually simple yet powerful method, wasused to perform a recursive partitioning. In this process, ourdata set was split into two regions R1 and R2 (first andsecond music genre for our study) and the splitting processwas repeated until the stopping rule is applied. The CARTalgorithm automatically decided the splitting variables j andsplit points s until it found the best binary partition. A greedyalgorithm efficiently and quickly determines the best pair (j, s)[7]. In the greedy algorithm [7], the pair of half-planes isdefined as in Eq. 4. The splitting variable and the split pointare solved by Eq. 5 and the the inner minimization is solvedby Eq. 6.
R1(j, s) =
{X | Xj ≤ s
}; R2(j, s) =
{X | Xj > s
}(4)
argminj,s
minc1,c2
∑xi∈R1(j,s)
(yi − c1)2 +∑
xi∈R2(j,s)
(yi − c2)2 (5)
c1 = E(yi | xi ∈ R1(j, s)
); c2 = E
(yi | xi ∈ R2(j, s)
)(6)
For our study, CART (classification tree algorithm ratherthan regression tree) was applied to prioritize a number offeatures among the entire feature space shown in Table.I.For supervised learing, a CART classifier model was trained on
0 5 10 15 20 25 300
0.5
1
cla
ssic
0 5 10 15 20 25 300
0.5
1
edm
0 5 10 15 20 25 300
0.5
1
hip
hop
0 5 10 15 20 25 300
0.5
1
jazz
0 5 10 15 20 25 300
0.5
1
rock
0 2 4 6 8 10 12 14 16 18 200
0.5
1
cla
ssic
0 2 4 6 8 10 12 14 16 18 200
0.5
1
edm
0 2 4 6 8 10 12 14 16 18 200
0.5
1
hip
hop
0 2 4 6 8 10 12 14 16 18 200
0.5
1
jazz
0 2 4 6 8 10 12 14 16 18 200
0.5
1
rock
Figure 1. Features XL (upper) and XM (lower) sampled from 5 genres :classical, EDM, hip-hop, jazz and rock.
a balanced training data set (mtraining = 50/genre). A built-in algorithm, rpart [8], was used in R software to performCART and the optimal classification tree size was adaptivelychosen from the data by cost-complexity pruning [8] using thenode impurity, Qm(T ) = 1− pmk(m) described in Eq. 7.
pmk(m) =1
Nm
∑xi∈Rm
I(yi = k(m)) (7)
where pmk is the proportion of class k ( genre for our study)observation in node m.
The recursive binary tree is illustrated in Fig. 2 that fullydescribes the feature space partition corresponding to thepartitioning of the songs in the regions Rm (three or fivegenres for our study).

3
Table ICART FEATURE IMPORTANCE
10 features (Hz)Feature 2nd (50-100) 1st (0-50) 3th (100-200)
Importance 26 20 19
Table 1 : Classification tree (CART) trained on 90 pre-labeled songs with 10features ranged from 0 Hz to 5000 Hz shows that 46 songs among 90 songswere recognized by the first two features (frequency band from 0 to 100 Hz).
Figure 2. CART for 3 (Upper:mtrain = 150)) genres and 5(Lower:mtrain = 250) genres are demonstrated using XL.
C. Unsupervised Learning
K-means clustering was performed on our data set to clusterthe samples. One sample from each genre were randomlychosen as our initial pivots. Prior to k-means, PCA wasperformed to extract the significant components from ourfeature sets. Only the top 10 components were used to runthe clustering. Fig. 3 and Fig. 4 show the data distribution intop 3 principal components. The test was performed for i) athree genre classification (classical, hip-hop, rock), and ii) afive genre classification. The whole data set (m = 60/genre)was used for the classification. To evaluate the performance ofour classification, the purity and Rand Index(RI) were used.The purity of a clustering represents how homogeneous eachcluster is in average, and RI gives us the accuracy of theclassifier when any two random samples are chosen from thedata set and compared.
IV. RESULTS
A. Supervised Learning
CART was performed for a three genre classification testand a five genre classification test, using feature sets XL andXM . In a 3-genre classification, the classifier showed recogni-tion rates of 77.2% (σ = 7.42) with XL and 86.7% (σ = 4.27)with XM , displaying a significantly better performance forXM . On a 5-genre classification, the recognition rates declinedto 54.7% (σ = 6.02) and 60.7% (σ = 4.32) respectively, alsodisplaying a better performance for XM .
−6 −4 −2 0 2 4 6
−4
−2
0 2
4
−3
−2
−1
0
1
2
3
4
1st pc
2n
d p
c
3rd
pc
1
11 1
1
1
111
11
11
1
1
1
1
11
1
1
11
11
1
1
1
1
1
2
2 2
2
2
22
2
2
2 22
2
2
2
2
22
2
2 2
2
2
2
2
22
22
3
3 3
3
33
3
3
3
33
3
33
3333 3
333
3
3
3
3
3
3
3
Figure 3. PCA result for three genres using feature set XM . PCA plot from 3genres effectively visualizes the distance between songs. In the plot, first twoprincipal components efficiently classifies classical (1) from the other genres,and third principal components separate the hip-hop(2) from rock (3).
−6 −4 −2 0 2 4 6 8
−6
−4
−2
0 2
4 6
−6−4
−2 0
2 4
6
1st pc
2nd p
c
3rd
pc
111
1
1
1 1
1
1
1
1
1
11
1
11
1
1
1
1
1
1
1
1
1 1
1
1
11
1
1
1
1
1
11
11
1
11
1
1 1
1
1
1
1
1
11 1
1
112
2
2
222
22 22 2
2
22
22
22
2
22
2
2
2
2
2
2
2 22
2
2
22
2 2
22
2
2
2
2
22
2
2
2
22
22
22 2
3
3
3
3
33
3
3
33
33
33
3
3
3
3
3
3
3
3
3
333
3
3
33
3
3
3
3
3
3
33
3
3
3
444
4
4
44
4
44
4
4
4
4
44
4
4
4
4
4
4
4
4
4
44
44
4
4
4
4
4
4
4
4
4 4
4
4
4
44
4
44
4
4
4
44
4
4
44
4
455
5
55
5
55
5
5
5
5
5
5
55
5
55
5
5
5
555
5
5
5
555
5
5
5
5
5
5
5
55
5
5
5 5
5
55
5
5
55
5
5
555
55
5
5
Figure 4. PCA result for five genres using feature set XM . PCA plot from 5genres effectively visualizes the similarity and difference between songs. Theplot exhibits the genre similarity between EDM (2) and hip-hop (3); jazz (4)and rock (5). And, it can be noted that the plot demonstrates the widest spanof jazz (4) compared to the highly-localized classical (1).
B. Unsupervised Learning
The purity for a three genre classification was 0.822 withfeature set XL and 0.844 with XM . There was a significantdrop in the purity when the number of genres increased from3 to 5, showing 0.620 with XL and 0.597 with XM , resultingin -0.224 decline in average. It also shows that feature set XM
was more effective for classifying the three genres, while XL
appeared to have a better performance when the number ofgenres increased.
Meanwhile, the RI for a three genre classification was0.790 with XL and 0.817 with XM . It also did not showmuch decline (-0.033 in average) when the number of genresincreased, resulting in 0.767 for XL and 0.774 for XM .
These values could not be directly compared with the resultsfrom other studies since the data set and the chosen genreswere different. Also, some studies [6] use different waysto define the purity and RI. Although we belive our resultshave shown satisfying performance, there are possibilities toimprove the performance.
C. Confusion between genres
Both learning algorithms tried performed significantly betterwith a 3-genre classification. In Table. III, the confusion matrix
4
Table IICONFUSION MATRICES FOR THREE GENRE CLASSIFICATION
(a) Feature set XL (b) Feature set XM
C1 C2 C3
Classical 45 0 15
Hip-hop 0 49 11
Rock 5 1 54
C1 C2 C3
Classical 50 0 10
Hip-hop 0 51 9
Rock 5 4 51
Table II : Clustering results for a three genre classification using feature setsXL (left) and XM (right). The purity and RI are (a) 0.822, 0.790 and (b)0.844, 0.817 respectively.
Table IIICONFUSION MATRICES FOR FIVE GENRE CLASSIFICATION
(a) Feature set XL
C1 C2 C3 C4 C5
Classical 37 0 0 9 14
EDM 0 51 7 0 2
Hip-hop 0 30 26 0 4
Jazz 3 7 1 39 10
Rock 3 16 0 8 33
(b) Feature set XM
C1 C2 C3 C4 C5
Classical 47 0 2 9 2
EDM 0 48 5 0 7
Hip-hop 0 35 17 0 8
Jazz 10 2 2 23 23
Rock 4 6 0 6 44
Table III : Clustering results for a five genre classification using feature setsXL (upper) and XM (lower). The purity and RI are (a) 0.620, 0.767 and (b)0.597, 0.774 respectively.
shows that EDM was frequently confused with hip-hop, whilejazz was often mistaken as rock. The PCA result in Fig. 4 alsodemonstrates how these genres are closely distributed on theprincipal component space. This shows that some genres canbe closer than other genres in our feature set.
In order to examine the distance between genres, we con-structed a neighbor graph based on the L2-norm distances offeature set XM in Fig. 5. For each sample, only the sevenmost nearest samples were considered as neighbors. Proximityscores were calculated using the graph, which gives a higherscore if the two samples are closely related to each other. Theproximity score of two samples x(i), x(j) were calculated asthe following :
sij =∑k 6=i,j
exp(−||x(i) − x(k)|| − ||x(j) − x(k)||) (8)
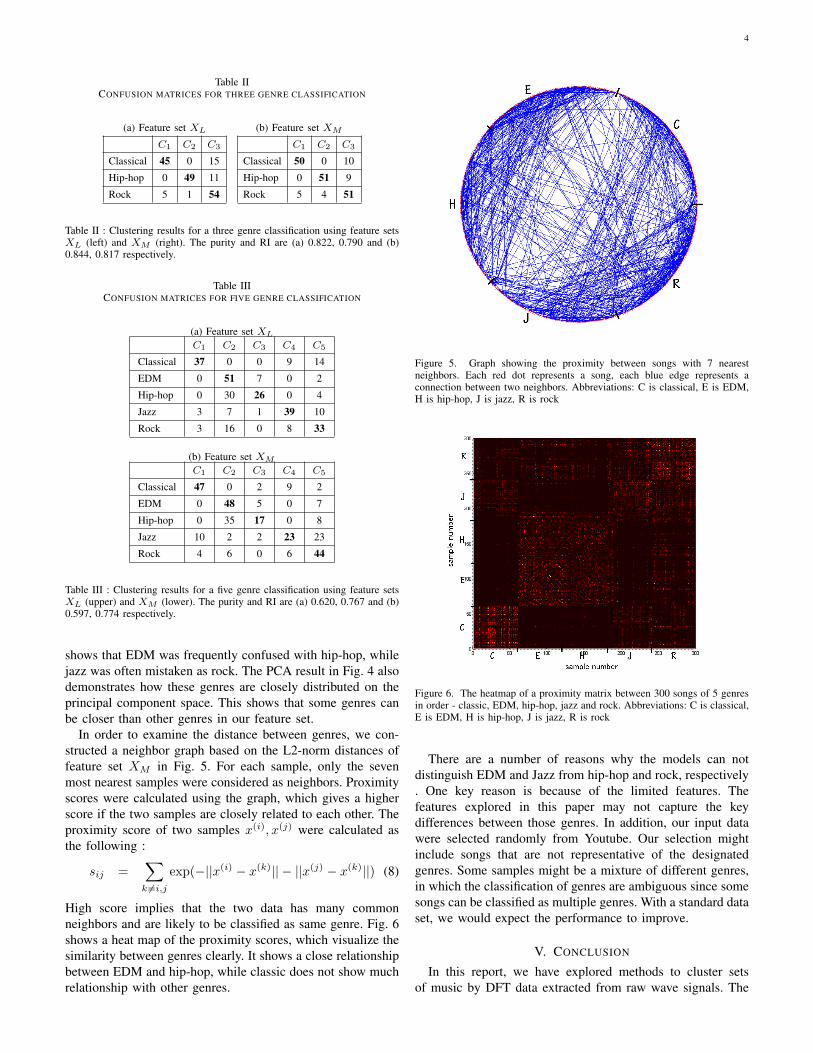
High score implies that the two data has many commonneighbors and are likely to be classified as same genre. Fig. 6shows a heat map of the proximity scores, which visualize thesimilarity between genres clearly. It shows a close relationshipbetween EDM and hip-hop, while classic does not show muchrelationship with other genres.
Figure 5. Graph showing the proximity between songs with 7 nearestneighbors. Each red dot represents a song, each blue edge represents aconnection between two neighbors. Abbreviations: C is classical, E is EDM,H is hip-hop, J is jazz, R is rock
Figure 6. The heatmap of a proximity matrix between 300 songs of 5 genresin order - classic, EDM, hip-hop, jazz and rock. Abbreviations: C is classical,E is EDM, H is hip-hop, J is jazz, R is rock
There are a number of reasons why the models can notdistinguish EDM and Jazz from hip-hop and rock, respectively. One key reason is because of the limited features. Thefeatures explored in this paper may not capture the keydifferences between those genres. In addition, our input datawere selected randomly from Youtube. Our selection mightinclude songs that are not representative of the designatedgenres. Some samples might be a mixture of different genres,in which the classification of genres are ambiguous since somesongs can be classified as multiple genres. With a standard dataset, we would expect the performance to improve.
V. CONCLUSION
In this report, we have explored methods to cluster setsof music by DFT data extracted from raw wave signals. The

5
most challenging part was the feature selection. The DFTdata were decomposed into two sets of frequency bands (XL
and XM ) within the frequency range (0-5000 Hz) and (0-2000Hz), considering the range of frequencies used by mostmusic instruments in songs. Two different learning algorithms,CART and k-means clustering, were studied. Using CARTallowed us to examine what features are most influential inmaking decisions as described in section III-B. PCA wasalso performed on the feature sets to extract the principalcomponents.
For supervised learning, CART showed a recognition rateof 86.7% for 3 genres and 60.7% for 5 genres at maximum.Results from k-means clustering showed a purity of 0.844for 3 genres and 0.620 for 5 genres. This indicates that theperformance is better with a small number of genres than witha large number of genres. In contrast, the RI did not dropsignificantly.
The selection of features displayed differences in the per-formance of clustering, and proved to be an important factorfor the effective classification of genres. Only features derivedfrom the DFT of signals were used in our project, but usingother features could improve the perfomance of our classifier.Other potential features to use include the average tempo of amusic, repeated patterns in the music structure, and measuresthat can capture timbral textures of different instruments.A better selection of our data set could also improve ourperformance. The songs we used were randomly streamedby Youtube, and were not verified by specialists. Thus, it ispossible that some of the songs may be hybrid of differentgenres. Also, by using a standard set of data that is commonlyused to test music clustering, we would be able to compareour performance with other previous methods.
REFERENCES
[1] Soltau, H., Schultz, T., Westphal, M., Waibel, A. (1998).Recognition of music types. In Acoustics, Speech andSignal Processing, 1998. Proceedings of the 1998 IEEEInternational Conference on (Vol. 2, pp. 1137-1140).IEEE.
[2] Tzanetakis, G., Cook, P. (2002). Musical genre classifi-cation of audio signals. In Speech and Audio Processing,IEEE transactions on (Vol. 10, no. 5, pp. 293-302).
[3] Cilibrasi, R., Vitanyi, P., De Wolf, R. (2004). Algorith-mic clustering of music based on string compression. InComputer Music Journal on (Vol.28, no. 4, pp. 49-67).IEEE.
[4] Shao, X., Xu, C., Kankanhalli, M. S. (2004). Unsupervisedclassification of music genre using hidden markov model.In Multimedia and Expo, 2004. ICME’04. 2004 IEEEInternational Conference on (Vol. 3, pp. 2023-2026).IEEE.
[5] Peng, W., Li, T., Ogihara, M. (2007). Music Clusteringwith Constraints. In ISMIR (pp. 27-32).
[6] Tsai, W.H., Bao, D.F. (2010). Clustering music recordingsbased on genres. In Information Science and Applications(ICISA), 2010 International Conference on (pp. 1-5).IEEE.
[7] Hastie, T., Tibshirani, R., Friedman, J. ”Additive Models,Trees, and Related Methods,” The Elements of StatisticalLearning,2nd ed. New York, USA: Springer, 2009, ch.9,sec. 2 ,pp. 305–310.
[8] Breiman L., Friedman J. H., Olshen R. A., and Stone, C. J.(1984). Classification and Regression Trees. Wadsworth.