Kvantitativna radiografija helijumskim snopom sa primenom ...
65
Kvantitativna radiografija helijumskim snopom sa primenom na antropomorfni karlični fantom - master rad - Mentor: Kandidat: Prof. dr Jovana Nikolov Sonja Surla Novi Sad, januar 2020. god. UNIVERZITET U NOVOM SADU PRIRODNO-MATEMATIČKI FAKULTET DEPARTMAN ZA FIZIKU
Transcript of Kvantitativna radiografija helijumskim snopom sa primenom ...

Kvantitativna radiografija helijumskim snopom sa primenom na antropomorfni
karlični fantom
- master rad -
Mentor: Kandidat:
Prof. dr Jovana Nikolov Sonja Surla
Novi Sad, januar 2020. god.
UNIVERZITET U NOVOM SADU
PRIRODNO-MATEMATIČKI
FAKULTET
DEPARTMAN ZA FIZIKU
Napomena:
Ovaj rad je nastao tokom programa razmene studenata u Hajdelbergu, u Nemačkom centru za
istraživanje raka (Deutsches Krebsforschungszentrum). Stoga, rad je uz odobrenje veća
deparmana za fiziku Prirodno-matematičkog fakulteta Univerziteta u Novom Sadu napisan na
engleskom jeziku uz priloženi sažetak na srpskom jeziku.
Zahvaljujem svom istraživačkom timu na čelu sa dr Mária Martisíková, iz Nemačkog centra za
istraživanje raka (Deutsches Krebsforschungszentrum) u Hajdelbergu, gde je nastao ovaj rad.
Posebno se zahvaljujem dr Tim Gehrke na korisnim sugestijama tokom pisanja rada.
Veliku i iskrenu zahvalnost dugujem mentorki dr Jovani Nikolov na pruženoj prilici, poverenju i
posvećenosti tokom izrade rada.
Hvala roditeljima za razumevanje i nesebičnu ljubav
Vesni, za zrele savete mlađe sestre
Prijateljima, za uspomene
Nikoli, za strpljenje i podršku.

Sažetak
Uvod
Radioterapija je jedna od metoda lečenja malignih tumora. Često se koristi u kombinaciji sa
ostalim metodama kao što su hemoterapija i hiruški zahvati. Radioterapija koristi jonizujuće
zračenje za uništavanje malignih ćelija. Osnovni cilj radioterapije je da isporuči dovoljnu dozu
zračenja u okviru tumora, a što je moguće manje izvan njega. U praksi je nemoguće potpuno
zaštititi zdravo tkivo od zračenja, ali se intenzivno radi na smanjenju doze izvan tumora kako bi
se umanjili neželjeni efekti radijacione terapije.
Tadicionalna radioterapija rendgenskim zracima često oštećuje zdravo tkivo koje se nalazi u
blizini tumora, naročito na putu zračenja do dubine na kojoj se nalazi tumor. Sa druge strane,
radioterapijom akceleratorski ubrzanim jonima, kao što su npr. joni vodonika, helijuma ili
ugljenika, veoma precizno može da se zračenje fokusira u okviru tumora i na taj način da se
zaštite okolna tkiva od neželjenog zračenja. Terapija ubrzanim jonima je prvi put predložena od
strane Roberta Wilsona 1946. god. a prva kllinička primena protonskog snopa u radioterapiji je
izvršena 1954. god. u Berkliju, Kalifornija. Danas, interesovanje za radioterapiju ubrzanim
jonima raste velikom brzinom. Širom sveta u funkciji je više od 75 postrojenja za radioterapiju
ubrzanim jonima, a još oko 40 postrojenja su pod rekonstrukcijom sa planiranim početkom rada
pre 2021. god. Do kraja 2018. godine 221528 pacijenata su zračeni snopom ubrzanih jona u cilju
lečenja malignih obolenja. Pokazalo se takođe, da je terapija ubrzanim jonima dala bolje
rezultate od konvencionalne terapije fotonima.
Joni prolazeći kroz materijalnu sredinu najveći iznos energije gube pri kraju svog dometa. Kriva
doze zračenja koju ubrzani joni proizvode na svom putu na završnom delu ima vidljivi uspon, a
zatim nagli pad (slika 1). Taj deo krive se naziva Braggov pik i cilj je da se on usmeri u zapreminu
tumora kako bi se tu oslobodila najveća doza zračenja. Braggov pik je moguće postavljati na
potrebnu dubinu menjanjem energije jonskog snopa.
Pored prednosti koju pruža radioterapija ubrzanim jonima, oslobađanje velike doze zračenja na
koncentrisanom mestu na putu zračenja, ipak ona može biti i veliki rizik ako se Braggov pik ne
pozicionira precizno u tumor. Postupak preciznog pozicioniranja Braggovog pika u tumor je
najveći izazov ovog tipa radioterapije. Savremene dijagnostičke metode mogu vrlo precizno da

oslikaju tumor i njegov položaj u telu pacijenta. Danas se najčešće koristi kompjuterska
tomografija (CT) rendgenskim zracima u vidu CT simulatora za planiranje radioterapijske
procedure. Da bi se odredila adekvatna energija jona koji se koriste za zračenje, potrebno je
znati njihov domet u heterogenom telu pacijenta. Zato se koristi pretvaranje vrednosti
atenuacije rendgenskih zraka od strane različitih vrsta tkiva u relativnu zaustavnu moć sredine
kroz koju prolazi snop ubrzanih jona. Pri ovoj konverziji se pravi neizbežna greška od oko 3%. Da
bi se izbegla ova nesigurnost u određivanju dometa jona u telu pacijenta, došlo se na ideju da se
se pre radioterapije sa ubrzanim jonima izvrši radiografija sa ubrzanim jonima kao dodatak CT
simulatoru. Radiografija ubrzanim jonima koristi isti tip zračenja kao i radioterapija ubrzanim
jonima, pa se stoga izostavlja nepoželjna nesigurnost konverzije.
Slika 1: Poređenje doze zračenja kao funkcije dubine u tkivu za X-zrake (konvencionalna radioterapija) i jonski snop (terapija ubrzanim jonima).
Za radiografiju sa ubrzanim jonima, koriste se veće energije nego za terapiju. Braggov pik se
postavlja na detektor iza pacijenta. Pri tome se isporucuje samo veoma mala doza zračenja
pacijentu, dok se iza pacijenta meri deponovana energija jona u tankom sloju detektora. Sa
ovom zabeleženom informacijom za svaki pojedinačni jon iz snopa može se dobiti informacija o
integralnoj zaustavnoj moći sredine kroz koju prolaze joni. Što nam dalje pruža mogućnost da
lako odredimo energiju jona za terapiju kako bi se Braggov pik tačno našao u okviru tumora. Da
bi se integralna zaustavna moć medijuma heterogenog tkiva pacijenta izrazila u opštim
jedinicama, uvodi se pojam – „debljina ekvivalenta vode“ (WET, Water Equivalent Thickness),
odnosi se na debljinu vodenog fantoma koji ima istu zaustavnu moć kao određeni medijum kroz
koji zračenje prolazi. Najveća prednost radiografije ubrzanim jonima je ta što se može izvršiti
neposredno pred terapiju ubrzanim jonima sa istom postavkom pacijenta. Poređenjem
radiografskog snimka dobijenog jonima sa radiografskim snimkom dobijenog rengenskim
zracima mogu se videti potencijalne razlike u „debljini ekvivalenta vode“ što može biti

posledica pomerene geometrije pozicioniranja pacijenta ili promene u telu pacijenta (npr.
gubitak težine ili proširenje tumora). Ideja je da se uporede WET mape dobijene CT
simulatorom i metodom radiografije ubrzanim jonima. Razlike u WET vrednostima dobijenih sa
ove dve metode bi značile pogrešnu postavku pacijenta za radioterapiju ili anatomske promene
u telu pacijenta.
Materijal i metode
Svi eksperimenti u ovoj tezi su rađeni u Centru za terapiju ubrzanim jonima u Hajdelbergu
(Heidelberg Ion-Beam Therapy Center, HIT), u Nemačkoj. Ovaj centar je prvo postrojenje za
radioterapiju ubrzanim jonima vodonika i ugljenika u Evropi, osnovan 2009. god. Sadrži tri sobe
za terapiju i jednu sobu za eksperimentalna istraživanja. Dve sobe opremljene su horizontalnim
fiksiranim snopom za lečenje pacijenta, a jedna sa 360° rotirajućim nosačem (gantrijem), tako
da se snop jona može usmeravati ka pacijentu iz proizvoljnih smerova. Pored jona protona (1H) i
ugljenika (12C), koji se koriste u kliničkoj praksi, dostupni su još i joni helijuma (4He) i kiseonika
(16O). Svi eksperimenti predstavljeni u ovom radu izvedeni su u eksperimentalnoj sobi sa fiksnim
horizontalnim snopom.
Slika 2: Pregled akceleratora u HIT objektu. Prikazane su dve sobe za pacijente sa horizontalno fiksisanim
snopovima (H1, H2), jedna soba sa 360 rotirajucim nosačem (Gantri) i eksperimentalna soba (Q-A).
Protoni se proizvode od vodoničnog gasa, dok se za proizvodnju ugljenokovih jona koristi
ugljen-dioksid. Jednom kada se proizvodu joni od interesa oni se najpre ubrzavaju u linearnom
akceleratoru. Ovde se joni ubrzavaju do 10% brzine svetlosti. Tako ubrzani joni se ubrizgavaju u
sinhrotron gde se mogu ubrzati do 255 diskretnih energija, što odgovara rasponu od 20 mm do
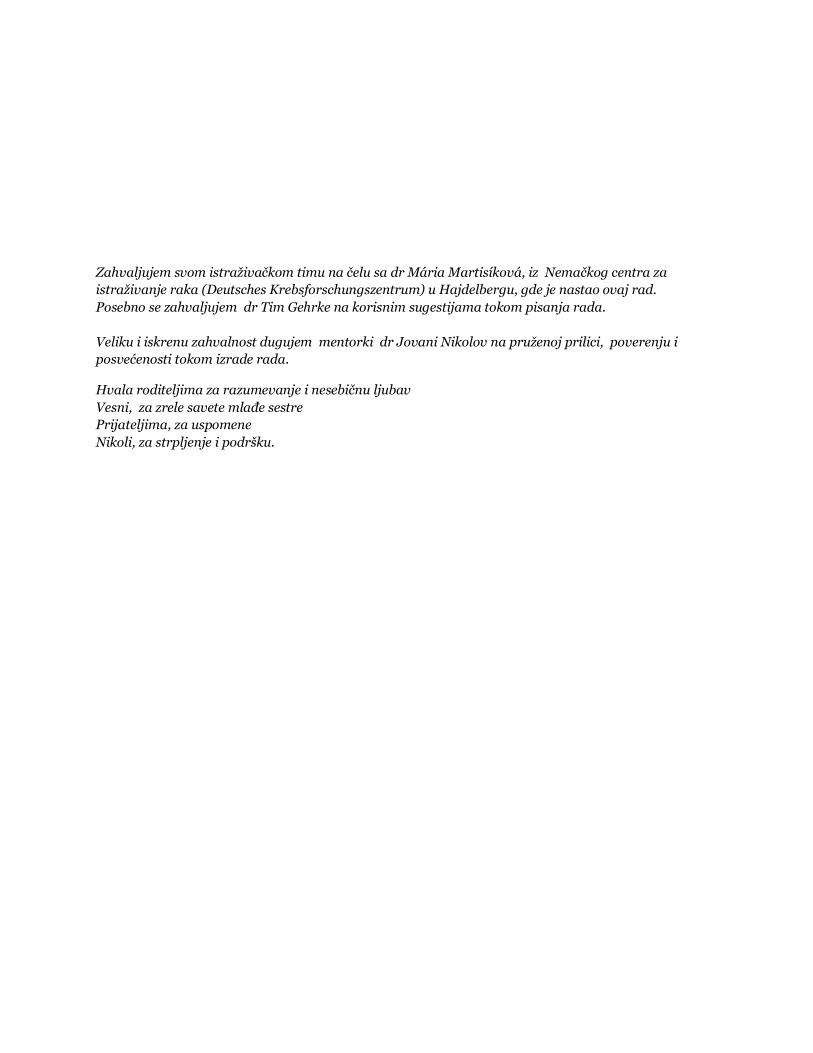
300 mm dometa u vodi. Prednost upotrebe sinhrotrona je što može ubrzati jonski snop do
različitih energija. Nakon izlaska snopa iz sinhrotrona, joni se usmeravaju u prostorije za terapiju
preko sistema za transport visokoenergetskih snopova. Dipolni magneti služe sa skretanje, dok
se kvadrupolni magneti koriste za fokusiranje snopa.
Slika 3: Magneti za skretanje i fokusiranje snopa jona.
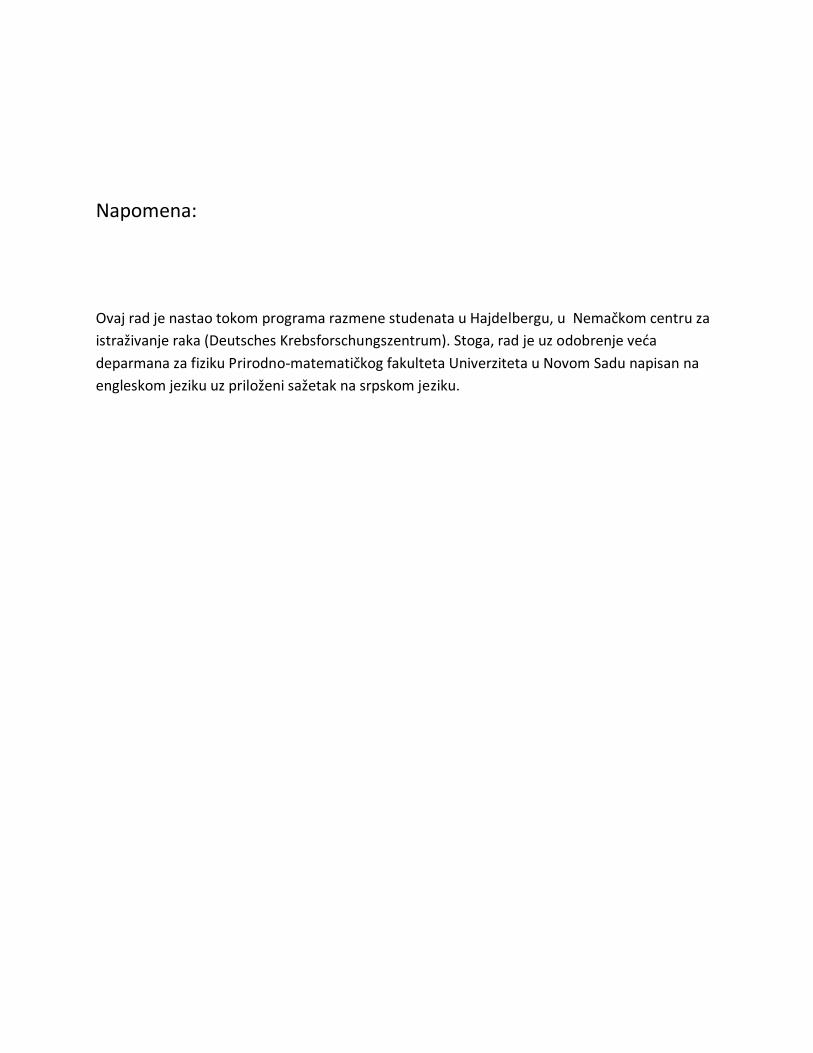
Detektori korišćeni za snimanje radiografa sa ubrzanim jonima su TimePix detektori,
konstruisani u CERN-u. Osetljivi sloj detektora je 14 mm x 14 mm, podeljeno na 256 x 256
piksela, sa veličinom od 55 µm x 55 µm. Ovaj osetljivi sloj napravljen je od kristalnog silicijuma
debljine 300 µm i svaki piksel je posebno vezan je za čip za očitavanje. TimePix je poluvodički
detektor n-tipa sa koncentracijom donora od približno (0,34 ± 0,09) x1012 cm−3. Svaki piksel ima
svoju elektroniku i posebno napajanje, što omogucava nezavisna podešavanja i rad svakog
piksela posebno.
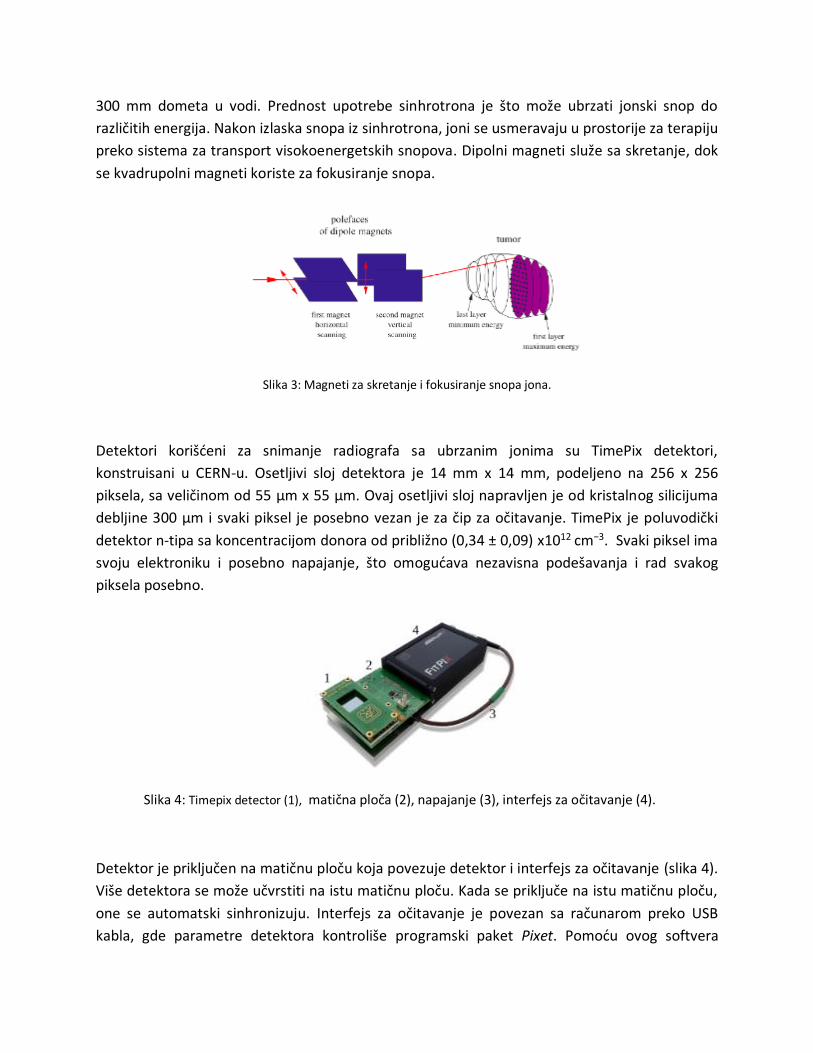
Slika 4: Timepix detector (1), matična ploča (2), napajanje (3), interfejs za očitavanje (4).
Detektor je priključen na matičnu ploču koja povezuje detektor i interfejs za očitavanje (slika 4).
Više detektora se može učvrstiti na istu matičnu ploču. Kada se priključe na istu matičnu ploču,
one se automatski sinhronizuju. Interfejs za očitavanje je povezan sa računarom preko USB
kabla, gde parametre detektora kontroliše programski paket Pixet. Pomocu ovog softvera
moguce je podesiti režim rada, prag signala, dužinu rama, takt frekvenciju, napon i mnoge
druge postavke. Interfejs za očitavanje podataka prikuplja podatke u ramovima. Ram je vreme
prikupljanja podataka (aktivno vreme). Između dva okvira je odgovarajuci vremenski interval,
tokom koga se podaci ne prikupljaju, vec obrađuju pre početka sledeceg rama (mrtvo vreme).
Interfejs omogucava snimanje do 90 ramova u sekundi sa jednim detektorom.
Svaki piksel detektora može da radi u jednom od četiri režima rada detektora:
1. Brojač (counting mode) služi za merenje broja jona koji prolaze kroz detektor 2. Merenje energije pojedinačnih jona (energy mode) 3. Merenje vremena udara jona na detektor (time mode) 4. Maskirani režim (masked mode) - za deaktivaciju oštećenih piksela
U ovoj tezi pet detektora je radilo u režimu merenja vremena udara jona na detector, a jedan u
režimu merenja energije jona.
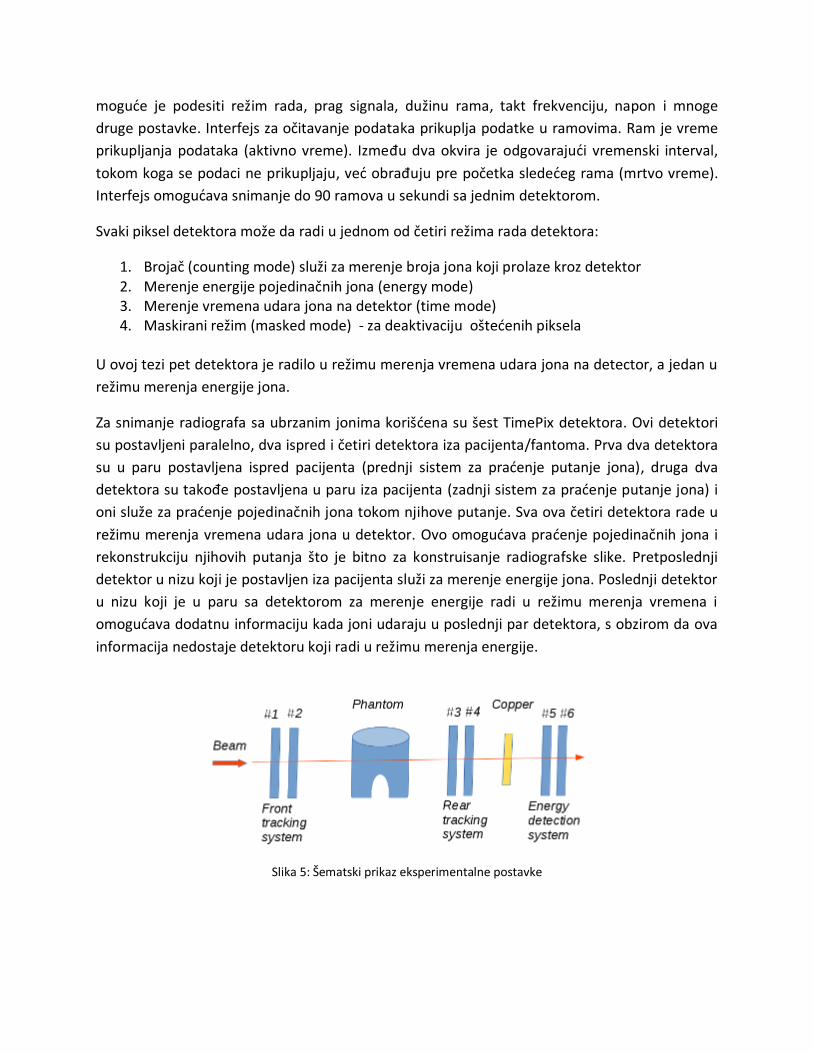
Za snimanje radiografa sa ubrzanim jonima korišćena su šest TimePix detektora. Ovi detektori
su postavljeni paralelno, dva ispred i četiri detektora iza pacijenta/fantoma. Prva dva detektora
su u paru postavljena ispred pacijenta (prednji sistem za praćenje putanje jona), druga dva
detektora su takođe postavljena u paru iza pacijenta (zadnji sistem za praćenje putanje jona) i
oni služe za praćenje pojedinačnih jona tokom njihove putanje. Sva ova četiri detektora rade u
režimu merenja vremena udara jona u detektor. Ovo omogućava praćenje pojedinačnih jona i
rekonstrukciju njihovih putanja što je bitno za konstruisanje radiografske slike. Pretposlednji
detektor u nizu koji je postavljen iza pacijenta služi za merenje energije jona. Poslednji detektor
u nizu koji je u paru sa detektorom za merenje energije radi u režimu merenja vremena i
omogućava dodatnu informaciju kada joni udaraju u poslednji par detektora, s obzirom da ova
informacija nedostaje detektoru koji radi u režimu merenja energije.
Slika 5: Šematski prikaz eksperimentalne postavke

Između zadnjeg sistema za praćenje jona i sistema za detekciju energije jona se nalazi bakarni
kolimator koji apsorbuje energiju jona kako bi se rastući deo Braggovog pika našao na detektoru
#5. Više energije jona su poželjnije za snimanje radiografa jer joni s vecim energijama trpe
manje skretanja uzrokovanog Kulonovim silama i omogucavaju bolju rekonstrukciju putanje, što
stvara bolju prostornu rezoluciju konačne slike. Takođe, vece energije smanjuju apsorbovanu
dozu u fantomu/pacijentu. Rastući deo Braggovog pika se postavlja na detektor za merenje
energije jona kako bi i za male razlike u WET izmerio veliku razliku u deponovanoj energiji jona
u detektoru.
Debljina ekvivalenta vode izmerena helijumskim snopom odgovara debljini ekvivalenta vode
izmerenoj protonskim i ugljeničnim snopovima. Helijumski jonski snop je odabran u
eksperimentima jer trpi manje Kulonovog rasejanja od protonskog snopa i manje fragmentacije
od ugljeničnog.
Za pretvaranje izmerene deponovane energije jona u debljinu ekvivalenta vode korišćene su
kalibracione krive (slika 6) dobijene u prethodnom istraživanju u okviru iste istraživačke grupe.
Za različite debljine istog materijala merena je deponovana energija jona u detektoru iza njega.
Tako je merena deponovana energija jona u detektoru iza materijala poznate debljine
ekvivalenta vode. Pomoću ovih merenja napravljene su kalibracione krive za snop jona helijuma
pri različitim energijama.
Slika 6: Kalibracione krive koje omogućavaju pretvaranje izmerene deponovane energije u debljinu vodenog
ekvivalenta (WET) za dve energije jona helijuma korišćene u eksperimentima.
Fantom korišćen u eksperimentima je napravljen od ljudskih kosti i obložen materijalom koji je
ekvivalentan ljudskom tkivu.

Prikupljeni podaci tokom merenja su kasnije obrađeni kako bi se u obzir uzeli samo signali
nastali od jona helijuma, a odbacili signali koji potiču od sekundarnih fragmenata ili neželjenih
detektorskih artefakata.
Rezultati
Za dobijanje radiografa antropomorfnog karličnog fantoma ubrzanim jonima helijuma korišćene
su energije od 229.1 MeV/u i 239.5 MeV/u. Regija od interesa je podeljena na devet manjih
kvadratnih regija veličine 14 mm x 14 mm što je ujedno i veličina aktivnog sloja detektora.
Fantom je pomeran u dva pravca normalna na pravac snopa, dok su detektori bili fiksirani kako
bi se snimio radiograf načinjen od devet manjih radiografskih slika.
Prvo su rađena merenja za poravnanje šest detektora sa snopom ubrzanih jona helijuma.
Prolaskom snopa jona kroz detektore moguće je dodatno poravnjanje detektora prema snopu
jona. Rezultati dodatnog poravnjanja u dva pravca normalna na pravac snopa sa dve energije
snopa su prikazani u tabeli 1, a detektor #3 je korišćen kao refentna tačka.
Tabela 1: Rezultati merenja za dodatno poravnjanje detektora.
Nakon merenja za poravnanje detektora rađena su merenja za dobijanje radiografa regije od
interesa. Nakon obrade podataka dobijenih merenjem, otklonjeni su ‘’lažni’’ signali i za
formiranje slike su koršćeni samo signali nastali od jona helijuma iz snopa. Putanja jona je
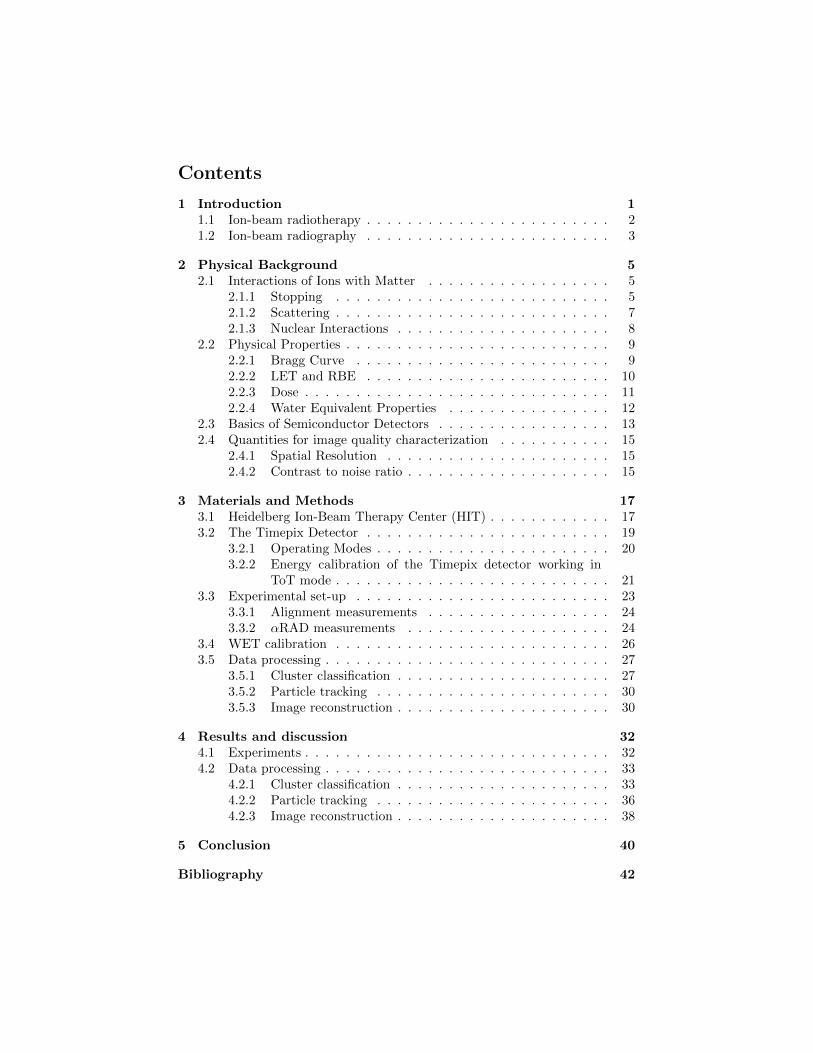
rekonstruisana pomoću dva algoritma i ta dva radiografa su prikazana na slikama 7 a i 8 a.
Radiograf prikazuje mapu debljine vodenog ekvivalenta (WET) i na kraju je upoređen sa
digitalno rekonstruisanim radiografom od rendgenskog CT-a.
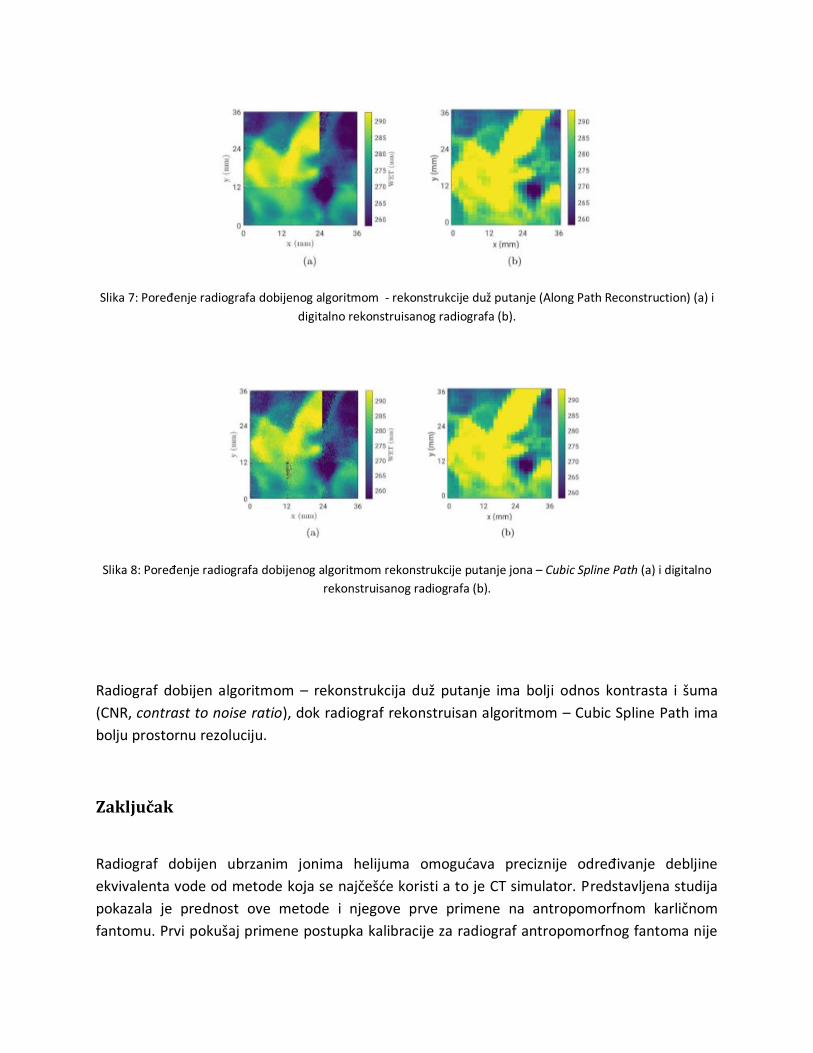
Slika 7: Poređenje radiografa dobijenog algoritmom - rekonstrukcije duž putanje (Along Path Reconstruction) (a) i
digitalno rekonstruisanog radiografa (b).
Slika 8: Poređenje radiografa dobijenog algoritmom rekonstrukcije putanje jona – Cubic Spline Path (a) i digitalno
rekonstruisanog radiografa (b).
Radiograf dobijen algoritmom – rekonstrukcija duž putanje ima bolji odnos kontrasta i šuma
(CNR, contrast to noise ratio), dok radiograf rekonstruisan algoritmom – Cubic Spline Path ima
bolju prostornu rezoluciju.
Zaključak
Radiograf dobijen ubrzanim jonima helijuma omogućava preciznije određivanje debljine
ekvivalenta vode od metode koja se najčešće koristi a to je CT simulator. Predstavljena studija
pokazala je prednost ove metode i njegove prve primene na antropomorfnom karličnom
fantomu. Prvi pokušaj primene postupka kalibracije za radiograf antropomorfnog fantoma nije

u potpunosti uspeo. To znači da problem usaglašavanja debljine vodenog ekvivalenta sa slika
dobijenih različitim energijama moraju biti dodatno istražena, a kalibraciona kriva mora biti
verifikovana u dodatnom merenju. Za potencijalnu kliničku primenu metode radiografa
ubrzanim jonima helijuma potrebna su dalja usavršavanja.

Quantitative helium-beam radiography of an
anthropomorphic pelvis phantom
Contents
1 Introduction 11.1 Ion-beam radiotherapy . . . . . . . . . . . . . . . . . . . . . . . . 21.2 Ion-beam radiography . . . . . . . . . . . . . . . . . . . . . . . . 3
2 Physical Background 52.1 Interactions of Ions with Matter . . . . . . . . . . . . . . . . . . 5
2.1.1 Stopping . . . . . . . . . . . . . . . . . . . . . . . . . . . 52.1.2 Scattering . . . . . . . . . . . . . . . . . . . . . . . . . . . 72.1.3 Nuclear Interactions . . . . . . . . . . . . . . . . . . . . . 8
2.2 Physical Properties . . . . . . . . . . . . . . . . . . . . . . . . . . 92.2.1 Bragg Curve . . . . . . . . . . . . . . . . . . . . . . . . . 92.2.2 LET and RBE . . . . . . . . . . . . . . . . . . . . . . . . 102.2.3 Dose . . . . . . . . . . . . . . . . . . . . . . . . . . . . . . 112.2.4 Water Equivalent Properties . . . . . . . . . . . . . . . . 12
2.3 Basics of Semiconductor Detectors . . . . . . . . . . . . . . . . . 132.4 Quantities for image quality characterization . . . . . . . . . . . 15
2.4.1 Spatial Resolution . . . . . . . . . . . . . . . . . . . . . . 152.4.2 Contrast to noise ratio . . . . . . . . . . . . . . . . . . . . 15
3 Materials and Methods 173.1 Heidelberg Ion-Beam Therapy Center (HIT) . . . . . . . . . . . . 173.2 The Timepix Detector . . . . . . . . . . . . . . . . . . . . . . . . 19
3.2.1 Operating Modes . . . . . . . . . . . . . . . . . . . . . . . 203.2.2 Energy calibration of the Timepix detector working in
ToT mode . . . . . . . . . . . . . . . . . . . . . . . . . . . 213.3 Experimental set-up . . . . . . . . . . . . . . . . . . . . . . . . . 23
3.3.1 Alignment measurements . . . . . . . . . . . . . . . . . . 243.3.2 αRAD measurements . . . . . . . . . . . . . . . . . . . . 24
3.4 WET calibration . . . . . . . . . . . . . . . . . . . . . . . . . . . 263.5 Data processing . . . . . . . . . . . . . . . . . . . . . . . . . . . . 27
3.5.1 Cluster classification . . . . . . . . . . . . . . . . . . . . . 273.5.2 Particle tracking . . . . . . . . . . . . . . . . . . . . . . . 303.5.3 Image reconstruction . . . . . . . . . . . . . . . . . . . . . 30
4 Results and discussion 324.1 Experiments . . . . . . . . . . . . . . . . . . . . . . . . . . . . . . 324.2 Data processing . . . . . . . . . . . . . . . . . . . . . . . . . . . . 33
4.2.1 Cluster classification . . . . . . . . . . . . . . . . . . . . . 334.2.2 Particle tracking . . . . . . . . . . . . . . . . . . . . . . . 364.2.3 Image reconstruction . . . . . . . . . . . . . . . . . . . . . 38
5 Conclusion 40
Bibliography 42

1 Introduction
The use of ionizing radiation (radiotherapy) plays an important role in the treat-ment of malignant tumor, in addition to other methods such as chemotherapyor surgery. The aim of radiotherapy is to provide sufficient dose to kill thetumor cells. In theory, an ideal irradiation delivers a defined dose distributionwithin the tumor and no dose outside it. In practice, it is impossible to spareall healthy tissue from irradiation, but the intention is to minimize the dose init, in order to reduce adverse side effects.Ion-beam radiotherapy was first proposed by Robert Wilson (1946) who realizedthat accelerated protons and heavier ions have enough energy to penetrate thehuman body, and could be used for cancer therapy. The first clinical use of aproton beam and subsequently a helium ion beam with an energy of 910 MeVtook place at Berkeley in 1954 [1]. Today ion-beam 1 radiotherapy has a grow-ing interest in cancer treatment. Currently, there are more than 75 facilitiesin operation worldwide and 40 facilities are being constructed with expectedtreatment start before 2021 [2]. By the end of 2018, 221528 patients have beentreated with ions [3].Protons and heavier ions (e.g. 4He, 12C) compared to photons have a superiordepth-dose distribution. This distribution is common to all ions, and is calledBragg curve. A Bragg curve has a sharp peak of dose deposition at the end ofthe ion range, called Bragg peak [4]. This results in better sparing of healthytissue surrounding the tumor, since the position of the Bragg peak in depth canbe adjusted to the depth of the tumor by changing the initial energy of ions.However, positioning the Bragg peak inside a target can be challenging. Inorder to predict the position of the Bragg peak, the ion energy loss (or stop-ping power (SP)) has to be known in the tissue through which the ions mustpass. This is still a problem facing any ion-beam therapy today. Cormack in1963 [5] was the first who realized that the energy loss of ions passing througha patient can tell us about ion stopping power inside the patient - somethingwe can never get directly from X-rays. X-ray computed tomography (CT) isused for treatment planning purposes, not just for outlining structures, but alsofor measuring electron density maps which are used to calculate the dose de-position. The conversion of electron density to ion stopping power leads to anuncertainty in relative stopping power 2 (RSP). For protons this uncertainty isestimated as 1.6% for soft tissue, 2.4% for bone and 5.0% for lung [6].Ion-beam radiography (iRAD) allows direct measurement of the object’s inte-grated relative stopping power along the direction of the imaging beam [2]. Thisapproach requires high-speed ion tracking before and after the patient and resid-ual energy measurement or a connected quantity of the ions leaving the patient.With the range information the correct positioning of the patient relative tothe beam an the correct prediction of the patient anatomy could be verified [7].This method can be used to improve the treatments planned on converted CT
1The term ion includes protons and heavier ions.2The relative stopping power of a material is defined as the ratio of the stopping power in
this material to the stopping power in water.
1

images. However, currently iRAD is not used routinely, primarily because mostof these experimental prototypes are bulky, expensive and difficult to adopt intothe clinical environment [8].The aim of this thesis was to further develop a method of helium-beam iRAD(αRAD ) for the first application on an anthropomorphic pelvis phantom andin the end to compare WET values from the αRAD with the correspondingdigitally reconstructed radiography (DRR) based on the planning X-ray CT.
1.1 Ion-beam radiotherapy
Radiotherapy with protons or heavier ions (ion-beam radiotherapy) providesseveral advantages over the conventional photon radiotherapy. The main ad-vantage of using proton and heavier ion beams for radiotherapeutic patienttreatment is the possibility to deliver a dose highly localized to the target vol-ume. Healthy tissue around the target volume can therefore be largely sparedfrom irradiation (figure 1). This is especially important when organs at risk(e.g. optic nerves) are located in the vicinity of the target volume. In addition,heavy ions projectiles exhibit an increased biological effectiveness in the Braggpeak caused by the dense ionization resulting in reduced cellular repair in tumorregion [9]. The other advantage is that ion beam can be precisely controllablein three dimensions. With ions it is possible to produce a tightly focused pencilbeam that is deflected laterally by two magnetic dipoles. Therefore, the tumorvolume can be easily covered by deflecting the ion beam through magnets, whichis not applicable for photon and neutron beams [10].
Figure 1: Comparison of the radiation dose as function of the depth in tis-sue for X-rays (conventional radiotherapy) and ion beam (ion-beam therapy).Reprinted from [11].
At the same time, the high gradient of the dose profile is a challenge as it makesion-beam therapy more sensitive to uncertainties than the smaller gradient ofphoton radiotherapy. Figure 2 demonstrates the effect of an anatomical change
2

on the dose distribution for ion-beam and X-ray radiotherapy. There are severalreasons for ion beam range uncertainties. They might originate in the planningphase during the conversion of X-ray CT numbers to relative stopping power(RSP) of the tissue. They can also occur in the treatment phase due to changesin the spatial RSP distribution. These changes are mainly caused by anatomicalchanges (e.g. weight change or tumor shrinkage) or uncertainties in the patientset-up [2].
Figure 2: Comparison of depth-dose profiles before (blue solid lines) and after ananatomical change (red solid lines) for (a) ion-beam radiotherapy and (b) X-rayradiotherapy. The blue dotted line presents a pristine Bragg peak. Reprintedfrom [2].
1.2 Ion-beam radiography
Ion-beam radiography (iRAD) could improve the quality of ion-beam therapy.The major benefit of iRAD is the possibility to directly measure the integratedrelative stopping power. A second potential advantage of iRAD is that imag-ing irradiation and the treatment irradiation can be performed with the sameion, which would completely avoid conversion errors. iRAD could also providea quick verification of the patient set-up immediately prior to the ion-beam ra-diotherapy, with low radiological dose.Energies required for iCT or iRAD are higher than those used in ion-beam ra-diotherapy. A reason for that is that a position of the Bragg peak must belocated not in the patient, but in the detector behind the patient. Therefore,ions must have an energy sufficient to traverse the imaged object. For thickanthropomorphic pelvis phantom energies higher than the therapeutic energies(above 220 MeV/u that corresponds to a range of approximately 30 cm in water)were required. A first version of this energies (229.1 MeV/u and 239.5 Mev/ufor 4He ions) were recently implemented at the Heidelberg Ion-Beam TherapyCenter (HIT) enabling for the first time iRAD of an anthropomorphic phantomwith a WET exceeding 280 mm WET.
3

Figure 3: Depth dose profiles (a) and lateral broadening (b) of different ions.
After the ions crossed the object, the residual range or residual energy informa-tion is acquired. With this data, the integrated stopping power of the object canbe determined. A radiograph is obtained from information about the energy,scattering, or attenuation of an ion beam exiting the object [2].The heavier the ion is, it suffers less scattering in the imaged object (figure 3, b).Hence, helium iRAD gives better spatial resolution without any disadvantagein terms of dose compared to proton iRAD. The spatial resolution of heliumiRAD is twice as good as for protons and for carbon ions is approximately 1.8times better than for helium. Also, helium ions require much less energy to fullypenetrate the object compared to the carbon ions (figure 3, a). On the otherhand, heavier ions suffer from substantial nuclear fragmentation. Using carbonions instead of helium would improve spatial resolution at the cost of higherdoses [12]. Considering all of this, helium ions have been chosen for developingan αRAD of the pelvis phantom presented in this thesis.Since the WET measured by αRAD has the same validity as WET measuredby proton and carbon beams, αRAD can be applied as an image-guidance toolfor proton, carbon or helium-ion therapy. The main advantage of the iRADis that it can be performed right before the ion-beam therapy with the samepositioning of the patient. The idea is to compare the iRAD WET map with thesoftware reconstructed WET from planning X-ray CT. Differences in this tworadiographs would mean uncertainties in the patient positioning or anatomicalchanges in the patient geometry.
4
2 Physical Background
This chapter reviews the physical background for the research presented in thisthesis. The first part of the chapter examines the interactions of ions withmatter in section 2.1. Furthermore, physical properties as Bragg curve, LET,dose and water equivalent properties are defined in section 2.2. Eventually, thereis a brief introduction to semiconductor detectors in section 2.3 and descriptionof two quantities for image quality characterization in section 2.4.
2.1 Interactions of Ions with Matter
In distinction to the indirectly electromagnetic radiation, ions are directly ioniz-ing [13]. These particles lose their energy by ionizing the atoms of the materialand eventually come to rest. Ions travelling through the material undergo in-teractions with electrons and the nuclei of surrounding stationary atoms. Forthe clinical energy range (up to 500 MeV/u) the contribution of bremsstrahlungand Cerenkov radiation, is very small and can be neglected. Ions slow down bymultitude collisions with atomic electrons. Through collisions with a nucleus,they are deflected. Sometimes they have a head-on collision with a nucleus, pro-ducing secondary particles in motion. These three process are called stopping,scattering and nuclear interactions. Stopping and scattering occur via Coulombinteractions with atomic electrons and nuclei, while nuclear interaction with nu-clei occurs via strong nucleon-nucleon force [14].
2.1.1 Stopping
When ions passes through a medium, it loses its energy by transferring it tothe electrons of the medium’s atoms. The transferred energy can be enough toknock an electron out of an atom and ionize it, or it can leave the atom in anexcited, non-ionized state.As illustrated in figure 4, the rate of energy loss can be calculated by taking intoaccount a mass (M) and charge (ze) of ion which passes close to a free electron.To simplify the calculation, we suppose that the ion is non-relativistic, v << c,and that M >> me, where v and M are velocity and mass of the ion, c is speedof light and me is mass of electron. Also, we assume that the electron is freeand initially at rest. Then, the energy gained by the electron is:
∆E(b) =2z2e4
mev2b2(1)
where b is the distance between ion and atomic electron. Let n be the density ofelectrons, then the energy lost to all the electrons located at a distance betweenb and b+ db in a thickness dx is:
−dE(b) = ∆E(b)ndV =4πnz2e4
mve2db
bdx (2)
5
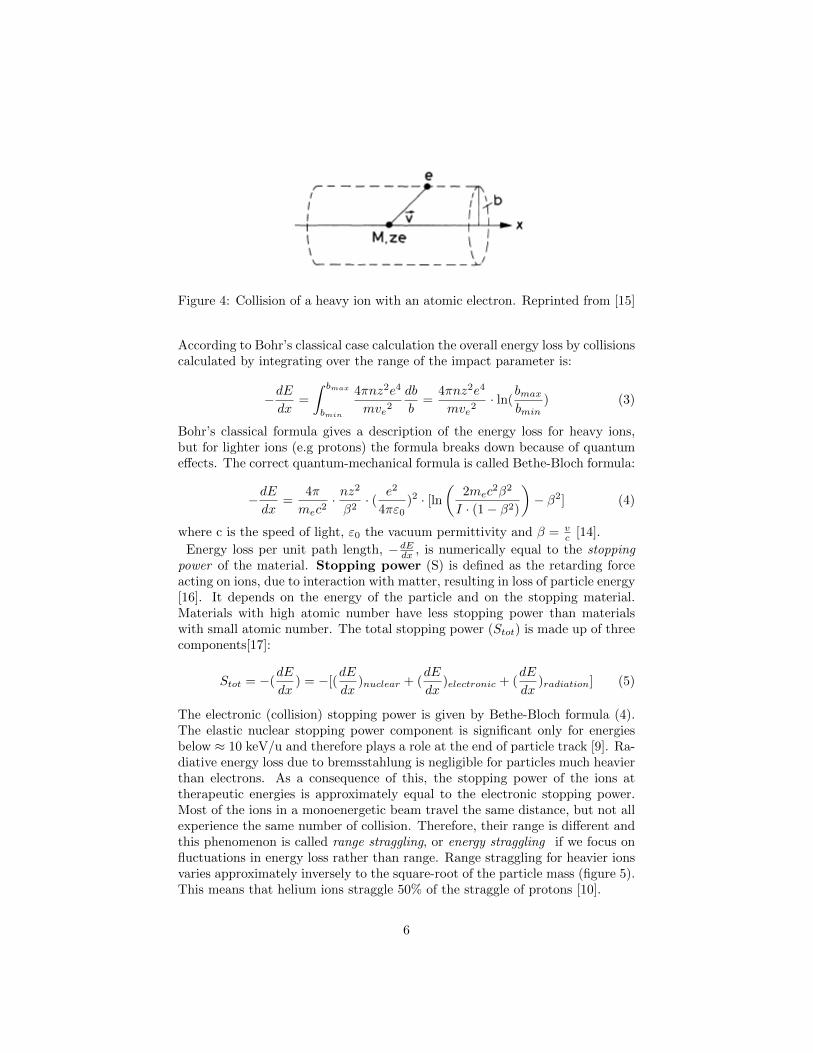
Figure 4: Collision of a heavy ion with an atomic electron. Reprinted from [15]
According to Bohr’s classical case calculation the overall energy loss by collisionscalculated by integrating over the range of the impact parameter is:
−dEdx
=
∫ bmax
bmin
4πnz2e4
mve2db
b=
4πnz2e4
mve2· ln(
bmaxbmin
) (3)
Bohr’s classical formula gives a description of the energy loss for heavy ions,but for lighter ions (e.g protons) the formula breaks down because of quantumeffects. The correct quantum-mechanical formula is called Bethe-Bloch formula:
−dEdx
=4π
mec2· nz
2
β2· ( e2
4πε0)2 · [ln
(2mec
2β2
I · (1− β2)
)− β2] (4)
where c is the speed of light, ε0 the vacuum permittivity and β = vc [14].
Energy loss per unit path length, −dEdx , is numerically equal to the stoppingpower of the material. Stopping power (S) is defined as the retarding forceacting on ions, due to interaction with matter, resulting in loss of particle energy[16]. It depends on the energy of the particle and on the stopping material.Materials with high atomic number have less stopping power than materialswith small atomic number. The total stopping power (Stot) is made up of threecomponents[17]:
Stot = −(dE
dx) = −[(
dE
dx)nuclear + (
dE
dx)electronic + (
dE
dx)radiation] (5)
The electronic (collision) stopping power is given by Bethe-Bloch formula (4).The elastic nuclear stopping power component is significant only for energiesbelow ≈ 10 keV/u and therefore plays a role at the end of particle track [9]. Ra-diative energy loss due to bremsstahlung is negligible for particles much heavierthan electrons. As a consequence of this, the stopping power of the ions attherapeutic energies is approximately equal to the electronic stopping power.Most of the ions in a monoenergetic beam travel the same distance, but not allexperience the same number of collision. Therefore, their range is different andthis phenomenon is called range straggling, or energy straggling if we focus onfluctuations in energy loss rather than range. Range straggling for heavier ionsvaries approximately inversely to the square-root of the particle mass (figure 5).This means that helium ions straggle 50% of the straggle of protons [10].
6

Figure 5: Comparison of proton, helium and neon beam straggling as a functionof their path length in water. Reprinted from [10].
2.1.2 Scattering
When ions pass through the matter, they experience random deviations in theirdirection. This phenomenon, called lateral scattering, is predominantly causedby elastic Coulomb scattering from the nuclei of the target atoms, while scat-tering due to electronic interactions is neglected [6]. Since nuclei usually have amass larger than the incoming ion, the transfer of energy is negligible, but theincoming particle’s trajectory is diverted.Single scattering is described by Rutherford cross section:
dσ
dΩ= (
1
4πε0
Z1Z2e2
4E0)2
1
sin4( θ2 )(6)
where Z1p and Z2 are the charge of the projectile and target nucleus respec-tively, θ is the deflection angle and E0 is kinetic energy of projectile. Even thedeflection is small, the sum of all angle deflections lads to greater divergenceof the beam after a thickness of material than incoming beam. This process iscalled Multiple Coulomb Scattering (MCS) and it causes a ”zig-zag” pathof the particles (figure 6).Multiple Coulomb Scattering is described by Moliere distribution, but for small
angles the higher order terms in Moliere’s solution can be neglected and the an-gular distribution is approximated by a Gaussian function. For high energeticheavy ions, lateral scattering is smaller than for same particles with lower en-ergies. Also, target materials made of heavy elements produce a large angularspread than targets containing light elements with the same thickness. Theslight lateral deflection of heavy ions that pass through an absorber is an ad-
7
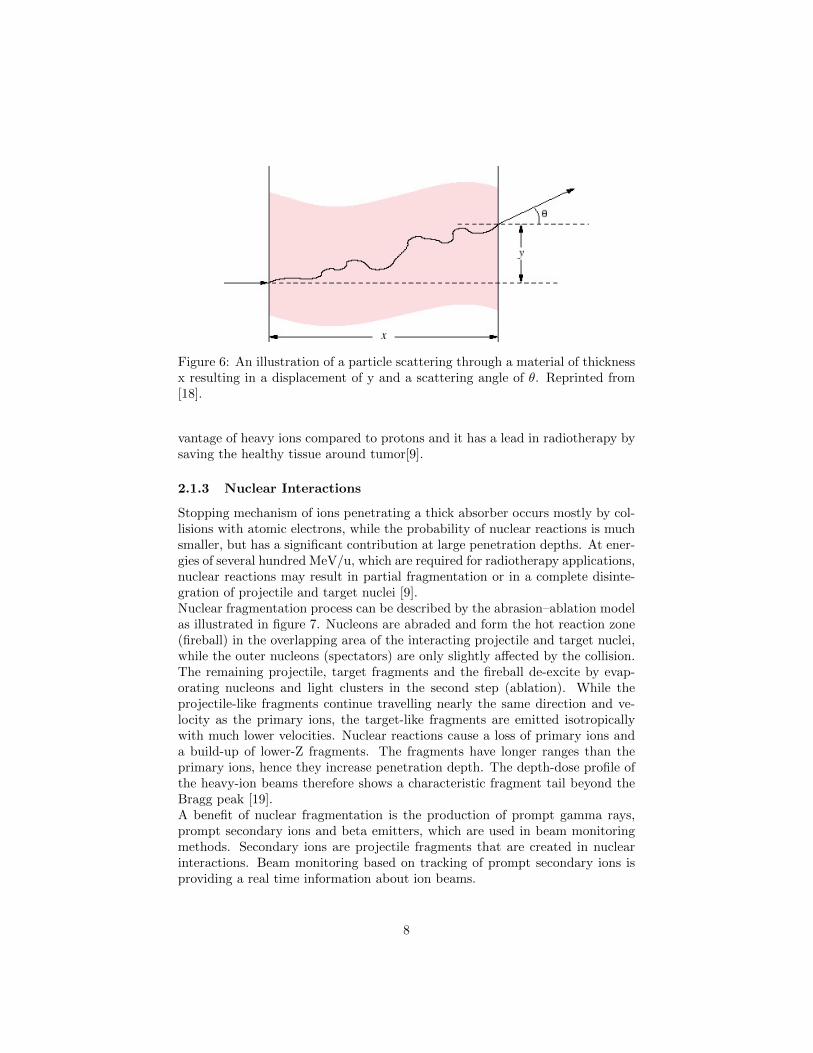
Figure 6: An illustration of a particle scattering through a material of thicknessx resulting in a displacement of y and a scattering angle of θ. Reprinted from[18].
vantage of heavy ions compared to protons and it has a lead in radiotherapy bysaving the healthy tissue around tumor[9].
2.1.3 Nuclear Interactions
Stopping mechanism of ions penetrating a thick absorber occurs mostly by col-lisions with atomic electrons, while the probability of nuclear reactions is muchsmaller, but has a significant contribution at large penetration depths. At ener-gies of several hundred MeV/u, which are required for radiotherapy applications,nuclear reactions may result in partial fragmentation or in a complete disinte-gration of projectile and target nuclei [9].Nuclear fragmentation process can be described by the abrasion–ablation modelas illustrated in figure 7. Nucleons are abraded and form the hot reaction zone(fireball) in the overlapping area of the interacting projectile and target nuclei,while the outer nucleons (spectators) are only slightly affected by the collision.The remaining projectile, target fragments and the fireball de-excite by evap-orating nucleons and light clusters in the second step (ablation). While theprojectile-like fragments continue travelling nearly the same direction and ve-locity as the primary ions, the target-like fragments are emitted isotropicallywith much lower velocities. Nuclear reactions cause a loss of primary ions anda build-up of lower-Z fragments. The fragments have longer ranges than theprimary ions, hence they increase penetration depth. The depth-dose profile ofthe heavy-ion beams therefore shows a characteristic fragment tail beyond theBragg peak [19].A benefit of nuclear fragmentation is the production of prompt gamma rays,prompt secondary ions and beta emitters, which are used in beam monitoringmethods. Secondary ions are projectile fragments that are created in nuclearinteractions. Beam monitoring based on tracking of prompt secondary ions isproviding a real time information about ion beams.
8
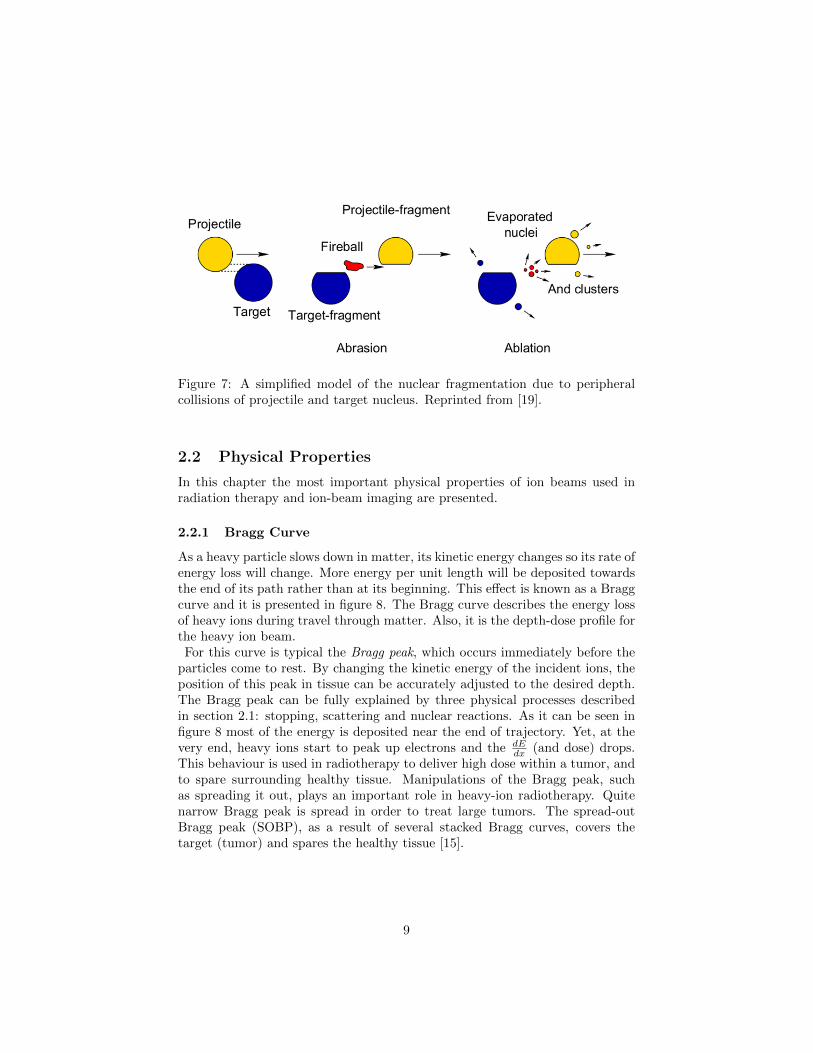
Figure 7: A simplified model of the nuclear fragmentation due to peripheralcollisions of projectile and target nucleus. Reprinted from [19].
2.2 Physical Properties
In this chapter the most important physical properties of ion beams used inradiation therapy and ion-beam imaging are presented.
2.2.1 Bragg Curve
As a heavy particle slows down in matter, its kinetic energy changes so its rate ofenergy loss will change. More energy per unit length will be deposited towardsthe end of its path rather than at its beginning. This effect is known as a Braggcurve and it is presented in figure 8. The Bragg curve describes the energy lossof heavy ions during travel through matter. Also, it is the depth-dose profile forthe heavy ion beam.For this curve is typical the Bragg peak, which occurs immediately before the
particles come to rest. By changing the kinetic energy of the incident ions, theposition of this peak in tissue can be accurately adjusted to the desired depth.The Bragg peak can be fully explained by three physical processes describedin section 2.1: stopping, scattering and nuclear reactions. As it can be seen infigure 8 most of the energy is deposited near the end of trajectory. Yet, at thevery end, heavy ions start to peak up electrons and the dE
dx (and dose) drops.This behaviour is used in radiotherapy to deliver high dose within a tumor, andto spare surrounding healthy tissue. Manipulations of the Bragg peak, suchas spreading it out, plays an important role in heavy-ion radiotherapy. Quitenarrow Bragg peak is spread in order to treat large tumors. The spread-outBragg peak (SOBP), as a result of several stacked Bragg curves, covers thetarget (tumor) and spares the healthy tissue [15].
9

Figure 8: The Bragg curve: the absorbed dose of a monoenergetic proton pencilbeam as function of the penetration depth. Reprinted from [20].
2.2.2 LET and RBE
The linear energy transfer (LET) is defined as the energy deposited by an ion-izing particle travelling through matter per unit length of the track [22]. It isclosely related to the stopping power described in section 2.1.1. However, thestopping power is a property of a material and describes energy absorbed bymatter while LET describes the energy loss of the particle.LET (commonly expressed in units of keV/µm) can not be used as a parameterto differentiate qualitatively the biological effects of different kinds of radiationbecause it is not a constant value. As a projectile ion’s charge and energy changealong the path of the particle, so does LET changes [10]. Even though LETis not a good parameter for defining the full spectrum of biological effects onradiation, it is still used to categorize damage caused by ions. For a given typeof radiation, the LET goes down as the energy goes up. This means that a high-energy ion has a lower LET than the same low-energy particle [22]. The LETbelow 10 keV/µm is considered as low LET radiation while above 10 keV/µm ishigh radiation [23]. Heavy ion beams find a medical application due to the highLET value within the Bragg peak and low LET value in the entrance channelof their trajectory. Since cells have less ability to repair high-LET radiationdamage, high-LET radiation is more effective for killing tumors.Relative biological effectiveness (RBE) is defined as as the ratio:
D =Dref
Drad(7)
where Drad is the dose released by the radiation, and Dref is the dose releasedby a reference radiation that produces the same amount of biological damage.Thus, the RBE depends on the radiation type and energy, dose and the biolog-
10

Figure 9: The superposition of Bragg curves (red) forms the SOBP (blue).Reprinted from [21].
ical endpoint.The RBE is very important quantity in treatment planning of heavy-ion ther-apy, as it determines the photon-equivalent dose. The photon-equivalent dosedefines the conventional radiation dose which would create the same biologicaleffect as the radiation applied.The heavy ion beams, as they travel through the matter, show very diverseRBEs. Also, different ions of the same LET may have different RBEs. Thedamage caused by radiation to a living cell is determined primarily by its loca-tion. The most critical is the damage to the cell nucleus, especially the DNAmolecules placed inside, which can lead to cell death or mutation. DNA dam-age has two pathways: direct ionization of its components or indirect damagethrough the water radiolysis in the particle track. The direct damage is morerelevant for the high-LET radiation, since it has denser tracks than low-LETradiation [24]. As shown in figure 10 with LET, RBE increases to a maximumvalue depending on ion type and decreases with higher LET values [9]. The rea-son for the decrease of RBE is that the more energy radiation does not changethe outcome. This is so called ”overkill” effect.
2.2.3 Dose
The most important physical quantity in radiotherapy is the dose deposited intissue, called absorbed dose. It is defined as the mean energy dε per unit massdm deposited by ionizing radiation [25]:
D =dε
dm[Gy = 1J/kg] (8)
Depending on the nature of the radiation and the type of tissue or organ ex-posed, the energy released in a living organism by radiation causes differenteffects. Hence, the biological dose is used, which is absorbed dose multiplied
11
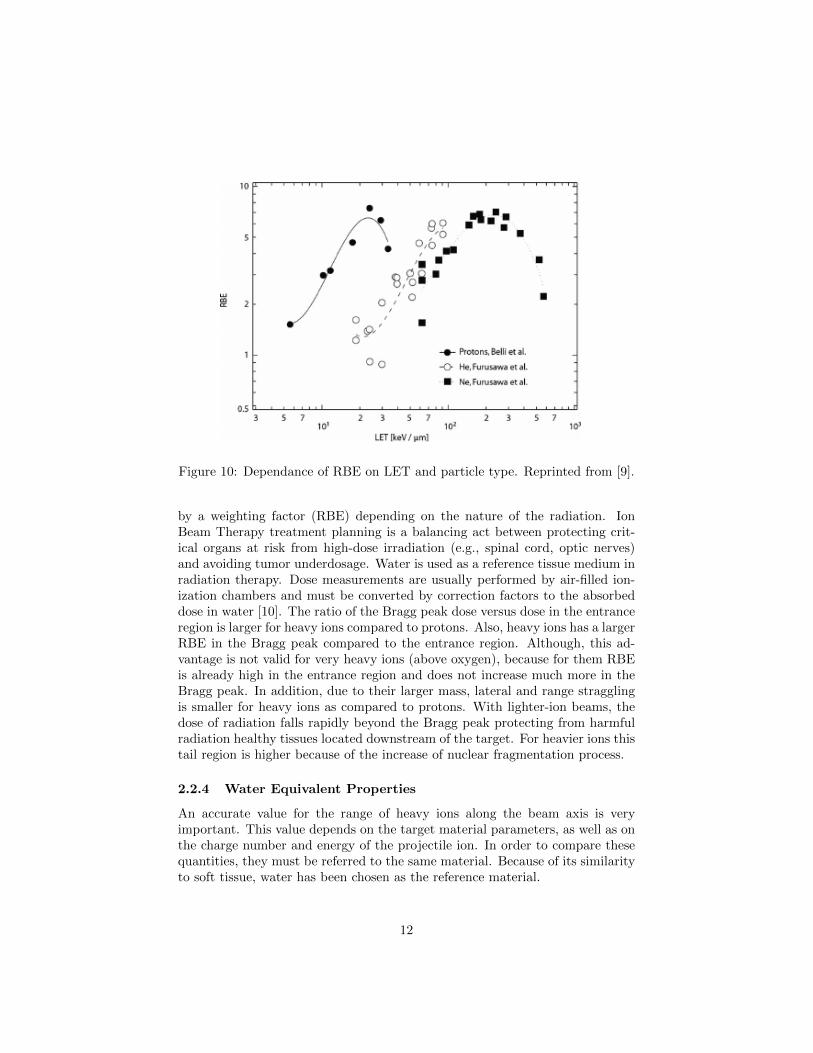
Figure 10: Dependance of RBE on LET and particle type. Reprinted from [9].
by a weighting factor (RBE) depending on the nature of the radiation. IonBeam Therapy treatment planning is a balancing act between protecting crit-ical organs at risk from high-dose irradiation (e.g., spinal cord, optic nerves)and avoiding tumor underdosage. Water is used as a reference tissue medium inradiation therapy. Dose measurements are usually performed by air-filled ion-ization chambers and must be converted by correction factors to the absorbeddose in water [10]. The ratio of the Bragg peak dose versus dose in the entranceregion is larger for heavy ions compared to protons. Also, heavy ions has a largerRBE in the Bragg peak compared to the entrance region. Although, this ad-vantage is not valid for very heavy ions (above oxygen), because for them RBEis already high in the entrance region and does not increase much more in theBragg peak. In addition, due to their larger mass, lateral and range stragglingis smaller for heavy ions as compared to protons. With lighter-ion beams, thedose of radiation falls rapidly beyond the Bragg peak protecting from harmfulradiation healthy tissues located downstream of the target. For heavier ions thistail region is higher because of the increase of nuclear fragmentation process.
2.2.4 Water Equivalent Properties
An accurate value for the range of heavy ions along the beam axis is veryimportant. This value depends on the target material parameters, as well as onthe charge number and energy of the projectile ion. In order to compare thesequantities, they must be referred to the same material. Because of its similarityto soft tissue, water has been chosen as the reference material.
12
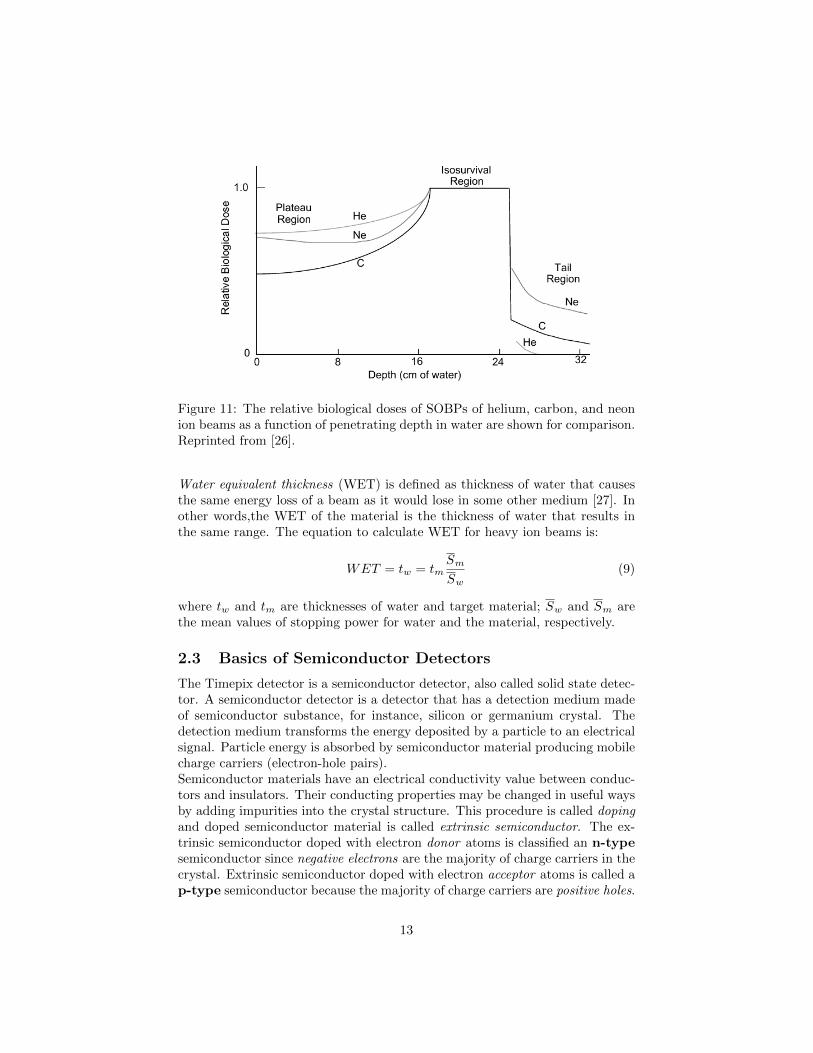
Figure 11: The relative biological doses of SOBPs of helium, carbon, and neonion beams as a function of penetrating depth in water are shown for comparison.Reprinted from [26].
Water equivalent thickness (WET) is defined as thickness of water that causesthe same energy loss of a beam as it would lose in some other medium [27]. Inother words,the WET of the material is the thickness of water that results inthe same range. The equation to calculate WET for heavy ion beams is:
WET = tw = tmSm
Sw(9)
where tw and tm are thicknesses of water and target material; Sw and Sm arethe mean values of stopping power for water and the material, respectively.
2.3 Basics of Semiconductor Detectors
The Timepix detector is a semiconductor detector, also called solid state detec-tor. A semiconductor detector is a detector that has a detection medium madeof semiconductor substance, for instance, silicon or germanium crystal. Thedetection medium transforms the energy deposited by a particle to an electricalsignal. Particle energy is absorbed by semiconductor material producing mobilecharge carriers (electron-hole pairs).Semiconductor materials have an electrical conductivity value between conduc-tors and insulators. Their conducting properties may be changed in useful waysby adding impurities into the crystal structure. This procedure is called dopingand doped semiconductor material is called extrinsic semiconductor. The ex-trinsic semiconductor doped with electron donor atoms is classified an n-typesemiconductor since negative electrons are the majority of charge carriers in thecrystal. Extrinsic semiconductor doped with electron acceptor atoms is called ap-type semiconductor because the majority of charge carriers are positive holes.
13
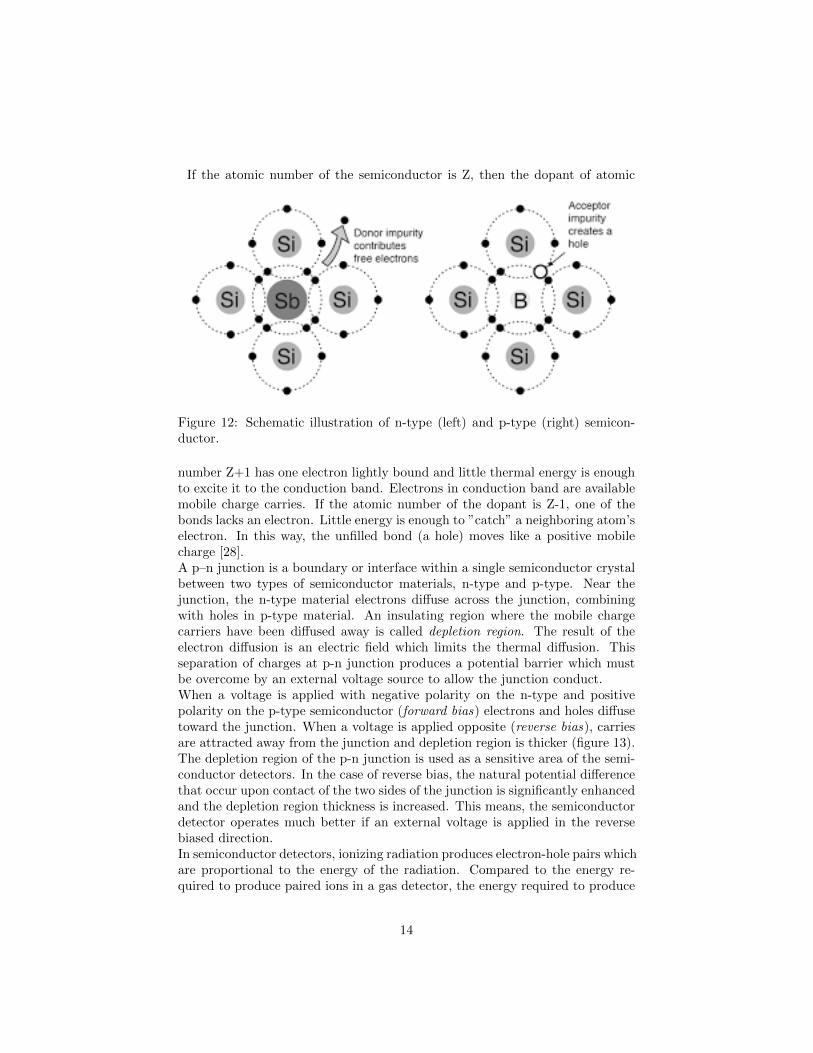
If the atomic number of the semiconductor is Z, then the dopant of atomic
Figure 12: Schematic illustration of n-type (left) and p-type (right) semicon-ductor.
number Z+1 has one electron lightly bound and little thermal energy is enoughto excite it to the conduction band. Electrons in conduction band are availablemobile charge carries. If the atomic number of the dopant is Z-1, one of thebonds lacks an electron. Little energy is enough to ”catch” a neighboring atom’selectron. In this way, the unfilled bond (a hole) moves like a positive mobilecharge [28].A p–n junction is a boundary or interface within a single semiconductor crystalbetween two types of semiconductor materials, n-type and p-type. Near thejunction, the n-type material electrons diffuse across the junction, combiningwith holes in p-type material. An insulating region where the mobile chargecarriers have been diffused away is called depletion region. The result of theelectron diffusion is an electric field which limits the thermal diffusion. Thisseparation of charges at p-n junction produces a potential barrier which mustbe overcome by an external voltage source to allow the junction conduct.When a voltage is applied with negative polarity on the n-type and positivepolarity on the p-type semiconductor (forward bias) electrons and holes diffusetoward the junction. When a voltage is applied opposite (reverse bias), carriesare attracted away from the junction and depletion region is thicker (figure 13).The depletion region of the p-n junction is used as a sensitive area of the semi-conductor detectors. In the case of reverse bias, the natural potential differencethat occur upon contact of the two sides of the junction is significantly enhancedand the depletion region thickness is increased. This means, the semiconductordetector operates much better if an external voltage is applied in the reversebiased direction.In semiconductor detectors, ionizing radiation produces electron-hole pairs whichare proportional to the energy of the radiation. Compared to the energy re-quired to produce paired ions in a gas detector, the energy required to produce
14
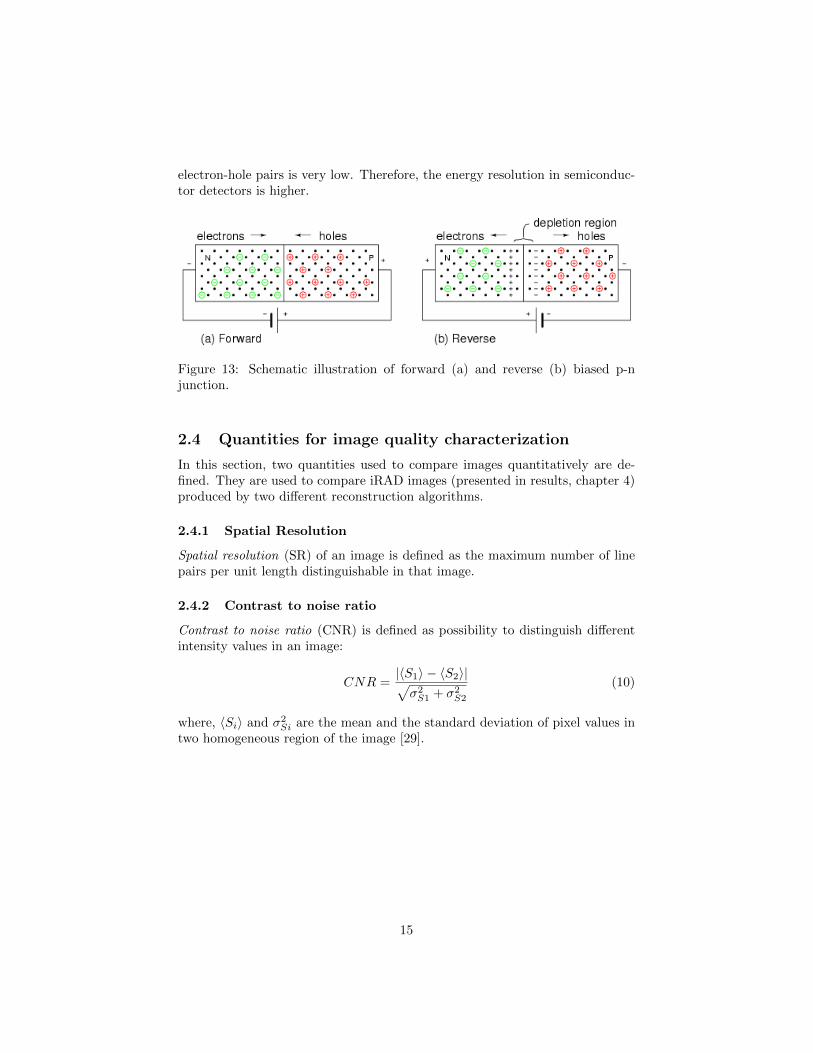
electron-hole pairs is very low. Therefore, the energy resolution in semiconduc-tor detectors is higher.
Figure 13: Schematic illustration of forward (a) and reverse (b) biased p-njunction.
2.4 Quantities for image quality characterization
In this section, two quantities used to compare images quantitatively are de-fined. They are used to compare iRAD images (presented in results, chapter 4)produced by two different reconstruction algorithms.
2.4.1 Spatial Resolution
Spatial resolution (SR) of an image is defined as the maximum number of linepairs per unit length distinguishable in that image.
2.4.2 Contrast to noise ratio
Contrast to noise ratio (CNR) is defined as possibility to distinguish differentintensity values in an image:
CNR =|〈S1〉 − 〈S2〉|√σ2S1 + σ2
S2
(10)
where, 〈Si〉 and σ2Si are the mean and the standard deviation of pixel values in
two homogeneous region of the image [29].
15

Figure 14: Example of an image with high SR (left) and low SR (right). Cor-responding horizontal profiles are shown in the lower panels. Reprinted from[29].
Figure 15: Example of an image with high CNR (left) and low CNR (right).Corresponding horizontal profiles are shown in the lower panels. Reprinted from[29].
16
3 Materials and Methods
This chapter describes the materials and methods which were used to performthe measurements of the thesis. The experiments were carried out with multipleTimepix detectors at the Heidelberg Ion-Beam Therapy Center (HIT), whichis described in section 3.1. Furthermore, this chapter presents the Timepixdetectors, their capabilities and operating modes in section 3.2. Eventually, theexperimental set-up and data processing are described in section 3.3 and 3.5.
3.1 Heidelberg Ion-Beam Therapy Center (HIT)
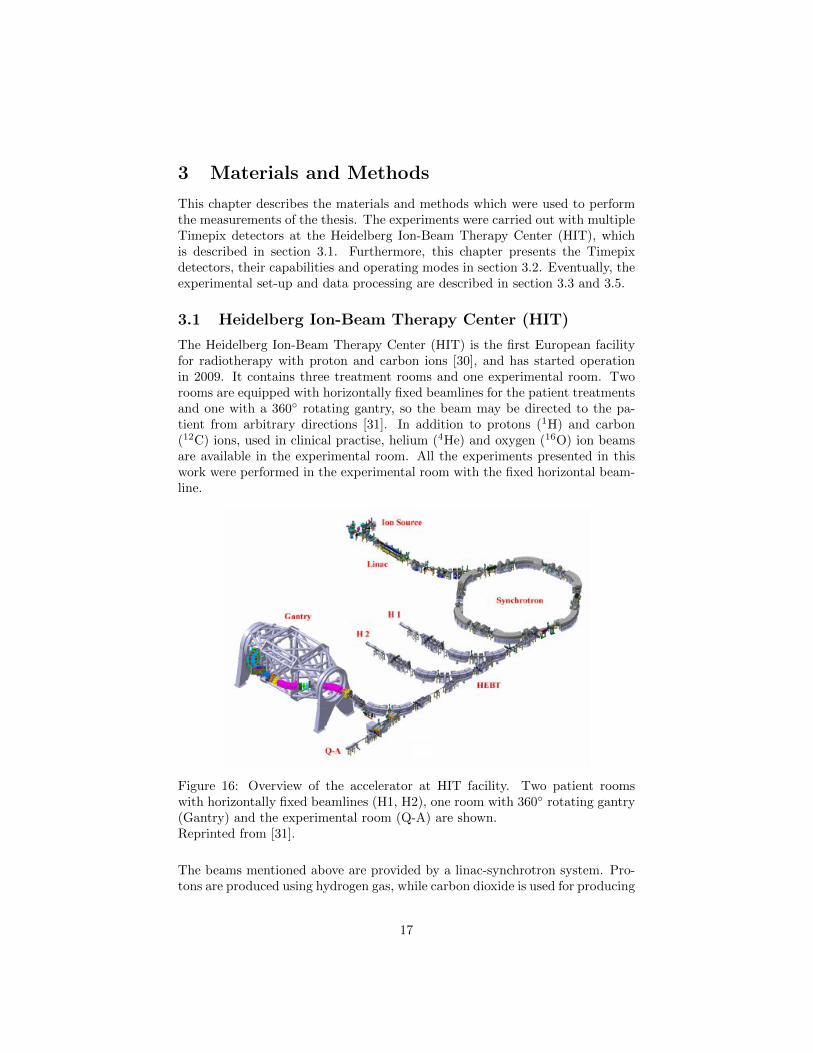
The Heidelberg Ion-Beam Therapy Center (HIT) is the first European facilityfor radiotherapy with proton and carbon ions [30], and has started operationin 2009. It contains three treatment rooms and one experimental room. Tworooms are equipped with horizontally fixed beamlines for the patient treatmentsand one with a 360 rotating gantry, so the beam may be directed to the pa-tient from arbitrary directions [31]. In addition to protons (1H) and carbon(12C) ions, used in clinical practise, helium (4He) and oxygen (16O) ion beamsare available in the experimental room. All the experiments presented in thiswork were performed in the experimental room with the fixed horizontal beam-line.
Figure 16: Overview of the accelerator at HIT facility. Two patient roomswith horizontally fixed beamlines (H1, H2), one room with 360 rotating gantry(Gantry) and the experimental room (Q-A) are shown.Reprinted from [31].
The beams mentioned above are provided by a linac-synchrotron system. Pro-tons are produced using hydrogen gas, while carbon dioxide is used for producing
17

carbon ions. Once the ions of interest are produced they are pre-accelerated ina linear accelerator. This is where the ions are accelerated up to 10% of thespeed of light. The pre-accelerated ions are then injected into the synchrotronwhere they can be accelerated to 255 discrete energy steps, corresponding to therange of 20 mm to 300 mm in water [31]. An advantage of using a synchrotronas accelerator for cancer radiotherapy is that it can accelerate ion beams tovarious energies [32]. After extraction of the beam from the synchrotron, ionsare directed to the treatment rooms via the high energy beam transport system.Dipole magnets deflect the beam, while quadrupole magnets are used to focusthe beam for the treatment.
Figure 17: The rasterscan technique at HIT. Reprinted from [24]
The tumor volume is covered by pencil beams. Active volume scanning in threedimensions is achieved by magnetic deflection of the beam in lateral direction(rasterscan technique, figure 17) and by energy variation of the synchrotronwhich provides coverage of different depths in order to fully cover the targetvolume [33]. This method allows very high dose conformity since the beam isactively controlled in longitudinal and lateral direction [34].In the beam nozzle at HIT, behind the vacuum exit window of the accelerator isthe beam application monitoring system (BAMS, Siemens AG) [35]. It is madeup of two multi-wire proportional chambers (MWPCs) and three ionizationchambers (ICs). It gives a real time position and fluence of the beam.
18

3.2 The Timepix Detector
The Timepix3 detector is a semiconductor pixel detector developed by theMedipix2 Collaboration at CERN [36]. It is a hybrid detector, which meansthat a sensitive sensor is coupled with an electronic chip. It has detection effi-ciency close to 100% for heavy ions.A sensitive area of the detector is 14 mm x 14 mm divided into 256 x 256 pixelswith a size of 55 µm x 55 µm. This sensitive layer is made of 300 µm thickcrystalline silicon and bump-bonded to the readout chip pixel-by-pixel [37]. Itis a silicon n-type semiconductor with a donor concentration of approximately(0.34±0.09) x 1012cm−3. Each pixel has its own electronics and circuity, whichenables the independent settings and operation for each pixel.
Figure 18: Timepix detector (1) connected to the read-out interface (4), withmotherboard (2) and bias voltage (3). Reprinted from [38].
The detector is attached to a motherboard, which connects the detector andthe read-out interface (figure 18). More detectors can be piled up together andfixed to the same motherboard. When attached to the same motherboard, theyare automatically synchronized, forming, a so called stack [39]. The read-outinterface provides a reverse bias voltage that is applied to the sensor layer andan external clock frequency. It is connected to a personal computer via USB2.0, where the detectors’ parameters are controlled by the software Pixet. Withthis software it is possible to set operation mode, signal threshold, frame dura-tion, clock frequency, bias voltage and many other settings [29]. The read-outinterface collects the data in frames (figure 28). A frame is the time intervalof data acquisition (active time). Between two frames is a dead time interval,during which the data are not acquired but processed before the beginning ofthe next frame. The interface allows achieving up to 90 frames per second witha single detector [39].
3The detectors were produced by ADVACAM s.r.o., Praha, Czech Republic
19
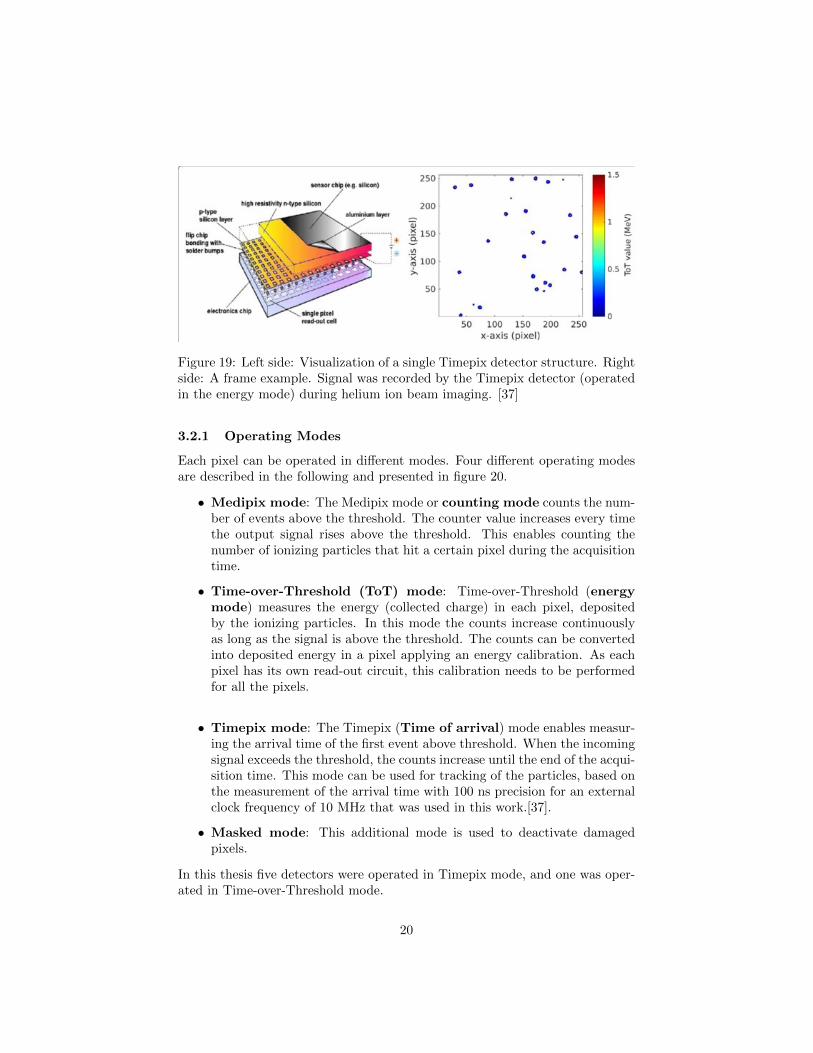
Figure 19: Left side: Visualization of a single Timepix detector structure. Rightside: A frame example. Signal was recorded by the Timepix detector (operatedin the energy mode) during helium ion beam imaging. [37]
3.2.1 Operating Modes
Each pixel can be operated in different modes. Four different operating modesare described in the following and presented in figure 20.
• Medipix mode: The Medipix mode or counting mode counts the num-ber of events above the threshold. The counter value increases every timethe output signal rises above the threshold. This enables counting thenumber of ionizing particles that hit a certain pixel during the acquisitiontime.
• Time-over-Threshold (ToT) mode: Time-over-Threshold (energymode) measures the energy (collected charge) in each pixel, depositedby the ionizing particles. In this mode the counts increase continuouslyas long as the signal is above the threshold. The counts can be convertedinto deposited energy in a pixel applying an energy calibration. As eachpixel has its own read-out circuit, this calibration needs to be performedfor all the pixels.
• Timepix mode: The Timepix (Time of arrival) mode enables measur-ing the arrival time of the first event above threshold. When the incomingsignal exceeds the threshold, the counts increase until the end of the acqui-sition time. This mode can be used for tracking of the particles, based onthe measurement of the arrival time with 100 ns precision for an externalclock frequency of 10 MHz that was used in this work.[37].
• Masked mode: This additional mode is used to deactivate damagedpixels.
In this thesis five detectors were operated in Timepix mode, and one was oper-ated in Time-over-Threshold mode.
20
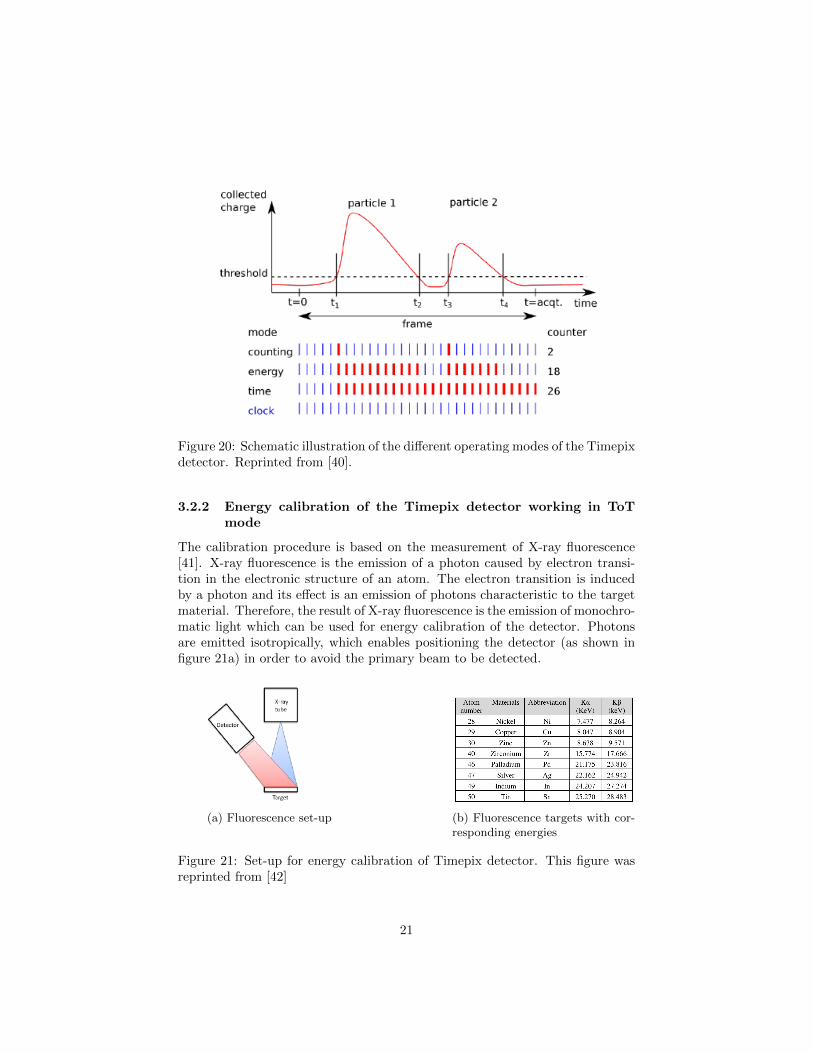
Figure 20: Schematic illustration of the different operating modes of the Timepixdetector. Reprinted from [40].
3.2.2 Energy calibration of the Timepix detector working in ToTmode
The calibration procedure is based on the measurement of X-ray fluorescence[41]. X-ray fluorescence is the emission of a photon caused by electron transi-tion in the electronic structure of an atom. The electron transition is inducedby a photon and its effect is an emission of photons characteristic to the targetmaterial. Therefore, the result of X-ray fluorescence is the emission of monochro-matic light which can be used for energy calibration of the detector. Photonsare emitted isotropically, which enables positioning the detector (as shown infigure 21a) in order to avoid the primary beam to be detected.
(a) Fluorescence set-up (b) Fluorescence targets with cor-responding energies
Figure 21: Set-up for energy calibration of Timepix detector. This figure wasreprinted from [42]
21

(a) Gaussian fit (b) Dependence on particle energy of theToT signal measured by single pixel, mod-eled by a surrogate function f(x)
Figure 22: The nonlinear calibration curve of a Timepix pixel device in ToTmode. Reprinted from [43].
In the calibration procedure, based on X-ray fluorescence, the detector is ir-radiated by monoenergetic radiation recording a spectrum for each pixel. Thespectral peaks are then fitted with Gaussian functions. Fitting of spectral peakswith Gaussian functions gives shifted results in the region close to the thresh-old. This problem occurs due to nonlinear response of pixels in the energy rangeclose to the threshold. The solution is fitting with a combination of a Gaussianand a surrogate function f(x), depending on four parameters [43]:
f(x) = ax+ b− c
x− t(11)
To convert Time-over-Threshold value (TOT) into energy (E) it is needed toapply a set of calibration matrices a, b, c, and t. The matrices are the resultof detectors’ calibration. They carry the calibration values of each pixel, hencetheir size is 256 x 256 elements.In the equation 11, x stands for the energy (in keV) deposited in the pixel, f(x)is counter value , and a, b, c, and t are considered matrices.Assuming a Gaussian energy distribution(figure 22a), the corresponding ToToutput will be distorted by the non-linear function, producing a distorted Gaus-sian output distribution [44] At low energy, the ToT probability function canbe fitted with a distorted Gaussian, but at high energy the ToT dependency ofenergy is close to linear (figure 22).This calibration is just important for detector #5 out of 6. An accurate cal-ibration of energy deposition is however very important, since this quantitydetermines the contrast of obtained radiographs.
22
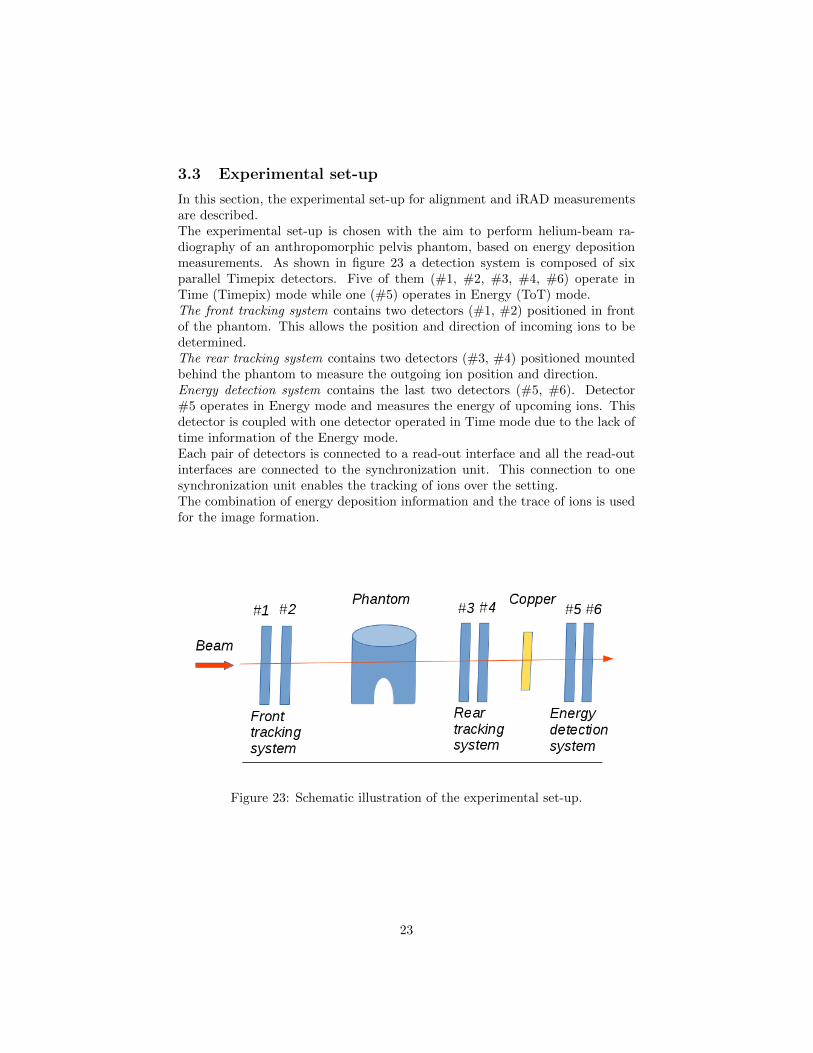
3.3 Experimental set-up
In this section, the experimental set-up for alignment and iRAD measurementsare described.The experimental set-up is chosen with the aim to perform helium-beam ra-diography of an anthropomorphic pelvis phantom, based on energy depositionmeasurements. As shown in figure 23 a detection system is composed of sixparallel Timepix detectors. Five of them (#1, #2, #3, #4, #6) operate inTime (Timepix) mode while one (#5) operates in Energy (ToT) mode.The front tracking system contains two detectors (#1, #2) positioned in frontof the phantom. This allows the position and direction of incoming ions to bedetermined.The rear tracking system contains two detectors (#3, #4) positioned mountedbehind the phantom to measure the outgoing ion position and direction.Energy detection system contains the last two detectors (#5, #6). Detector#5 operates in Energy mode and measures the energy of upcoming ions. Thisdetector is coupled with one detector operated in Time mode due to the lack oftime information of the Energy mode.Each pair of detectors is connected to a read-out interface and all the read-outinterfaces are connected to the synchronization unit. This connection to onesynchronization unit enables the tracking of ions over the setting.The combination of energy deposition information and the trace of ions is usedfor the image formation.
Figure 23: Schematic illustration of the experimental set-up.
23

3.3.1 Alignment measurements
A correct alignment of the six detectors is very important for this experiment.Adjustable metal construction was used to hold and position the detectors.Also, the laser system (with a precision of about 1 mm) at HIT facility wasused in order to position the center of each detector on the beam direction. Toincrease the precision, additional measurements were performed to determinethe residual misalignment of the detectors. The alignment measurements (figure24) were performed with a helium ion beam, without any target (phantom) orBUM. The energies of the He ion beam used for alignment measurements werethe same as for later performed αRAD of the phantom - 229.1 MeV/u and 239.5MeV/u. The cluster position distributions were fitted with polynomial curvealong the x and y directions, perpendicular to the beam axis (z). The maxima ofthe polynomial fits indicate the beam mean position. The beam mean positionon the third (# 3) detector was used as reference and residual shifts of the otherdetectors were determined with regard to the reference. After performance ofthe alignment measurements the detectors were not touched in order to keep anidentical positions of the detection system. Only the phantom and copper wereadded afterward for αRAD measurements.
Figure 24: Experimental set-up for alignment measurements.
3.3.2 αRAD measurements
For the αRAD measurements, the pelvis phantom was positioned between frontand back tracking system, and BUM was positioned between back tracking sys-tem and energy detection system (figure 25). The Alderson Radiation Therapy
24
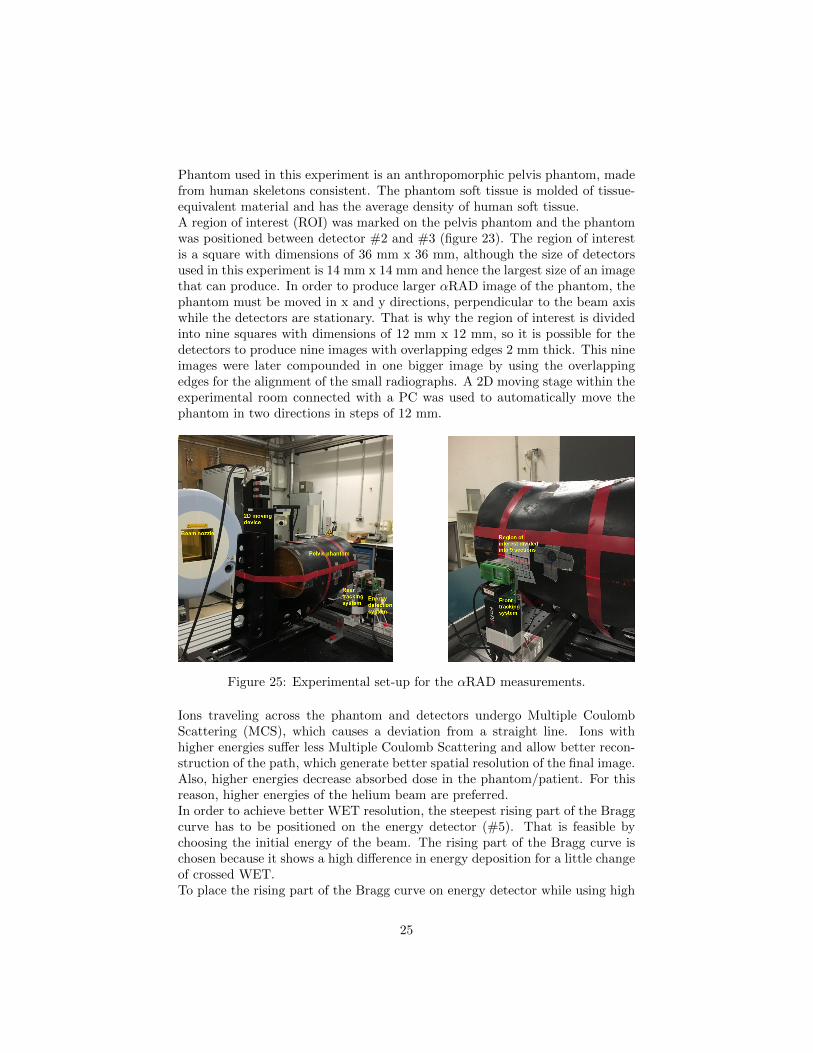
Phantom used in this experiment is an anthropomorphic pelvis phantom, madefrom human skeletons consistent. The phantom soft tissue is molded of tissue-equivalent material and has the average density of human soft tissue.A region of interest (ROI) was marked on the pelvis phantom and the phantomwas positioned between detector #2 and #3 (figure 23). The region of interestis a square with dimensions of 36 mm x 36 mm, although the size of detectorsused in this experiment is 14 mm x 14 mm and hence the largest size of an imagethat can produce. In order to produce larger αRAD image of the phantom, thephantom must be moved in x and y directions, perpendicular to the beam axiswhile the detectors are stationary. That is why the region of interest is dividedinto nine squares with dimensions of 12 mm x 12 mm, so it is possible for thedetectors to produce nine images with overlapping edges 2 mm thick. This nineimages were later compounded in one bigger image by using the overlappingedges for the alignment of the small radiographs. A 2D moving stage within theexperimental room connected with a PC was used to automatically move thephantom in two directions in steps of 12 mm.
Figure 25: Experimental set-up for the αRAD measurements.
Ions traveling across the phantom and detectors undergo Multiple CoulombScattering (MCS), which causes a deviation from a straight line. Ions withhigher energies suffer less Multiple Coulomb Scattering and allow better recon-struction of the path, which generate better spatial resolution of the final image.Also, higher energies decrease absorbed dose in the phantom/patient. For thisreason, higher energies of the helium beam are preferred.In order to achieve better WET resolution, the steepest rising part of the Braggcurve has to be positioned on the energy detector (#5). That is feasible bychoosing the initial energy of the beam. The rising part of the Bragg curve ischosen because it shows a high difference in energy deposition for a little changeof crossed WET.To place the rising part of the Bragg curve on energy detector while using high
25

Figure 26: Schematic depiction of the function of the copper degrader (BUM).Modified from [29].
energy of the beam, an element called the build-up material (BUM) is used(figure 26). This element is made of copper and is set between the rear trackingsystem and energy detection system (figure 23) in order to absorbe the energyof the beam and degrade its range. The combination of a fixed BUM thicknessand an adjustment of the initial energy assured that the position of the risingpart of the Bragg curve is on the energy detector.
3.4 WET calibration
The thickness of the phantom is different for all the nine regions of interestand each region has different water equivalent thickness (WET) value. For eachROI the WET was estimated based on X-ray CT data. This has to be done inorder to optimally adjust the initial energy of the beam. This process is the onecurrently used in the clinic with uncertainties of about 3%.The aim of iRAD is to deliver a more accurate WET map of the ROI. For thispurpose calibration curves for He beam at different energies, developed withinthe same research group, were used. In order to create these calibration curvesthat convert energy deposition to WET, several measurements at HIT with fordifferent energies were performed. The set-up for those measurements consistedsix Timepix detectors in the same positions as for alignment and αRAD mea-surements, with the PMMA phantom of different thicknesses and known WET.The energy deposition on detector # 5 was measured and with that data cal-ibration curves were made (figure 27). Using the calibration curves, suitableenergy was chosen for each region according to its predicted WET value fromX-ray CT data. If the WET of the region has a value on the steep part of thecalibration curve, that energy was chosen for irradiating the region. The steeppart on the calibration curve shows large difference in WET for little change ofenergy deposition, which produce better αRAD image contrast.If the predicted WET map (DRR) and the measured WET map directly be-
26

fore the patient treatment starts show a difference above a certain threshold, itmeans that the planning X-ray CT does not reflect the actual treatment situa-tion.
(a) 229.1 MeV/u (b) 239.5 MeV/u
Figure 27: Calibration curves that provide a conversion of the energy depositioninto the WET for each pixel. Reprinted from [45].
3.5 Data processing
This section describes the processing and analyzing of the measured data. Theaim of the data processing is to remove background caused by detector artifactsand by secondary hydrogen ions that are mainly created by nuclear interactionsof the primary helium ions with the atomic nuclei of the phantom. It is alsoused to match events through all detectors caused by the same helium ion andfor a correct alignment of the six detectors. Data processing allows image recon-struction based on ion tracking and energy deposition (Cubic Spline Path (CSP)and Along Path Reconstruction (APR)). C++ and Matlab routines developedin the group have been used for these purposes.
3.5.1 Cluster classification
Raw data have been collected from each measurement. Six detectors recorddata files in frames in the form of clusters. After measurement, raw measureddata have been processed and only ”clean” data (clusters that have not beenrejected by the classification) have been used for image reconstruction. Theprocessing steps are explained in this section, while their results are presentedin section 4.2.Each time an ionizing radiation reaches the detector’s sensitive surface, it pro-duces a certain amount of charge depending on the type and energy of theradiation. The charge can spread because of Coulomb repulsion force and dif-fusion, also reaching neighboring pixels of the initially hit pixel. This effect
27
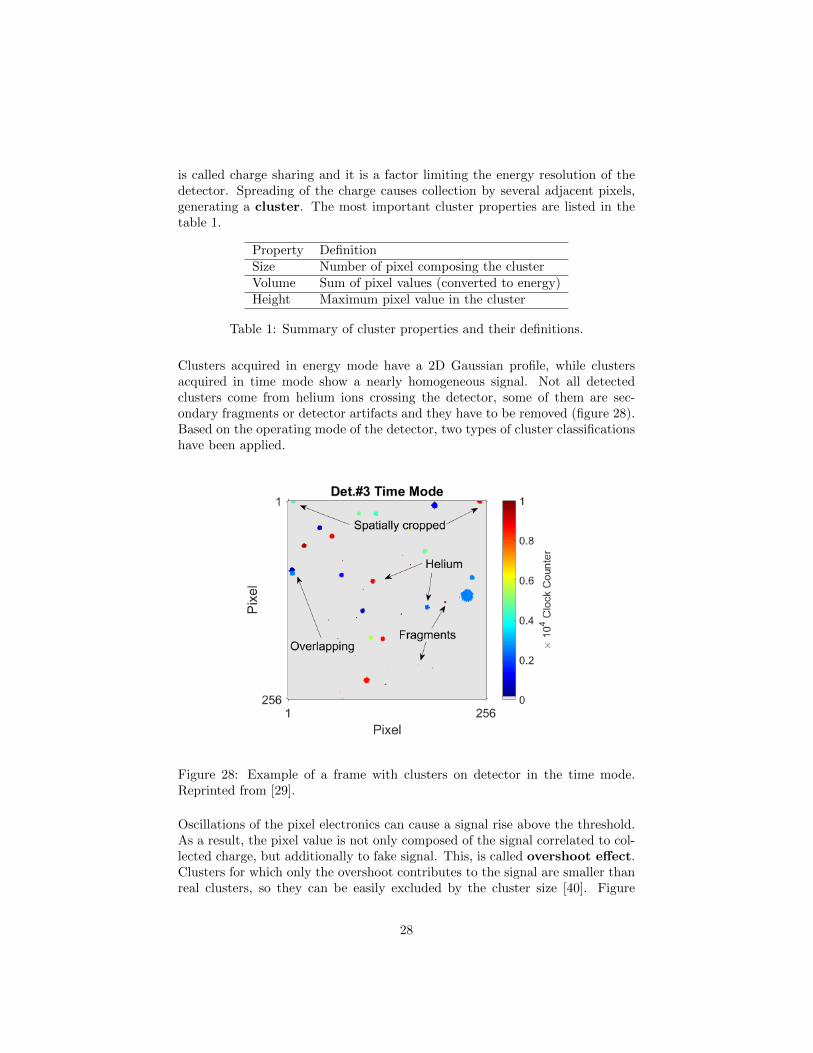
is called charge sharing and it is a factor limiting the energy resolution of thedetector. Spreading of the charge causes collection by several adjacent pixels,generating a cluster. The most important cluster properties are listed in thetable 1.
Property DefinitionSize Number of pixel composing the clusterVolume Sum of pixel values (converted to energy)Height Maximum pixel value in the cluster
Table 1: Summary of cluster properties and their definitions.
Clusters acquired in energy mode have a 2D Gaussian profile, while clustersacquired in time mode show a nearly homogeneous signal. Not all detectedclusters come from helium ions crossing the detector, some of them are sec-ondary fragments or detector artifacts and they have to be removed (figure 28).Based on the operating mode of the detector, two types of cluster classificationshave been applied.
Figure 28: Example of a frame with clusters on detector in the time mode.Reprinted from [29].
Oscillations of the pixel electronics can cause a signal rise above the threshold.As a result, the pixel value is not only composed of the signal correlated to col-lected charge, but additionally to fake signal. This, is called overshoot effect.Clusters for which only the overshoot contributes to the signal are smaller thanreal clusters, so they can be easily excluded by the cluster size [40]. Figure
28

29 illustrates this effect. The clusters, arriving on the detector before a framehas started have a degraded cluster volume. One part of these clusters have asmaller cluster size therefore, they can be also excluded by the cluster size.
Figure 29: Illustration of the overshoot effect Reprinted from [40]
Short acquisition time disables the real signal and the overshoot effect to beincluded in the same frame. For this reason acquisition time ≤ 1 ms wouldbe desirable. On the other hand, the shorter the acquisition time is, the moreclusters within the frame can not be completely digitized. This determines thelower limit of the acquisition time. In this work the acquisition time of 1 mswas used as a compromise between these two competing criteria.When two or more particles arrive to the detector close to each other, theycreate overlapping clusters (figure 28). Overlaps can be detected by analyz-ing the number of local maxima per cluster. Local maximum is defined as apixel value, equal or bigger than all adjacent pixels and higher than 20% of theabsolute maximum [46]. If two or more maxima were found in a cluster, thatcluster was rejected.
(a) (b)
Figure 30: Example of frame with raw data and frame after the cluster classifi-cation in (a) time mode and (b) energy mode. Reprinted from [29].
29

3.5.2 Particle tracking
The front and rear tracking systems determine the trace data of the single ionsupstream and downstream of the phantom. Matched clusters through all the sixdetectors caused by the same helium ion are considered as one matched event.The matching process is illustrated in figure 31 and is based on the search forcoincident hits on the Time detectors. This process is called time matching. Thetime of arrival at detectors operating in Time mode is used to determine thepath of single ions. A coincidence window of ± 0.2 µm was applied for clusterpairs on the first two detectors, the second two detectors and also between thefirst two and the second two detectors. Time matching cannot be preformed incase of detector operating in Energy mode (detector #5), therefore the match-ing of clusters between detectors #5 and #6 is based on spatial information(spatial matching). The distances between the cluster at detector #6 and allthe clusters at detector #5 are evaluated for each time-wise matched event. Ifthe distance is less than 20 pixels (1.1 mm), clusters are matched, otherwise theevent is dismissed. The spatial matching between detector #5 and detector #6is only feasible for small incident angles (which is the case for the helium-beamradiography).
Figure 31: Schematic illustration of the matching algorithm. Reprinted from[29].
3.5.3 Image reconstruction
After filtering of the clusters with degraded information and matching proce-dure, a final step for the image formation was performed. To generate a ra-diography, it is important to have en estimation of the ion’s path inside the
30

phantom. The positions of the clusters at detectors # 1, # 2 and # 3,# 4were used to reconstruct the paths of ions upstream and downstream of thephantom. With the known distances from phantom to the detectors and theassumption that ions have a linear path in the air, it is possible to determinethe projection/backprojection of the ion track onto the front/back surface of the
phantom. ro, do and r1, d1 are the position vectors and direction unit vectors atthe front and back surface of the phantom [46]. For the estimation of the mostlikely path of the ion inside the phantom two algorithms were used.
• The first algorithm is called Cubic Spline Path (CSP) and it is a thirddegree polynomial function. The path inside the phantom was determinedaccording to the following equation:
r(t) = (2t3−3t2+1)r0+(t3−2t2+t)Λopto do+(−2t3+3t2)r1+(t3−t2)Λopt1 d1(12)
where t is temporal parameter ranging between 0 and 1, do,1 = do,1|r1−r0|and Λopt0,1 is a scaling factor for the length of the direction vectors.
• For the second algorithm, called Along Path Reconstruction (APR), CSPwas again used for the path estimation inside the phantom. The pathwas divided in 64 pixels along x and y, and 50 planes along z. The energydeposition of the ion in the detector (∆ E) was uniformly distributed alongthe particle’s path (z axis). This procedure was repeated for each ion. Themean values of the energy deposition in each volume element (voxel) werethen integrated along the z axis, obtaining 64 px x 64 px image.
31

4 Results and discussion
This chapter presents the results of the He-beam radiography of anthropomor-phic pelvis phantom. Also, it describes the data processing and image recon-struction from processed data.
4.1 Experiments
All the experiments have been performed in the experimental room at TheHeidelberg Ion-Beam Therapy Center (HIT, described in section 3.1). Settingsof the beam used for the alignment and αRAD measurements are listed in thetable 2 and detectors’ settings are presented in table 3.
Ion HeliumEnergy 229.1 MeV/u 239.5 MeV/uRange 329.3 mm 354.8 mm
Intensity ≈ 4.4 x 10⁴ particlesModality continuous shoots of 12 s + 5 s of dead time
Table 2: Characteristics of the He-ion beam used for the experiments.
Detector #1 #2 #3 #4 #5 #6Position [mm] 0 3.65 439.5 443.5 465.0 469.0
Operating mode Time of arrival Energy mode Time of arrivalBias voltage 10 V
Acquisition time 1 ms
Table 3: Settings of the Timepix detectors used for the experiments.
First, the alignment measurements (described in section 3.3.1) were performedin order to precisely align all the detectors on the beam axis. The alignmentmeasurements were carried out with six Timepix detectors and with no phantomand no BUM between them (figure 24).Irradiation for the alignment measurements lasted 10 min for each of two Heion beam energies (229.1 MeV/u and 239.5 Mev/u). After merging the clustersfrom all six detectors over 2.6 x 10⁶ clusters were stored in the processed filefor each energy. Results of the alignment measurements for two energies arepresented in table 4.For the αRAD measurements the region of interest was divided in nine squares.For each of them the mean WET value was estimated from DRR based on X-rayCT. A rough WET value of each region was used in order to choose the adequateenergy for each region. If WET is known, using the calibration curves presentedin section 3.4, it is easy to choose the right energy. If the WET has a value on the
32

Coorection indirection [mm]
#1 #2 #3 #4 #5 #6 Energy
x -8.421 -9.473 0 -0.098 -0.314 -0.378229.1
y 1.223 0.056 0 -2.149 5.829 6.731x -8.470 -9.499 0 -0.099 -0.321 -0.378
239.5y 1.546 0.576 0 -2.145 5.832 6.711
Table 4: Results of the alignment measurements for six detectors with isocenteron detector #3.
steep part of the calibration curve, the energy has been selected to irradiate thearea. The steep part on the calibration curve shows large difference in WET forlittle change of energy deposition. Nine regions with the corresponding valuesare presented in table 5.
4.2 Data processing
This paragraph presents the results of data processing, which are described insection 3.5.
4.2.1 Cluster classification
A heatmap of all clusters (figure 32) and the remaining clusters (figure 33) showsthe efficiency of data processing described in section 3.5.1. This heat map wasobtained during energy deposition measurements of helium ions with E = 239.6MeV/u. On the horizontal axes the clusters are sorted by size and volume, whilethe vertical axis shows relative number of clusters. The marked region by or-ange circle on figure 32, originates from secondary hydrogen ions and overshootclusters (described in section 3.5.1), while the green circle presents ions withhigh energy deposition. Clusters with high energy deposition stop in detector# 5 and do not reach detector# 6, therefore they can not be matched and theyare removed. The red opaque peak on figure 33 presents primary helium ionswhich are preserved after the selection procedures. Transparent regions indicateneglected clusters.The contribution of secondary hydrogen ion clusters is around 10 %, while thecontribution of clusters with high energy deposition is much smaller at around0.2 %.
33
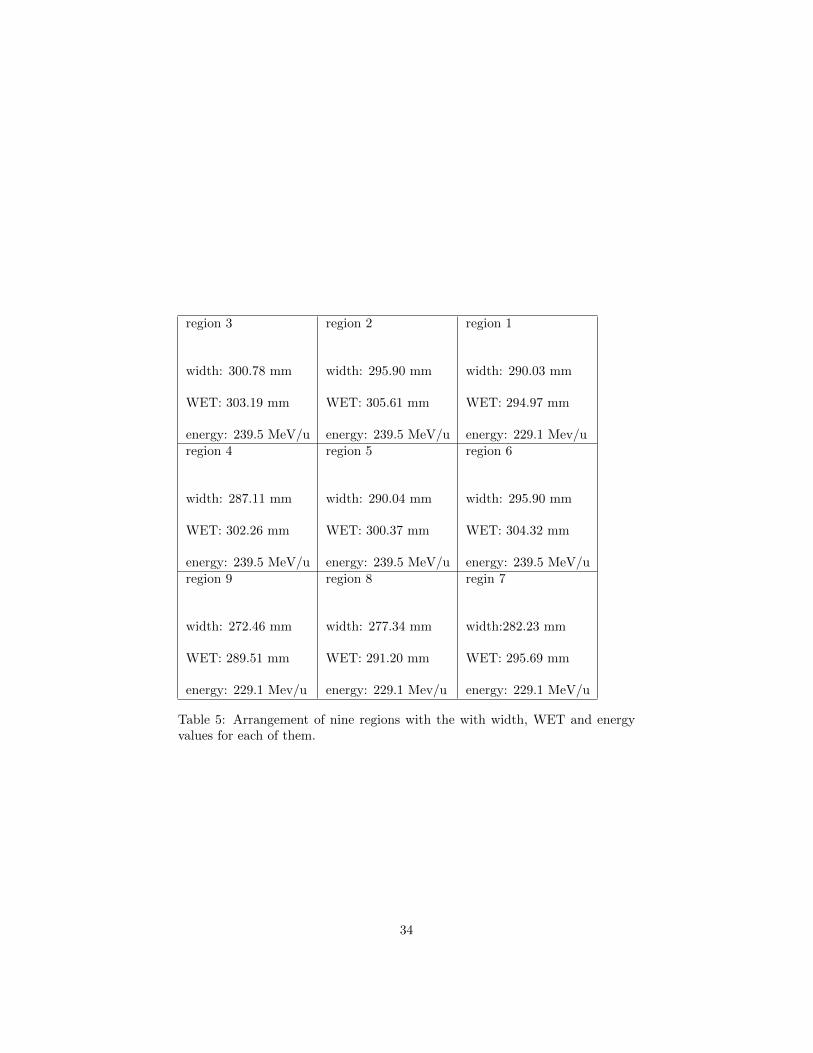
region 3
width: 300.78 mm
WET: 303.19 mm
energy: 239.5 MeV/u
region 2
width: 295.90 mm
WET: 305.61 mm
energy: 239.5 MeV/u
region 1
width: 290.03 mm
WET: 294.97 mm
energy: 229.1 Mev/uregion 4
width: 287.11 mm
WET: 302.26 mm
energy: 239.5 MeV/u
region 5
width: 290.04 mm
WET: 300.37 mm
energy: 239.5 MeV/u
region 6
width: 295.90 mm
WET: 304.32 mm
energy: 239.5 MeV/uregion 9
width: 272.46 mm
WET: 289.51 mm
energy: 229.1 Mev/u
region 8
width: 277.34 mm
WET: 291.20 mm
energy: 229.1 Mev/u
regin 7
width:282.23 mm
WET: 295.69 mm
energy: 229.1 MeV/u
Table 5: Arrangement of nine regions with the with width, WET and energyvalues for each of them.
34

Figure 32: Heatmap of all clusters before the cluster classification.
Figure 33: Heatmap of remaining clusters after the cluster classification.
35

4.2.2 Particle tracking
To reconstruct the path of each particle, it is important to match the clusters onthe different detectors. The matching of signals performed between detectorsoperating in the time mode (#1, #2, #3, #4, #6) was performed using acoincidence window of 200 ns. The matching between signals on detector #5 operating in energy mode and detector # 6 was performed using a spatialwindow of 1.1 mm. This process is described in section 3.5.2. The result ofmatching algorithm are matched events, which have been used to reconstructthe radiographs.The matching efficiency is defined as a ratio of the total number of matchedevents on all six detectors (Nmatch) and good clusters on detector #6 (Ndet.6 )[29]:
ηM =Nmatch
Ndet.6(13)
Rejection of the clusters on detectors #1 to #5 during the cluster classifica-tion cause a decrease of matching efficiency. With too high beam intensity orbig clusters, matching efficiency is lower because the probability of overlappingcluster increases. A matching efficiency of 100% would mean that all the goodclusters on detector # 6 have been successfully matched.The transmission efficiency is defined as a ratio of the number of primary ionsthat crossed all the detectors (good clusters on detector #6. Ndet.6 ) and thenumber of incoming helium ions (good clusters on detector #1, Ndet.1 ) [29]:
ηT =Ndet.6
Ndet.1(14)
For each region the matching and the transmission efficiency are listed in thetable 6. Figure 34 shows this two values during the measurement for one region.
Efficiency Matching [%] Transmission [%]Region 1 28.05 38.27Region 2 33.31 34.47Region 3 35.42 35.63Region 4 31.94 34.95Region 5 32.85 34.88Region 6 35.69 36.15Region 7 34.63 29.87Region 8 31.34 31.06Region 9 29.83 31.46
Table 6: Matching and transmission efficiency for nine regions.
Matching and transmission efficiency values are important in order to evaluate
36

Figure 34: Transmission and matching efficiency of region 3 over the time ofmeasurement.
the imaging dose in the end. The apsorbed dose is:
D =1 · 105
ηM · ηT·Dion, (15)
where Dion is the dose per primary helium ion. The ηM and ηT are estimatedthrough experiment, while the Dion is estimated through Monte Carlo simula-tions [29].
37
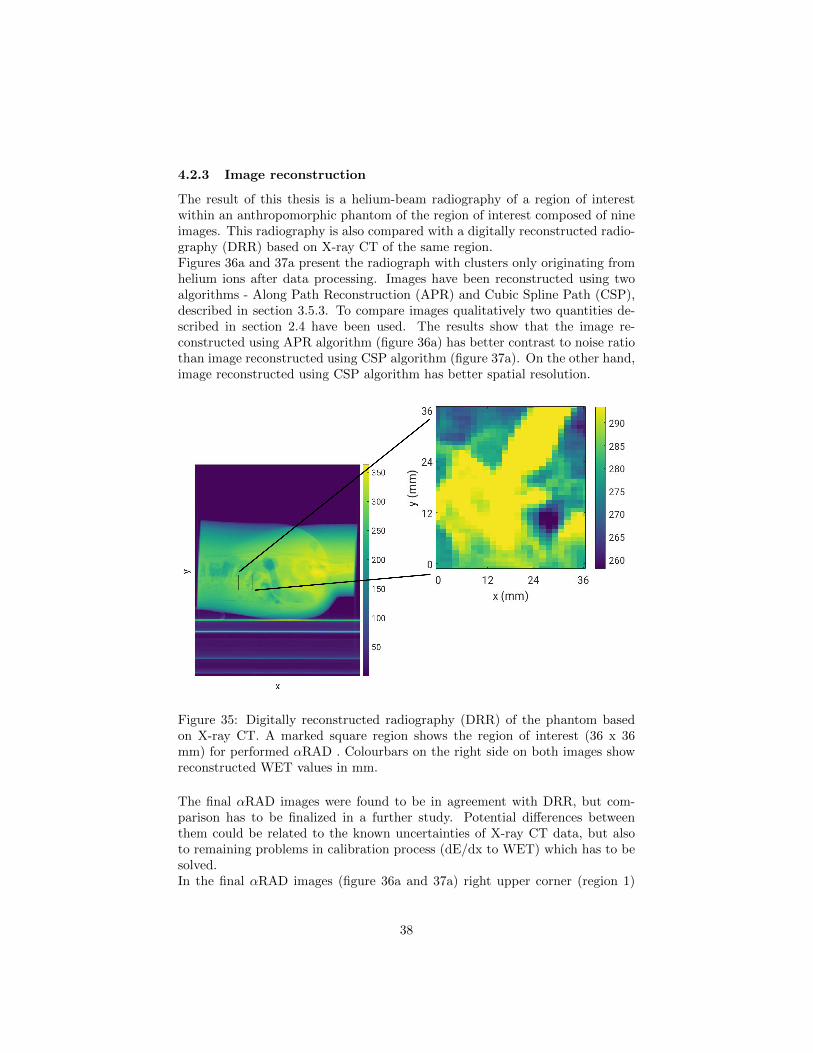
4.2.3 Image reconstruction
The result of this thesis is a helium-beam radiography of a region of interestwithin an anthropomorphic phantom of the region of interest composed of nineimages. This radiography is also compared with a digitally reconstructed radio-graphy (DRR) based on X-ray CT of the same region.Figures 36a and 37a present the radiograph with clusters only originating fromhelium ions after data processing. Images have been reconstructed using twoalgorithms - Along Path Reconstruction (APR) and Cubic Spline Path (CSP),described in section 3.5.3. To compare images qualitatively two quantities de-scribed in section 2.4 have been used. The results show that the image re-constructed using APR algorithm (figure 36a) has better contrast to noise ratiothan image reconstructed using CSP algorithm (figure 37a). On the other hand,image reconstructed using CSP algorithm has better spatial resolution.
Figure 35: Digitally reconstructed radiography (DRR) of the phantom basedon X-ray CT. A marked square region shows the region of interest (36 x 36mm) for performed αRAD . Colourbars on the right side on both images showreconstructed WET values in mm.
The final αRAD images were found to be in agreement with DRR, but com-parison has to be finalized in a further study. Potential differences betweenthem could be related to the known uncertainties of X-ray CT data, but alsoto remaining problems in calibration process (dE/dx to WET) which has to besolved.In the final αRAD images (figure 36a and 37a) right upper corner (region 1)
38

shows poor resolution caused probably by wrong choice of the beam energy.Left side of this region is really dense due to the presence of bone, hence ionswere stopped before reaching the energy detector behind the phantom.Also, there is an issue of WET determination between the images with theenergy of 239.5 MeV and 229.1 MeV. So, the first attempt to implement thecalibration procedure for a radiograph of an anthropomorphic phantom did notcompletely work. This means that transition issues between the images of dif-ferent energy have to be further investigated and the calibration curve of eachenergy has to be verified in another measurement.
(a) (b)
Figure 36: Comparation of αRAD image reconstructed using APR algorithm(a), and DRR (b).
(a) (b)
Figure 37: Comparation of αRAD image reconstructed using CSP algorithm(a), and DRR (b).
39

5 Conclusion
The long-term motivation of this thesis was to improve ion-beam radiotherapytreatments with performing ion-beam radiography (iRAD) in addition to theimaging techniques that are used for treatment planning nowadays. Currently,the most important imaging technique for treatment planning of ion-beam ther-apy is X-ray CT. However, the conversion of the attenuation of X-rays into ionstopping power produce uncertainties of the ion range of about 3%. iRAD has apotential benefit since the imaging and treatment radiation are identical whichavoid conversion errors. iRAD enables the direct measurement of the integratedrelative stopping power of the ions crossing the patient, and the method can beused with the patient being already in treatment position. With this informa-tion the correct positioning of the patient could be performed and it could beverified that appropriate energies were chosen in order to adjust the Bragg peakto the depth of the tumor.In the present thesis a method of helium-beam radiography (αRAD) has beeninvestigated. The technique for αRAD , based on single-ion tracking system hasbeen developed at the German Cancer Research Center (DKFZ) in Heidelberg,Germany.The detection system is composed of pixelated detectors, Timepix, developed atCERN in the Medipix Collaboration. Six parallel Timepix detectors have beenused for front and rear tracking systems, and for an energy detection system.The tracking systems, positioned upstream and downstream of the phantom,have been used to measure position and direction of incoming and outgoingions. The energy detection system has been used for energy deposition mea-surements with additional time information. Measuring the energy loss of theions in the detector provides the image contrast. The steep rising part of theBragg peak has been placed at the energy detector. With this, it was possibleto measure large changes in energy deposition for small changes in the WET ofthe phantom, enabligh high-contrast imaging.Nuclear fragmentation of helium ions cause the production of secondary hy-drogen ions. They also reach the energy detector and lead to a noisy images.Because of that, it is important to distinguish secondary fragments from pri-mary helium ions during the imaging process. The presented detection systemcan identify the ion type, which enables the elimination of the secondary hydro-gen ions in post-processing phase. Also, in the data processing, it is possible toremove fake signals on the detectors caused by detector artifacts.All these processes were modified and further developed for the application onan anthropomorphic pelvis phantom. A new set of helium-beam energies thatare higher than energies relevant for radiation treatment with preliminary ac-celerator settings (229.1 MeV/u and 239.5 MeV/u) at the Heidelberg Ion-BeamTherapy Center (HIT) could be used for the first time, enabling αRAD of a thickanthropomorphic phantom. WETs measured by αRAD have the same validityas WETs measured by proton and carbon beams. Helium-beams have beenchosen because it suffers less multiple Coulomb scattering than proton-beamsand less fragmentation than carbon-beams. In the end the WET map of the
40
region of interest obtained from the αRAD have been compared qualitativelywith the WET map acquired from digitally reconstructed radiography (DRR)based on the planning X-ray CT.To summarize, the presented study has shown the advantage of αRAD andits first application on an anthropomorphic pelvis phantom. αRAD might up-grade ion-beam radiotherapy treatments, but for a potential clinical applicationfurther improvements of this method are required.
41
Bibliography
References
[1] Max LM Boone, John H Lawrence, William G Connor, Richard Morgado,John A Hicks, and Richard C Brown. Introduction to the use of protonsand heavy ions in radiation therapy: historical perspective. InternationalJournal of Radiation Oncology* Biology* Physics, 3:65–69, 1977.
[2] Tim Gehrke. Helium-beam Radiography with a Fully Pixelated Silicon De-tection System. PhD thesis, Ruperto-Carola University of Heidelberg, 2018.
[3] M Jermann. Particle therapy patient statistics (per end of 2018).
[4] William Henry Bragg and RLXXIV Kleeman. Lxxiv. on the ionizationcurves of radium. The London, Edinburgh, and Dublin Philosophical Mag-azine and Journal of Science, 8(48):726–738, 1904.
[5] Allan Macleod Cormack. Representation of a function by its line integrals,with some radiological applications. Journal of applied physics, 34(9):2722–2727, 1963.
[6] Gavin Poludniowski, NM Allinson, and PM Evans. Proton radiographyand tomography with application to proton therapy. The British journalof radiology, 88(1053):20150134, 2015.
[7] Uwe Schneider and Eros Pedroni. Proton radiography as a tool for qualitycontrol in proton therapy. Medical physics, 22(4):353–363, 1995.
[8] PJ Doolan, M Testa, G Sharp, EH Bentefour, G Royle, and HM Lu.Patient-specific stopping power calibration for proton therapy planningbased on single-detector proton radiography. Physics in Medicine & Bi-ology, 60(5):1901, 2015.
[9] Dieter Schardt, Thilo Elsasser, and Daniela Schulz-Ertner. Heavy-ion tu-mor therapy: Physical and radiobiological benefits. Reviews of modernphysics, 82(1):383, 2010.
[10] Ute Linz. Ion beam therapy: fundamentals, technology, clinical applications.Springer Science & Business Media, 2011.
[11] L Opalka, C Granja, B Hartmann, J Jakubek, O Jaekel, M Martisikova,S Pospisil, and J Solc. 3d measurement of the radiation distribution ina water phantom in a hadron therapy beam. Journal of Instrumentation,7(01):C01085, 2012.
[12] T Gehrke, C Amato, S Berke, and M Martisıkova. Theoretical and exper-imental comparison of proton and helium-beam radiography using siliconpixel detectors. Physics in Medicine & Biology, 63(3):035037, 2018.
42

[13] Wayne D Newhauser and Rui Zhang. The physics of proton therapy.Physics in Medicine & Biology, 60(8):R155, 2015.
[14] Bernard Gottschalk. Physics of proton interactions in matter. Protontherapy physics. USA: Taylor & Francis Inc, pages 20–57, 2012.
[15] William R Leo. Techniques for nuclear and particle physics experiments: ahow-to approach. Springer Science & Business Media, 2012.
[16] Peter Sigmund, R Bimbot, H Geissel, H Paul, and A Schinner. Stoppingof ions heavier than helium. 2005.
[17] Devesh Kumar Avasthi and Girijesh Kumar Mehta. Swift heavy ions formaterials engineering and nanostructuring, volume 145. Springer Science& Business Media, 2011.
[18] DC Williams. The most likely path of an energetic charged particle througha uniform medium. Physics in Medicine & Biology, 49(13):2899, 2004.
[19] K Gunzert-Marx, H Iwase, D Schardt, and RS Simon. Secondary beamfragments produced by 200 mev u- 1 12c ions in water and their dose con-tributions in carbon ion radiotherapy. New journal of physics, 10(7):075003,2008.
[20] Solange Gagnebin, Damian Twerenbold, Eros Pedroni, David Meer, Sil-van Zenklusen, and Christian Bula. Experimental determination of theabsorbed dose to water in a scanned proton beam using a water calorime-ter and an ionization chamber. Nuclear Instruments and Methods inPhysics Research Section B: Beam Interactions with Materials and Atoms,268(5):524–528, 2010.
[21] Rebecca Antonia Grun. Impact of tissue specific parameters on the predi-tion of the biological effectiveness for treatment planning in ion beam ther-apy. 2014.
[22] James D Cox and Kie Kian Ang. Radiation Oncology E-Book: Rationale,Technique, Results. Elsevier Health Sciences, 2009.
[23] Seo Hyun Park and Jin Oh Kang. Basics of particle therapy i: physics.Radiation oncology journal, 29(3):135, 2011.
[24] Olga Sokol. Oxygen ions as a single and combined modality in radiotherapy.PhD thesis, Technische Universitat, 2018.
[25] International Commission on Radiation Units. Quantities and units inradiation protection dosimetry. Intl Commission on Radiation, 1993.
[26] William T Chu. Overview of light-ion beam therapy. 2006.
43
[27] Rui Zhang, Phillip J Taddei, Markus M Fitzek, and Wayne D Newhauser.Water equivalent thickness values of materials used in beams of protons,helium, carbon and iron ions. Physics in Medicine & Biology, 55(9):2481,2010.
[28] Helmuth Spieler. Semiconductor detector systems, volume 12. Oxford uni-versity press, 2005.
[29] Carlo Amato. Helium-beam radiography and spatial resolution improve-ment. 2017.
[30] Th Haberer, Jurgen Debus, H Eickhoff, Oliver Jakel, Daniela Schulz-Ertner,and Uli Weber. The heidelberg ion therapy center. Radiotherapy andOncology, 73:S186–S190, 2004.
[31] D Ondreka and U Weinrich. The heidelberg ion therapy (hit) accelera-tor coming into operation. In Proc. 11th European Particle AcceleratorConference (EPAC’08), pages 979–981, 2008.
[32] A Dolinskii, H Eickhoff, and B Franczak. The synchrotron of the dedicatedion beam facility for cancer therapy, proposed for the clinic in heidelberg’.In EPAC’00, Vienna, page 2509, 2000.
[33] M Kramer, O Jakel, T Haberer, E Rietzel, D Schardt, M Scholz, JF Wang,U Weber, and W Weyrather. Treatment planning for scanned ion beams.Radiotherapy and Oncology, 73:S80–S85, 2004.
[34] Christian Schomers, Eike Feldmeier, Michael Galonska, Stefan Scheloske,Andreas Peters, Thomas Haberer, and Rainer Cee. Reacceleration of ionbeams for particle therapy. 2014.
[35] Katia Parodi, Andrea Mairani, Stephan Brons, Bernd-Georg Hasch, FlorianSommerer, Jakob Naumann, Oliver Jakel, Thomas Haberer, and JurgenDebus. Monte carlo simulations to support start-up and treatment planningof scanned proton and carbon ion therapy at a synchrotron-based facility.Physics in Medicine & Biology, 57(12):3759, 2012.
[36] Xavier Llopart, Rafael Ballabriga, Michael Campbell, Lukas Tlustos, andWinnie Wong. Timepix, a 65k programmable pixel readout chip for arrivaltime, energy and/or photon counting measurements. Nuclear Instrumentsand Methods in Physics Research Section A: Accelerators, Spectrometers,Detectors and Associated Equipment, 581(1-2):485–494, 2007.
[37] M Martisıkova, T Gehrke, S Berke, G Arico, and O Jakel. Helium ion beamimaging for image guided ion radiotherapy. Radiation oncology, 13(1):109,2018.
[38] ADVACAM s.r.o. Timepix detector.http://www.widepix.cz/index.php?p=products, accessed December12, 2019.
44
[39] V Kraus, Michael Holik, Jan Jakubek, M Kroupa, P Soukup, and Z Vyky-dal. Fitpix—fast interface for timepix pixel detectors. Journal of Instru-mentation, 6(01):C01079, 2011.
[40] Bernadette Hartmann. A novel approach to ion spectroscopy of therapeuticion beams using a pixelated semiconductor detector. PhD thesis, 2013.
[41] Jan Jakubek. Energy-sensitive x-ray radiography and charge sharing ef-fect in pixelated detector. Nuclear Instruments and Methods in PhysicsResearch Section A: Accelerators, Spectrometers, Detectors and AssociatedEquipment, 607(1):192–195, 2009.
[42] RPM Van der Boog. Energy calibration procedure of a pixel detector. Bach-elor thesis of applied physics (B. Eng.), The Hague university of appliedsciences, 2013.
[43] Jan Jakubek. Precise energy calibration of pixel detector working in time-over-threshold mode. Nuclear Instruments and Methods in Physics Re-search Section A: Accelerators, Spectrometers, Detectors and AssociatedEquipment, 633:S262–S266, 2011.
[44] Bo Shi et al. Coherent X-ray scattering of charge order dynamics and phaseseparation in titanates. PhD thesis, Universiteit van Amsterdam, 2017.
[45] Catherine Knobloch. Wet calibration for helium beam radiography, bach-elor thesis. 2020.
[46] Tim Gehrke, L Burigo, Giulia Arico, S Berke, J Jakubek, D Turecek, T Tes-sonnier, A Mairani, and M Martisıkova. Energy deposition measurementsof single 1h, 4he and 12c ions of therapeutic energies in a silicon pixeldetector. Journal of Instrumentation, 12(04):P04025, 2017.
45
Biografija
Sonja Surla rodena je 08.04.1994. godine u No-vom Sadu. Zavrsila je osnovnu skolu
”Prva
Vojvodanska brigada“ sa Vukovom diplomomi gimnaziju
”Isidora Sekulic“ u Novom Sadu.
2018. godine zavrsila je osnovne akademske stu-dije fizike sa strucnim nazivom - Diplomiraniprofesor fizike, na Prirodno-Matematickom fa-kultetu u Novom Sadu. Iste godine je upisala imaster studije na Katedri za nuklearnu fiziku.Dobitnik je stipendije Ministarstva prosvete iERASMUS projekta. Deo master studija je pro-vela u Hajdelbergu u Nemackoj kao ucesnik pro-grama razmene studenata. U Nemackom cen-tru za istrazivanje raka (Deutsches Krebsforsc-hungszentrum) u Hajdelbergu je pisala masterrad. Eksperimentalni deo master rada je radilau Centru za terapiju ubrzanim jonima (Heidel-berger Ionenstrahl-Therapiezentrum, HIT).

UNIVERZITET U NOVOM SADU PRIRODNO-MATEMATIČKI FAKULTET
KLJUČNA DOKUMENTACIJSKA INFORMACIJA
Redni broj:
RBR
Identifikacioni broj:
IBR
Tip dokumentacije:
TD
Monografska dokumentacija
Tip zapisa:
TZ
Tekstualni štampani materijal
Vrsta rada:
VR
Master rad
Autor:
AU
Sonja Surla
Mentor:
MN
Prof. dr Jovana Nikolov, vanredni profesor
Naslov rada:
NR
Kvantitativna radiografija helijumskim snopom sa primenom na antropomorfni karlični fantom
Jezik publikacije:
JP
engleski
Jezik izvoda:
JI
srpski
Zemlja publikovanja:
ZP
Srbija
Uže geografsko područje:
UGP
Vojvodina
Godina:
GO
2020

Izdavač:
IZ
Autorski reprint
Mesto i adresa:
MA
Prirodno-matematički fakultet, Trg Dositeja Obradovića 4, Novi Sad
Fizički opis rada:
FO
5 poglavlja/45 strana/46 referenci/37 slika/6 tabeli
Naučna oblast:
NO
Fizika
Naučna disciplina:
ND
Nuklearna fizika
Predmetna odrednica/ ključne reči:
PO
UDK
Radioterapija, radiografija, ubrzani joni helijuma,
Čuva se:
ČU
Biblioteka departmana za fiziku, PMF-a u Novom Sadu
Važna napomena:
VN
nema
Izvod:
IZ
U radu su prikazani rezultati radiografije ubrzanim jonima, prvi put primenjene na antropomorfni karlični fantom. Cilj radiografije ubrzanim jonima je preciznije pozicioniranje ubrzanih jona za radioterapiju u okviru tumora.
Datum prihvatanja teme od NN veća:
DP 06.01.2020.
Datum odbrane:
DO 10.01.2020.
Članovi komisije:
KO
Predsednik: Prof dr Jovana Nikolov, vanredni profesor, PMF u Novom Sadu
član: Prof. dr Dušan Mrđa, redovni profesor, PMF u Novom Sadu
član: Prof. dr Maja Stojanović, redovni profesor, PMF u Novom Sadu

UNIVERSITY OF NOVI SAD
FACULTY OF SCIENCE AND MATHEMATICS
KEY WORDS DOCUMENTATION
Accession number:
ANO
Identification number:
INO
Document type:
DT
Monograph publication
Type of record:
TR
Textual printed material
Content code:
CC
Final paper
Author:
AU
Sonja Surla
Mentor/comentor:
MN
Prof. dr Jovana Nikolov, associate professor, Faculty of Sciences, Novi
Sad
Title:
TI
Quantitative helium-beam radiography of an anthropomorphic pelvis
phantom
Language of text:
LT
English
Language of abstract:
LA
English
Country of publication:
CP
Serbia
Locality of publication:
LP
Vojvodina

Publication year:
PY
2020
Publisher:
PU
Author's reprint
Publication place:
PP
Faculty of Science and Mathematics, Trg Dositeja Obradovića 4, Novi Sad
Physical description:
PD
5/182/32/0/71/0/3
Scientific field:
SF
Physics
Scientific discipline:
SD
Nuclear Physics
Subject/ Key words:
SKW
UC
Ion-beam Radiotherapy, Ion-beam Radiography, Helium-ion beam
Holding data:
HD
Library of Department of Physics, Trg Dositeja Obradovića 4
Note:
N
none
Abstract:
AB
The results of helium ion-beam radiography of an anthropomorphic pelvis
phantom are presented in this thesis. The aim of ion-beam radiography is
is the precise positioning of accelerated ions for radiotherapy inside the
tumor.
Accepted by the Scientific Board:
ASB
06.01.2020.
Defended on:
DE
10.01.2020.
Thesis defend board:
DB
President: Prof dr Jovana Nikolov, associate professor, Faculty of Sciences, Novi Sad

Member: Prof. dr Dušan Mrđa, full professor, Faculty of Sciences, Novi Sad
Member: Prof. dr Maja Stojanović, full professor, Faculty of Sciences, Novi Sad