KUMASI N UNITS REPORT...
13
KUMASI NEONATAL UNITS REPORT www.mci.ei.columbia.edu 2014 Trends and Observations 1/24/2014 In September 2000, the United Nations set eight Millennium Development Goals to be achieved by the year 2015. e fourth of the eight goals aims to reduce the child mortality rate by two-thirds. Globally, more than 40 percent of all nine million under-five deaths occur during the first 28 days of life, referred to as the neonatal period. (1) Interventions to improve neonatal health are therefore essential, if this goal is to be achieved. Introduction Admissions Source of Admissions Mortality Causes of Admission Low Birth-weight and Kangaroo Mother Care Performance Indicators Way Forward: Staffing and Operations Equipment and Supplies Infrastructure Conclusion Issue Date: January 24, 2014 1
Transcript of KUMASI N UNITS REPORT...
KUMASI NEONATAL UNITS REPORT www.mci.ei.columbia.edu 2014 Trends and Observations 1/24/2014
In September 2000, the United Nations set eight Millennium Development Goals to be achieved by the year 2015.
The fourth of the eight goals aims to reduce the child mortality rate by two-thirds. Globally, more than 40 percent of all nine
million under-five deaths occur during the first 28 days of life, referred to as the neonatal period.(1)
Interventions to improve neonatal health are therefore
essential, if this goal is to be achieved.
Introduction Admissions Source of Admissions Mortality Causes of Admission Low Birth-weight and Kangaroo Mother Care Performance Indicators Way Forward: Staffing and Operations Equipment and Supplies Infrastructure Conclusion
Issue Date: January 24, 2014
1
KUMASI NEONATAL UNITS REPORT www.mci.ei.columbia.edu 2014 Trends and Observations
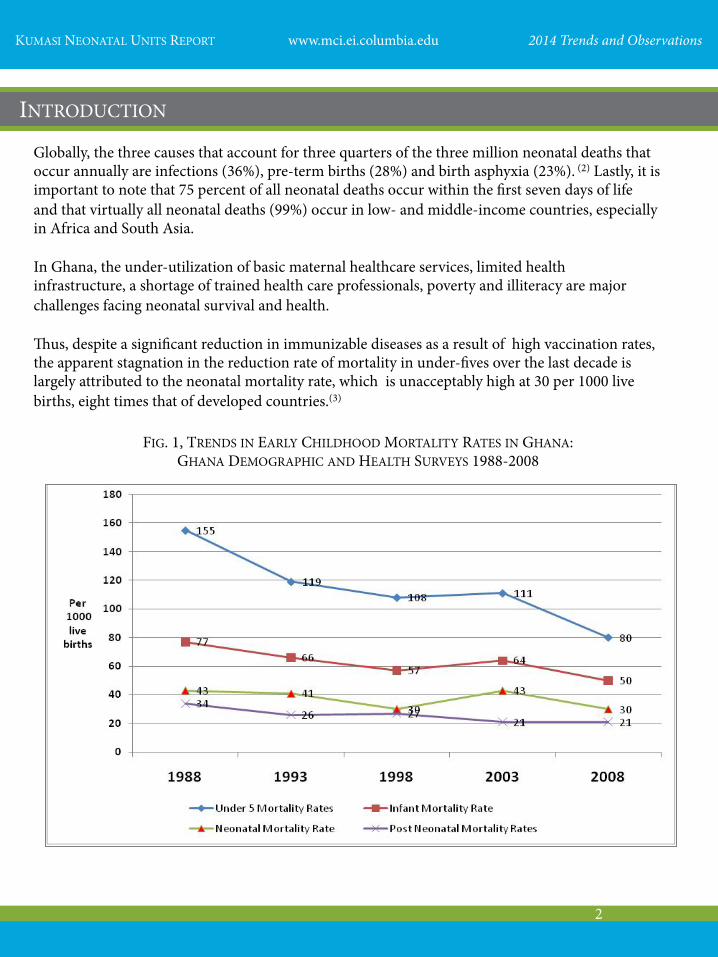
Globally, the three causes that account for three quarters of the three million neonatal deaths that occur annually are infections (36%), pre-term births (28%) and birth asphyxia (23%). (2) Lastly, it is important to note that 75 percent of all neonatal deaths occur within the first seven days of life and that virtually all neonatal deaths (99%) occur in low- and middle-income countries, especially in Africa and South Asia. In Ghana, the under-utilization of basic maternal healthcare services, limited health infrastructure, a shortage of trained health care professionals, poverty and illiteracy are major challenges facing neonatal survival and health. Thus, despite a significant reduction in immunizable diseases as a result of high vaccination rates, the apparent stagnation in the reduction rate of mortality in under-fives over the last decade is largely attributed to the neonatal mortality rate, which is unacceptably high at 30 per 1000 live births, eight times that of developed countries.(3)
INTRODUCTION
FIG. 1, TRENDS IN EARLY CHILDHOOD MORTALITY RATES IN GHANA: GHANA DEMOGRAPHIC AND HEALTH SURVEYS 1988-2008
2

KUMASI NEONATAL UNITS REPORT www.mci.ei.columbia.edu 2014 Trends and Observations
In the Ashanti region, the most populous region of Ghana, neonatal mortality rates in 2011 were 35 per 1000 live births, compared with 21 per 1000 live births in the Greater Accra region. The population base of the Ashanti region makes it a major determinant in many of the health indices of the nation; therefore, in the joint document prepared by the Ghana Health Service and UNICEF and presented at the 2012 Health Summit in Accra, the national average for important indices such as maternal and neonatal mortality were adversely affected by the dismal figures from the Ashanti region, which were higher than the national average. The Ashanti region has the Kumasi metropolis as its capital, which covers only 9.2 percent of the region, yet is home to 41 percent of the region’s population. The city has only one teaching hospital, the Komfo Anokye Teaching Hospital (KATH), which serves as the referral point for all newborns who have complications at birth and require neonatal care. This situation left much to be desired, as its Mother-Baby Unit (MBU), originally built for 50 babies, had no less than 150 babies admitted at any one time, with two to four neonates having to share cots and incubators, as seen below.
FIG. 2, SCENE AT THE HIGH DEPENDENCY UNIT OF KATH MOTHER-BABY UNIT
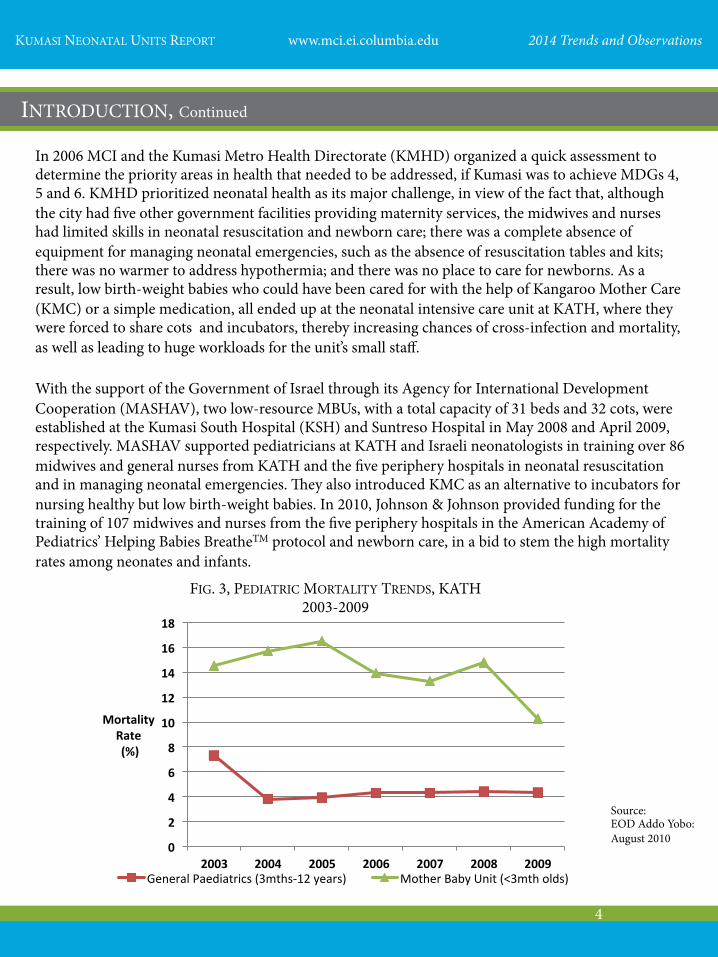
The mortality figures from the pediatric unit at KATH, as displayed in Fig. 3 on page 4, show the high rates of mortality in the KATH MBU as compared to the general pediatric wards. Between 2003-9, mortality rates ranged from a high of 145/1000 - 103/1000 admissions among babies under three months old, as compared to 73/1000 - 43/1000 admissions for children aged three months - 12 years. (4) In 2006 Kumasi was declared one of 11 Millennium Cities in Sub-Saharan African, chosen to be assisted by the Millennium Cities Initiatives (MCI), a project of the Earth Institute at Columbia University directed by Dr. Susan M. Blaustein, under the leadership of Earth Institute Director Jeffrey D. Sachs. MCI’s goal is to assist the selected cities in their efforts to achieve the Millennium Development Goals (MDGs).
Photo by: A.A. Boateng
INTRODUCTION, Continued
3
KUMASI NEONATAL UNITS REPORT www.mci.ei.columbia.edu 2014 Trends and Observations
In 2006 MCI and the Kumasi Metro Health Directorate (KMHD) organized a quick assessment to determine the priority areas in health that needed to be addressed, if Kumasi was to achieve MDGs 4, 5 and 6. KMHD prioritized neonatal health as its major challenge, in view of the fact that, although the city had five other government facilities providing maternity services, the midwives and nurses had limited skills in neonatal resuscitation and newborn care; there was a complete absence of equipment for managing neonatal emergencies, such as the absence of resuscitation tables and kits; there was no warmer to address hypothermia; and there was no place to care for newborns. As a result, low birth-weight babies who could have been cared for with the help of Kangaroo Mother Care (KMC) or a simple medication, all ended up at the neonatal intensive care unit at KATH, where they were forced to share cots and incubators, thereby increasing chances of cross-infection and mortality, as well as leading to huge workloads for the unit’s small staff. With the support of the Government of Israel through its Agency for International Development Cooperation (MASHAV), two low-resource MBUs, with a total capacity of 31 beds and 32 cots, were established at the Kumasi South Hospital (KSH) and Suntreso Hospital in May 2008 and April 2009, respectively. MASHAV supported pediatricians at KATH and Israeli neonatologists in training over 86 midwives and general nurses from KATH and the five periphery hospitals in neonatal resuscitation and in managing neonatal emergencies. They also introduced KMC as an alternative to incubators for nursing healthy but low birth-weight babies. In 2010, Johnson & Johnson provided funding for the training of 107 midwives and nurses from the five periphery hospitals in the American Academy of Pediatrics’ Helping Babies BreatheTM protocol and newborn care, in a bid to stem the high mortality rates among neonates and infants.
0
2
4
6
8
10
12
14
16
18
2003 2004 2005 2006 2007 2008 2009
Mortality Rate (%)
General Paediatrics (3mths-‐12 years) Mother Baby Unit (<3mth olds)
INTRODUCTION, Continued
Source: EOD Addo Yobo: August 2010
FIG. 3, PEDIATRIC MORTALITY TRENDS, KATH 2003-2009
4

KUMASI NEONATAL UNITS REPORT www.mci.ei.columbia.edu 2014 Trends and Observations
The report below summarizes the trends in the two MBUs from 2010-13 for admitted babies aged 0-90 days old. A total of 5,295 babies were admitted over the period, with 2,323 (43.9%) and 2,972 (56.1%) babies coming from KSH and Suntreso MBUs, respectively. There is no significant difference in the proportions admitted by gender, as males account for 53.6 percent, whilst females account for 46.4 percent. Overall, admissions in the two MBUs increased steadily over the last two years, after a drop in 2011. The KSH MBU recorded the greatest and the most significant increase in admissions over the period.
0
200
400
600
800
1000
1200
1400
1600
2010 2011 2012 2013
# of babies
KSH
SH
Total
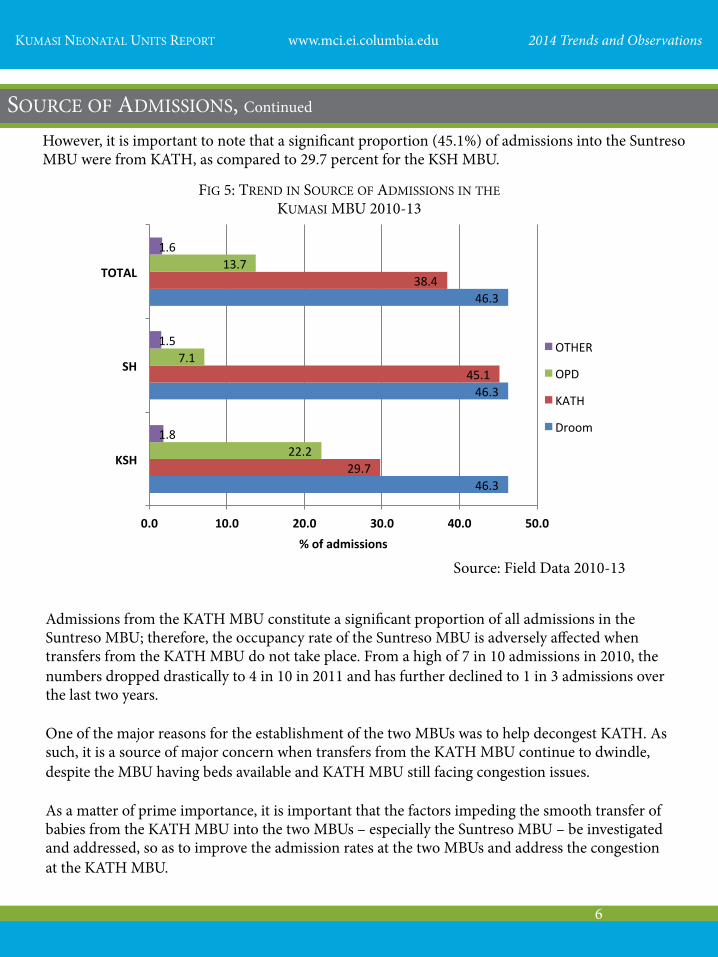
Babies admitted in the two MBUs come from the following sources: the KATH MBU, the facility’s own delivery room (DRoom), the facility’s outpatients department (OPD) and other maternity facilities (Other) in the catchment area. Fig. 5 on page 6 shows that, over the four-year period, 46.3 percent of all admissions were from the delivery rooms of the facilities, while admissions from the KATH MBU accounted for 38.4 percent.
ADMISSIONS
FIG. 4, TRENDS OF ADMISSIONS IN KUMASI MBU FROM 2010-2013
Source: Field Data, 2010 - 2013
SOURCE OF ADMISSIONS
5
KUMASI NEONATAL UNITS REPORT www.mci.ei.columbia.edu 2014 Trends and Observations
However, it is important to note that a significant proportion (45.1%) of admissions into the Suntreso MBU were from KATH, as compared to 29.7 percent for the KSH MBU.
46.3
46.3
46.3
29.7
45.1
38.4
22.2
7.1
13.7
1.8
1.5
1.6
0.0 10.0 20.0 30.0 40.0 50.0
KSH
SH
TOTAL
% of admissions
OTHER
OPD
KATH
Droom
Admissions from the KATH MBU constitute a significant proportion of all admissions in the Suntreso MBU; therefore, the occupancy rate of the Suntreso MBU is adversely affected when transfers from the KATH MBU do not take place. From a high of 7 in 10 admissions in 2010, the numbers dropped drastically to 4 in 10 in 2011 and has further declined to 1 in 3 admissions over the last two years. One of the major reasons for the establishment of the two MBUs was to help decongest KATH. As such, it is a source of major concern when transfers from the KATH MBU continue to dwindle, despite the MBU having beds available and KATH MBU still facing congestion issues. As a matter of prime importance, it is important that the factors impeding the smooth transfer of babies from the KATH MBU into the two MBUs – especially the Suntreso MBU – be investigated and addressed, so as to improve the admission rates at the two MBUs and address the congestion at the KATH MBU.
FIG 5: TREND IN SOURCE OF ADMISSIONS IN THE KUMASI MBU 2010-13
Source: Field Data 2010-13
SOURCE OF ADMISSIONS, Continued
6

KUMASI NEONATAL UNITS REPORT www.mci.ei.columbia.edu 2014 Trends and Observations
One significant point is that the two MBUs have had very low mortality rates since their establishment in 2009. Mortality rates at both MBUs had, until 2013, been less than four per 1000 admissions. However, this changed significantly in 2013, as KSH recorded a mortality rate of 28.6/1000 admissions, an unacceptably high record for the highest ever admission of 735 babies in that facility, as compared to 2.6/1000 admissions in Suntreso, for 759 admissions.
0.0
5.0
10.0
15.0
20.0
25.0
30.0
2010 2011 2012 2013
rate/1000 admits
KSH
SH
Total
FIG 6: MORTALITY TRENDS IN THE KUMASI MBU 2010-13
Sepsis 40%
Jaundice 15%
LBW 22%
Asphyxia 11%
Other 12%
The major illnesses accounting for over 85 percent of admissions into the two MBUs in descending order are as follows: neonatal sepsis (39.8%), low birth-weight (mostly as a result of pre-term births – 22.5%), neonatal jaundice (14.8%) and asphyxia (10.5%). Notable among the other causes constituting the remaining 12.4 percent include big babies with birth weights over 4kg, bronchopneumonia, exposure to HIV and Hepatitis B, and congenital malformation.
MORTALITY
Source: Field Data 2010-13
CAUSES OF ADMISSION
Source: Field Data 2010-13
FIG.7: CAUSES OF ADMISSIONS IN MBU 2010-13
7

KUMASI NEONATAL UNITS REPORT www.mci.ei.columbia.edu 2014 Trends and Observations
An analysis of the trend in the two facilities over the period under review, as shown in Fig. 8 below, indicates a significant drop in the numbers of babies admitted with sepsis, while the numbers of those admitted with low birth-weights, asphyxia and other causes showed a significant increase between 2012-13.
0
50
100
150
200
250
300
350
400
Sepsis Jaundice LBW Asphyxia Other
# of babies
FIG 8: TRENDS IN CAUSES OF ADMISSION 2010-2013
2010
2011
2012
2013
A further disaggregation of the data for the two facilities shows that, with the exception of asphyxia and low birth-weight rates, all other rates are quite similar. The significant increase in the proportion of admissions presenting with asphyxia is a matter of grave concern and needs to be addressed immediately, especially as all of these babies were delivered within the facility.
0
5
10
15
20
2010 2011 2012
2013
% of b
abies
FIG.9: ASPHYXIA AS CAUSE OF ADMISSION 2010-2013
KSH SH
Source: Field Data 2010 - 2013
CAUSES OF ADMISSION, Continued
Source: Field Data 2010-13
8

KUMASI NEONATAL UNITS REPORT www.mci.ei.columbia.edu 2014 Trends and Observations
One of the major innovations characteristic of the two MBUs is the use of maternal body heat through continuous skin-to-skin contact to nurse low birth-weight babies in the absence of a mechanical incubator. The significant drop in the low birth-weight rate in the Suntreso unit in 2011 is due to the reduction of admissions received from KATH that year.
27
29
31
33
35
37
39
2010 2011 2012 2013
% of babies
FIG 10: TRENDS IN LOW BIRTH-WEIGHT ADMISSIONS IN MBUS 2010-13
KSH
SH
However, both facilities show a significant rise in rates of babies with low birth-weights in 2011, with a slight dip between 2012-13. This increase should have reflected an increase in rates for Kangaroo Mother Care (KMC), yet a significant drop in KMC rates are observed as shown in Fig. 11.
60
65
70
75
80
85
90
95
100
2010 2011 2012 2013
# of babies
FIG.11: KMC TRENDS IN MBU 2010-13
KSH
SH
Source: Field Data 2010-13
Source: Field Data 2010-13
LOW BIRTH WEIGHT AND KANGAROO MOTHER CARE
9
KUMASI NEONATAL UNITS REPORT www.mci.ei.columbia.edu 2014 Trends and Observations
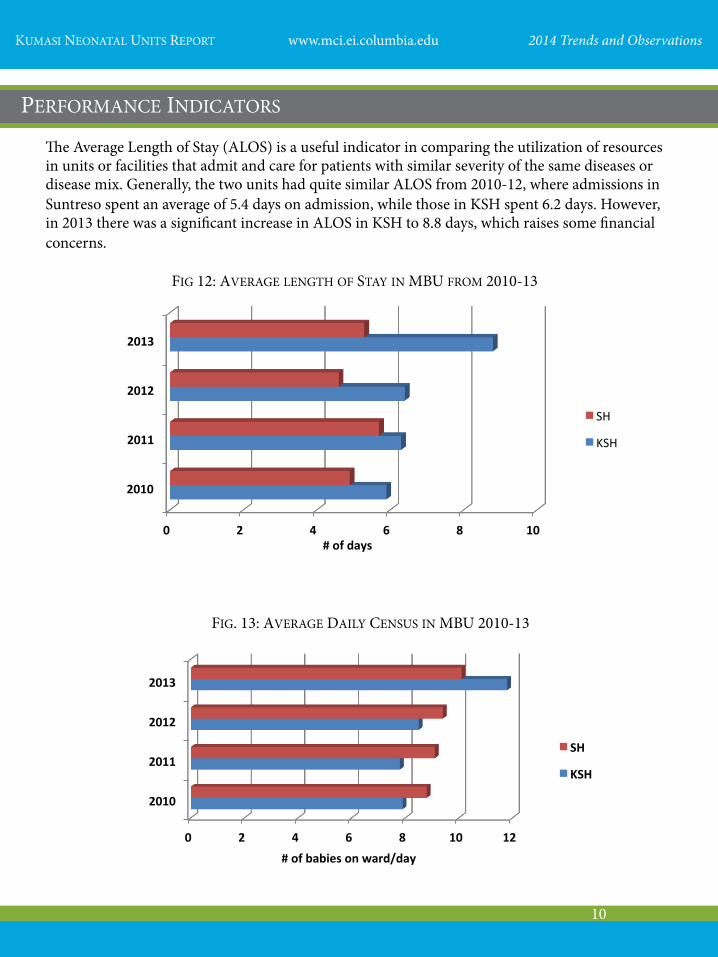
The Average Length of Stay (ALOS) is a useful indicator in comparing the utilization of resources in units or facilities that admit and care for patients with similar severity of the same diseases or disease mix. Generally, the two units had quite similar ALOS from 2010-12, where admissions in Suntreso spent an average of 5.4 days on admission, while those in KSH spent 6.2 days. However, in 2013 there was a significant increase in ALOS in KSH to 8.8 days, which raises some financial concerns.
0 2 4 6 8 10
2010
2011
2012
2013
# of days
FIG 12: AVERAGE LENGTH OF STAY IN MBU FROM 2010-13
SH
KSH
0 2 4 6 8 10 12
2010
2011
2012
2013
# of babies on ward/day
FIG. 13: AVERAGE DAILY CENSUS IN MBU 2010-13
SH
KSH
PERFORMANCE INDICATORS
10

KUMASI NEONATAL UNITS REPORT www.mci.ei.columbia.edu 2014 Trends and Observations
The upside of patients spending many days on the ward is that an increased length of stay, coupled with an increase in the number of admissions, ultimately increases occupancy rates. It is noteworthy that even though the Suntreso unit admitted 759 babies compared with 735 babies admitted by the KSH unit, the occupancy rate for KSH was 78.5 percent, while Suntreso’s occupancy rate was 63 percent.
0 20 40 60 80
2010
2011
2012
2013
% occupancy
FIG.14: OCCUPANCY TRENDS IN MBU FROM 2010-13
SH
KSH
The gradual increase in occupancy for the two units over the period from 53.8 percent in 2010 to 70 percent in 2013 is quite commendable, especially for the KSH unit, which saw an unprecedented increase in the rate in 2013. However, this is still below the standard of 90 percent occupancy, which has been the goal.
40
45
50
55
60
65
70
75
2010 2011 2012 2013
FIG. 15, TRENDS IN OCCUPANCY RATE 2010-13
Source: Field Data 2010-13
Source: Field Data 2010-13
PERFORMANCE INDICATORS, Continued
11

KUMASI NEONATAL UNITS REPORT www.mci.ei.columbia.edu 2014 Trends and Observations
1. The staffing at both MBUs continues to be an issue of great concern. Both MBUs have a pediatrician each, with two physician assistants (PAs) at Suntreso and one at KSH providing medical cover. This is grossly insufficient, considering the change in the profile of cases currently being admitted in both facilities, which range from healthy low birth-weight babies to moderately sick babies who need 24-hour medical coverage. The pediatricians also conduct daily OPD consultations.
2. There is an urgent need for a second pediatrician to be posted to the two facilities to ensure that sick babies
have adequate medical coverage and that more sick babies can be admitted to improve occupancy rates of the units, thus ensuring their financial viability.
3. It is also important that more PAs undergo the six-month training in neonatal care to provide adequate and appropriate care to neonates wherever they end up practicing. Ghana Health Service would need to provide the necessary recognition for such trained personnel to encourage more PAs to undertake the much-needed training.
4. The number of nursing staff needs to be increased. Being mindful of the shortage of nurses in the system, especially those with the requisite training for nursing neonates, it is incumbent on the nurse managers of the two units to maintain MBU nurses who have been trained on the job over the last four years at the unit and not to include them in the general rotations. If such nurses have to be rotated, then ideally it should be across the two units, rather than moving one from the MBU to an injection room or other such area within the same facility.
5. The review of deaths that occurred in the MBU and the high rates of birth asphyxia indicate the need for regular systematic training in neonatal resuscitation and newborn care for all nursing staff in the MBU and all practicing midwives in the facilities, especially those at the labour and lying-in wards.
6. There is an urgent need to review the criteria for discharging newborns in the facilities’ lying-in wards, to avoid newborns reporting back to the MBU within three days with sepsis and jaundice.
7. It is recommended that quality assurance meetings are held to discuss issues hindering efficiency and affecting neonatal morbidity and mortality. These meetings should be attended by pediatricians, obstetricians and unit heads of the antenatal, labor/lying-in wards and the MBUs.
8. There is the need to maximize the use of the MBUs. It is therefore recommended that the facilities publicize the operations of the MBUs through the local FM radio stations and at meetings with the other maternity facilities in the catchment areas.
9. The facilities, especially Suntreso, need to dialogue with KATH to address any factors hindering the transfer of cases from the KATH MBU to the one at Suntreso, as this is adversely affecting the occupancy rate of the Suntreso MBU.
WAY FORWARD: STAFFING AND OPERATIONS
12

KUMASI NEONATAL UNITS REPORT www.mci.ei.columbia.edu 2014 Trends and Observations
1. The units need to have a comprehensive plan for the maintenance of their equipment to prolong
their life span and offset a situation where certain pieces of equipment, especially the phototherapy units, are unusable for long periods of time, thereby rendering the referral of patients requiring phototherapy to the already congested MBU at KATH.
2. Hospital management needs to plan and for the replacement of the equipment within the coming
years. As a matter of urgency, there is the need to acquire a bilirubinometer for the KSH unit. Suntreso has been fortunate to have access to one donated by an MCI partner.
3. Both units require a small (2-4kg) mobile oxygen unit to help in the safe transfer of patients who
need it when being transported to KATH. 1. Plans for the preventive maintenance of the structures have to be put in place to avoid the
unplanned nature of works that takes place when issues arise. It has been noted that some of the initial plumbing fixtures and door handles were not wholly suitable for our environment. However, there is a need to replace all of the broken door and locker handles, toilet seats and damaged walls needing repair.
The work at the MBU saw improvements in utilization rates over the period under review, despite an increasing mortality rate seen in the last year. It is hoped that with the resolution of the identified issues as outlined under the way forward, Kumasi should be able to make a significant mark in improving neonatal health and reducing mortality in under fives.
EQUIPMENT AND SUPPLIES
INFRASTRUCTURE
CONCLUSION
13
FIG. 16, MOTHERS WHO PARTICIPATED IN THE JOHNSON & JOHNSON-SPONSORED PILOT PROGRAM IN HBB AND NEWBORN CARE, WITH THEIR HEALTHY NEWBORNS