Kumasi Education Needs Assessment - Columbia University
34
432 Park Avenue South, 13 th Floor, New York, NY, 10016, United States Phone: +1-646-884-7422/7418; Fax: +1-212-548-5720 Website: www.earth.columbia.edu/mci . MCI SOCIAL SECTOR WORKING PAPER SERIES N o 13/2010 EDUCATION NEEDS ASSESSMENT FOR THE CITY OF KUMASI, GHANA Prepared by: Moumié Maoulidi, PhD and Haruna Ibrahim June 2010
Transcript of Kumasi Education Needs Assessment - Columbia University

432 Park Avenue South, 13th Floor, New York, NY, 10016, United States Phone: +1-646-884-7422/7418; Fax: +1-212-548-5720
Website: www.earth.columbia.edu/mci.
MCI SOCIAL SECTOR WORKING PAPER SERIES No 13/2010
EDUCATION NEEDS ASSESSMENT FOR THE CITY OF KUMASI, GHANA
Prepared by:
Moumié Maoulidi, PhD and Haruna Ibrahim
June 2010

2
NB: This needs assessment was researched and written by MCI Social Sector Research Manager Dr. Moumié Maoulidi and Mr. Haruna Ibrahim of the Kumasi Metro Education Directorate . It was edited by MCI Co-Director Dr. Susan M. Blaustein. MCI intern Shulie Eisen assisted with the editing.

3
Figure 1. Map of Ghana Showing Kumasi Metropolitan Area
Source: UN-HABITAT (2009)

4
ACKNOWLEDGEMENTS The Millennium Cities Initiative would like to thank the following people and institutions that helped to make this project possible. Kumasi Metropolitan Authority The Honorable Mayor Samuel Sarpong Ghana Ministry of Education Thomas H. Coleman, Coordinator, EMIS Kumasi Metropolitan Education Office Mr. Haruna Ibrahim Mr. Osei Ampomah Baah Mrs. Grace Abankroh Kwame Nkrumah University of Science and Technology (KNUST) Ibrahim Kubau, Director, Academic Affairs MCI, Kumasi Ms. Abenaa Akuamoa-Boateng, MCI Project Manager for Ghana MCI, New York Dr. Susan M. Blaustein, Co-Director, Millennium Cities Initiative Ms. Shulie Eisen, MCI Intern

5
TABLE OF CONTENTS ACKNOWLEDGEMENTS.........................................................................................................4
TABLE OF CONTENTS ............................................................................................................5
LIST OF FIGURES ....................................................................................................................6
LIST OF TABLES ......................................................................................................................6
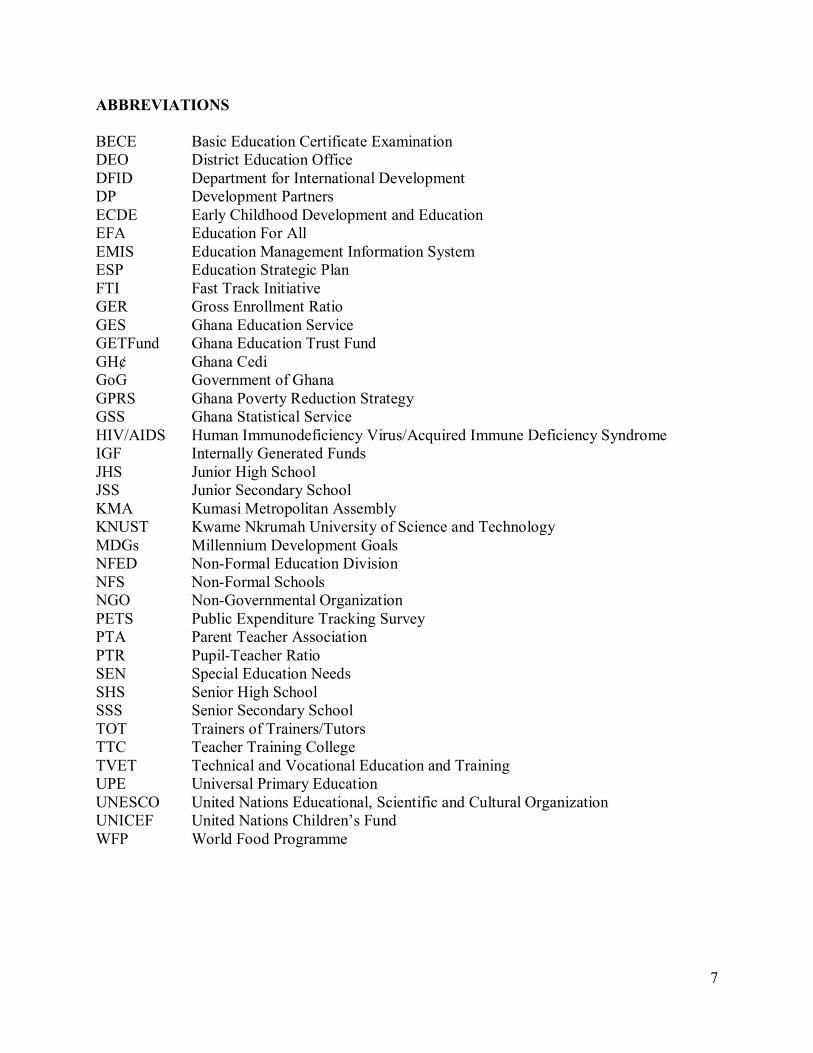
ABBREVIATIONS ....................................................................................................................7
EXECUTIVE SUMMARY .........................................................................................................8
I. INTRODUCTION ................................................................................................................. 10
1.1. Background .................................................................................................................... 10
1.2. Objectives ...................................................................................................................... 10
1.3. Methodology .................................................................................................................. 10
1.4. Limitations ..................................................................................................................... 10
1.5. Spatial Distribution and Demographics ........................................................................... 11
1.6. The Provision of Education in Ghana and Kumasi .......................................................... 13
II. PERSPECTIVES ON EDUCATION SUB-SECTORS ......................................................... 14
2.1. Pre-Primary Education.................................................................................................... 14
2.2. Primary Education .......................................................................................................... 17
2.3. Junior High School Education ........................................................................................ 20
2.4. Senior High School Education ........................................................................................ 22
2.5. Tertiary Education .......................................................................................................... 23
2.6. Non-Formal Education and Special Education ................................................................ 24
2.6. Adult Literacy ................................................................................................................ 25
III. FINACING EDUCATION IN KUMASI ............................................................................. 25
3.1. The Model ...................................................................................................................... 27
3.2. Results of the EPSSim Model ......................................................................................... 29
CONCLUSION ......................................................................................................................... 31
REFERENCES ......................................................................................................................... 33

6
LIST OF FIGURES Figure 1. Map of Ghana Showing Kumasi Metropolitan Area .....................................................3 Figure 2. Pre-Primary and Primary Schools in Kumasi ................................................................9 Figure 3. Map of Kumasi showing Sub-Metropolitan Areas ...................................................... 11 Figure 4. Trends in Kindergarten School Enrollments (2001-2008) ........................................... 15 Figure 5. Number of Kindergarten Schools by Type (2001-2008).............................................. 15 Figure 6. Number of Pre-Primary Teachers and their Qualifications, by Gender (2001-2008) .... 16 Figure 7. Trends in Primary School Enrollment (2002-2008)..................................................... 18 Figure 8. Number of Primary Schools by Type (2001-2008)...................................................... 19 Figure 9. Number of Teachers and their Qualifications by Gender (2001-2008) ........................ 20 Figure 10. Trends in Junior High School Enrollment (2002-2008) ............................................. 21 Figure 11. Number of Junior High Schools by Type (2001-2008) .............................................. 21 Figure 12. Number of Teachers and their Qualifications by Gender (2001-2008)....................... 22 Figure 13. Trends in Public Senior High School Enrollment (2006-2008).................................. 22 Figure 14. Number of Teachers and their Qualifications by Gender (2006-2008)....................... 23 LIST OF TABLES Table 1. Kumasi Population by Gender and Age Group, 2000, 2008, 2015 ................................ 12 Table 2. Distribution of Education Institutions in Kumasi by Education Level, 2008 ................. 14 Table 3. Select Indicators for Measuring Progress Towards Attaining MDG 2 and MDG 3 ....... 18 Table 4. Major Donors Financing Education in Ghana .............................................................. 26 Table 5. Expenditures on Education in Kumasi Metropolis 2007 and 2008 ................................ 27 Table 6. List of Key Targets for the Education Sector ............................................................... 28 Table 7. Results from the EPSSim model .................................................................................. 29
7
ABBREVIATIONS BECE Basic Education Certificate Examination DEO District Education Office DFID Department for International Development DP Development Partners ECDE Early Childhood Development and Education EFA Education For All EMIS Education Management Information System ESP Education Strategic Plan FTI Fast Track Initiative GER Gross Enrollment Ratio GES Ghana Education Service GETFund Ghana Education Trust Fund GH¢ Ghana Cedi GoG Government of Ghana GPRS Ghana Poverty Reduction Strategy GSS Ghana Statistical Service HIV/AIDS Human Immunodeficiency Virus/Acquired Immune Deficiency Syndrome IGF Internally Generated Funds JHS Junior High School JSS Junior Secondary School KMA Kumasi Metropolitan Assembly KNUST Kwame Nkrumah University of Science and Technology MDGs Millennium Development Goals NFED Non-Formal Education Division NFS Non-Formal Schools NGO Non-Governmental Organization PETS Public Expenditure Tracking Survey PTA Parent Teacher Association PTR Pupil-Teacher Ratio SEN Special Education Needs SHS Senior High School SSS Senior Secondary School TOT Trainers of Trainers/Tutors TTC Teacher Training College TVET Technical and Vocational Education and Training UPE Universal Primary Education UNESCO United Nations Educational, Scientific and Cultural Organization UNICEF United Nations Children’s Fund WFP World Food Programme

8
EXECUTIVE SUMMARY Education is fundamental to the attainment of the Millennium Development Goals (MDGs) and national development because it is necessary both for the improvement of living standards and for economic and technological advancement. The MDGs relating to education are MDG 2, the purpose of which is to achieve universal primary education (UPE), and MDG 3, which aims to eliminate gender disparity at all education levels by 2015. This needs assessment presents the financial, human resources and infrastructure requirements needed to provide universal primary education to all children in the city of Kumasi, Ghana. It also addresses some of the challenges facing pre-primary, primary, secondary and tertiary institutions, as well as the informal education sector. The latest available data show that, in terms of primary school enrollment and completion, Kumasi is doing relatively well. Gross enrollment rates (GER) improved from 71 to 85 percent between 2001 and 2008. Primary school completion rates (PCR) are also improving. In 2008/09, 84 percent of students completed primary school, as compared to a national average of 78 percent. Yet, while gender parity has almost been attained in terms of enrollment, there is still a gap in terms of completion, with 87 percent of boys completing the primary school cycle in 2008 as against 81 percent for girls. Moreover, while enrollment and completion rates have increased, education quality, particularly teacher quality, remains a key concern. In 2008, the pupil-teacher ratio in public schools (39:1) was below the continental average (45:1); therefore, there are enough primary school teachers, as long as current numbers are maintained. However, almost a quarter of male public school teachers were untrained, and four-fifths of the private school teachers were untrained. At the pre-primary school level, the number of untrained teachers is much higher. Teacher training workshops for pre-primary school teachers need to be scaled-up. To improve education quality in pre-primary and primary institutions, school desks, learning and instructional materials, library tables and chairs are also needed. At the junior high school level, the quality of education does not appear to be a major issue. For example in 2008, 78 percent of pupils passed the Basic Education Certificate Examination (BECE), which students take at the end of the junior high school cycle. However, the pupil teacher ratio is extremely low, indicating a teacher surplus. At the senior high school level, the gender gap is substantial, and there is a need to provide subsidies to disadvantaged pupils, especially girls, so that they, too, can attend high school. Given these strengths and vulnerabilities, MCI estimates that with an annual per capita investment of $19 between 2010 and 2015, Kumasi can achieve the MDGs in education. This report is divided into four sections. The first section introduces the city and presents an overview of education in Kumasi. The second section identifies some of the priority problems facing different educational institutions in the city and discusses issues that may interfere with the attainment of MDGs 2 and 3. The third section focuses on the financing of education and presents findings from a spreadsheet-based simulation model that projects budgetary as well as human resources and infrastructure needs. The final section offers MCI’s conclusions and recommendations.

9
Figure 2. Distribution of Education Institutions in Kumasi

10
I. INTRODUCTION 1.1. Background A cosmopolitan city, Kumasi is Ghana’s second largest city and the capital of its central Ashanti region. Kumasi is also the center of the country’s Asante1
culture and a major commercial hub that attracts people from all over Ghana and such neighboring African countries as Burkina Faso, Ivory Coast, Mali, Nigeria and Togo. The city’s Kumasi Central Market is one of the largest open-air markets in West Africa. The city is an important educational center, boasting 649 public pre-primary, primary and junior high schools, two top public universities, one of the nation’s premiere medical schools and a polytechnic. There are also about 1,500 private educational institutions.
1.2. Objectives This needs assessment addresses the educational challenges facing the city of Kumasi in its efforts to achieve universal primary education and eliminate gender disparities in education by 2015. In addition, it identifies interventions that can improve access to primary education and reduce gender disparities and the costs to attain the education MDGs. 1.3. Methodology The research methodology consisted of collecting and analyzing administrative education data. The data collected covers all education levels in Kumasi: pre- primary (crèche/nursery, kindergarten), primary, junior secondary, senior high, non-formal schools and higher educational institutions. Most data were obtained from the Education Management Information System (EMIS) Office in the Ministry of Education (MoE). 2
Additional data were provided by the Kumasi Metropolitan Education Directorate (KMED). Preliminary research was conducted by KMED staff; secondary sources were also consulted.
1.4. Limitations The data from the EMIS Office in the MoE did not always reconcile with data from the Kumasi Metropolitan Education Directorate.3
MoE recognizes this problem in its 2008 Education Sector Performance report, observing there that problems with education data reporting in Ghana include “unreliable population projections (and) lack of a complete list of schools (public and private)” (MoESS, 2009). To maintain consistency, this needs assessment mostly uses data provided by the Kumasi Metro Education Directorate.
1 The Asante people are the major ethnic group in Ashanti region. The city of Kumasi was founded in the 1680s by King Osei Tutu I to serve as the capital of the Asante State. The term “Asante” refers to the people and their culture, while the term Ashanti refers to the land they occupy. 2 Before 2009, the Ministry of Education (MoE) was called the Ministry of Education, Science and Sports (MoESS). 3 For instance, EMIS shows that the number of public primary schools in 2008 was 247 but KMED records show that the number of schools was 226, a discrepancy of 21 schools. Population and enrollment figures and data on teachers provided by the KMED also did not match EMIS data.

11
1.5. Spatial Distribution and Demographics The metropolitan area of Kumasi covers 254 square kilometers and is made up of 10 sub-metropolitan areas: Asawasi, Asokwa, Bantama, Kwadaso, Manhyia, Nhyiaeso, Oforikrom, Suame, Subin, and Tafo.4
The city’s unique location—it borders Kwabre East District to the north, Atwima District to the west, Ejisu-Juaben Municipal to the east and Bosomtwe to the south—makes it easily accessible to many migrants and sojourners. All major roads converge at the city center.
Figure 3. Map of Kumasi showing Sub-Metropolitan Areas
4 See Figure 2.

12
Kumasi metropolis is the most populous district in the Ashanti region. As of the 2000 census, Kumasi had a population of 1,170,270. MCI projects that the 2010 population is 1,634,899.5
However, the city’s daytime population rises to more than two million, given the many hundreds who travel to the city each day for work and then return to their homes often far away, at night.
Table 1. Kumasi Population by Gender and Age Group, 2000, 2008, 2015
Male Female Total Male Female Total Male Female Total0-4 77,542 76,858 154,400 101,321 100,428 201,749 128,040 126,910 254,950 5-9 71,659 73,296 144,955 93,634 95,773 189,408 118,325 121,029 239,354 10-14 62,207 71,321 133,528 81,284 93,193 174,476 102,718 117,767 220,485 15-19 61,664 70,681 132,345 80,574 92,356 172,930 101,821 116,711 218,532 20-24 63,285 63,851 127,136 82,692 83,432 166,124 104,498 105,433 209,931 25-29 53,445 55,087 108,532 69,835 71,980 141,815 88,250 90,961 179,211 30-34 40,815 41,815 82,630 53,332 54,638 107,970 67,395 69,046 136,441 35-39 31,351 33,265 64,616 40,965 43,466 84,431 51,768 54,928 106,696 40-44 26,681 25,538 52,219 34,863 33,370 68,233 44,056 42,169 86,226 45-49 22,262 17,756 40,018 29,089 23,201 52,290 36,760 29,319 66,079 50-54 15,426 13,942 29,368 20,157 18,218 38,374 25,472 23,021 48,493 55-59 12,016 8,716 20,732 15,701 11,389 27,090 19,841 14,392 34,233 60-64 10,232 8,236 18,468 13,370 10,762 24,131 16,895 13,600 30,495 65+ 38,427 22,896 61,323 50,211 29,917 80,129 63,452 37,807 101,258 Total 587,012 583,258 1,170,270 767,028 762,122 1,529,150 969,292 963,093 1,932,385
Kumasi Metropolis Population, by Sex and Age Group2000 2008 2015
Source: Ghana Statistical Service and MCI Based on these population projections, MCI estimates that of the total school-age population (ages 3-18), 19 percent is pre-primary school age (under 6), 39 percent is primary school age (6-11), and 42 percent is secondary school age (12-17). Data on poverty in Kumasi is not readily available. Devas and Korboe (2000) observe that this is partly because living standards surveys divide Ghana into three groups—Accra, other urban areas and rural—and although the poverty figure for “other urban areas” provides an indication of poverty in Kumasi, it does not identify poverty levels in Kumasi. The authors propose that it is more convenient to define poverty in Kumasi by occupation—the poor tend to be unemployed, unskilled laborers and petty traders, hawkers, porters, single mothers, the elderly, street children and refugees from outside Ghana. Kumasi Metropolitan Assembly (KMA) documents also do not provide poverty prevalence data, noting merely that poverty levels are high in the metropolis, particularly in peri-urban and slum communities (GoG and KMA, 2005). Child labor is also endemic. Due to poverty, the “opportunity cost” of children’s time is high, which helps to explain the relatively low primary school enrollment rates in the poor communities.6
5 MCI’s population projections are based on the 2000 census and rely on an exponential growth function and a growth rate of 3.34 percent. Using this growth rate, the MCI population projection for 2007 (1,478,869) is the same as that in Kumasi Metropolitan Assembly’s Health Directorate Annual Report. However, other Kumasi Metropolitan Assembly documents, such as the “Development Plan for Kumasi Metropolitan Area (2006-2009),” use a different population growth rate (5.4 percent) and show divergent population figures.
The 2000 census showed that between 5.5 and 16.4 percent of children aged 7-14
6 “Opportunity costs” refers to the income that a student forgoes by going to school as opposed to earning income.

13
worked at least one day within the seven days prior to the census. In 2007, the International Labour Organization's (ILO) International Programme on the Elimination of Child Labour (IPEC) identified Kumasi as a major transit point in the trafficking of child labor.7
This threatens the attainment of MDG 2 because child labor reduces school participation and adversely affects school outcomes by limiting time spent by children on homework.
1.6. The Provision of Education in Ghana and Kumasi
Basic education is compulsory in Ghana and consists of two years of pre-primary school, six years of primary school and three years of junior high school (JHS). This system prepares students to sit for the Basic Education Certificate Examination (BECE) at the end of the third year in JHS. After completing the basic education cycle, students may attend a senior high school (SHS) or enroll in a technical and vocational training (TVET) institution.
During the late 1980s and early 1990s, Ghana introduced decentralization. The local government law PNDCL 207 of 1988 established district assemblies (called metropolitan or municipal assemblies in the main urban centers), and lower levels of local government. Although Kumasi is generally referred to as a district, its boundaries relate to the urban area, and the elected assembly is known as the Kumasi Metropolitan Assembly (KMA). As a result of the decentralization, education in cities like Kumasi is the responsibility of the district education directorates. The relationship between the MoE and the Kumasi Metropolitan Education Directorate is straightforward. The MoE is in charge of policy and direction and provide logistical support, learning materials, school infrastructure and teacher salaries. Actual implementation is carried out by the Ghana Education Service (GES),8
which is represented at the local level by the District Education Directorates such as the Kumasi Metropolitan Education Directorate. The responsibility for school infrastructure and the supervision of “basic” (primary and junior high) schools lies with local governments such as the KMA. Each school in the district has a school management committee.
The MoE has several divisions and units. For instance, the Basic Education Division (BED) is responsible for primary schooling and junior high schools. The ministry has also established a Girls’ Education Unit (GEU) within BED, with a mandate to address issues related to ensuring that girls go to school, remain in school and continue schooling at higher levels. Non-formal education is the responsibility of the Non-Formal Education Division (NFED), which was established in 1991 with the task of eradicating illiteracy by 2015. Basic education (kindergarten, primary and junior high school) is tuition-free. The MoE provides a capitation grant of 4.509
7 http://www.ghanaweb.com/GhanaHomePage/NewsArchive/artikel.php?ID=130307.
GH¢ ($3.10) per child per year, to schools in Kumasi. This grant is aimed at enhancing school enrollment, and the total amount disbursed to schools depends on the number of enrolled students. The capitation grants have resulted in increases in enrollment and the availability of teaching and learning materials. However, according to a study by the Brookings Institution, the grants tend to favor schools with the ability to enroll more
8 GES administers pre-university education in Ghana. 9 http://www.mofep.gov.gh/documents/2009_supplementary_budget.pdf

14
pupils (Brookings Institution, 2007). The MoE is considering improvements to the capitation grant scheme that would take into account disadvantaged schools and districts (Ankomah et al., 2005) Students begin their six-year primary education at age six and are expected to complete junior high school by age 14. In April 2007, the Government of Ghana launched a New Education Reform to ensure that students become functionally literate and are able to understand and use numbers by the time they complete basic education. An Education Strategic Plan (ESP) 2010-2015 with ambitious education targets has also been adopted. For instance, ESP targets propose a primary school pupil-teacher ratio target of 35:1, instead of the 40:1 EFA target (see Table 6 for targets). Education in Kumasi According to EMIS, in 2008, there were 218 public pre-primary schools, 247 primary schools, 184 junior high schools and 49 senior high schools serving a population of 578,424 school age children in Kumasi. In addition, the city had several tertiary education institutions. Table 2 shows the distribution of schools in the city by education level. Table 2. Distribution of Education Institutions in Kumasi by Education Level, 2008 Level Public Private TotalFirst CyclePre-Primary School 218 789 1007Primary School 247 404 651Junior High School (JHS) 184 251 435
Special Education 2
Second CycleSenior High School (SHS) 18 31 49Technical/Vocational 1 21 22 Source: EMIS and Kumasi Metro Health Directorate (2009) for SHS The following section presents the needs and priorities in different education sub-sectors in Kumasi. II. PERSPECTIVES ON EDUCATION SUB-SECTORS 2.1. Pre-Primary Education Prior to 2003, early childhood education and care (ECEE) was overseen by the Department of Social Welfare (DSW) and was mostly privately operated. Currently, DSW is responsible for all crèches/nurseries catering to children aged 0-2, but the Ghana Education Service (GES) is responsible for kindergarten education, which targets children aged 3-5. Since 2007, the two-year kindergarten education program has been considered part of the basic education sector.

15
Enrollment in public kindergarten (KG) schools was recorded at 22,587 in 2008/09, 50 percent of which was female. Figure 4 shows enrollment levels in public and private kindergarten schools between 2000 and 2008. As the figure shows, enrollment in public schools was low prior to 2003, but since then it has more than doubled. Enrollment in private pre-primary schools has also been increasing since 2005, after a drastic decline in 2003. The increases in enrollment are attributable to the government’s decision to include the two-year kindergarten program in the basic education sector and the fact that, since 2003, some crèches/nurseries have registered as kindergartens to take advantage of the capitation grant provided for KG students. However, the Government’s policy that each primary school should have a kindergarten attached to it has not resulted in significant increases in enrollment because many public primary schools still do not have KGs attached to them. Figure 4. Trends in Kindergarten School Enrollments (2001-2008)
0
5,000
10,000
15,000
20,000
2001 2002 2003 2004 2005 2006 2007 2008
Enro
llmen
t
Year
Kindergarten Enrollment, by Gender and Type of School (2001-2008)
Public Male Public FemalePrivate Male Private Female
Source: EMIS (2001-2008), Kumasi District Profile Figure 4 also reveals that gender parity at public and private kindergarten schools fluctuated slightly during the past five years, but in 2008 it was 1.01. To keep pace with the growing enrollments, the number of kindergarten schools has also been increasing. As Figure 5 shows, since 2003, the number of public schools has steadily increased while the number of private institutions has vacillated. The steep decline in the number of private kindergarten schools might be due either to non-reporting or to a data entry error. Figure 5. Number of Kindergarten Schools by Type (2001-2008)
2001 2002 2003 2004 2005 2006 2007 2008
Public 113 137 116 129 159 191 192 192Private 388 399 340 498 239 321 386 408Total 501 536 456 627 398 512 578 600
0100200300400500600700
Num
ber
of Sc
hool
s
Number of Kindergarten Schools by Type (2001-2008)
Public Private Total
Source: EMIS (2001-2008), Kumasi District Profile

16
Female teachers outnumber male teachers in Kumasi pre-primary schools, but high student-teacher ratios show that there is a shortage of pre-primary school teachers. Between 2005 and 2008, the student-teacher ratio vacillated between 32:1 and 39:1. The national target is a student-teacher ratio of 25:1 by 2015. The large class sizes make it difficult for teachers and attendants to provide the best quality education. What is even more problematic, however, is that most teachers are not qualified. Figure 6 shows the number of teachers in public and private pre-primary schools between 2000 and 2008 and their qualification levels. It is clear that most female teachers at public schools are trained, whereas the majority of male teachers are untrained. The situation is worse in private schools, where the majority of teachers are untrained. Figure 6. Number of Pre-Primary Teachers and their Qualifications, by Gender (2001-2008)
Source: EMIS (2001-2008), Kumasi District Profile Another pressing issue is that most public pre-primary school teachers are not on the government payroll. Instead, they are paid nominal salaries by the Parent Teacher Associations and often seek other income-earning activities to supplement their income. As a result, some parents remain reluctant to enroll their children in pre-primary schools, fearing that their wards will not receive good care. A significant proportion of Kumasi pre-primary school staff does not have access to appropriate training for working effectively with pre-primary schools. In recognition of this fact, the Millennium City Initiative (MCI) has facilitated a series of trainings for Kumasi teachers and attendants, in early childhood education, conducted by seasoned educators from the Mount Carmel Training Center of Haifa and sponsored by Israel’s Office of International Cooperation (MASHAV) of the Ministry of Foreign Affairs. 10
10 At the invitation of the Ghana Education Service and Kumasi Metropolitan Education Directorate, MCI has introduced an ECE training program, as well as five model pre-primary school classes in Kumasi, led by experts in
0 100 200 300 400 500 600
M F M F M F M F M F M F M F M F
2001 2002 2003 2004 2005 2006 2007 2008
No. of Teachers
Year, Gender of Teacher
Pre-Primary Teacher qualifications 2001-2008 (PUBLIC)
Trained Untrained
0 200 400 600 800
1000 1200 1400
M F M F M F M F M F M F M F M F
2001 2002 2003 2004 2005 2006 2007 2008
Year, Gender of Teacher
Pre-Primary Teacher Qualifications 2001-2008 (PRIVATE)
Untrained
Trained

17
Many parents in Kumasi are also unaware of the importance of pre-primary education in the psychological and cognitive development of children. They believe that pre-primary school children mainly engage in play and, therefore, do not see the value in enrolling their children in pre-primary schools. In fact, research in child development has revealed that a considerable amount of learning occurs in the pre-primary school years (Myers, 1995; Myers, 2004). At one of many workshops organized by the MCI and the Kumasi Metropolitan Education Directorate, in partnership with the Israeli government, Kumasi Metropolitan Director of Education Gladys Amaning underscored that pre-primary school education is a foundation for basic education and urged parents and educators to give increased attention to teaching and learning in this underserved age group. 11
A public awareness campaign underscoring that pre-primary education contributes to achieving universal primary education by preparing children for primary school could promote enrollment levels.
Pre-primary schools in Kumasi also lack learning materials such as textbooks and other pedagogical tools such as didactic toys and playgrounds. According to the KMED, the Ghana Education Service (GES) is still working on the production of needed textbooks to supply to the KGs. 2.2. Primary Education The KMED and the MoE are committed to increasing access to education. The gross enrollment rate (GER) has been increasing steadily. In 2006/07, the primary school GER was 80.1 percent for boys and 78.2 percent for girls; by 2008/09 it had reached 86.1 and 84.1 percent for boys and girls . However, the pace of increase must accelerate, if Kumasi is to reach the MoE target of 100 percent GER by 2015. Analysis of the GER by grade shows that the GER decreases at higher grades, suggesting a high dropout rate. Table 3 shows additional indicators that are considered as important for measuring progress toward attaining the education-related MDGs. As can be seen, gender parity declines at higher levels of education: in 2008, the gender parity index was 0.98 for primary schools and 0.92 for junior high schools, suggesting that more needs to be done to promote girls’ participation in higher grade levels. The primary and JHS completion rate for girls is consistently lower than for boys, although this gap is also decreasing. In 2007, the primary completion rate was 86.1 percent for boys and 79.3 percent for girls, a year later, it was 87.3 and 80.8 percent, for boys and girls respectively. If universal primary completion is to be achieved by 2015, the completion rate for girls will now have to grow at a rate of four percentage points per year. Educating girls is critical because it can help unlock progress towards other MDGs, such as reductions in child mortality, HIV rates and poverty rates. According to Psacharopolus and
ECD from the Mount Carmel Training Center in Haifa, Israel and funded by MASHAV, the Office of International Cooperation, Ministry of Foreign Affairs, Israel. 11 Again, as stated in footnote 9, a motivating factor for MCI and the Kumasi Metropolitan Department of Education in inviting experts from Mount Carmel Training Center to carry out teacher trainings for pre-primary school and to create model pre-primary school classrooms attached to five basic schools has been to illustrate that early childhood development, and successful preparation for primary school, necessitate a range of appropriate didactic approaches, methods and materials generally not utilized in traditional primary classrooms.

18
Patrinos (2002), educated girls are 40 percent more likely to have children who live beyond age five, are better informed about health risks and have better opportunities to earn higher wages. Table 3. Select Indicators for Measuring Progress Towards Attaining MDG 2 and MDG 3 Indicator KG
Boys Girls Boys GirlsGAR (2008/09) 80.3 81.6 87.5 80.8NAR (2008/09) 61.3 62.5 64.8 57.9Completion Rate (2008/09) 87.3 80.8 79 69.9Gender Parity Index (2008/09) 1.01
Primary JSS
0.98 0.92 Source: EMIS (2008/09), Kumasi District Profile Since 2004 and 2007 the net admission rate12
(NAR) has also been persistently lower than the gross admission rate (GAR). It is important to improve the NAR because the likelihood of staying in school is much higher when a student is enrolled at the correct age.
Figure 7 shows trends in primary school enrollment in recent years, which appear to have stagnated. Figure 7. Trends in Primary School Enrollment (2002-2008)
010,00020,00030,00040,00050,00060,000
2000 2001 2002 2003 2004 2005 2006 2007 2008
Enro
llmen
t
Year
Primary School Enrollment, by Gender and Type of School (2002-2008)
Public Male Public FemalePrivate Male Private Female
Source: EMIS (2002-2008), Kumasi District Profile The major problems facing primary schools in Kumasi metropolis include low educational quality, an insufficient number of schools, inadequate classroom and toilet facilities, an uneven distribution of facilities, and lack of classroom furniture. Given that large class sizes negatively impact the quality of education, there is a need to rehabilitate classrooms and build more schools. EMIS records show that in 2008/09, 13 percent of classrooms in Kumasi needed major repairs Figure 8 confirms, the number of public schools has not significantly increased since 2006.
12 The NAR is the “number of pupils in the official age group for a given level of education who attend school in that level, expressed as a percentage of the population in that age group.”

19
Figure 8. Number of Primary Schools by Type (2001-2008)
2001 2002 2003 2004 2005 2006 2007 2008
Public 193 213 197 208 218 246 247 247Private 362 379 410 466 243 319 386 404Total 555 592 607 674 461 565 633 651
0100200300400500600700800
Num
ber o
f Sch
ools
/Cen
ters
Number of Primary schools by Type, 2001-2008
Public Private Total
v
Source: EMIS (2001-2008), Kumasi District Profile EMIS reports also show that in 2008/09, only 71 percent of public primary schools had at least one boy’s and one girl’s toilet. This is clearly not adequate. Indeed, KMED records show that 70 percent of schools needed toilets.13
The assumption that communities will build toilets in local schools is one of the reasons Kumasi schools lack such facilities.
It is important to focus on infrastructure such as toilets and fences because girls’ enrollment and retention in school are often hindered by school environments that are not gender-friendly. For instance, research by FAWE (2001) shows that, in the absence of private toilet facilities at schools, young women cannot ensure personal hygiene during their menstruation period and tend not to attend school during this time. Moreover, many schools lack adequate security fencing, elevating the risk of girls being kidnapped and smuggled into forced marriages. The MoE and KMED therefore have a responsibility to create learning environments conducive to both girls and boys. Some education directorates have proposed that capitation grants should be used to provide fencing. The dearth of desks and learning materials is also affecting the quality of primary education. According to the KMED, when furniture is lacking in schools, pupils use kitchen stools or sit on blocks and put their books on their laps to write, positions neither sustainable nor conducive to learning. At the primary school level, each student is supposed to have three core textbooks,14
, but EMIS records show that in 2008 the core textbooks per pupil ratio in primary schools, including all subjects, was only 1.7:1.
The pupil-teacher ratio in 2008 was 39:1, which is above the MoE target of 35:1 by 2015. Most primary school teachers are trained, as Figure 9 shows, but there is a need to train more male teachers. Since teachers are key to improving learning in schools, indeed it is important to implement a rigorous system of pre and in-service teacher development for male teachers, in order to strengthen the quality of both teaching and learning.
13 Toilets are usually 10 seaters and partitioned by gender. 14 In English, math and science.

20
Figure 9. Number of Teachers and their Qualifications by Gender (2001-2008)
0
500
1000
1500
2000
M F M F M F M F M F M F M F M F
2001 2002 2003 2004 2005 2006 2007 2008
No. of Teachers
Year, Gender of Teachers
Teacher Qualifications 2001-2008 Primary schools (PUBLIC)
Untrained
Trainedv
Source: EMIS (2001-2008), Kumasi District Profile This year MCI, together with the city of Kumasi, the global communications firms Ericsson and Zain, Columbia University Teachers College and the New York Public Schools, has launched a school-to-school program to strengthen the teaching of science, math, literacy, geography and global issues in junior high schools, through the uses of Instructional Technology and the Internet. The program uses the Internet as a bridge to link students and teachers. The premise is that connectivity can enhance the quality of learning and the capacity of students and teachers alike in the two countries to gain a broader understanding of issues such as poverty, human development and environmental protection, by promoting cross-cultural exchanges of knowledge between students in Kumasi and the United States.15
2.3. Junior High School Education Junior high schools (JHS) are usually located on the same compounds as primary schools. These middle schools are important as parents are more likely to send their children to primary school if an opportunity exists to continue on to JHS since the private rate of return of an investment in secondary education far outweighs the return to an investment in primary education. Bennell (1996) confirms that private rates of return to secondary education are higher than the rates of return to primary education.16
15 The city of Kumasi has provided the computers for this pilot project. MCI and Teachers College are furnishing the leadership, organization and the monitoring and evaluation component. They are also designing a curriculum based closely on the Ministry of Education’s standard 7th-grade science and math program. Students and teachers will also pursue dyadic relationships, through which they can pursue joint scientific and creative writing projects, listen via Skype to each other’s guest speakers, and/or discuss issues of common interest. The project involves 15 junior high or middle school science, math or technology classes both in New York and in Kumasi, where fixed wireless terminal devices and 3G broadband have been donated by Ericsson and Zain, respectively.
At the end of JHS, students take the Basic Education Certificate Examination (BECE).
16 This contradicts findings in earlier studies such as Psacharopoulos and Woodhall (1985) and Psacharopulos (1994), showing that rates of return to primary education in developing countries are higher than returns to secondary education.
21
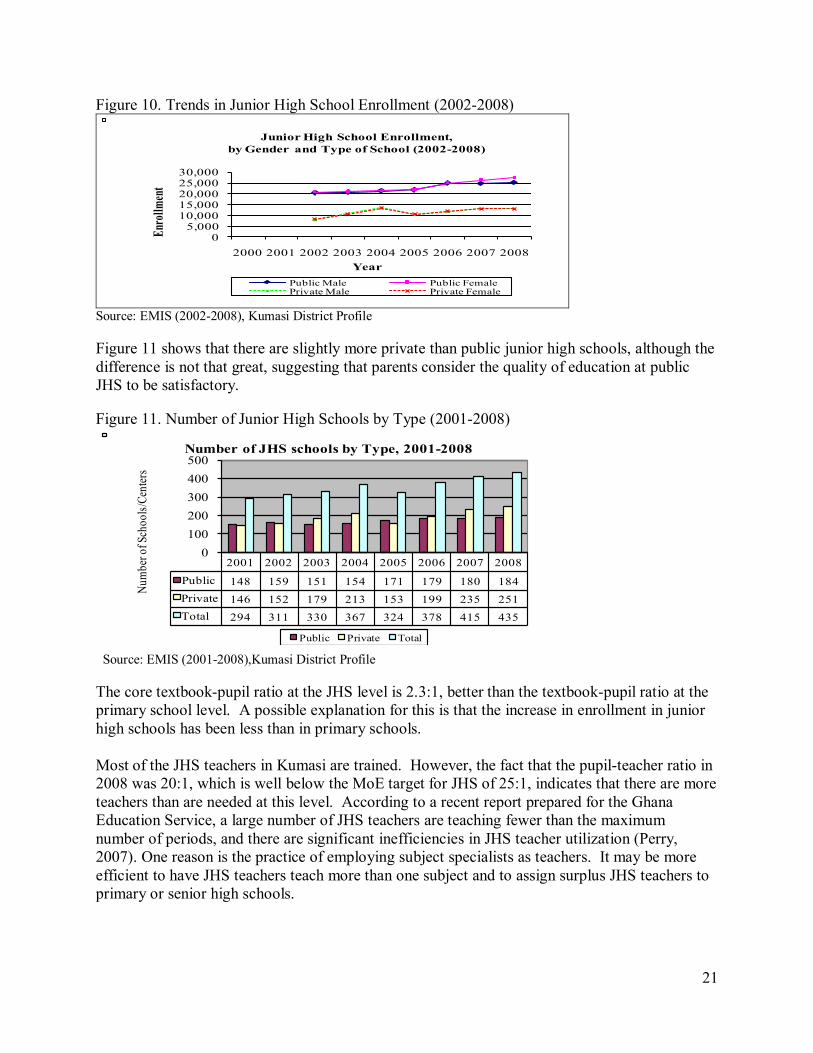
Figure 10. Trends in Junior High School Enrollment (2002-2008)
05,000
10,00015,00020,00025,00030,000
2000 2001 2002 2003 2004 2005 2006 2007 2008
Enro
llmen
t
Year
Junior High School Enrollment, by Gender and Type of School (2002-2008)
Public Male Public FemalePrivate Male Private Female
Source: EMIS (2002-2008), Kumasi District Profile Figure 11 shows that there are slightly more private than public junior high schools, although the difference is not that great, suggesting that parents consider the quality of education at public JHS to be satisfactory. Figure 11. Number of Junior High Schools by Type (2001-2008)
2001 2002 2003 2004 2005 2006 2007 2008
Public 148 159 151 154 171 179 180 184Private 146 152 179 213 153 199 235 251Total 294 311 330 367 324 378 415 435
0100200300400500
Num
ber o
f Sch
ools/
Cent
ers
Number of JHS schools by Type, 2001-2008
Public Private Total
Source: EMIS (2001-2008),Kumasi District Profile The core textbook-pupil ratio at the JHS level is 2.3:1, better than the textbook-pupil ratio at the primary school level. A possible explanation for this is that the increase in enrollment in junior high schools has been less than in primary schools. Most of the JHS teachers in Kumasi are trained. However, the fact that the pupil-teacher ratio in 2008 was 20:1, which is well below the MoE target for JHS of 25:1, indicates that there are more teachers than are needed at this level. According to a recent report prepared for the Ghana Education Service, a large number of JHS teachers are teaching fewer than the maximum number of periods, and there are significant inefficiencies in JHS teacher utilization (Perry, 2007). One reason is the practice of employing subject specialists as teachers. It may be more efficient to have JHS teachers teach more than one subject and to assign surplus JHS teachers to primary or senior high schools.

22
Figure 12. Number of Teachers and their Qualifications by Gender (2001-2008)
0
500
1000
1500
M F M F M F M F M F M F M F M F
2001 2002 2003 2004 2005 2006 2007 2008
No. of Teachers
Year, Gender of Teachers
Teacher Qualifications 2001-2008 JHS (PUBLIC)
UntrainedTrained
Source: EMIS (2001-2008), Kumasi District Profile 2.4. Senior High School Education After completing junior high school, a student can either enroll in academically oriented senior high schools17
(SHS) or opt for entrance to vocational and technical institutions. Admission to the senior high school is based exclusively on Basic Education Certificate Examination (BECE) results. For those students who do not pass the BECE, graduating from JHS marks the end of the formal education process.
There are relatively few senior high schools in the Kumasi metropolis. The MoE did not provide data on SHS, but KMED records shows that there were 49 schools (18 public and 31 private schools) in 2008. Public senior high schools enrolled 27,113 students, while private schools enrolled 16,394 students. Figure 13 shows enrollment trends in recent years. It can be seen that enrollments declined between 2006 and 2008 and that girls have lower enrollments than boys. Increasing girls’ enrollment in high schools is critical, because secondary schooling tends to raise the age of marriage and can thereby have a strong impact on reducing fertility rates and achieving health-related MDGs (Subbarao and Rainey 1995). Figure 13. Trends in Public Senior High School Enrollment (2006-2008)
0
10,000
20,000
2006 2007 2008
Enro
llmen
t
Year
Senior Secondary School Enrollment, by Gender- Public (2006-2008)
Public Male Public Female
Source: Kumasi Metropolitan Authority Education Directorate
17 SHS are also called senior secondary schools.

23
A key challenge affecting enrollment and retention in senior high schools is the high cost of a secondary education. Some students do not transition to senior high schools because they do not perform well in JHS and on the BECE exam. However, even though secondary education is subsidized, costs for transportation, examination fees, PTA levies and textbooks are prohibitive, particularly for poor students. Given that successful completion of senior high school leads to admission eligibility at training colleges, polytechnics and universities, efforts need to be made to ensure that disadvantaged youth also have access to senior high school education. Figure 14 shows that, in Kumasi’s public senior high schools, male teachers clearly outnumber female teachers, and there are more professional than non-professional teachers.18
Figure 14. Number of Teachers and their Qualifications by Gender (2006-2008)
M F M F M F
2006 2007 2008
Unprofessional 108 23 107 20 105 15
Professional 926 338 934 336 953 321
0
200
400
600
800
1000
1200
No. o
f Tea
cher
s
Year, Gender of Teacher
Teacher Qualifications 2006-2008 SHS (Public)
Source: Kumasi Metropolitan Education Directorate. 2.5. Tertiary Education Entrance to university is by examination following completion of senior high school. The Kumasi metropolis has two public universities and one private one, as well as a medical school and a polytechnic: Kwame Nkrumah University of Science and Technology (KNUST); the University of Education in Wineba, Kumasi campus (UEW-K); Christian University College (private); and Kumasi Polytechnic. KNUST19
18 According to the Kumasi Metropolitan Education Directorate, the basic minimum qualification for a senior high school teacher is a first degree (BA or BS). Professional teachers are those with certificates in education, in addition to their first degree.
is located in the eastern section of the metropolis, with six colleges and a total 2009 enrollment of 24,695 students,10 percent of whom were graduate students. KNUST’s College of Health Sciences uses Komfo Anokye Teaching Hospital, or KATH, as a site for the students’ practicum. KATH has an expert medical faculty, a new accident and trauma hospital, reliably
19 KNUST has two campuses, one in Kumasi and one in Sunyani.

24
safe blood-banking and numerous international alliances. Still, faculty are overworked and many of the facilities are severely overcrowded, leading to less than perfect teaching conditions and some otherwise preventable medical outcomes. The University of Education in Winneba (UEW) is the main teacher training institution in Ghana, and one of its campuses is in Kumasi metropolis.20
The Kumasi campus hosts the College of Technology Education and has about 3,492 students. However, the number of graduating teachers still does not match vacancies in pre-primary and primary schools. The GoG has started a program of upgrading teacher training colleges, including the construction of facilities like laboratories and computer rooms, in order to better prepare teachers specializing in the teaching of science, mathematics and technology.
Kumasi Polytechnic is located in a Kumasi area known as Asem in the Subin submetro. The Polytechnic has 18 departments, 199 instructional staff members and about 8,000 students. It offers certificate courses as well as diplomas in business studies. However, there is a need to revise the curriculum of institutions such as Kumasi Polytechnic, to help them be more relevant to the needs of industry and national development. 2.6. Non-Formal Education and Special Education Non-formal education (NFE) in Kumasi targets youth who are above 15 years of age. According to the Kumasi Education Directorate, in 2008/09, 80 percent of the students were females, with only two percent under 20 years old. The main challenges facing non-formal schools (NFS) are the low quality of education and the lack of linkage with the formal education system. The NFE sector also has inadequate teaching and learning materials and receives little budgetary support from the government or the Kumasi Metropolitan Assembly (KMA). The KMA has a NFE department with 13 staff members—including the District Coordinator, two project officers, 10 supervisors (one for each sub-metropolitan area) and one secretary. The facilitators (instructors) are mostly public school employees and are not paid salaries by the MoE or any other group. They receive in-kind incentives such as sewing machines, bicycles, roofing sheets or sound systems, after a 21-month cycle of teaching. A facilitator only receives one out of the four items listed, depending on the evaluation by the supervisors. Non-formal classes are held in public schools or churches between 5 and 7 pm. Each class typically has between 25 and 30 students. However, whereas formal education classifies its students according to academic years, non–formal education categorizes students into groups. Participatory discussions, rather than lectures, are the main teaching methodology used in NFE institutions. Special education is an area that deserves increased attention as it prepares young people with disabilities to be self-reliant. There are four agencies dealing with special education in Ghana: the Ministry of Education, Science and Sports; the Special Education Division within the Ghana Education Service; the Department of Social Welfare (DSW); and Hearing Impaired Assessment 20 Established in 2004, UEW has four campuses: Kumasi, Winneba, Mampong-Ashanti campus and Ajumako.

25
Centers. However, according to a 2009 UNESCO report, less than one percent of Ghanaian students who need special education services were enrolled in schools for the developmentally disabled (UNESCO, 2009). In Ashanti region, there are five special education schools (MoESS, 2009). 21
In Kumasi, the Garden City Special School in Asawasi provides services to disabled students. However, there is very limited information on the number of children with learning disabilities in the city, and therefore even less information as to the numbers served.
One key is that only 0.3 percent of the national education budget is allocated to special needs (MoESS, 2008). In addition, many teachers need additional training as to how to effectively educate children with special needs. 2.6. Adult Literacy Adult literacy is vital. In addition to enriching their own learning and augmenting their earning potential, when parents are literate, they tend to place higher value on educating their children. A literate adult population is more likely to be supportive of the establishment and strengthening of parents/teachers’ associations and to actively participate in school committees. Consequently, adult literacy supports and enhances the success of MDGs. Recent adult literacy rates for Kumasi District were not available. However, the “Development Plan for Kumasi Metropolitan Area” notes that the city has high illiteracy rates, and adult basic education (ABE) in Kumasi is characterized by low participation, and, predictably, given the 0.3 percent budgetary allocation, shortages of both resources and qualified teachers (GoG and KMA, 2005). III. FINACING EDUCATION IN KUMASI Ghana receives a significant portion of its education budget from international aid. That said, major donors include the World Bank, the United Kingdom’s Department for International Development (DFID), the US Agency for International Development (USAID) and Japan. DFID recently agreed to a 10-year education support plan of £105 million ($153.3 million or 221.5 million GH¢)22 which includes funds for capitation grants and for the administration of Ghanaian education, in addition to £4 million ($5.8 million or 8.4 million GH¢) of technical assistance for strategic planning and £1.5 million ($2.2 million or 3.2 million GH¢) for a program focused specifically on out-of-school children. The World Bank provides $92.2 million (133.6 million GH¢)23 Ghana Education for All Fast Track Initiative to fund the “ ” and the Education Sector Project, focusing on primary, secondary and tertiary education, decentralization and government
21 One school for the deaf, one vocational center for the deaf, one Teacher Training College and two units for the mentally challenged. These units serve small groups of children with disabilities within basic schools or special schools. 22 The exchange rate used is £1 = 2.11 Ghana cedi (GH¢). http://www.oanda.com (Jan-June 2009) 23 $1 = 1.45 Ghana cedi (GH¢), Source: www.oanda.com.

26
accountability in education administration. The 2011 budget for USAID allocates $28.9 million (41.9 million GH¢) to basic education initiatives in Ghana, focused on improving quality and access to primary education in particular.24
According to a 2010 Transparency International report, however, the allocation of these donor funds to districts has been slow and unreliable. Funds are received by the Ministry of Finance, then disbursed to the MoE/GES, and finally to districts and schools. The same report notes that a third of the Ghanaian schools surveyed, including those in the Ashanti region, report that they received funds in an untimely fashion or amounts that were less than anticipated. “The unpredictability of when and how much funding or resources reach schools undermines both planning and any meaningful financial oversight,” states the report. Some schools manage these delays by asking parents to absorb the costs that were supposed to be covered by the capitation grants (Transparency International, 2010). Table 4 lists some of the major donors financing education in Ghana and the projects they fund. Table 4. Major Donors Financing Education in Ghana Development Partner Project(s) Focus Amount
(Millions of USD)
Year(s)
Africa Development Bank Development of Senior Secondary Education Project (Education III Project)
Secondary Education 38 Ongoing since 2003
10 Education Support Programme Basic Education, Education Administration 210 2006-2015
Support to Strategic Planning Strategic Planning- Technical assistance or improving the quality of education, increasing gender parity, and strengthening links between schools, skills and development
8 2006-2013
School for Life Out-of-school children in Northern Ghana 2 2008-2011
United States- USAID Basic Education Project Basic Education, Primary Education 28.9 2011Ghana Education For All Fast Track Initiative Primary Education, Secondary Education 14.2 2009Education Sector Project, focus on decentralization and government accountability.
Primary Education, Tertiary Education, Education Administration
78 2009
World Food Program School feeding and Health Education Programme Supplementary Feeding 16.2 2006-2010
United Kingdom- DFID
World Bank
Source: DFID, USAID, AFD Local development financing is critical for the sustainability of education initiatives. Increasing reliance on local funds is in line with the International Monetary Fund’s (IMF) Poverty Reduction Strategy Paper (PRSP), which advocates increased internally-generated funds (IGFs) as a priority. The PRSP recommends reforms such as increasing accountability and transparency in tax revenue collection and reducing the inefficient allocation and misuse of tax revenue (IMF, 2009). Even the Asantehene (King of the Asante) has called for better tax collection in Ashanti to aid in the region’s development (Ghana News Agency, 2010). Ghana’s development partners
24 In 2005, for example, it was estimated that 35 percent of funding for Ghanaian education came from sources outside of the government (Addae-Boahene, 2007). The reliance on external funding is problematic because if international aid is suspended, the government will be left with a substantial gap in education financing.

27
can also push for more local ownership and the involvement of community-based organizations to improve efficiency for the projects they will continue to fund through 2015. The major sources of funding for the Kumasi Metropolitan District, then, are internally generated funds (IGF); transfers from the Government of Ghana; and transfers from international sources (donors). IGF are mainly generated from rates (property rate, basic rate), fees and fines (market fees), licenses and royalties from lands. Since 2001 there has been a special fund for education, the Ghana Education Trust Fund (GETF), which takes 2.5 percent of the Value Added Tax (VAT) to finance education. However, most of the funds are allocated to higher education. Table 5 shows the amount the GoG allocated to education in 2007 and 2008, the amount distributed to KMED, and the expenditures for different education levels in Kumasi. Table 5. Expenditures on Education in Kumasi Metropolis 2007 and 2008
GH¢ USD GH¢ USDTotal GoG Expenditure on Education 943,673,300 650,809,172 1,062,034,970 732,437,910 KMED expenditure on education 28,508,406 19,660,970 133,713,634 92,216,299 ECCE 645,952 445,484 6,567,638 4,529,406 Primary School 12,362,917 8,526,150 63,713,099 43,940,068 Junior High School 7,486,350 5,163,000 33,667,285 23,218,817 Senior High School 5,256,256 3,625,004 14,190,178 9,786,330 Technical Education 498,364 343,699 791,789 546,061 Tertiary (Teacher Training Colleges) 1,786,096 1,231,790 6,160,276 4,248,466
2007 2008
Sources: MoESS Medium Term Expenditure Framework for 2007; Vol. 23B MoESS Medium Term Expenditure Framework for 2008; Vol. 23 KMED Budget and Expenditure Report for years 2007 and 2008 3.1. The Model Teacher shortages and lack of classrooms are major challenges to the effort to achieve universal primary education in Kumasi. At the primary level Kumasi has a pupil-teacher ratio (39:1) that is higher than the national ESP target (35:1). This suggests that more teachers need to be hired. The pupil-classroom ratio (53:1) is also quite high. This indicates that more classrooms need to be built as enrollment increases over the next five years. To identify the number of teachers to be hired and the number of classrooms to be built between 2010 and 2015 so that all Kumasi children complete basic education, various policy assumptions can be introduced into EPSSim, a simulation model developed by UNESCO.25
EPSSim uses baseline population and enrollment data as well as information on staffing levels, student-teacher ratios, infrastructure and instructional materials to project financial, infrastructure and human resources requirements.
25 EPSSim stands for Education Policy and Strategy Simulation model.

28
The baseline year for the Kumasi EPSSim is 2008. The unit costs are based on local or regional data and were obtained from MoE documents. The financial, human resource and infrastructure estimates presented in this needs assessment are those resources needed to provide free basic education (kindergarten, primary and junior high education) to the eligible population. Household contributions to education are not considered, due to lack of data. Moreover, since there are only five years left until 2015, the costs for physical facilities are incurred in 2010 and 2011. The main underlying assumptions are as follows: first, the local and central government are committed to attaining MDGs 1 and 2. Second, the central government support to recurrent and development expenditures at Kumasi schools will be sustained through 2015. Specifically, the central government will continue providing the capitation grants and school furniture. Third, primary and JHS students will be provided with three textbooks per student. While the determination of priorities needed to achieve the MDGs is a matter for local authorities, this report suggests possible frameworks of priorities and their costs. In this section two scenarios, based on different policy options (targets) are presented for consideration, a Baseline and an Alternative scenario. The scenarios are designed to promote policy dialogue and to guide decision-making. Table 6 shows some key targets for the education sector for indicators related to education MDGs, followed by a description of each scenario. Table 6. List of Key Targets for the Education Sector
Indicator ESP TargetAchievement 2008/09
KG Gross Enrollment Rate (GER) 100% by 2015 69.40%Primary Gross Enrollment Rate (GER) 107% by 2012 84.10%Primary Gross Admission Rate (GAR) 100% by 2015 81.60%Primary Completion Rate 100% by 2012 80.8%JHS Gross Enrollment Rate (GER) 100% by 2015 77.2%JHS Gross Enrollment Rate (GAR) 100% by 2015 80.8%JHS Completion Rate 100% by 2015 69.9%% Female Enrollment in Universities/Polytechnics 50% by 2015 34.0%Adult Literacy 81.2% by 2015
% KG Teachers Trained 95% by 2015 68.8%% Primary Teachers Trained 95% by 2015 86.5%% JHS Teachers Trained 95% by 2015 94.9% KG Pupil Teacher Ratio (PTR) 25:1 by 2015 39:1Primary Pupil Teacher Ratio (PTR) 35:1 by 2015 39:1JHS Pupil Teacher Ratio (PTR) 25:1 by 2015 20:1 Source: MoESS (2008) Baseline scenario In the Baseline scenario, the cost of reaching the MDG target of universal primary education (MDG 2) by 2015 is estimated. Given that the government is committed to reducing pupil-teacher ratios, the pupil-teacher ratio is changed from 39:1 to the ESP target of 35:1 without changing the relative value of teacher salaries (the salaries increase in monetary value only in

29
accordance with growth in GDP per capita). Trained teachers receive an average salary worth four times the per-capita GDP, meaning that a teacher earns on average four times the income of the average Ghanaian. Untrained teachers and pre-primary school teachers receive two GDP units per person. Since there are only five years left to the attainment of MDGs, most classrooms need to be built between 2010 and 2012. Alternative scenario In the Alternative scenario, the primary school pupil-teacher ratio is changed from 39:1 to the 40:1, the EFA target used by other African countries. The pre-primary and junior high school pupil-teacher ratio is set at 30:1. It is also important to ensure that teachers are used efficiently because unnecessarily low teaching loads increase the costs per student (World Bank, 2007). EMIS records show that JHS teachers are under-utilized. As a result, to ensure efficient use of teachers at the secondary school level, the average teaching load is set at 25 lessons per week. Moreover, given that the government is contemplating reducing teacher salaries to 3.5 times GDP per capita by 2015, there is no annual percentage increase in average teacher salary (in GDP per capita). 26
3.2. Results of the EPSSim Model Table 7 summarizes the financial, human resources and infrastructure needs under the two scenarios. Table 7. Results from the EPSSim model
2011 2012 2013 2014 2015 AverageBaseline scenario per capita costs ($)Pre-primary school 2 3 4 5 5 4Primary school (public) 9 10 13 16 19 14JSS (public) 4 3 3 4 4 4Total per capita cost ($) 15 17 20 24 28 21
Primary Recurrent costs 5.90 6.96 8.53 10.72 13.34 9.09Primary -Capital Costs 2.94 3.51 4.82 5.60 5.37 4.45JHS Recurrent costs 3.46 3.44 3.41 3.32 3.67 3.46JHS -Capital Costs 0.05 0.05 0.05 0.24 0.67 0.21
Alternative scenario per capita costs ($)Pre-primary school 2 2 3 4 4 3Primary school (public) 9 10 11 13 15 12JSS (public) 3 3 3 3 4 3Total per capita cost ($) 14 15 17 20 23 18
Primary Recurrent costs 5.27 5.99 7.06 8.54 10.22 7.42Primary -Capital Costs 3.46 3.56 3.64 4.58 5.26 4.10JHS Recurrent costs 3.28 3.20 3.11 2.97 3.23 3.16JHS -Capital Costs 0.05 0.05 0.04 0.22 0.58 0.19 26 See Government of Ghana Education Sector Plan (2004)
30
Under the Baseline scenario, fewer classrooms and toilets need to be built than under the Alternative scenario. However, 115 more teachers should be hired, because of the lower pupil-teacher ratio in the Baseline scenario. Simulation results show that between 2011 and 2015, primary school recurrent costs are on average 67 percent of total costs. Moreover, teacher salaries consume 90 percent of the total recurrent expenditure at the primary and secondary levels, which implies that there are few resources left for operations and maintenance.

31
CONCLUSION Kumasi is making steady progress toward meeting the Millennium Development Goals (MDGs) for the education sector by 2015. The Ministry of Education, Science and Sports and the Kumasi Metropolitan Education Directorate (KMED) recognize that while MDG 2 is focused on primary education, an education strategy for meeting the MDG 2 requires addressing needs not only in primary education, but also in early childhood and junior high education. The disbursement of per capita grants to kindergarten, primary and junior high schools by the national government has unquestionably increased school participation; however the quality of education also needs to improve. At the pre-primary school level, the GER remains under 75 percent. This can be attributed to the following (i) lack of teachers and attendants with adequate training; (ii) an insufficient number of classrooms and kindergarten facilities tied to primary schools; and (iii) lack of textbooks and other learning materials. Interventions to increase school participation at this level therefore need to focus on addressing these three constraints to ensure that families with young children have both the incentives and the ability to send them to school. At the primary school level, the KMED has focused on promoting access to education, but again, the quality of that education needs to improve. Interventions that can improve the quality of primary education include: increasing the availability of learning and instructional materials; training more male teachers (only three out of four are trained); and providing desks. According to the KMED, furniture is lacking in primary schools. Moreover, although each student is supposed to have three core textbooks, EMIS records show that in 2008/09, each student in Kumasi had fewer than two. Increasing the number of trained teachers is critical to improving the chance that enrolled children will both attend and complete primary school. Finally, involving and informing parents and local communities in and about the monitoring of school performance has also been shown to contribute significantly to the quality of education. Fewer girls than boys participate at the junior high school level, which only 70 percent of girls complete. Studies by such organizations as the International Labor Organization suggest that this is because the opportunity cost of teenage girls’ time is high, given that parents rely on them to fulfill household domestic duties/chores and care for siblings. Strategies to improve girl’s participation in JHS include subsidies or in-kind grants that can serve as compensation for that opportunity cost (Herz et al., 1995). Girls also do not perform as well as boys on the BECE, and, as a result, relatively few girls transition to secondary school. Moreover, the 20:1 pupil-teacher ratio indicates that there is an over-supply and under-utilization of teachers at the JHS level. Teacher under-utilization can be addressed by re-training and re-assigning some teachers to senior high schools. At the senior high school level, there is a need to ensure that disadvantaged youth and girls have the opportunity to attend high school. One possibility is to provide subsidies. In 2008, the GoG

32
allocated 11.4 GH¢ million ($7.9 million) for this purpose.27
Given the relatively few public senior high schools, another strategy that could be pursued is to encourage communities and individuals to establish their own independent schools.
MCI believes that with an annual per capita investment of $19 between 2010 and 2015, Approximately 64 percent of this amount will be for primary schooling, 19 percent will be for junior high school education and 17 percent will be for kindergarten. Moreover, 76 percent of the per capita investment will be allocated to recurrent expenditure in pre-primary, primary and junior high schools while 24 percent will be for capital expenditures (i.e. construction of classrooms, toilets and staff rooms). Kumasi can achieve the MDGs in education. However, the Government of Ghana and the KMED also need to reduce their reliance on external funds. Currently, the GoG is mainly financing basic education in Kumasi by paying teacher salaries, while districts are financing some infrastructure improvements and school furniture. Capitation grants and funds to upgrade school infrastructure and reduce the cost burden borne by parents are provided by development partners. Efforts need to be made to increase the proportion of internally generated funds which are key to the sustainability of education initiatives. The less Kumasi has to rely on donors, the more control Kumasi and Ghanaian residents as a whole will have, over how they manage their education system, their own development and their future.
27 http://www.mofep.gov.gh/documents/Budget_Appendix_Tables%202008_9.pdf

33
REFERENCES Addae-Boahene, A. (2007). “Ghana: aid effectiveness and the education sector: implications for
civil society,” www.alliance2015.org/Alliance2015_Ghana_Education_Sector_Aid_Effectiveness_Study_2007.pdf (Accessed 16 April 2010).
Ankomah, J., Koomson, R. B. and George, K.T. (2005). “Implementing quality education in low
income countries: literature review – Ghana,” (Accra: University of Cape Coast). Anthony, Jane H. (2009). Access to Education for Students with Autism in Ghana: Implications
for EFA (Paris: UNESCO). Bennell, P. (1996). “Rates of return to education: Does the conventional pattern prevail in
sub-Saharan Africa?" World Development, 24 (1). pp.183-199. Brookings Institution (2007). “Review of trends in public spending for education and health in
Ghana (2002-2006),” Transparency and Accountability Project (Washington, D.C.: Brookings Institution).
Devas, N. and Korboe, D. (2000). “City governance and poverty: the case of Kumasi,”
Environment and Urbanization, 12 (1). Forum for African Women Educationalists [FAWE] (2001). “Girls’ education and poverty
eradication: FAWE’s response,” (Brussels: FAWE). Ghana News Agency (2010). “Asantehene calls for more efficiency in tax collection,”
http://www.ghanabusinessnews.com/2010/03/25/asantehene-calls-for-more-efficiency-in-tax-collection (Accessed 4 May 2010).
Government of Ghana and Kumasi Metropolitan Assembly [GoG and KMA] (2005).
Development Plan for Kumasi Metropolitan Area, 2006-2009 (Kumasi: Kumasi Metropolitan Assembly).
IMF (2009). Ghana: Poverty Reduction Strategy Paper—2006 Annual Progress Report.
http://www.imf.org/external/NP/prsp/prsp.asp (Accessed 4 May 2010). McCartney, K. and Phillips, D. (2006). Handbook of Early Childhood Development
(New York: Blackwell). Ministry of Education, Science and Sports [MoESS] (2008). Preliminary Education Sector
Performance Report (Accra: Ministry of Education, Science and Sports). Ministry of Education, Science and Sports [MoESS] (2008). Medium Term Expenditure
Framework for 2008, Vol. 23 (Accra: Ministry of Education, Science and Sports).

34
Ministry of Education, Science and Sports [MoESS] (2007). Medium Term Expenditure Framework for 2007, Vol. 23B (Accra: Ministry of Education, Science and Sports).
Myers, R.G. (1995). “The twelve who survive: strengthening programs of early childhood
development in the Third World,” (Ypsilanti, MI: High/Scope Educational Research Foundation).
Myers, R.G. (2004). “In search of quality in programmes of early childhood care and education
(ECCE),” Paper prepared for the EFA Global Monitoring Report 2005. Perry, C. (2007). “MoESS/GES staff supply/demand forecasting model – final report, Ghana.” Psacharopoulos, G. and Woodhall, M. (1985). Education for Development: An Analysis of
Investment Choices (Oxford: Oxford University Press), pp. 27-71. Psacharopoulos, G. (1994). “Returns to investment in education: A global update”,
World Development (22), pp. 1325-1343. Psacharopolus, G. and Patrinos, H.A (2002). “Returns to investment in education: a further
update,” Policy Research Working Paper No 2881 (Washington D.C.: World Bank). Subbarao, K. and Rainey, L. (1995). “Social gains from female education,” Economic
Development and Cultural Change, 44 (1). Transparency International (2010). Africa Education Watch: Good Governance Lessons for
Primary Education. http://www.transparency.org/news_room/in_focus/2010/african_education_watch#6 (Accessed 16 April 2010).
UNESCO (2006). “Ghana early childhood care and education [ECCE],” (Geneva: UNESCO
International Bureau of Education). World Bank (2007). “Expanding opportunities and building competencies for young people: A
new agenda for secondary education,” (Washington D.C.: World Bank).