KSC Tropospheric Doppler Radar Wind Profiler …...KSC Tropospheric Doppler Radar Wind Profiler...
16
KSC Tropospheric Doppler Radar Wind Profiler Operational Acceptance Test Status BJ Barbré Jacobs ESSSA Group MSFC Natural Environments 24 August 2016 Presentation to the Natural Environments Day of Launch Working Group https://ntrs.nasa.gov/search.jsp?R=20160011072 2020-04-25T03:29:17+00:00Z
Transcript of KSC Tropospheric Doppler Radar Wind Profiler …...KSC Tropospheric Doppler Radar Wind Profiler...
KSC Tropospheric Doppler Radar Wind Profiler Operational
Acceptance Test Status
BJ Barbré
Jacobs ESSSA Group
MSFC Natural Environments
24 August 2016
Presentation to the Natural Environments Day of Launch Working Group
https://ntrs.nasa.gov/search.jsp?R=20160011072 2020-04-25T03:29:17+00:00Z

2
Outline
• Background
• Data and Methodology
• Results
• Summary

3
Background
• Tropospheric Doppler Radar Wind Profiler (TDRWP) certification analyses consist of
examining TDRWP output and comparisons to balloon measurements.
Analyses assume that the balloon is valid while accounting for temporal sampling differences
between the balloon and TDRWP.
Include examination of TDRWP data quality and effective vertical resolution (EVR).
Full certification [specific to NASA Space Launch System (SLS)]
• Completion would certify use of TDRWP for GO decision to launch.
• Projected timeline of roughly one year, which is prohibitive to use the TDRWP as-is, so…
Operational Acceptance Test [OAT, performed for the Eastern Range (ER) / Kennedy Space
Center (KSC)]
• Completion would show that the new system is as good as the 50-MHz DRWP*, and could be
used as a situational awareness tool.
• An OAT (without a Quick-Look) was successfully performed on the TDRWP, but changes of
transmission frequency, pulse shape, pulse width, and processing software necessitated a redo
of the TDRWP certification process.
Quick-Look (performed for the ER / KSC)
• Completion would determine that the TDRWP produces data that is of sufficient quality to assess
for the OAT.
• Timeline of three to four weeks: Completed in July, 2016.
• These charts summarize the analysis method and provide an OAT status.
• Individual vehicle programs must decide if and how to use the TDRWP.
* The term “50-MHz DRWP” refers to the system that the TDRWP is replacing (i.e., the
system that was decommissioned in March 2014).
4
Data and Methodology
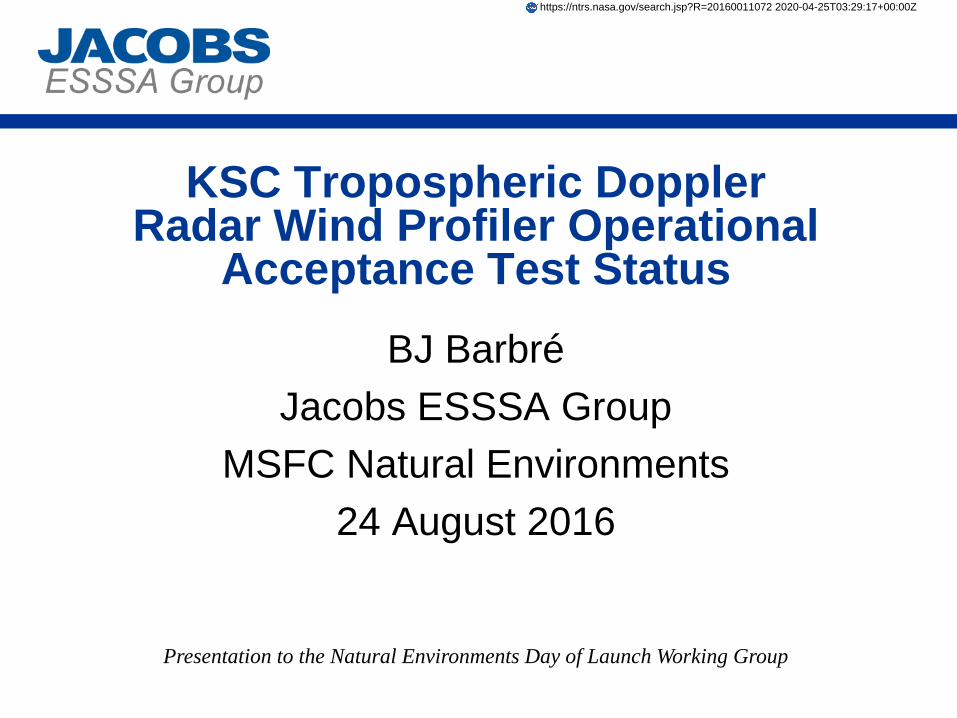
• Analysis period
Quick-look: June 22, 2016 thru July 1, 2016; with 30 concurrent TDRWP and balloon profiles.
NEDOLWG: June 22, 2016 thru July 28, 2016; with 85 concurrent TDRWP and balloon
profiles.
• TDRWP Data
Five-minute profiles for each day from 1,795-19,430 m, every 150 m.
Removed entire profiles during periods of deep convection that affected wind field (“QC”).
Each day contains at least 100 profile pairs.
• Balloon Data
Automated Meteorological Profiling System (AMPS) Low Resolution (LR) and High Resolution
(HR) Flight Element (FE).
One-second data provided by the Cape Weather Station.
Performed altitude limit and temporal separation QC.
• Analysis methodology
Visually examine TDRWP time-height (T-Z) sections.
Examine data availability and investigate QC flags.
Compute root-mean-square (RMS) wind deltas from TDRWP and balloon profiles matched in
the temporal and vertical domain.
TDRWP spectral analysis.
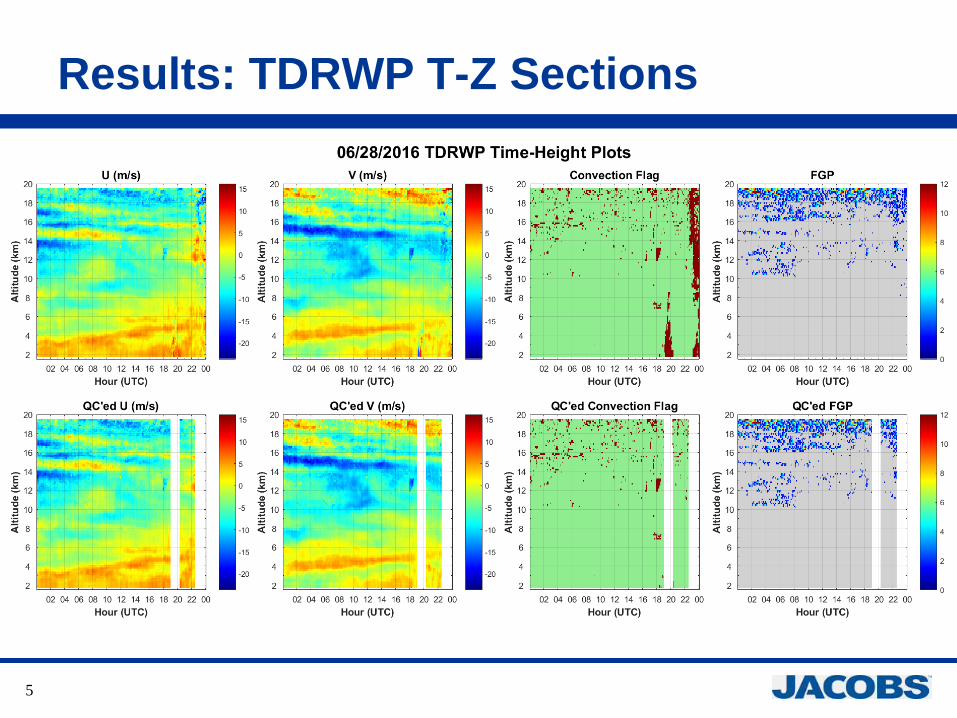
5
Results: TDRWP T-Z Sections

6
Results: Data Availability
• Plot consists of the percent of
TDRWP data at a specified altitude
that contain at most X number of
First Guess Propagations (FGPs).
• 100% availability indicates that
none of the data points at a given
altitude were derived from
propagating the first guess velocity
(e.g., the signal was discernable
above the noise floor).
• During this period, the TDRWP
provided, on average, nine profiles
per hour that reach ~17 km without
being affected by a characteristic
that propagates the first guess
velocity.
7
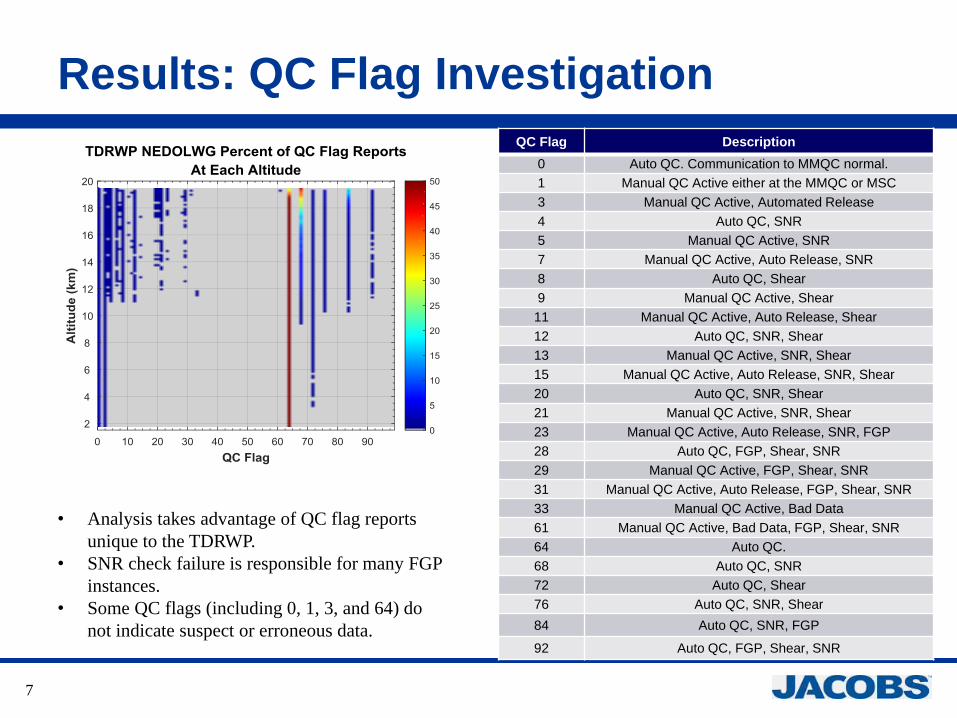
Results: QC Flag Investigation
QC Flag Description
0 Auto QC. Communication to MMQC normal.
1 Manual QC Active either at the MMQC or MSC
3 Manual QC Active, Automated Release
4 Auto QC, SNR
5 Manual QC Active, SNR
7 Manual QC Active, Auto Release, SNR
8 Auto QC, Shear
9 Manual QC Active, Shear
11 Manual QC Active, Auto Release, Shear
12 Auto QC, SNR, Shear
13 Manual QC Active, SNR, Shear
15 Manual QC Active, Auto Release, SNR, Shear
20 Auto QC, SNR, Shear
21 Manual QC Active, SNR, Shear
23 Manual QC Active, Auto Release, SNR, FGP
28 Auto QC, FGP, Shear, SNR
29 Manual QC Active, FGP, Shear, SNR
31 Manual QC Active, Auto Release, FGP, Shear, SNR
33 Manual QC Active, Bad Data
61 Manual QC Active, Bad Data, FGP, Shear, SNR
64 Auto QC.
68 Auto QC, SNR
72 Auto QC, Shear
76 Auto QC, SNR, Shear
84 Auto QC, SNR, FGP
92 Auto QC, FGP, Shear, SNR
• Analysis takes advantage of QC flag reports
unique to the TDRWP.
• SNR check failure is responsible for many FGP
instances.
• Some QC flags (including 0, 1, 3, and 64) do
not indicate suspect or erroneous data.

8
Results: TDRWP / Balloon Comparisons
9
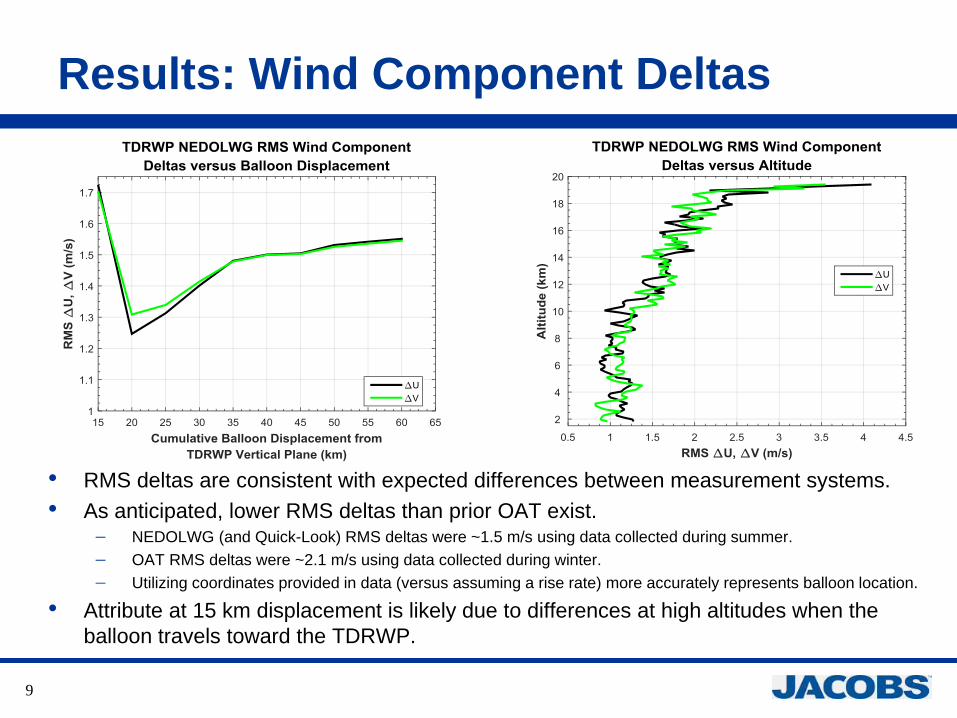
Results: Wind Component Deltas
• RMS deltas are consistent with expected differences between measurement systems.
• As anticipated, lower RMS deltas than prior OAT exist. NEDOLWG (and Quick-Look) RMS deltas were ~1.5 m/s using data collected during summer.
OAT RMS deltas were ~2.1 m/s using data collected during winter.
Utilizing coordinates provided in data (versus assuming a rise rate) more accurately represents balloon location.
• Attribute at 15 km displacement is likely due to differences at high altitudes when the
balloon travels toward the TDRWP.
10
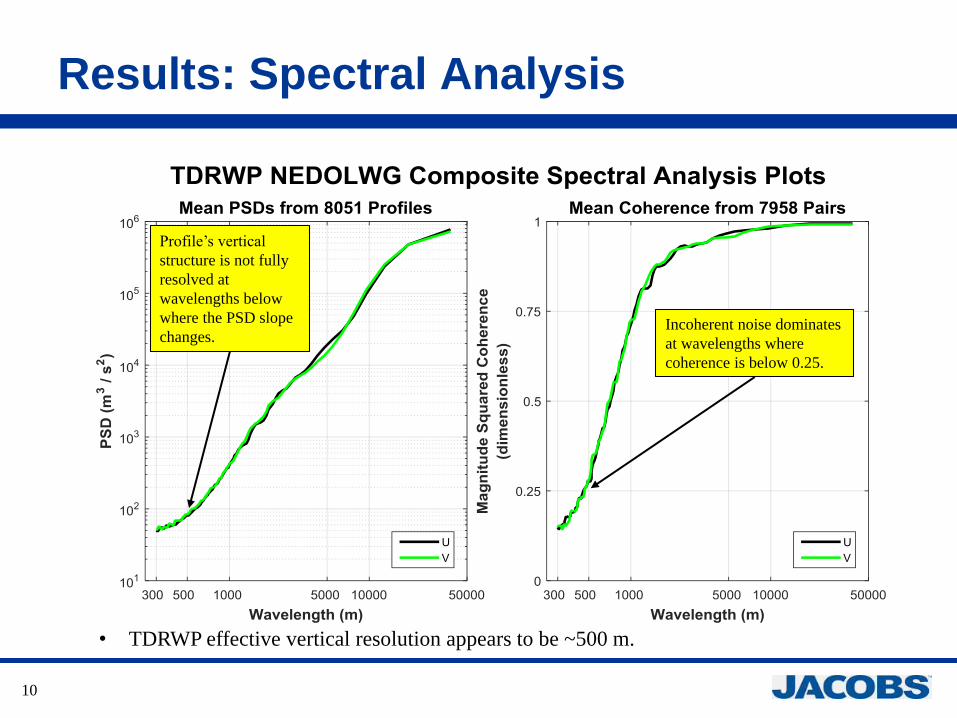
Results: Spectral Analysis
• TDRWP effective vertical resolution appears to be ~500 m.
Profile’s vertical
structure is not fully
resolved at
wavelengths below
where the PSD slope
changes.Incoherent noise dominates
at wavelengths where
coherence is below 0.25.

11
Summary
• This analysis provides a status of activities performed for the TDRWP OAT.
TDRWP wind profiles compare well with concurrent balloon measurements.
• RMS of all wind component deltas are 1.55 m/s (U) and 1.55 m/s (V).
• Wind component deltas are generally smaller if balloon is closer to TDRWP.
• Analysis shows expected results when considering data from previous testing.
TDRWP effective vertical resolution appears to be ~500 m.
Caveat exists in that the TDRWP contains instances of weak signal at high
altitudes.
• OAT target completion in mid-late October, 2016.
• OAT data to be included in TDRWP full certification for SLS.

Backup
• Data and Methodology Details
• TDRWP / Balloon Comparison “blowback” case
• Previous OAT TDRWP/Balloon Comparison Results

13
Backup: Data Details
• Analysis period started June 22, 2016. Quick-look assessed data through July 1, 2016.
• TDRWP
Five-minute profiles for each day from 1,795-19,430 m, every 150 m.
Filled temporal data gaps for plotting.
Removed entire profiles during periods of deep convection that affected wind field (“QC”).
Each day contains at least 100 profile pairs.
• Balloon
Automated Meteorological Profiling System (AMPS) Low Resolution (LR) and High Resolution
(HR) Flight Element (FE).
One-second data provided by the Cape Weather Station.
Variables processed for analysis consist of date, latitude, longitude, altitude, and smoothed
wind components at each altitude up to 22,860 m (75,000 ft).
Profile must terminate at or above 15,240 m (50,000 ft) and not contain a 31 m (100 ft) vector
shear exceeding 0.15 s-1.
Separated temporally adjacent profiles by at least five minutes to avoid processing duplicate
balloon profiles.

14
Backup: Methodology Details
• Plotted TDRWP time-height (t-z) sections of wind components, convection,
and maximum first-guess-propagation (FGP) from all four beams.
• TDRWP / Balloon comparisons
Averaged all one-second balloon data within 75 m of each TDRWP altitude. At
least 15 one-second reports must exist to report an average.
Temporally matched balloon and TDRWP data throughout balloon ascent.
• Subtracted 7.5 minutes from TDRWP timestamp to account for temporal averaging.
• Found closest TDRWP record to the balloon timestamp at each altitude.
• TDRWP record must exist within five minutes of balloon timestamp.
Retained profile for comparison if at least 75% of the 119 TDRWP altitudes (i.e.,
range gates) contain reports from both sources.
Total of 30 balloon (all LRFE) profiles with concurrent TDRWP profiles existed that
passed QC during the analysis period.
Plotted TDRWP wind component t-z sections with balloon ascent, TDRWP /
balloon overlay and differences, and balloon ground track.

15
Backup: TDRWP / Balloon Comparison

16
Backup: Previous OAT Results