Kroonpress Sustainability Report 2014
20
Kroonpress Sustainability Report 2014 Kroonpress Sustainability Report 2014
-
Upload
kroon-press -
Category
Documents
-
view
216 -
download
3
description
Â
Transcript of Kroonpress Sustainability Report 2014

Kroonpress Sustainability Report 2014Kroonpress Sustainability Report 2014
kroonpress_sustainabilityreport2014 CS5 OKT.indd 1 14.11.2014 14:33:08

kroonpress_sustainabilityreport2014 CS5 OKT.indd 2 14.11.2014 14:35:06

A Message from the CEO 4
Environmental policy 5
Achievements in 2013 6
Kindergartens happy for our paper 6
LEDs installed in old warehouse 6
CNG-powered transport 7
100% renewable electricity 7
Carbon footprint 8
Rainwater consumption 9
Greenline Print – a successful fi rst year 10
Goals for 2014 12
Heat waste utilisation 12
EU Ecolabel 12
Production markers 13
Print effi ciency 13
Print material consumption and waste 13
Energy consumption 14
Transport 14
Emissions into water 15
Emissions into air 15
Brief summary 16
Contents
kroonpress_sustainabilityreport2014 CS5 OKT.indd 3 14.11.2014 14:37:36
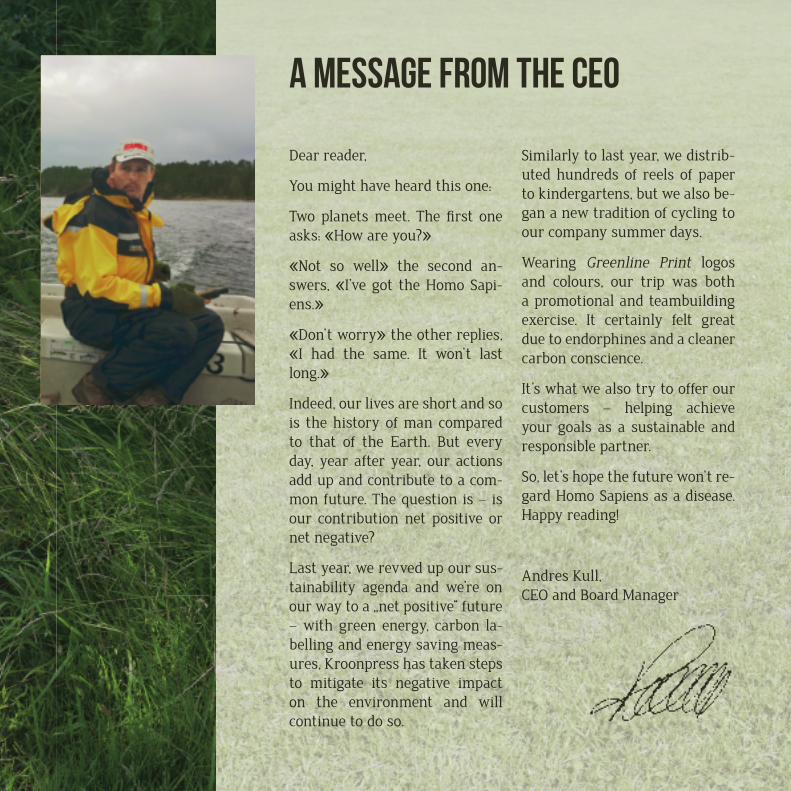
Dear reader,
You might have heard this one:
Two planets meet. The fi rst one asks: «How are you?»
«Not so well» the second an-swers, «I’ve got the Homo Sapi-ens.»
«Don’t worry» the other replies, «I had the same. It won’t last long.»
Indeed, our lives are short and so is the history of man compared to that of the Earth. But every day, year after year, our actions add up and contribute to a com-mon future. The question is – is our contribution net positive or net negative?
Last year, we revved up our sus-tainability agenda and we’re on our way to a „net positive“ future – with green energy, carbon la-belling and energy saving meas-ures, Kroonpress has taken steps to mitigate its negative impact on the environment and will continue to do so.
Similarly to last year, we distrib-uted hundreds of reels of paper to kindergartens, but we also be-gan a new tradition of cycling to our company summer days.
Wearing Greenline Print logos and colours, our trip was both a promotional and teambuilding exercise. It certainly felt great due to endorphines and a cleaner carbon conscience.
It’s what we also try to offer our customers – helping achieve your goals as a sustainable and responsible partner.
So, let’s hope the future won’t re-gard Homo Sapiens as a disease. Happy reading!
Andres Kull,CEO and Board Manager
A Message from the CEO
kroonpress_sustainabilityreport2014 CS5 OKT.indd 4 14.11.2014 14:39:49

Our environmental policy is to increase stakeholder value by be-ing more resource-effi cient, gen-erating as little harmful waste as possible and endorsing a life cycle perspective in printing to increase transparency about other parts of the value chain.
Our primary environmental re-sponsibility is to monitor and minimize the impact of our own operations. We do this by follow-ing strict EU and national regula-tions on waste generation.
Our secondary responsibility is voluntary obligation to various stricter limitations and norms. We currently hold the ISO 14001 en-vironmental management certifi -
cate, ISO 9001 quality management certifi cate, Forest Stewardship Council (FSC) and Programme for the Endorsement of Forest Cer-tifi cation (PEFC) chain of custody certifi cates and the Nordic Ecola-belling license.
We now also have the „100% Rohe-line Energia“ („100% Green Energy“) label issued by our energy provid-er Eesti Energia, which states that 100% of the base electricity we re-ceive is produced from hydro and wind energy. And we are proud to have our own transparent and in-novative graded carbon footprint label – the Greenline Print label – that is also available to all our clients.
Environmental policyNORDIC ECOLABEL
541 787
Printing company /19-31-02
kroonpress_sustainabilityreport2014 CS5 OKT.indd 5 14.11.2014 14:42:09

:Achievements in 2013 Kindergartens Happy For Our Paper
75 kindergartens, 430 reels of paperWe continued our popular Christmas-time paper giveaway, and this year, requests for pa-per truly overwhelmed us – in total, we donated 430 discarded
reels of high quality newspaper to 75 kindergartens around the country, with free delivery to 29 kindergartens in our hometown Tartu.
100% renewable electricity 7650 tonnes less indirect CO2
Our new energy contract with energy provider Eesti Energia enabled our base electricity con-sumption to go 100% fossil free and become based on wind and hydro. However, due to fl uctuat-ing electricity demands on our side, e.g. simultaneous machine startups and other peak demand, base consumption covered 86. 5%
of the annual electricity con-sumption. This means that de-spite decreasing our indirect car-bon emissions by 7650 tonnes of CO2, we were still responsible for up to 1200 tonnes of greenhouse gas emissions from peak energy bought from the open electricity market produced from undeter-mined fuel sources.
LEDs installed in old warehouse83% energy reduction
Both of our paper storages are now fully fi tted with Philips GentleLight LEDs, following the installation of 16 LED high-bay
lights in 2012. Our old warehouse previously featured 19 metal hal-ide high bay lights with a total power of 7600W, whereas the
kroonpress_sustainabilityreport2014 CS5 OKT.indd 6 14.11.2014 14:45:00
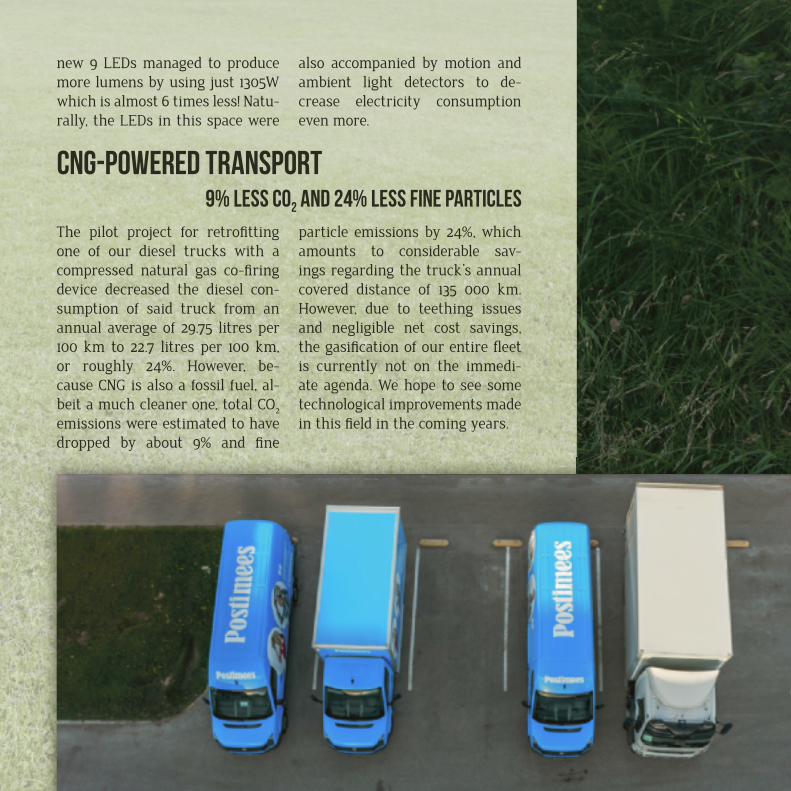
new 9 LEDs managed to produce more lumens by using just 1305W which is almost 6 times less! Natu-rally, the LEDs in this space were
also accompanied by motion and ambient light detectors to de-crease electricity consumption even more.
CNG-powered transport9% less CO2 and 24% less fine particles
The pilot project for retrofi tting one of our diesel trucks with a compressed natural gas co-fi ring device decreased the diesel con-sumption of said truck from an annual average of 29.75 litres per 100 km to 22.7 litres per 100 km, or roughly 24%. However, be-cause CNG is also a fossil fuel, al-beit a much cleaner one, total CO2 emissions were estimated to have dropped by about 9% and fi ne
particle emissions by 24%, which amounts to considerable sav-ings regarding the truck’s annual covered distance of 135 000 km. However, due to teething issues and negligible net cost savings, the gasifi cation of our entire fl eet is currently not on the immedi-ate agenda. We hope to see some technological improvements made in this fi eld in the coming years.
kroonpress_sustainabilityreport2014 CS5 OKT.indd 7 14.11.2014 14:48:03

Carbon footprint68% decrease in direct+indirect carbon footprint
Company cars 62 tCO2
2
Company trucks565 tCO2
Natural gas 1683 tCO2
District heating123 tCO
Electricity1200 tCO2 Scope 1
(direct emissions)
Scope 2(indirect emissions)
By reaping the lowest hanging fruits we managed to decrease our direct and indirect carbon footprint by a whopping 68% from 11 260 tonnes in 2012 to 3628 tonnes of CO2 in 2013! This was mainly thanks to the switch from fossil-fueled electricity to electric-ity produced from wind and hydro. Truck emissions dropped thanks to newer, more effi cient vehicles and our CNG-truck. District heat-ing and natural gas emissions
were lower thanks to a milder winter but the district heat pro-vider used 5% more biomass in energy production, now reaching 72%.
Our emissions did grow in one as-pect, though, and that was from company owned cars. Clearly, this aspect has previously been over-looked due to its relative insignifi -cance, but it will now come under closer scrutiny.
Scope 1+2 carbon footprint 2013• C O 2 p e r e m p l o y e e : 13 . 8 t o n n e s• C O 2 p e r r e v e n u e : 10 0 t o n n e s / m l n €• C O 2 p e r e n e r g y u s e d : 5 8 t o n n e s / TJ
kroonpress_sustainabilityreport2014 CS5 OKT.indd 8 14.11.2014 14:51:18

Rainwater consumption15% less groundwater consumed
We collect and fi lter rainwater from a surface of approximately 10 000 m2 into two 25 m3 tanks. During the last three quarters of 2013 we managed to cover an av-erage of 15% of our total water
requirements with rainwater, or 856 m3. So far, we have only been bugged by the rapid clogging of fi lters but nonetheless, the project has justifi ed itself and we hope for many rainy days to come!
Correlation between recorded rainfall and our rainwater collection for last 9 months of 2013
kroonpress_sustainabilityreport2014 CS5 OKT.indd 9 14.11.2014 14:54:32

kroonpress_sustainabilityreport2014 CS5 OKT.indd 10 14.11.2014 14:57:10

kroonpress_sustainabilityreport2014 CS5 OKT.indd 11 14.11.2014 15:00:12

Greenline Print –a successful first year
Over 30 million issues labelled as low carbon
A full year of calculating, grading and labelling carbon footprints has passed. Calculations involving for-estry operations, fi bre separation, paper manufacture, ink and print-ing plate production, along with raw material extraction, trans-portation and printing generated footprints ranging from below 500 to nearly 2000 kgCO2 per tonne of
prints. Print runs with even larger footprints were not deemed label-worthy by our clients, which is why we only saw top-of-the-line label grades.
There was a rapid increase in labelled prints in the fi rst few months of last year with the larg-est Esto nian daily newspaper
Num
ber o
f iss
ues
Jan Feb Mar Apr May June July Aug Sept Oct Nov Dec
2M
1M
MagazinesNewspapers
Num
ber o
f iss
ues
10M
8M
6M
Q1 Q2
4M
2M
number of monthly labeled prints number of labelled prints by destination
kroonpress_sustainabilityreport2014 CS5 OKT.indd 12 14.11.2014 15:02:44

jumping on board in April and many local newspapers joining in December. Swedish and Estonian readers received the most labelled prints while Lithuania came a close third and Norwegian orders launched in the fourth quarter of 2013.
Overall, 367 unique labels were is-sued of which the vast majority proved to be A-class prints and 10% of all labelled prints contained recycled paper. It should be re-minded that A-class prints trap as much or more CO2 inside the pa-per fi bre as is emitteded from the raw materials phase to delivery. Effectively, these are carbon neu-
tral products!
As all Greenline Print labelled prints are entitled to 100% renew-able electricity during production (of which a separate electricity consumption register is held), the average carbon footprint for elec-tricity consumption at Kroonpress printing plant was zero. Our dis-trict heating provider distributed heat that was 2/3 carbon-neutral and our natural gas consumption per issue dropped by 10%, so the share of printing emissions in the footprints is getting even smaller.
Low carbon printing - it’s here!
Estonia
Sweden
Norway
Lithuania
Q2 Q3 Q4
A+ A B+ B
28
253
878
number of labelled prints by destination Number of unique labels by LABEL class
kroonpress_sustainabilityreport2014 CS5 OKT.indd 13 14.11.2014 15:05:43
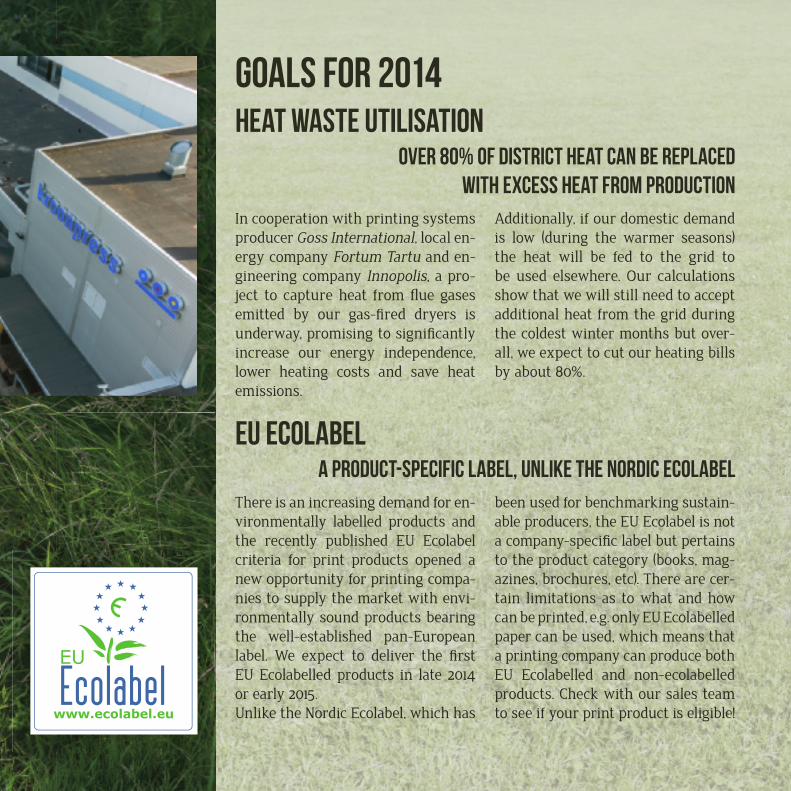
Goals for 2014Heat waste utilisation
Over 80% of district heat can be replaced with excess heat from production
In cooperation with printing systems producer Goss International, local en-ergy company Fortum Tartu and en-gineering company Innopolis, a pro-ject to capture heat from fl ue gases emitted by our gas-fi red dryers is underway, promising to signifi cantly increase our energy independence, lower heating costs and save heat emissions.
Additionally, if our domestic demand is low (during the warmer seasons) the heat will be fed to the grid to be used elsewhere. Our calculations show that we will still need to accept additional heat from the grid during the coldest winter months but over-all, we expect to cut our heating bills by about 80%.
EU Ecolabela product-specific label, unlike the Nordic Ecolabel
There is an increasing demand for en-vironmentally labelled products and the recently published EU Ecolabel criteria for print products opened a new opportunity for printing compa-nies to supply the market with envi-ronmentally sound products bearing the well-established pan-European label. We expect to deliver the fi rst EU Ecolabelled products in late 2014 or early 2015. Unlike the Nordic Ecolabel, which has
been used for benchmarking sustain-able producers, the EU Ecolabel is not a company-specifi c label but pertains to the product category (books, mag-azines, brochures, etc). There are cer-tain limitations as to what and how can be printed, e.g. only EU Ecolabelled paper can be used, which means that a printing company can produce both EU Ecolabelled and non-ecolabelled products. Check with our sales team to see if your print product is eligible!
kroonpress_sustainabilityreport2014 CS5 OKT.indd 14 14.11.2014 15:09:19
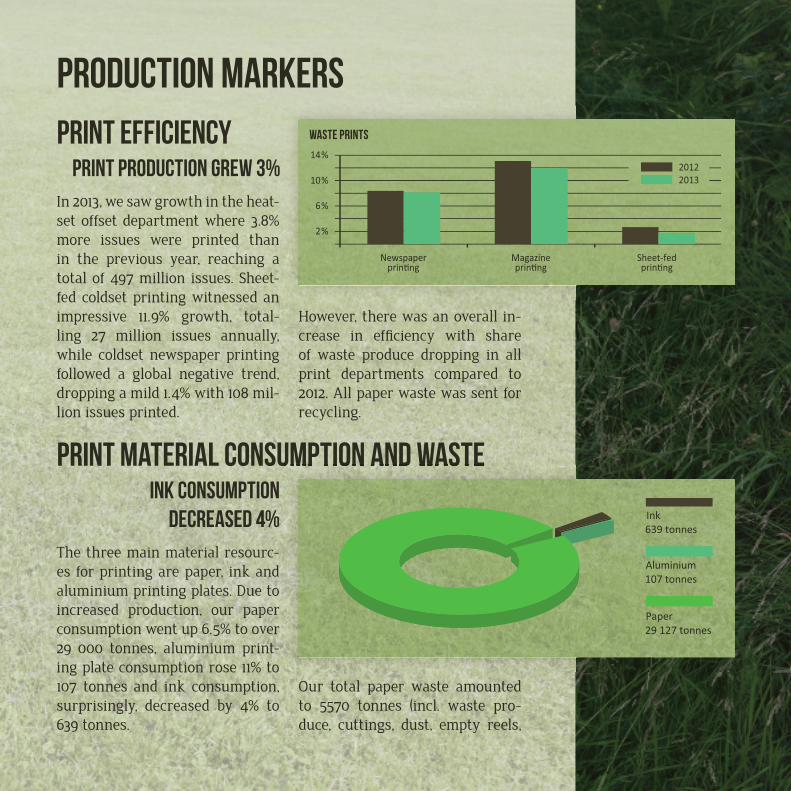
Production markersPrint efficiency
Print production grew 3%In 2013, we saw growth in the heat-set offset department where 3.8% more issues were printed than in the previous year, reaching a total of 497 million issues. Sheet-fed coldset printing witnessed an impressive 11. 9% growth, total-ling 27 million issues annually, while coldset newspaper printing followed a global negative trend, dropping a mild 1. 4% with 108 mil-lion issues printed.
However, there was an overall in-crease in effi ciency with share of waste produce dropping in all print departments compared to 2012. All paper waste was sent for recycling.
Print material consumption and wasteInk consumption
decreased 4%The three main material resourc-es for printing are paper, ink and aluminium printing plates. Due to increased production, our paper consumption went up 6. 5% to over 29 000 tonnes, aluminium print-ing plate consumption rose 11% to 107 tonnes and ink consumption, surprisingly, decreased by 4% to 639 tonnes.
Our total paper waste amounted to 5570 tonnes (incl. waste pro-duce, cuttings, dust, empty reels,
Waste Prints
Print material consumption and waste
kroonpress_sustainabilityreport2014 CS5 OKT.indd 15 14.11.2014 15:14:56
packaging paper), which was all diverted to recycling by our waste handler. All 107 tonnes of printing plates were collected for recycling and potentially hazardous materi-
als (incl. activator/developer solu-tions, ink waste, batteries, fl uores-cent lights etc) made up 66 tonnes of carefully handled waste.
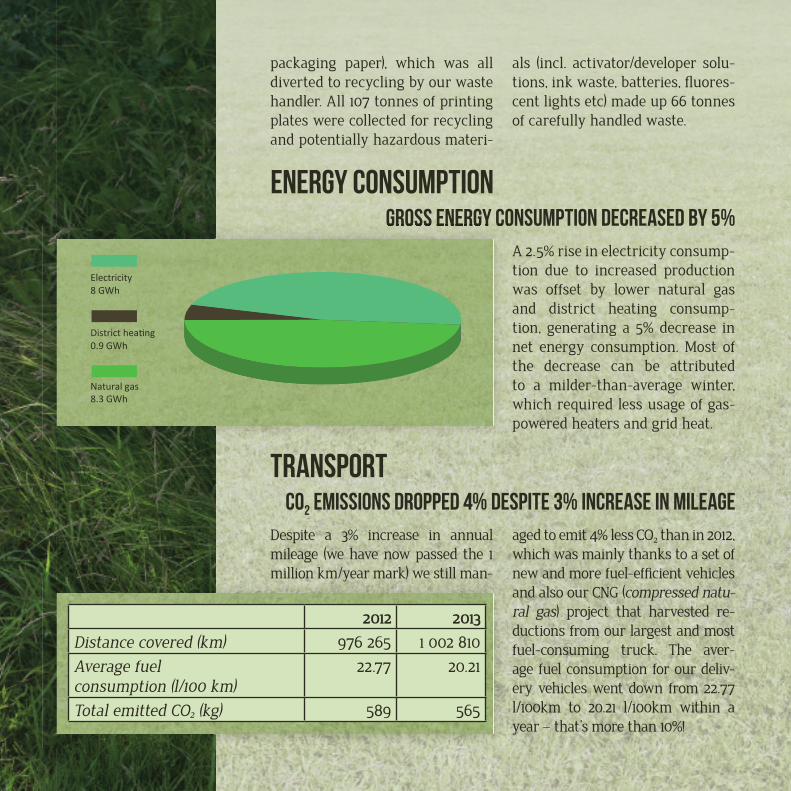
Energy consumptionGross energy consumption decreased by 5%
A 2. 5% rise in electricity consump-tion due to increased production was offset by lower natural gas and district heating consump-tion, generating a 5% decrease in net energy consumption. Most of the decrease can be attributed to a milder-than-average winter, which required less usage of gas-powered heaters and grid heat.
TransportCO2 emissions dropped 4% despite 3% increase in mileage
Despite a 3% increase in annual mileage (we have now passed the 1 million km/year mark) we still man-
aged to emit 4% less CO2 than in 2012, which was mainly thanks to a set of new and more fuel-effi cient vehicles and also our CNG (compressed natu-ral gas) project that harvested re-ductions from our largest and most fuel-consuming truck. The aver-age fuel consumption for our deliv-ery vehicles went down from 22. 77 l/100km to 20. 21 l/100km within a year – that’s more than 10%!
Gross energy consumption decreased by 5%
Electricity8 GWh
Natural gas 8.3 GWh
District heating 0.9 GWh
2012 2013
Distance covered (km) 976 265 1 002 810
Average fuel consumption (l/100 km)
22.77 20.21
Total emitted CO2 (kg) 589 565
kroonpress_sustainabilityreport2014 CS5 OKT.indd 16 14.11.2014 15:19:11

Emissions into waterBecause our liquid waste is handled as hazardous waste, all of it is collect-ed separately and passed on to waste handlers. What goes down the sewers is just regular domestic wastewater, which is why we don’t burden the sew-age system any more than an average apartment building. Biological oxygen demand (BOD7) is well below permit levels, as are total dissolved solids, phosphorus and nitrogen.
Emissions into airWe have maintained a below-required level of CO and N2O emissions but re-gretfully, volatile organic compound emissions have increased due to a sig-nifi cant hike in sheet-fed production which increased the consumption of the solvent isopropyl alcohol and oth-er washing agents containing VOCs. Because VOCs are a health issue, we are hoping to tackle this problem by installing a higher ventilation outlet which will decrease VOC concentration at ground level.
0200400600800
1000120014001600
BOD7 Total dissolved solidsmg/l
PermitAverage
0,00
20,00
40,00
60,00
80,00
100,00
Phosphorus Nitrogenmg/l
PermitAverage
0
5
10
15
20
25
N2O CO VOCtonnes
PermitActual
kroonpress_sustainabilityreport2014 CS5 OKT.indd 17 14.11.2014 15:24:10

Brief summary - 2013Achievements:• 75 kindergartens across the country were donated 430 reels of paper.
• LEDs installed in the old warehouse decreased electricity consumption there by more than 80%.
• Our CNG-pilot project yielded 9% less CO2 and 24% less fi ne particles for the given truck.
• 100% of our base electricity consumption is now sourced from hydro and wind.
• The carbon footprint of Kroonpress decreased in four out of fi ve emission categories year-on-year.
• Thanks to rainwater collection, our grid water consumption dropped by 15%.
• Over 30 million prints were labelled with a low-carbon Greenline Print label.
Production markers:• 3% total increase in production output.
• 4% decrease in ink consumption.
• 5% less total energy consumed.
Emissions:• Transport emissions dropped by 4%, despite 3% increase in mileage.
• Emissions into air and water were well within permit limits.
• N2O and CO emissions were within permit limits.
• VOC emissions exceeded permit limits due to increased sheet-fed offset production.
Goals set:• EU Ecolabel certifi cation should be achieved in 2014.
• Heat waste utilisation project should be completed late 2014/early 2015.
• Bring VOC emissions within permit levels.
kroonpress_sustainabilityreport2014 CS5 OKT.indd 18 14.11.2014 15:26:35

kroonpress_sustainabilityreport2014 CS5 OKT.indd 19 14.11.2014 15:29:06

KroonpressSustainability Report 2014
Paper: Amber Graphic 140Press: Heidelberg SM 102-9P5+LX
Layout: Triinu LaansaluPhotos: Katrin Kelpman, Taevakaamera OÜ
info: [email protected] c08973 g CO2
kroonpress_sustainabilityreport2014 CS5 OKT.indd 20 14.11.2014 15:32:19