KPI report for retail chain stores in China (10,000-14,999 m 2) 17,989 274 0.22 38.5 35.00...
26
Li & Fung Research Centre China Chain Store & Franchise Association Member of the Li & Fung Group 1 2010 Q1 LI & FUNG RESEARCH CENTRE CHINA CHAIN STORE & FRANCHISE ASSOCIATION KPI report for retail chain stores in China Foreword About the KPI report The China Chain Store & Franchise Association and the Li & Fung Research Centre have collaborated and established the Key Performance Index System (hereafter the “KPI system”) for retail chain operators in China since 2007 and published reports on a quarterly basis. The system aims to collect key performance indices of different format retail stores in China. In 2009, the data collection system are further upgraded and revised, and more store samples have been added. The revised KPI report covers over 100 retail stores in China of 5 major formats, including convenience stores, supermarkets, hypermarkets, department stores and home electronics appliance chains, of which supermarkets and hypermarkets are further divided into several categories by operating area for easier references. We hope this report can shed some light on the key development trends of China's retail chain stores. About the indicators Data of the following is collected in the KPI system – 1. Monthly sales ( ) – Pre-tax monthly sales value 2. Total operating area ( ) – Including self-operating area and leasing area 3. Leasing area ( ) – Area leased to other operators 4. Total staff number ( ) – Total number of staff including dispatched employees hired by labor agents ( ) 5. Total number of contract staff ( ) – Total number of staff hired directly by the retailers 6. Total operating cost ( ) 7. Total salaries and wages ( ) 8. Total number of SKUs ( ) 9. Number of SKUs distributing directly through the distribution centre ( ) 10. Average daily number of transactions ( ) 11. Inventory turnover days ( ) 12. Non-operating income ( ) – Income derived from activities other than sales of goods
Transcript of KPI report for retail chain stores in China (10,000-14,999 m 2) 17,989 274 0.22 38.5 35.00...

Li & Fung Research Centre China Chain Store & Franchise Association Member of the Li & Fung Group
1
2010 Q1
LI & FUNG RESEARCH CENTRE
CHINA CHAIN STORE & FRANCHISE ASSOCIATION
KPI report for retail chain stores in China
Foreword
About the KPI report
The China Chain Store & Franchise Association and the Li & Fung Research Centre have collaborated and established
the Key Performance Index System (hereafter the “KPI system”) for retail chain operators in China since 2007 and
published reports on a quarterly basis. The system aims to collect key performance indices of different format retail
stores in China.
In 2009, the data collection system are further upgraded and revised, and more store samples have been added. The
revised KPI report covers over 100 retail stores in China of 5 major formats, including convenience stores, supermarkets,
hypermarkets, department stores and home electronics appliance chains, of which supermarkets and hypermarkets are
further divided into several categories by operating area for easier references. We hope this report can shed some light
on the key development trends of China's retail chain stores.
About the indicators
Data of the following is collected in the KPI system –
1. Monthly sales (月度銷售額) – Pre-tax monthly sales value
2. Total operating area (總營業面積) – Including self-operating area and leasing area
3. Leasing area (對外租賃面積) – Area leased to other operators
4. Total staff number (員工總數) – Total number of staff including dispatched employees hired by labor agents (勞務派遣人員)
5. Total number of contract staff (正式員工數) – Total number of staff hired directly by the retailers
6. Total operating cost (成本及費用總額)
7. Total salaries and wages (工資總額)
8. Total number of SKUs (單品總數)
9. Number of SKUs distributing directly through the distribution centre (統一配送單品數)
10. Average daily number of transactions (平均日交易數)
11. Inventory turnover days (庫存周轉天數)
12. Non-operating income (營業外收入) – Income derived from activities other than sales of goods

Li & Fung Research Centre China Chain Store & Franchise Association Member of the Li & Fung Group
2
2010 Q1
LI & FUNG RESEARCH CENTRE
CHINA CHAIN STORE & FRANCHISE ASSOCIATION
Survey results by retail formats
Format Monthly sales (million yuan)
Average sales per m
2
(yuan/ m2/day)
Average sales per staff
(yuan/person/day)
Average customer spending
(yuan/visit)
Gross margin (%)
Convenience stores 0.29 88 1,256 14.00 18.84
Supermarkets (300-999 m2) 1.20 77 1,565 32.21 14.86
Supermarkets (1,000-1,999 m2) 3.08 76 1,512 45.20 15.84
Supermarkets (2,000-3,999 m2) 7.87 97 2,012 57.25 14.42
Supermarkets (4,000-5,999 m2) 13.61 99 2,107 61.40 12.57
Hypermarkets (6,000-9,999 m2) 16.99 75 1,977 74.98 13.39
Hypermarket (10,000-14,999 m2) 22.62 49 1,705 64.15 14.57
Hypermarket (over 15,000 m2) 28.87 53 1,531 105.22 12.32
Department stores 114.95 125 2,529 588.05 17.21
Home electronics appliance chains 24.13 115 3,113 1845.20 \
Format Cashier efficiency 1 (yuan/machine/day)
Cashier efficiency 2 (number of transaction/
machine /day)
% of damaged
goods
Inventory turnover (Days)
Average operating area per employee (m
2/employee)
Convenience stores 9880 673 0.14 15 14.00
Supermarkets (300-999 m2) 13,467 463 0.20 19 20.00
Supermarkets (1,000-1,999 m2) 12,929 292 0.19 23 19.85
Supermarkets (2,000-3,999 m2) 19,815 328 0.20 28 21.08
Supermarkets (4,000-5,999 m2) 19,024 244 0.16 34 21.19
Hypermarkets (6,000-9,999 m2) 16,651 154 0.20 25 26.54
Hypermarket (10,000-14,999 m2) 17,989 274 0.22 38.5 35.00
Hypermarket (over 15,000 m2) 22,592 201 0.23 27 35.65
Department stores 76,581 156 0.08 61 20.15
Home electronics appliance chains 92,938 62 \ \ 27.12

Li & Fung Research Centre China Chain Store & Franchise Association Member of the Li & Fung Group
3
2010 Q1
LI & FUNG RESEARCH CENTRE
CHINA CHAIN STORE & FRANCHISE ASSOCIATION
I. Convenience stores Average operating area: 112m
2
Average number of cash registers: 1 (i.e. 1 cash register for every 112 m2)
Monthly sales
0.250.28 0.29
0.33
0.280.32
0.290.22
0.23
0
0.05
0.1
0.15
0.2
0.25
0.3
0.35
Jul Aug Sep Oct Nov Dec Jan Feb Mar
(millio
n y
uan)
Average sales per m 2
7885 90
102
82
102
81
72
66
0
20
40
60
80
100
120
Jul Aug Sep Oct Nov Dec Jan Feb Mar
(yu
an
/ m2/d
ay)
Average sales per staff
1,0691,206 1,263
1,433
1,164
1,449
1,155910
989
0
500
1,000
1,500
2,000
Jul Aug Sep Oct Nov Dec Jan Feb Mar
(yuan/p
ers
on/d
ay)
Average customer spending
12.54
16.9
12.23 12.8113.83
15.7
13.17
16.05
11.61
0
5
10
15
20
Jul Aug Sep Oct Nov Dec Jan Feb Mar
(yuan/v
isit)
Cashier efficiency
0
200
400
600
800
Jul
Aug Sep Oct
Nov
Dec Ja
nFeb M
ar
(num
ber
of
transactio
n/
machin
e /day)
0
5,000
10,000
15,000
(yuan/m
achin
e/d
ay)
Eff iciency 2 (number of transaction/ machine /day)
Eff iciency 1 (yuan/machine/day)
Gross margin
19.31
18.8518.77
18.6218.54
18.9
19.08
19.5
19.51
18
18.2
18.4
18.6
18.8
19
19.2
19.4
19.6
Jul Aug Sep Oct Nov Dec Jan Feb Mar
(%)

Li & Fung Research Centre China Chain Store & Franchise Association Member of the Li & Fung Group
4
2010 Q1
LI & FUNG RESEARCH CENTRE
CHINA CHAIN STORE & FRANCHISE ASSOCIATION
Jan 10 Feb 10 Mar 10 Average Qoq %
1. Monthly sales (million yuan) 0.28 0.32 0.28 0.29 -1.7%
2. Average sales per m2
(yuan/ m2/day) 82 102 81 88 -3.9%
3. Average sales per staff
(yuan/person/day) 1164 1449 1155 1256 -3.5%
4. Average customer spending
(yuan/visit) 13.83 15.70 13.17 14 1.7%
5. Cashier efficiency 1
(yuan/machine/day) 9156 11401 9084 9880 0.7%
6. Cashier efficiency 2
(number of transaction/ machine /day) 664 610 745 673 -1.5%
7. Gross margin (%) 18.54 18.90 19.08 18.84 0.5%
8) % of damaged goods: 0.14%
9) Inventory turnover days: 15 days
10) Average operating area per employee (員工配置): 14 m2/employee

Li & Fung Research Centre China Chain Store & Franchise Association Member of the Li & Fung Group
5
2010 Q1
LI & FUNG RESEARCH CENTRE
CHINA CHAIN STORE & FRANCHISE ASSOCIATION
II. Supermarkets (divided into 4 groups according to operating area)
1. Supermarkets (300-999 m2)
Average operating area: 526 m2
Average number of cash registers: 4 (i.e. 1 for every 132 m2)
Monthly sales
1.14 1.07 1.031.21
1.12
1.51
0.96
1.11
0.99
0
0.2
0.4
0.6
0.8
1
1.2
1.4
1.6
Jul Aug Sep Oct Nov Dec Jan Feb Mar
(millio
n y
uan)
Average sales per m 2
72 66 6574 69
103
5963
68
0
20
40
60
80
100
120
Jul Aug Sep Oct Nov Dec Jan Feb Mar
(yu
an
/ m2/d
ay)
Average sales per staff
1,5791,443 1,4291,629
1,401
2,094
1,199
1,495
1,376
0
500
1,000
1,500
2,000
2,500
Jul Aug Sep Oct Nov Dec Jan Feb Mar
(yuan/p
ers
on/d
ay)
Average customer spending
33.4927.34 29.78
33.9228.49
39.32
28.8232.12
34.67
0
10
20
30
40
50
Jul Aug Sep Oct Nov Dec Jan Feb Mar
(yuan/v
isit)
Cashier efficiency
0
200
400
600
Jul
Aug Sep Oct
Nov
Dec Ja
nFeb M
ar
(num
ber
of
transactio
n/
machin
e /day)
0
5,000
10,000
15,000
20,000
(yuan/m
achin
e/d
ay)
Eff iciency 2 (number of transaction/ machine /day)
Eff iciency 1 (yuan/machine/day)
Gross margin
13.36
14.24
15.0614.81 14.73
15.114.73
13.89
14.05
12
12.5
13
13.5
14
14.5
15
15.5
Jul Aug Sep Oct Nov Dec Jan Feb Mar
(%)

Li & Fung Research Centre China Chain Store & Franchise Association Member of the Li & Fung Group
6
2010 Q1
LI & FUNG RESEARCH CENTRE
CHINA CHAIN STORE & FRANCHISE ASSOCIATION
Jan 10 Feb 10 Mar 10 Average Qoq %
1. Monthly sales (million yuan) 1.12 1.51 0.96 1.2 8.9%
2. Average sales per m2
(yuan/ m2/day)
69 103 59 77 13.2%
3. Average sales per staff
(yuan/person/day)
1401 2094 1199 1565 4.3%
4. Average customer spending
(yuan/visit)
28.49 39.32 28.82 32.21 6.1%
5. Cashier efficiency 1
(yuan/machine/day)
12060 18021 10321 13467 49.6%
6. Cashier efficiency 2
(number of transaction/
machine /day)
462 494 434 463 34.6%
7. Gross margin (%) 14.73 15.10 14.73 14.86 1.1%
8) % of damaged goods: 0.2%
9) Inventory turnover days: 19 days
10) Average operating area per employee (員工配置): 20 m2/employee

Li & Fung Research Centre China Chain Store & Franchise Association Member of the Li & Fung Group
7
2010 Q1
LI & FUNG RESEARCH CENTRE
CHINA CHAIN STORE & FRANCHISE ASSOCIATION
2. Supermarkets (1,000-1,999 m2)
Average operating area: 1,370 m2
Average number of cash registers: 8 (i.e. 1 for every 171 m2)
Monthly sales
2.81 2.84 2.79 2.93 2.98
3.54
2.722.56
2.5
0
0.5
1
1.5
2
2.5
3
3.5
4
Jul Aug Sep Oct Nov Dec Jan Feb Mar
(millio
n y
uan)
Average sales per m 2
69 67 68 69 70
92
64
61
61
0
20
40
60
80
100
Jul Aug Sep Oct Nov Dec Jan Feb Mar(y
uan/ m
2/d
ay)
Average sales per staff
1,1301,281 1,300 1,3201,406
1,848
1,281996
1,002
0
500
1,000
1,500
2,000
Jul Aug Sep Oct Nov Dec Jan Feb Mar
(yuan/p
ers
on/d
ay)
Average customer spending
55.91
40.96 42.7
50.53
39.24
56.55
39.8351.5939.83
0
10
20
30
40
50
60
Jul Aug Sep Oct Nov Dec Jan Feb Mar
(yuan/v
isit)
Cashier efficiency
260
280
300
320
340
Jul
Aug Sep Oct
Nov
Dec Ja
nFeb M
ar
(num
ber
of
transactio
n/
machin
e /day)
0
5,000
10,000
15,000
20,000
(yuan/m
achin
e/d
ay)
Eff iciency 2 (number of transaction/ machine /day)
Eff iciency 1 (yuan/machine/day)
Gross margin
15.3815.47
15.78
15.03
15.78
15.47
16.29
15.0115.29
14
14.5
15
15.5
16
16.5
Jul Aug Sep Oct Nov Dec Jan Feb Mar
(%)

Li & Fung Research Centre China Chain Store & Franchise Association Member of the Li & Fung Group
8
2010 Q1
LI & FUNG RESEARCH CENTRE
CHINA CHAIN STORE & FRANCHISE ASSOCIATION
Jan 10 Feb 10 Mar 10 Average Qoq %
1. Monthly sales (million yuan) 2.98 3.54 2.72 3.08 8.1%
2. Average sales per m2
(yuan/ m2/day)
70 92 64 76 11.2%
3. Average sales per staff
(yuan/person/day)
1406 1848 1281 1512 16.2%
4. Average customer spending
(yuan/visit)
39.24 56.55 39.83 45.20 1.1%
5. Cashier efficiency 1
(yuan/machine/day)
12023 15808 10957 12929 11.2%
6. Cashier efficiency 2
(number of transaction/
machine /day)
301 280 294 292 -1.8%
7. Gross margin (%) 15.78 15.47 16.29 15.84 2.8%
8) % of damaged goods: 0.19%
9) Inventory turnover days: 23 days
10) Average operating area per employee (員工配置): 19.85 m2/employee
Li & Fung Research Centre China Chain Store & Franchise Association Member of the Li & Fung Group
9
2010 Q1
LI & FUNG RESEARCH CENTRE
CHINA CHAIN STORE & FRANCHISE ASSOCIATION
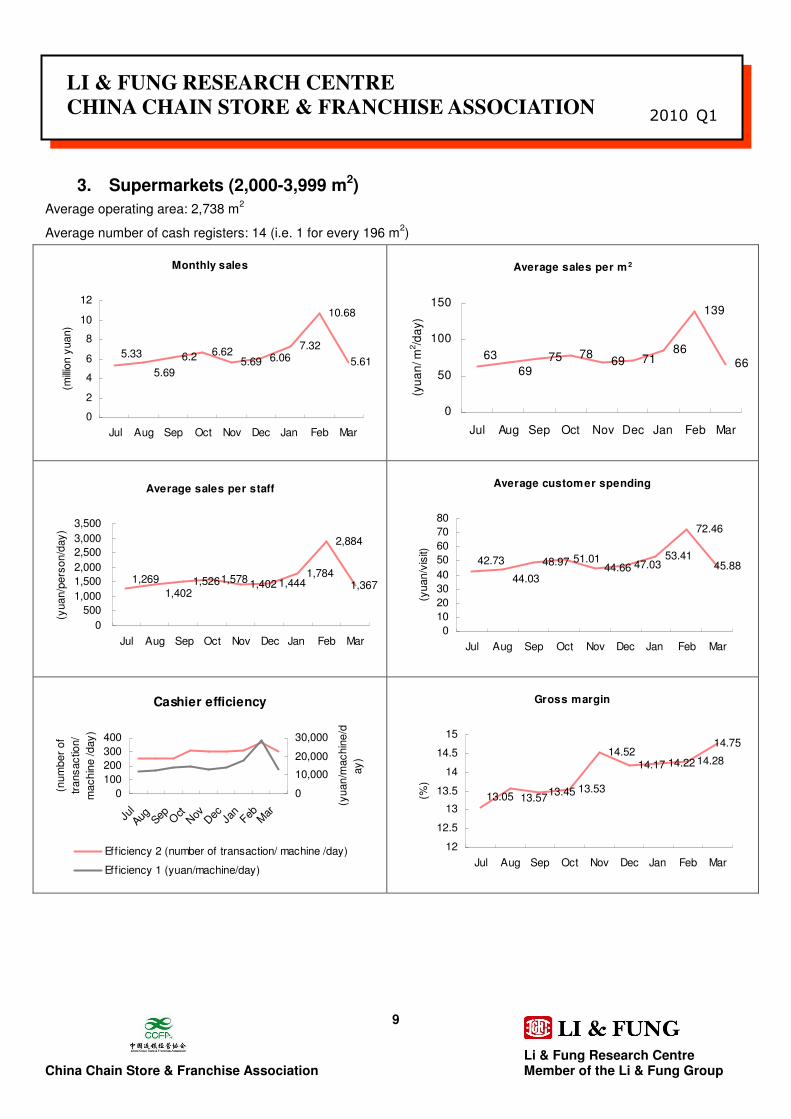
3. Supermarkets (2,000-3,999 m2)
Average operating area: 2,738 m2
Average number of cash registers: 14 (i.e. 1 for every 196 m2)
Monthly sales
6.2 6.625.69 6.06
7.32
10.68
5.615.33
5.69
0
2
4
6
8
10
12
Jul Aug Sep Oct Nov Dec Jan Feb Mar
(millio
n y
uan)
Average sales per m 2
75 7869 71
86
139
6669
63
0
50
100
150
Jul Aug Sep Oct Nov Dec Jan Feb Mar(y
ua
n/ m
2/d
ay)
Average sales per staff
1,5261,578 1,402 1,4441,784
2,884
1,3671,269
1,402
0
500
1,000
1,500
2,000
2,500
3,000
3,500
Jul Aug Sep Oct Nov Dec Jan Feb Mar
(yuan/p
ers
on/d
ay)
Average customer spending
48.97 51.0144.66 47.03
53.41
72.46
45.8844.03
42.73
0
10
20
30
40
50
60
70
80
Jul Aug Sep Oct Nov Dec Jan Feb Mar
(yuan/v
isit)
Cashier efficiency
0
100
200
300
400
Jul
Aug Sep Oct
Nov
Dec Ja
nFeb M
ar
(num
ber
of
transactio
n/
machin
e /day)
0
10,000
20,000
30,000
(yuan/m
achin
e/d
ay)
Eff iciency 2 (number of transaction/ machine /day)
Eff iciency 1 (yuan/machine/day)
Gross margin
13.45 13.53
14.5214.17 14.22 14.28
14.75
13.05 13.57
12
12.5
13
13.5
14
14.5
15
Jul Aug Sep Oct Nov Dec Jan Feb Mar
(%)

Li & Fung Research Centre China Chain Store & Franchise Association Member of the Li & Fung Group
10
2010 Q1
LI & FUNG RESEARCH CENTRE
CHINA CHAIN STORE & FRANCHISE ASSOCIATION
Jan 10 Feb 10 Mar 10 Average Qoq %
1. Monthly sales (million yuan) 7.32 10.68 5.61 7.87 28.4%
2. Average sales per m2
(yuan/ m2/day)
86 139 66 97 33.2%
3. Average sales per staff
(yuan/person/day)
1784 2884 1367 2012 36.4%
4. Average customer spending
(yuan/visit)
53.41 72.46 45.88 57.25 20.4%
5. Cashier efficiency 1
(yuan/machine/day)
17574 28407 13464 19815 40.1%
6. Cashier efficiency 2
(number of transaction/
machine /day)
313 373 297 328 6.7%
7. Gross margin (%) 14.22 14.28 14.75 14.42 2.5%
8) % of damaged goods: 0.2%
9) Inventory turnover days: 28 days
10) Average operating area per employee (員工配置): 21.08 m2/employee

Li & Fung Research Centre China Chain Store & Franchise Association Member of the Li & Fung Group
11
2010 Q1
LI & FUNG RESEARCH CENTRE
CHINA CHAIN STORE & FRANCHISE ASSOCIATION
4. Supermarkets (4,000-5,999 m2)
Average operating area: 4,640 m2
Average number of cash registers: 24 (i.e: 1 for every 193 m2)
Monthly sales
13.04
10.33 9.98
12.65 13.33
18.92
8.57
10.73
10.63
0
5
10
15
20
Jul Aug Sep Oct Nov Dec Jan Feb Mar
(millio
n y
uan)
Average sales per m 2
9472 72
88 93
146
60
75
77
0
50
100
150
200
Jul Aug Sep Oct Nov Dec Jan Feb Mar
(yu
an
/ m
2/d
ay)
Average sales per staff
1,7931,553 1,550
1,9011,967
3,090
1,264
1,429
1,463
0
500
1,000
1,500
2,000
2,500
3,000
3,500
Jul Aug Sep Oct Nov Dec Jan Feb Mar
(yuan/p
ers
on/d
ay)
Average customer spending
58.4447.11 45.96 43.93
61.27
78.93
44.0146.44
46.9
0
20
40
60
80
100
Jul Aug Sep Oct Nov Dec Jan Feb Mar
(yuan/v
isit)
Cashier efficiency
220
240
260
280
Jul
Aug Sep Oct
Nov
Dec Ja
nFeb M
ar
(num
ber
of
transactio
n/
machin
e /day)
0
10,000
20,000
30,000
(yuan/m
achin
e/d
ay)
Eff iciency 2 (number of transaction/ machine /day)
Eff iciency 1 (yuan/machine/day)
Gross margin
12.96 12.9512.69
12.15 12.17 12.09
13.46
12.37
12.41
11
11.5
12
12.5
13
13.5
14
Jul Aug Sep Oct Nov Dec Jan Feb Mar
(%)

Li & Fung Research Centre China Chain Store & Franchise Association Member of the Li & Fung Group
12
2010 Q1
LI & FUNG RESEARCH CENTRE
CHINA CHAIN STORE & FRANCHISE ASSOCIATION
Jan 10 Feb 10 Mar 10 Average Qoq %
1. Monthly sales (million yuan) 13.33 18.92 8.57 13.61 23.8%
2. Average sales per m2
(yuan/ m2/day)
93 146 60 99 29.2%
3. Average sales per staff
(yuan/person/day)
1967 3090 1264 2107 26.3%
4. Average customer spending
(yuan/visit)
61.27 78.93 44.01 61.40 34.4%
5. Cashier efficiency 1
(yuan/machine/day)
17758 27897 11417 19024 23.9%
6. Cashier efficiency 2
(number of transaction/
machine /day)
244 247 240 244 -3.7%
7. Gross margin (%) 12.17 12.09 13.46 12.57 -0.20%
8) % of damaged goods: 0.16%
9) Inventory turnover days: 34 days
10) Average operating area per employee (員工配置): 21.19 m2/employee

Li & Fung Research Centre China Chain Store & Franchise Association Member of the Li & Fung Group
13
2010 Q1
LI & FUNG RESEARCH CENTRE
CHINA CHAIN STORE & FRANCHISE ASSOCIATION
III. Hypermarkets (divided into 3 groups by operating areas)
1. Hypermarkets (6,000-9,999 m2)
Average operating area: 7,723 m2
Average number of cash registers: 35 (i.e. 1 for every 221 m2)
Monthly sales
9.91
13.11 12.08 13.0815.22
23.75
11.998.72
8.75
0
5
10
15
20
25
Jul Aug Sep Oct Nov Dec Jan Feb Mar
(millio
n y
uan)
Average sales per m2
4355 52 55
64
110
50
38
36
0
20
40
60
80
100
120
Jul Aug Sep Oct Nov Dec Jan Feb Mar
(yu
an
/ m
2/d
ay)
Average sales per staff
1,1431,455 1,385 1,451
1,687
2,915
1,329974
1,009
0
500
1,000
1,500
2,000
2,500
3,000
3,500
Jul Aug Sep Oct Nov Dec Jan Feb Mar
(yuan/p
ers
on/d
ay)
Average customer spending
60.55 57.89 56.84 57.4665.98
95.22
63.74
52.87
54.49
0
20
40
60
80
100
Jul Aug Sep Oct Nov Dec Jan Feb Mar
(yuan/v
isit)
Cashier efficiency
130140150160170180
Jul
Aug Sep Oct
Nov
Dec Ja
nFeb M
ar
(num
ber
of
transactio
n/
machin
e /day)
0
10,000
20,000
30,000
(yuan/m
achin
e/d
ay)
Eff iciency 2 (number of transaction/ machine /day)
Eff iciency 1 (yuan/machine/day)
Gross margin
12.1212.36
12.6412.36
13.13
12.59
14.43
12.43
12.11
10.511
11.512
12.513
13.514
14.515
Jul Aug Sep Oct Nov Dec Jan Feb Mar
(%)

Li & Fung Research Centre China Chain Store & Franchise Association Member of the Li & Fung Group
14
2010 Q1
LI & FUNG RESEARCH CENTRE
CHINA CHAIN STORE & FRANCHISE ASSOCIATION
Jan 10 Feb 10 Mar 10 Average Qoq %
1. Monthly sales (million yuan) 15.22 23.75 11.99 16.99 33.1%
2. Average sales per m2
(yuan/m2/day)
64 110 50 75 38.0%
3. Average sales per staff
(yuan/person/day)
1687 2915 1329 1977 38.2%
4. Average customer spending
(yuan/visit)
65.98 95.22 63.74 74.98 30.6%
5. Cashier efficiency 1
(yuan/machine/day)
14208 24549 11196 16651 43.1%
6. Cashier efficiency 2
(number of transaction/
machine /day)
163 151 149 154 3.7%
7. Gross margin (%) 13.13 12.59 14.43 13.39 7.5%
8) % of damaged goods: 0.2%
9) Inventory turnover days: 25 days
10) Average operating area per employee (員工配置): 26.54 m2/employee

Li & Fung Research Centre China Chain Store & Franchise Association Member of the Li & Fung Group
15
2010 Q1
LI & FUNG RESEARCH CENTRE
CHINA CHAIN STORE & FRANCHISE ASSOCIATION
2. Hypermarket (10,000-14,999 m2)
Average operating area: 10,676 m2
Average number of cash registers: 29 (i.e. 1 for every 368 m2)
Monthly sales
13.2115.74
12.36 12.76 13.77
20.66
11.7311.41
12.83
0
5
10
15
20
25
Jul Aug Sep Oct Nov Dec Jan Feb Mar
(mill
ion y
uan)
Average sales per m 2
4148
39 39 42
69
354034
0
20
40
60
80
Jul Aug Sep Oct Nov Dec Jan Feb Mar
(yu
an
/ m2/d
ay)
Average sales per staff
1,4341,612
1,308 1,3061,456
2,419
1,2411,199
1,393
0
500
1,000
1,500
2,000
2,500
3,000
Jul Aug Sep Oct Nov Dec Jan Feb Mar
(yuan/p
ers
on/d
ay)
Average customer spending
59.39
72.4
58.48
70.78
59.71
75.84
56.91
53.22
51.75
0
10
20
30
40
50
60
70
80
Jul Aug Sep Oct Nov Dec Jan Feb Mar
(yuan/v
isit)
Cashier efficiency
0
100
200
300
400
Jul
Aug Sep Oct
Nov
Dec Ja
nFeb M
ar
(num
ber
of
transactio
n/
machin
e /day)
0
10,000
20,000
30,000
(yuan/m
achin
e/d
ay)
Eff iciency 2 (number of transaction/ machine /day)
Eff iciency 1 (yuan/machine/day)
Gross margin
13.9414.09
14.1814.06
14.63 14.6214.47
14.23
14.09
13.4
13.6
13.8
14
14.2
14.4
14.6
14.8
Jul Aug Sep Oct Nov Dec Jan Feb Mar
(%)

Li & Fung Research Centre China Chain Store & Franchise Association Member of the Li & Fung Group
16
2010 Q1
LI & FUNG RESEARCH CENTRE
CHINA CHAIN STORE & FRANCHISE ASSOCIATION
Jan 10 Feb 10 Mar 10 Average Qoq %
1. Monthly sales (million yuan) 13.77 20.66 11.73 15.39 13.0%
2. Average sales per m2
(yuan/ m2/day)
42 69 35 49 16.0%
3. Average sales per staff
(yuan/person/day)
1456 2419 1241 1705 21.0%
4. Average customer spending
(yuan/visit) 59.71 75.84 56.91 64.15 -4.6%
5. Cashier efficiency 1
(yuan/machine/day)
15360 25517 13089 17989 21.1%
Cashier efficiency 2
(number of transaction/
machine /day)
269 311 241 274 8.6%
6. Gross margin (%) 14.63 14.62 14.47 14.57 3.3%
8) % of damaged goods: 0.22%
9) Inventory turnover days: 38.5 days
10) Average operating area per employee (員工配置): 35 m2/employee

Li & Fung Research Centre China Chain Store & Franchise Association Member of the Li & Fung Group
17
2010 Q1
LI & FUNG RESEARCH CENTRE
CHINA CHAIN STORE & FRANCHISE ASSOCIATION
3. Hypermarket (over 15,000 m2)
Average operating area: 18,431 m2
Average number of cash registers: 43 (i.e. 1 for every 429 m2)
Monthly sales
23.29 23.7521.31
23.49
28.31
35.91
22.3822.18
23.26
0
5
10
15
20
25
30
35
40
Jul Aug Sep Oct Nov Dec Jan Feb Mar
(millio
n y
uan)
Average sales per m 2
42 42 39 4150
70
3942
39
0
20
40
60
80
Jul Aug Sep Oct Nov Dec Jan Feb Mar
(yu
an
/ m2/d
ay)
Average sales per staff
1,5281,528 1,417 1,5111,437
2,019
1,136
1,4081,526
0
500
1,000
1,500
2,000
2,500
Jul Aug Sep Oct Nov Dec Jan Feb Mar
(yuan/p
ers
on/d
ay)
Average customer spending
82.39 80.17 80.3 82.8897.38
135.21
83.08
76.49
78.01
0
20
40
60
80
100
120
140
160
Jul Aug Sep Oct Nov Dec Jan Feb Mar
(yuan/v
isit)
Cashier efficiency
160
180
200
220
240
Jul
Aug Sep Oct
Nov
Dec Ja
nFeb M
ar
(num
ber
of
transactio
n/
machin
e /day)
0
10,000
20,000
30,000
40,000
(yuan/m
achin
e/d
ay)
Eff iciency 2 (number of transaction/ machine /day)
Eff iciency 1 (yuan/machine/day)
Gross margin
10.9811.27
11.63 11.58
12.23 12.13
12.61
10.82
10.68
9.5
10
10.5
11
11.5
12
12.5
13
Jul Aug Sep Oct Nov Dec Jan Feb Mar
(%)

Li & Fung Research Centre China Chain Store & Franchise Association Member of the Li & Fung Group
18
2010 Q1
LI & FUNG RESEARCH CENTRE
CHINA CHAIN STORE & FRANCHISE ASSOCIATION
Jan 10 Feb 10 Mar 10 Average Qoq %
1. Monthly sales (million yuan) 28.31 35.91 22.38 28.87 26.3%
2. Average sales per m2
(yuan/m2/day)
50 70 39 53 31.9%
3. Average sales per staff
(yuan/person/day)
1437 2019 1136 1531 3.1%
4. Average customer spending
(yuan/visit)
97.38 135.21 83.08 105.22 29.7%
5. Cashier efficiency 1
(yuan/machine/day)
21211 29796 16768 22592 46.5%
6. Cashier efficiency 2
(number of transaction/
machine /day)
192 220 190 201 0.3%
7. Gross margin (%) 12.23 12.13 12.61 12.32 7.2%
8) % of damaged goods: 0.23%
9) Inventory turnover days: 27 days
10) Average operating area per employee (員工配置): 35.65 m2/employee

Li & Fung Research Centre China Chain Store & Franchise Association Member of the Li & Fung Group
19
2010 Q1
LI & FUNG RESEARCH CENTRE
CHINA CHAIN STORE & FRANCHISE ASSOCIATION
IV. Department stores Average operating area: 31,079 m
2
Average number of cash registers: 49 (i.e. 1 for every 634 m2)
Monthly sales
90.13101.0797.01
110.9116.35
137.77
90.7366.37
73.87
0
20
40
60
80
100
120
140
160
Jul Aug Sep Oct Nov Dec Jan Feb Mar
(millio
n y
uan)
Average sales per m2
99 106 105120 121
158
97
8170
0
50
100
150
200
Jul Aug Sep Oct Nov Dec Jan Feb Mar
(yu
an
/ m2/d
ay)
Average sales per staff
1,9032,097 2,080
2,3772,434
3,191
1,9611,356
1,560
0
500
1,000
1,500
2,000
2,500
3,000
3,500
Jul Aug Sep Oct Nov Dec Jan Feb Mar
(yuan/p
ers
on/d
ay)
Average customer spending
451.23
310.73
542.49561.14618.97617.08
528.09
423.33
392.78
0
100
200
300
400
500
600
700
Jul Aug Sep Oct Nov Dec Jan Feb Mar
(yuan/v
isit)
Cashier efficiency
0
50
100
150
200
Jul AugSepOctNovDecJan FebMar
(num
ber
of
transactio
n/ m
achin
e
/day)
0
20,000
40,000
60,000
80,000
100,000
120,000
(yuan/m
achin
e/d
ay)
Eff iciency 2 (number of transaction/ machine /day)
Eff iciency 1 (yuan/machine/day)
Gross margin
16.97
16.18
17.4416.94
16.17
16.77
18.7
17.52
17.64
14.515
15.516
16.517
17.518
18.519
Jul Aug Sep Oct Nov Dec Jan Feb Mar
(%)
Li & Fung Research Centre China Chain Store & Franchise Association Member of the Li & Fung Group
20
2010 Q1
LI & FUNG RESEARCH CENTRE
CHINA CHAIN STORE & FRANCHISE ASSOCIATION
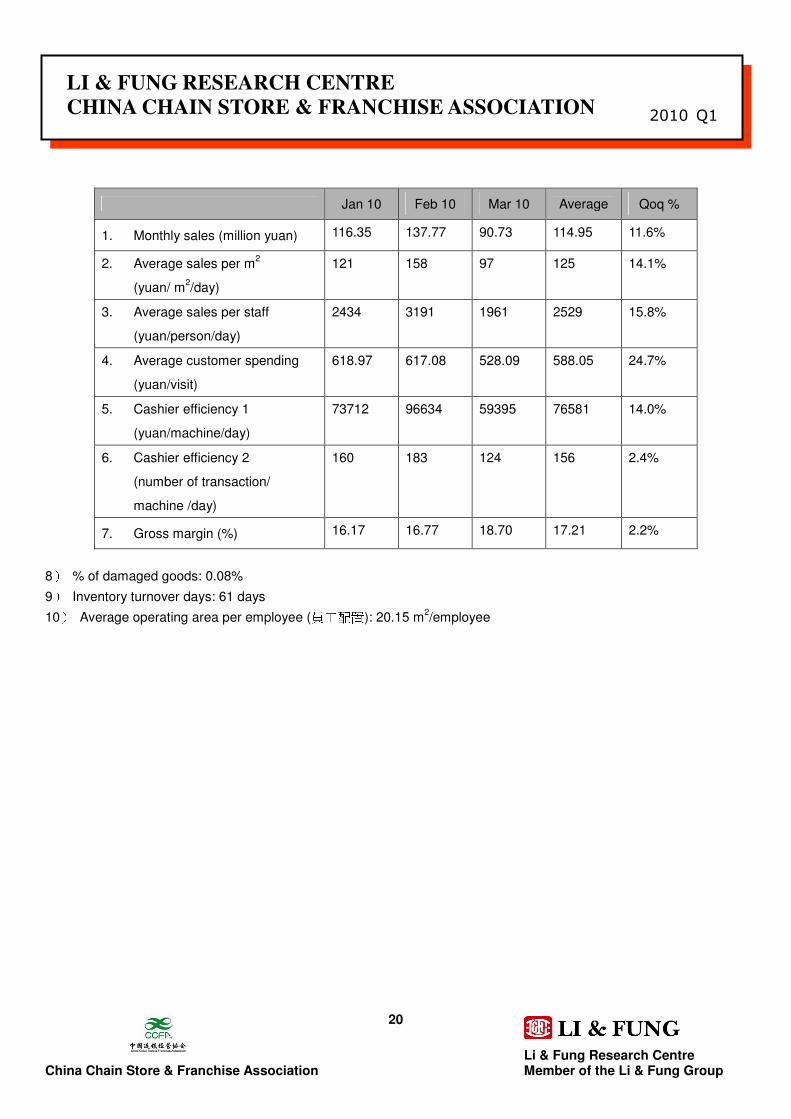
Jan 10 Feb 10 Mar 10 Average Qoq %
1. Monthly sales (million yuan) 116.35 137.77 90.73 114.95 11.6%
2. Average sales per m2
(yuan/ m2/day)
121 158 97 125 14.1%
3. Average sales per staff
(yuan/person/day)
2434 3191 1961 2529 15.8%
4. Average customer spending
(yuan/visit)
618.97 617.08 528.09 588.05 24.7%
5. Cashier efficiency 1
(yuan/machine/day)
73712 96634 59395 76581 14.0%
6. Cashier efficiency 2
(number of transaction/
machine /day)
160 183 124 156 2.4%
7. Gross margin (%) 16.17 16.77 18.70 17.21 2.2%
8) % of damaged goods: 0.08%
9) Inventory turnover days: 61 days
10) Average operating area per employee (員工配置): 20.15 m2/employee

Li & Fung Research Centre China Chain Store & Franchise Association Member of the Li & Fung Group
21
2010 Q1
LI & FUNG RESEARCH CENTRE
CHINA CHAIN STORE & FRANCHISE ASSOCIATION
V. Home electronics appliance chains Average operating area: 6970m
2
Average number of cash registers: 9 (i.e. 1 for every 774 m2)
Monthly sales
39.06
60.08
32.1 29.38
18.2624.7324.13
28.91
26.85
0
10
20
30
40
50
60
70
Jul Aug Sep Oct Nov Dec Jan Feb Mar
(millio
n y
uan)
Average sales per m 2
93
127
70
194
136
94114
64
66
0
50
100
150
200
250
Jul Aug Sep Oct Nov Dec Jan Feb Mar
(yu
an
/ m2/d
ay)
Average sales per staff
4,4045,300
2,926
8,077
3,6922,540
3,1083,154
3,027
0
2,000
4,000
6,000
8,000
10,000
Jul Aug Sep Oct Nov Dec Jan Feb Mar
(yuan/p
ers
on/d
ay)
Average customer spending
1,4611,669
1,5531,497
2,060
1,7371,739
1,440
1,400
0
500
1,000
1,500
2,000
2,500
Jul Aug Sep Oct Nov Dec Jan Feb Mar
(yuan/v
isit)
Cashier efficiency
0
50
100
150
Jul
Aug Sep Oct
Nov
Dec Ja
nFeb M
ar
(num
ber
of
transactio
n/
machin
e /day)
0
50,000
100,000
150,000
200,000
(yuan/m
achin
e/d
ay)
Eff iciency 2 (number of transaction/ machine /day)
Eff iciency 1 (yuan/machine/day)

Li & Fung Research Centre China Chain Store & Franchise Association Member of the Li & Fung Group
22
2010 Q1
LI & FUNG RESEARCH CENTRE
CHINA CHAIN STORE & FRANCHISE ASSOCIATION
Jan 10 Feb 10 Mar 10 Average Qoq %
1. Monthly sales (million yuan) 29.38 18.26 24.73 24.13 n.a.
2. Average sales per m2
(yuan/m2/day)
136 94 114 115 n.a.
3. Average sales per staff
(yuan/person/day)
3692 2540 3108 3113 n.a.
4. Average customer spending
(yuan/visit)
2060.20 1736.60 1738.80 1845.20 n.a.
5. Cashier efficiency 1
(yuan/machine/day)
110218 75827 92768 92938 n.a.
6. Cashier efficiency 2
(number of transaction/
machine /day)
72 57 55 62 n.a.
7) % of damaged goods: n.a.
8) Inventory turnover days: n.a.
9) Average operating area per employee (員工配置): 27.12 m2/employee

Li & Fung Research Centre China Chain Store & Franchise Association Member of the Li & Fung Group
23
2010 Q1
LI & FUNG RESEARCH CENTRE
CHINA CHAIN STORE & FRANCHISE ASSOCIATION
Recent highlights of the retail chain operators (Press release from the “Top 100 retail chain operators, 2009” of the China Chain Store & Franchise Association)
1. Top 100 retailers accounted for around one-tenth of total market share in 2009;
sales growth was the slowest in a decade
Every year the China Chain Store and Franchise Association (CCFA) released the “the top 100 retail chain operators”
(the Top 100s) in March. According to the CCFA, the Top 100s achieved total sales revenue of 1,360 billion yuan, up by
13.5% yoy in 2009; it was the slowest since records by the CCFA began in 1999.
According to the National Bureau of Statistics, total retail sales of consumer goods reached 12,534.3 billion yuan in 2009,
up nominally by 15.5% yoy. The real growth was 16.9% yoy, 2.1 ppt. higher than that in 2008. Growth of total retail sales
of consumer goods was faster than that of the Top 100s in 2009; however, it should be noted that automobile, furniture,
and building and decoration materials demonstrated the most impressive growth among all retail sales categories in
2009; sales grew by 32.3%, 35.5% and 26.6% respectively. Meanwhile, sales of grain was up only by 13%; and sales of
meat, poultry and eggs grew only by 8.3%. Taking the fact that consumer staples have a big proportion of goods sold by
the Top 100s into account, the Top 100s continued to outperform industry counterparts in 2009.
In 2009, the total sales revenue of the Top 100s accounted for 10.9% of the total retail sales of consumer goods. Share
of sales of the Top 100s in total retail sales of consumer goods in China slightly declined and China’s retail landscape
remains highly fragmented.
The total number of stores of the Top 100s in 2009 was 137,000, rising by 18.9% yoy. Retailers generally remained
cautious in respective capital expenditure in 2009.
Exhibit 1 demonstrates the Top 10 retail chain operators in China in 2009. Suning Appliances Co. Ltd overtook Gome
Electrical Appliance Group to top the list in 2009. Gome came in second and was followed by the Bailian Group, the
Dashang Group and the China Resources Vanguard Co. Ltd.

Li & Fung Research Centre China Chain Store & Franchise Association Member of the Li & Fung Group
24
2010 Q1
LI & FUNG RESEARCH CENTRE
CHINA CHAIN STORE & FRANCHISE ASSOCIATION
Exhibit 1: Top 10 retail chain operators in China, 2009
Ranking Enterprise Sales volume (million yuan)
yoy growth (%)
Number of stores
yoy growth (%)
Place of origin
Major formats in China
Suning Appliance Co., Ltd. 1 蘇寧電器集團
117,002.67 14.3 941 15.9 Chinese Mainland
Electronics specialty
Gome Electrical Appliance Group 國美電器集團
106,801.65 2.1 1170 -14.1 Chinese Mainland
Electronics specialty
Of which: Sanlian Commercial Co., Ltd
2
其中:三聯商社股份有限公司 1379.96 -27.0 5 -37.5 Chinese Mainland
Electronics specialty, real estate, telecommunications,Hospitality, media
Bailian Group Co., Ltd (Brilliance Group)
3 百聯集團有限公司
97,915.37 3.8 6153 -4.1 Chinese Mainland
Supermarket, department store, specialty store, shopping mall, convenience store
Of which: Lianhua Supermarket Holdings Co., Ltd. (Include Shanghai Hualian Supermarket Co., Ltd. )
其中: 聯華超市股份有限公司
(含:華聯超市股份有限公司)
67,169.78 3.2 5599 -4.7 Chinese Mainland
Hypermarket, supermarket, convenience store
Hualian Group GMS Shopping Center Co.,Ltd.
華聯集團吉買盛購物中心有限公司
3,926.18 -2.9 22 4.8 Chinese Mainland
Hypermarket , Supermarket
Homemart Decoration Co., Ltd. 好美家裝潢建材有限公司
2,100 -17.0 14 -44.0 Chinese Mainland
Home improvement specialty
Dalian Dashang Group Co., Ltd. 4 大連大商集團有限公司
70,535.90 12.8 160 6.7 Chinese Mainland
Department store, shopping mall, hypermarket, supermarket, specialty store, real estate, catering and entertainment
China Resources Vanguard Co., Ltd. 5 華潤萬家有限公司
68,000.00 6.6 2926 8.5 Chinese Mainland
Hypermarket, supermarket, convenience store
of which: Suguo Supermarket Co. Ltd.
其中: 蘇果超市有限公司
33,236.00 9.5 1852 2.8 Chinese Mainland
Supermarket, convenience store
RT-Mart Shanghai 6 康誠投資(中國)有限公司(大潤發)
40,431.69 20.5 121 19.8 Taiwan Hypermarket, supermarket, convenience store, shopping mall
Carrefour China Inc. 7 家樂福(中國)管理諮詢服務有限公司
36,600.00 8.2 156 16.4 France Hypermarket

Li & Fung Research Centre China Chain Store & Franchise Association Member of the Li & Fung Group
25
2010 Q1
LI & FUNG RESEARCH CENTRE
CHINA CHAIN STORE & FRANCHISE ASSOCIATION
Ranking Enterprise Sales
volume (million yuan)
yoy growth (%)
Number of stores
yoy growth (%)
Place of origin
Major formats in China
Anhui Huishang Group Co.,Ltd. 安徽省徽商集團有限公司 34,378.83 13.5 2884 15.5 Logistics
Of which: Shangzhidu Co. ltd.
安徽商之都股份有限公司 7,264.13 14.6 928 41.9 Department store
Huishang Nongjiafu Co. Ltd.
8
安徽徽商農家福有限公司 1,844.90 4.9 1918 6.2
Chinese Mainland
Agricultural store
Wal-Mart (China) Investment Co., Ltd. 9 沃爾瑪(中國)投資有限公司
34,000.00 22.2 175 45.8 United States
Hypermarket, shopping mall
Wumart Group 10 物美控股集團有限公司
32,700.00* 6.7 2333 16.1 Chinese Mainland
Hypermarket
of which: Beijing MerryMart Chainstores Development Ltd.
其中: 北京美廉美連鎖商業有限公司
4,365.96 6.6 35 12.9 Chinese Mainland
Supermarket
ZheJiang Gongxiao Supermarket 浙江供銷超市有限公司
2,202.07 10.1 2000 4.2 Chinese Mainland
Supermarket
* Estimated value
Source: China Chain Store and Franchise Association (CCFA)
2. Foreign retailers achieved more impressive performance
According to the CCFA, there were 20 foreign retailers among the Top 100s in 2009. In 2009, growth rates of the foreign
retailers among the Top 100s in terms of sales and number of stores were 20.4% yoy and 15.7% yoy respectively,
improving from 17.6% yoy and 13.1% yoy in 2008. Besides, the top foreign retailers achieved more remarkable
same-store-sales in 2009 than their domestic counterparts. In 2009, Taiwan-based RT-Mart replaced Carrefour to
become the largest foreign retailer in China; it ranked sixth in the Top 100s.
Foreign retailers tend to adopt a more focused approach in their operations in China. For instance, TESCO, Carrefour
and Wal-Mart, operate mostly hypermarkets in China; and 7-Eleven focus on convenience stores businesses. According
to the CCFA, most of the foreign retailers among the Top 100s focused on the hypermarket format. On the other hand, a
large number of domestic retailers among the Top 100s, such as Dalian Dashang Group Co., Ltd., Wuhan Zhongbai
Group Co., Ltd., Wuhan Wushang Group Co., Ltd. and the Bailian Group Co., Ltd., adopt multi-format business
operations - many operate a variety of retail formats such as supermarkets, department stores, specialty stores and
convenience stores, etc. Besides, it is not uncommon to find domestic retailers engage in other business activities in
China such as hospitality and catering, trading, logistics and real estate businesses.

Li & Fung Research Centre China Chain Store & Franchise Association Member of the Li & Fung Group
26
2010 Q1
LI & FUNG RESEARCH CENTRE
CHINA CHAIN STORE & FRANCHISE ASSOCIATION
About the Organizations
The China Chain Store & Franchise Association
中國連鎖經營協會中國連鎖經營協會中國連鎖經營協會中國連鎖經營協會
Founded in 1997, the China Chain Store & Franchise Association (CCFA) is an official representative of the retailing and
franchise industry in China. Currently, there are 800 enterprise members with 160,000 outlets, including domestic &
overseas retailers, franchisers, suppliers, and relevant organizations. The total sales of China’s “Top 100 retail chain
operators”, which are part of the members of the CCFA, exceeded RMB 1.2 trillion in 2008, with more than 12,000
stores in total.
CCFA participates in policymaking and coordination, safeguards the interests of industry and members, provides a
series of professional trainings and industry information and data for its members and establishes platforms for
exchange and cooperation.
Li & Fung Group
利豐集團利豐集團利豐集團利豐集團
The Li & Fung Group is a Hong Kong-based multinational company with three distinct core businesses: export sourcing,
distribution and logistics, and retailing. Founded in Guangzhou in 1906, the Li & Fung Group achieved an annual
turnover of around US$16.7 billion in 2008. Today, the Li & Fung Group operates in some 40 countries and regions and
employs over 35,000 people worldwide. One of its core competencies is “Supply Chain Management” (SCM).
Li & Fung Research Centre
利豐研究中心利豐研究中心利豐研究中心利豐研究中心
Li & Fung Research Centre is the research institute of the Li & Fung Group. It serves as a knowledge bank on China's
economy, industries, logistics and distribution sector, with its research scope covering the whole spectrum of the entire
supply chain, from ideas, production, distribution, retailing to consumers. It also offers research analyses and consulting
services to colleagues and clients to assist them in their day-to-day decision-making.
© Copyright 2010 Li & Fung Research Centre and the China Chain Store & Franchise Association (CCFA). All rights reserved.
Though Li & Fung Research Centre and CCFA endeavor to have information presented in this document as accurate and updated as possible, it accepts no responsibility for any error, omission or misrepresentation. Li & Fung Research Centre, CCFA and/or their associates accept no responsibility for any direct, indirect or consequential loss that may arise from the use of information contained in this document. Reproduction or redistribution of this material without Li & Fung Research Centre and CCFA’s prior written consent is prohibited.