KPI CATALOGUE FOR EACH USE CASE - iof2020.eu · by the development of a KPI catalogue and...
22
IoF2020 has received funding from the European Union’s Horizon 2020 research and innovation programme under grant agreement no. 731884. Visit iof2020.eu for more information about the project. KPI CATALOGUE FOR EACH USE CASE Methodology for the economic impact measurement for IoF2020 IoT use cases. September 22, 2017 WP 4
Transcript of KPI CATALOGUE FOR EACH USE CASE - iof2020.eu · by the development of a KPI catalogue and...

IoF2020 has received funding from the European Union’s Horizon 2020 research and innovation programme under grant agreement no. 731884. Visit iof2020.eu for more information about the project.
KPI CATALOGUE FOR EACH USE CASE
Methodology for the economic impact measurement for IoF2020 IoT use cases.
September 22, 2017
WP 4

KPI Catalogue for each use case 2 / 22
DOCUMENT IDENTIFICATION
Project Acronym IoF2020
Project Full Title Internet of Food and Farm 2020
Project Number 731884
Starting Date January 1st, 2017
Duration 4 years
H2020 Call ID & Topic IOT-01-2016
Date of the DoA 2017-2021
Website www.iof2020.eu
File Name KPI Catalogue for each use case
Date September 22, 2017
Version 1.1
Status Final
Dissemination level PU: Public
Authors Gohar Nuhoff-Isakhanyan, Jan Willem Kruize, Alexander Berlin
Contact details of the coordinator
George Beers

KPI Catalogue for each use case 3 / 22
PROJECT SUMMARY
The internet of things (IoT) has a revolutionary potential. A smart web of sensors, actuators, cameras, robots, drones and other connected devices allows for an unprecedented level of control and automated decision-making. The project Internet of Food & Farm 2020 (IoF2020) explores the potential of IoT-technologies for the European food and farming industry.
The goal is ambitious: to make precision farming a reality and to take a vital step towards a more
sustainable food value chain. With the help of IoT technologies higher yields and better-quality
produce are within reach. Pesticide and fertilizer use will drop and overall efficiency is optimized. IoT
technologies also enable better traceability of food, leading to increased food safety.
Nineteen use-cases organised around five trials (arable, dairy, fruits, meat and vegetables) develop,
test and demonstrate IoT technologies in an operational farm environment all over Europe, with the
first results expected in the first quarter of 2018.
IoF2020 uses a lean multi-actor approach focusing on user acceptability, stakeholder engagement
and the development of sustainable business models. IoF2020 aims to increase the economic viability
and market share of developed technologies, while bringing end-users’ and farmers’ adoption of these
technological solutions to the next stage. The aim of IoF2020 is to build a lasting innovation
ecosystem that fosters the uptake of IoT technologies. Therefore, key stakeholders along the food
value chain are involved in IoF2020, together with technology service providers, software companies
and academic research institutions.
Led by the Wageningen University and Research (WUR), the 70+ members consortium includes
partners from agriculture and ICT sectors, and uses open source technology provided by other
initiatives (e.g. FIWARE). IoF2020 is part of Horizon2020 Industrial Leadership and is supported by
the European Commission with a budget of €30 million.
KPI Catalogue for each use case 4 / 22
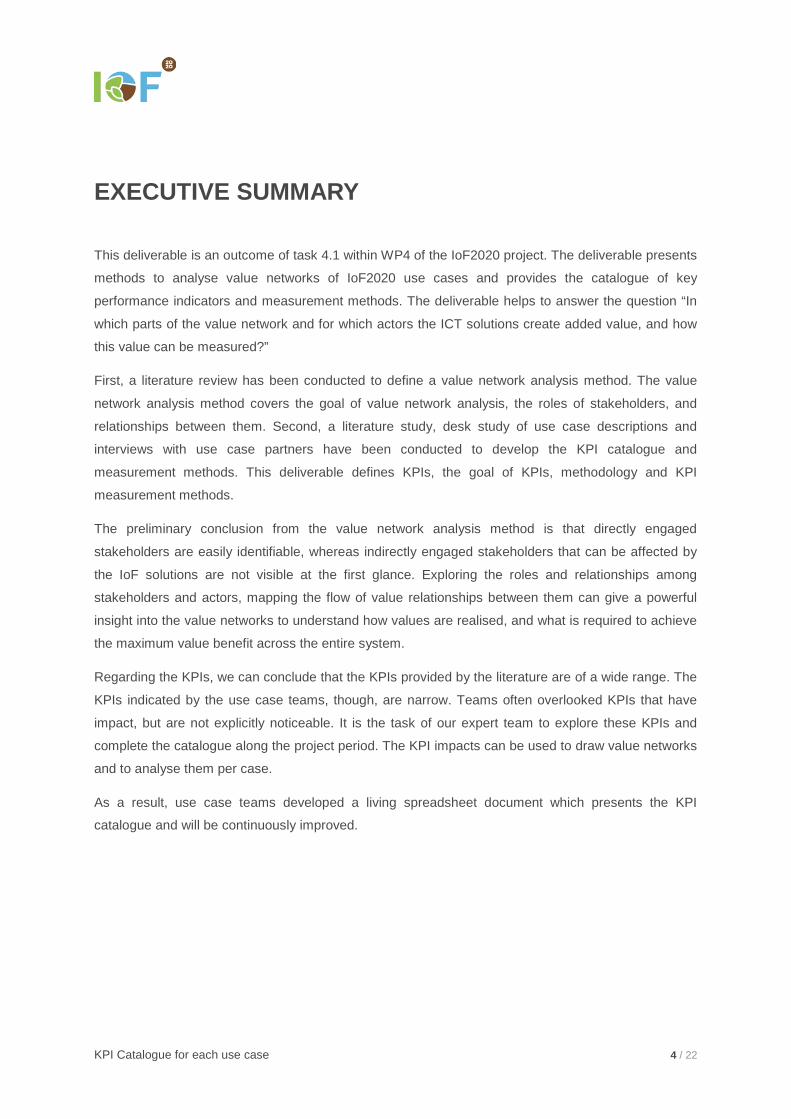
EXECUTIVE SUMMARY
This deliverable is an outcome of task 4.1 within WP4 of the IoF2020 project. The deliverable presents
methods to analyse value networks of IoF2020 use cases and provides the catalogue of key
performance indicators and measurement methods. The deliverable helps to answer the question “In
which parts of the value network and for which actors the ICT solutions create added value, and how
this value can be measured?”
First, a literature review has been conducted to define a value network analysis method. The value
network analysis method covers the goal of value network analysis, the roles of stakeholders, and
relationships between them. Second, a literature study, desk study of use case descriptions and
interviews with use case partners have been conducted to develop the KPI catalogue and
measurement methods. This deliverable defines KPIs, the goal of KPIs, methodology and KPI
measurement methods.
The preliminary conclusion from the value network analysis method is that directly engaged
stakeholders are easily identifiable, whereas indirectly engaged stakeholders that can be affected by
the IoF solutions are not visible at the first glance. Exploring the roles and relationships among
stakeholders and actors, mapping the flow of value relationships between them can give a powerful
insight into the value networks to understand how values are realised, and what is required to achieve
the maximum value benefit across the entire system.
Regarding the KPIs, we can conclude that the KPIs provided by the literature are of a wide range. The
KPIs indicated by the use case teams, though, are narrow. Teams often overlooked KPIs that have
impact, but are not explicitly noticeable. It is the task of our expert team to explore these KPIs and
complete the catalogue along the project period. The KPI impacts can be used to draw value networks
and to analyse them per case.
As a result, use case teams developed a living spreadsheet document which presents the KPI
catalogue and will be continuously improved.

KPI Catalogue for each use case 5 / 22
TABLE OF CONTENTS
EXECUTIVE SUMMARY 4
LIST OF ABBREVIATIONS 6
1. INTRODUCTION 7
2. VALUE NETWORK ANALYSIS METHOD 8
Definition value networks 8
Goal of value network analysis 8
Roles 8
Stakeholders 9
Relationships 9
2.1. KEY PERFORMANCE INDICATORS 10
Definition KPIs 10
Methodology 10
3. KPI MEASUREMENT 12
KPI underlying indicators 12
Measurement units 13
Data input 13
Data storage 14
Refining the data 15
3.1. KPI CATALOGUE OUTLINE 15
4. CONCLUSIONS 21
General conclusions 21
Next actions 22
5. REFERENCES 22

KPI Catalogue for each use case 6 / 22
LIST OF ABBREVIATIONS
ICT – Information and Communication Technologies
IoF – Internet of Food and Farm
IoT – Internet of Things
KPI – Key Performance Indicator
MVP – Minimum Viable Product
KPI Catalogue for each use case 7 / 22
1. INTRODUCTION Currently, ICTs transform business processes in many industries. Companies in agriculture use ICT
components, such as computer-based systems and data to monitor, plan and control processes
(Kruize, 2017).
ICT components usually do not function stand alone, but often as part of a larger integrated system
(Kruize, 2017). Integration of ICT components requires that various actors collaborate in their
development and exploitation (Kruize, 2017). Farmers can benefit from (integrated) ICT components.
Benefits are, among others, increased yields, decreased environmental impact, eased cross-
compliance and product traceability, increased efficiency of resource use, better animal health and
welfare, reduced pre- and post-harvest losses, increased quality, improved production control
throughout the supply chain, optimized labour (IoF2020 proposal).
Urged to apply ICT components in their business strategies, companies extensively search for new
business models that enable collaboration with related actors. However, the available business
models often reflect one perspective and offer one best option for companies as such. New
complementary business models are needed to offer companies alternative business options to
implement and create integrated plans, set and solve challenging objectives in ICT component
integration, create a view on the business development opportunities and challenges.
Value network analysis visualizes business activities and the relationships among the actors from the
whole systems perspective and allows to develop new business models (Houghton and Joinson,
2010). Referring to the use cases of IoF2020, the question related to value networks is:
In which parts of the value network and for which actors the ICT components create additional
value, and how can these values be measured?
This deliverable is composed of two parts according to the two actions of Task 4.1: (1) Analysis of
value network and (2) Development of KPI catalogues and measurement methods. First, this
deliverable provides an overview of the value networks, clarifies the method to quantify the added
values created for each actor within the networks of use cases considering the entire value chain. The
value network analysis covers the entire value chain starting from farms to processing plants, logistic
providers, retailers, and end-consumer. Second, this deliverable identifies KPIs per use case, followed
by the development of a KPI catalogue and measurement methods. KPI catalogue and measurement
methods help to quantify and measure the potential impact of IoF solution per use case. The
quantification is based on the pre-defined variables, measurement procedures, the weight of each
variable, and the final calculation.

KPI Catalogue for each use case 8 / 22
At present, IoF2020 use cases are still in their start-up phase. Therefore, the exact performance and
impact of use cases are difficult to measure and should be identified together with related actors and
stakeholders. The baseline values and the additional created values can be measured through the
application of ICT components and field measurements throughout the entire project period. The KPI
catalogue and measurement methods allow to measure the impact of the IoT solution focusing on
economic dimension of sustainability and considering environmental and social aspects.
2. VALUE NETWORK ANALYSIS METHOD This deliverable presents a method to identify the value networks of IoF2020 use cases by identifying
the relevant roles, actors and stakeholders, and interactions between them. The analysis itself will be
done in the coming months.
Definition value networks
Value networks are structures that enable stakeholders to collaborate by pooling their assets and
resources in such a way that they can create added value (Nuhoff-Isakhanyan, 2016). The
stakeholders can deploy that value in business opportunities, commercialize products and services
engaging wider communities.
In short, value networks connect actors and stakeholders that interact. Interactions create added
values not only for the actors alone, but also for the group. At network level, however, actors and
stakeholders need to deal with trust, privacy, security and ownership issues. Therefore, the challenges
of IoF implementation goes beyond the control of an individual actor/stakeholder and becomes a
network level challenge (Nuhoff-Isakhanyan, 2016).
Goal of value network analysis
The goal of value network analysis is to take a broader view of value networks considering value
created for all stakeholders from a whole system perspective. In general, radical innovations need
strong value-creating relationships, which brings the businesses to a new level of complexity. This
deliverable will deal with value-creating complexities and define the characteristics of the value
networks of IoT applications, quantify added value for each actors and stakeholders engaged and
analyse interactions in value networks.
Roles
Innovations often involve many stakeholders that play a specific role. Although the stakeholders that
are affected by the project can be invisible at the first sight, it is important to identify the roles the
stakeholders might play to boost innovation. In IoF use cases, roles, such as planner, coordinator,
farmer, processor, producer, supplier, ICT Provider, investor, data user, consumer, controller, partner,

KPI Catalogue for each use case 9 / 22
etc. can be identified. The roles are often neither unique nor exclusive. Thus, stakeholders can have
more than one role at the same time, and the same role can be fulfilled by more than one stakeholder.
Stakeholders
Stakeholders are any identifiable groups or individuals who has impact on achieving the targeted
objectives, and who is considerably affected by the achievement of the objectives (Freeman and
Reed, 1983). In the scope of this project, we identify stakeholders that are engaged in IoF
implementation, and have significant impact. The stakeholders per IoF use case will be grouped as
shown in Table 1. By taking a step-wise approach, we will start with one use case and adapt the
approach when necessary for the others.
Table 1: Stakeholders per IoF2020 use case in Trial 1: Arable Farming
Use case name Roles Stakeholders
UC1.1: Within field management zoning
Fill-in the roles Indicate who (i.e.) name of the person or organization plays the specific role
UC 1.2: Precision crop management
UC 1.3: Soya protein management
UC 1.4: Farm machine interoperability
Relationships
Business relationships usually include contractual/formal activities between stakeholders. Formal
relationships are essential if trust is low, and risks are high. However, informal relationships are
equally important. Informal relationships are non-contractual ties reflecting non-contractual
agreements, exchanging information and advice. Networks with actors that have tight informal
relationships proved to be more successful in upgrading the collaboration (Nuhoff-Isakhanyan et al.,
2017).
In the scope of IoF2020, we will explore values created for stakeholders and map the flow of value
relationships between them. This can give a powerful insight into the value networks to understand
how values are realised, and what is required to achieve the maximum value benefit across the entire
system.

KPI Catalogue for each use case 10 / 22
Value network analysis will help to manage stakeholder relationships, develop business ecosystems,
arrange mergers and acquisitions, develop new business models, support innovation, and knowledge
management.
2.1. KEY PERFORMANCE INDICATORS
Definition KPIs
In general, a KPI is a measurable value that shows the effectiveness in achieving key objectives. KPIs
are usually used to evaluate the success in reaching defined targets at various levels. KPIs may focus
on the overall impact of the IoT solution on the use case, on the performance of the companies
engaged in the use cases, on the progress towards strategic goals, and impact on other stakeholders.
Thus, key performance indicators indicate measureable values to demonstrate the efficiency of use
cases in achieving their key business objectives. In the scope of IoF, three levels of KPIs are indicated
(Table 2).
Table 2: Levels of KPIs
Levels Definition Examples
Operational Indicators on achieving IoF use case objectives
Number of sensors installed, number of farmers participating, number of ICT component used, etc.
Strategic Indicators on achieving better and sustainable performance for actors (e.g. farmers and active organizations) considering economic, environmental and social aspects
Yield increase, efficiency, improved market access, less water use, work time efficiency, etc.
Visionary Indicators on achieving better sustainability for stakeholders
Less CO2, user satisfaction, work stress reduction, farmers’ livelihood, etc.
The overall goal of the KPI measurement is to assess the impact of all IoF2020 use cases in terms of
their economic, environmental and social impact along the three levels (Table 2) and to quantify this
impact into an economical value. Thus, each impact criteria will be reviewed and translated into a
revenue gain or cost decrease in agricultural value chains. The analysis of KPIs across the chain will
uncover the added value of IoT solutions for engaged actors and stakeholders.
Methodology
In preparation of the KPIs per use case, the business support team scanned through all use case
descriptions. The purpose was to characterise the IoT solutions and business cases behind them.
However, the KPIs stated in the use case descriptions of the proposal were not sufficient to define

KPI Catalogue for each use case 11 / 22
clear implication on the impact of the IoT solutions. Therefore, we conducted 15 interviews with 15 use
case leaders and experts, did a literature review, and used the interview results to confirm and
complete the list of potential KPIs. The list of new and potential KPIs for all use cases are created
focusing mainly on the economic and environmental dimensions. KPIs related to social dimension of
sustainability were more difficult to define and will be developed along with the further improvement
and adaption of already defined KPIs.
Using this list, the WP4 team created individual KPI catalogues per use case and asked partners
engaged in use cases to review and discuss the indicators. In an iterative review process, the KPIs
that are fully supported by the use case teams are added to a spread sheet.
As already mentioned above, the use cases are in a start-up phase. Therefore, the baseline values for
KPI indication are often unknown and need to be defined by use case teams together with end-users.
The teams will use various sources, such as own data, available literature, statistical data, sector
average, expert knowledge to define the baseline values for the use case. The baseline values will be
used to calculate the effect of the IoT solution.
In case no source is available due to the lack of historical data or alternative data, and the baseline
values are unknown, use case teams will need more time to retrieve the relevant data from testbed
farms. Accordingly, the values for their targeted impacts might not be possible to define yet. In these
cases, intended impacts will be used instead of targeted impacts. WP4 will constantly monitor the use
cases and require the use case teams to re-define the related KPIs before they start the MVP test
phases.
Furthermore, the impact of horizontal use cases, such as. 1.4, 3.4 and 5.3, is more difficult to define
by precise KPIs as these cases enable IoT innovation via standardization and interoperability.
Standardization and interoperability have impact on the entire sector, and not on a specific use case
alone. These KPIs will be further defined in the process of IoF2020. Therefore, creating a KPI
catalogue is an evolutionary process in line with use case developments.

KPI Catalogue for each use case 12 / 22
3. KPI MEASUREMENT KPI underlying indicators
In general, the KPIs are classified into economic, social, environmental dimensions. Below we present
the potential categories of KPIs found in the literature (Rodrigues et al., 2016, Nuhoff-Isakhanyan,
2016).
Economic dimension represents a set of measures to assess the value creation, captures the
aspects that have to be addressed in order to remain competitive in the market in the short and long
terms. The underlying indicators of economic sustainability dimension includes (Rodrigues et al.,
2016) among others,
• Turnover;
• Profit and value (assessed by traditional financial measures);
• Sales volume;
• Investments (capital employed and Research and Development – R&D);
• Relationship with investors (corporate governance and shareholder's remunerations);
• Crisis management;
• Innovation and technology, collaboration, knowledge management, processes, purchase and sustainability reporting,
• Risks.
Environmental dimension represents the environmental impacts, and encompasses the following
indicators:
• Emissions to air (atmospheric acidification, photochemical ozone formation, CO2, and GHG, etc.);
• Emissions into ground (usage and waste generation);
• Emissions into water (consumption, acidification, aquatic oxygen demand, eco-toxicity to aquatic life and eutrophication)
• Minerals (consumption and use of hazardous materials);
• Fossil resource use reduction;
• Energy consumption;
• Waste reduction
• Increasing biodiversity (ecosystems, protected areas and species) and environmental issues of products and services over the whole life cycle;

KPI Catalogue for each use case 13 / 22
Social dimension is related to the impacts on the social system dealing with human wellbeing, the
fulfilment of human needs, and the equal development of opportunities for all people. Social dimension
encompass the following indicators (Rodrigues et al., 2016):
• Labour practices and decent work (such as employee's education, training and development, diversity and opportunity, health and safety, job creation, talent attraction and retention and human rights);
• Human toxicity;
• Quality of food;
• Customer relationship management (customer satisfaction, customer health and safety, products and labels, advertising and respect for customer privacy);
• Corporate citizenship (social actions, political contributions, codes of conduct, corruption & bribery, competition and pricing and society communication);
• Education.
These indicators are broad and need to be tailored to the use case characteristics. Therefore, the
relevant KPIs should be defined per use case.
Measurement units
Unit of measurement can take the form of financial or non-financial instances and be expressed in
terms of a metric or a measure. The measurement units are identified per indicator given in the KPI
catalogues.
Data input
The KPIs of all use cases in IoF2020 will be stored in one central project database that handles all
data as fully confidential. The input of data can be done threefold:
• Password-protected Web Interface
We are offering an online interface with individual logins to each use case. The online interface will
offer an opportunity to enter all data regarding the agreed KPIs for each test farm individually.
• 365 Farm Net
365 Farm Net data platform and marketplace are already being used by many use cases. 365FarmNet
will offer an interface through which the users can directly access all relevant data for the KPI
measurement per registered test farm. Thus, the use case data will be uploaded upfront, and use case
teams will not have to enter the data again via the web interface.
• Excel import from third-party systems

KPI Catalogue for each use case 14 / 22
If use cases use other data management systems, it is possible to import the data in csv or excel
format though the web interface. Importing KPI relevant data in csv or excel format can be done in a
few minutes.
Data input structure is presented in Figure 1.
Figure 1: Data input at KPI database
Data storage
The entire database is structured to be very flexible with large capacity. The database can handle new
KPIs and an extended number of use cases. However, the database will consider only the most
relevant data to calculate the impact of a use case solution correctly. Note that the private data will
remain confidential.
The frontend interface will offer the following features:
• Login and profile for each use case,
• Separate measurement of several products/services per use case,
• Separate measurement of several test farms,
• Flexible KPI catalogue per use case.
The backend will offer the following features:
Use case data system
External data (e.g. temperature,
rain)
Market data (e.g. asset prices)
Historical Data of test farms
Current Data from use cases
Baseline Value
Quantified Economic Impact
Statistical Correction
Monetary value

KPI Catalogue for each use case 15 / 22
• Translation of KPIs into economic impact values,
• Correlation of KPI measures with external environmental data (e.g. weather and diseases) and market factors (e.g. price changes)
The database structure will ensure flexibility of KPIs and underlying categories, at the same time
allowing to keep track on every single one. Thus, the use case teams can edit and add underlying
categories per KPI independently, although the WP4 team need to approve changes in the KPIs. In
this way, the system will maintain the KPIs defined as in the current document. However, the system
offers an opportunity to review and adjust the measurement of KPIs by adding underlying categories
throughout the course of the project.
Refining the data
Agriculture takes place mostly in a very dynamic environment. Several external factors have influence
on the production and product quality. Therefore, measuring the direct impact of IoT solutions on the
outcome of agricultural production and product quality is a challenging task. In order to control the
influence of external factors and increase the accuracy of all impact values, a group of experts from
the Wageningen University will review and evaluate the final outcome, guide the business support of
IoF2020 in calculating not only the economic impact of IoT solution, but also the probability that the
impact created is due to IoT solutions by comparing the results with a group of comparable producers
or with the sector average.
3.1. KPI CATALOGUE OUTLINE
As already mentioned, the WP4 team has created individual KPI catalogues, a living spreadsheet per
use case and asked partners engaged in use cases to review and discuss the indicators. Below we
present the sustainability dimensions, categories and indicators by use case in five trials. These
indicators have been provided by use case partners, and need to be further developed and clarified.

KPI Catalogue for each use case 16 / 22
Table 3: KPIs by sustainability dimension, categories, by use case in Arable trial
Dimension Categories Indicators Use Case code Economic Productivity increase Yield increase 1.1; 1.2; 1.3 Efficiency improvement Work time use efficiency 1.2 Pesticide use reduction 1.3 Water use reduction 1.2; 1.3 Resource use efficiency 1.1 Cost reduction Fertilizer use reduction (N-use) 1.1 Production costs reduction 1.2;1.3 Fungicide use (late blight control) 1.1 Herbicide use reduction (Haulm killing) 1.1 Pesticide use cost reduction 1.3 Water cost reduction 1.2;1.3 Soil herbicide use reduction 1.1 Quality Quality improvement 1.2; 1.3 Environmental Lower Input Fertilizer use reduction (N-use) 1.1 Nitrogen use reduction 1.2 Fungicide use (late blight control) 1.1 herbicide use reduction (Haulm killing) 1.1 Soil herbicide use reduction 1.1 Pesticide use reduction 1.3 Herbicide management 1.3 Nitrogen and water use efficiencies 1.2 Water use efficiency 1.3 Water balance 1.3 Lower emissions and leaching Energy use(CO2 emission reduction) 1.1 Nitrogen leaching reduction 1.2 GHG reduction 1.2 Soil health Better soil structure 1.3 Social Ease of work Effective time use 1.2 Stress reduction 1.2 User satisfaction IoT user satisfaction 1.1;1.2;1.3
Table 4: KPIs by sustainability dimension, categories, by use case in Dairy trial
Dimension Categories Indicators Use Case code Economic Productivity increase Yield increase per cow 2.2;2.3
Improved animal health 2.2
Reduced of calving interval 2.2
Reduced production assets 2.2
Higher productivity per employee 2.3
Higher Return-on Investment 2.3
Calibrations sets provided and used for remotely monitored instruments 2.4
Efficiency improvement Increased production efficiency 2.3;2.4 Cost reduction Revenue increase 2.1
Reduced work time 2.1; 2.2
Quality Improvement Improved tractability 2.1
Improved precision of measurement values 2.1
Accuracy of determining if all cows are inside or outside the barn 2.1
Environmental Lower Input Increased animal health and welfare 2.1; 2.2
Reduced assets production 2.2
Improved processing/resource use 2.4
Less waste/not qualified product 2.4
Lower impact Lower emissions and leaching 2.1;2.2 Social Ease of work Reduction of worktime 2.1; 2.2
Improved precision of values 2.1
Disseminate to dairy farmers directly 2.1
Public health Increased quality food, food safety and security against terrorism 2.1; 2.4

KPI Catalogue for each use case 17 / 22
Table 5: KPIs by sustainability dimension, categories, by use case in Fruit trial
Dimension Categories Indicators Use Case code Economic Productivity increase Yield increase 3.1; 3.3 Increase of throughput speed 3.3 Cost reduction Water cost 3.1 Phytosanitary measures 3.2 Cost of control 3.2 Decreased total average cost 3.3 Quality Improvement Grape quality improvement 3.1 Higher proportion of kg extra olive oil/
campaign (kg per campaign) 3.3
Environmental Resource efficiency Water use reduction 3.1;3.3 Waste reduction Reduction of crop wasted/ rejected at harvest
(%) 3.1
Reduction of crop wasted during transport, storage, packaging (%) 3.1
Moulds and or wine waste 3.2 Lower emissions and leaching Reduction in frequency of treatment (TFI) 3.2 Potable water use reduced 3.2 Energy use reduction 3.2 CO2 emission reduction 3.2; 3.3 Lower levels of fertilizer used (l per year/ha
and kg per year/ha) 3.3
Reduction of nitrogen or pests rests in the land / water 3.3
Social User satisfaction IoT user satisfaction 3.1; 3.2; 3.3 Reduce toxic pesticide exposure
3.2
High added value jobs in winery
3.2
Table 6: KPIs by sustainability dimension, categories, by use case in Vegetables trial
Dimension Categories Indicators Use Case code
Economic Productivity increase Yield increase (per ha) 4.1; 4.2; 4.3 Reduced running hours 4.3 Increase in sales turnover Increase of number of machines sold 4.3 Efficiency improvement Reduced certification time 4.4 Reduced number of human error 4.4 Cost reduction Reduced production costs 4.2 Increase in turnover 4.3 Increase in sale 4.3 Reduced costs of certification 4.4 Quality Improvement Longer shelf life 4.1 Nitrate content 4.1 Environmental Resource use efficiency Reduced water use 4.1; 4.2 Reduced land use 4.3 Reduced use of paper 4.4 Less pollution/emission No use of pesticide 4.1 No run off of pesticide 4.1 Reduced pesticide use 4.2 Reduced running hours 4.3 Social Public health Lower level of pesticide active ingredients 4.2 Satisfaction Increased level of satisfaction of auditor 4.4 Increased level of satisfaction of producer 4.4 Transparency of food chain More data available 4.2 Predicted yield 4.3 More weeding and growth data available 4.3 Trust in the quality of food products 4.4

KPI Catalogue for each use case 18 / 22
Table 7: KPIs by sustainability dimension, categories, by use case in Meat trial
Dimension Categories Indicators Use Case code
Economic Productivity increase Increase average daily weight gain 5.1
Reduced animal mortality 5.1; 5.2
Efficiency improvement Better feed convention ration 5.1 Cost reduction Less antibiotics and veterinary costs 5.1
Less water costs 5.1
Quality Improvement Reduced boar taint 5.1
Improve uniformity and average weight 5.2
Improved traceability 5.3 Environmental Animal welfare Less sick animals 5.1
Reduced mortality 5.1;5.2
Improved physical condition 5.2 Lower resource use Less feed use 5.1
Less water use 5.1;5.2
Reduced waste Reduced mortality 5.1; 5.2 Social IoT user satisfaction IoT user satisfaction 5.1 Public health Less use of antibiotics 5.2
In an iterative review process, the KPIs that are fully supported by the use case teams will be
confirmed, added to or removed from the spread sheets. To refine the KPIs and quantify them, we
need additional data from use cases. The following questions will be used to collect the required data
(Table 8).
Table 8: Questions related to KPIs
No Name Explanation
1 Dimension First row - please indicate the operational KPIs that are related to use-case implementation (WP2) Second, third and fourth row - Economic, Environmental, Social KPIs Some KPIs given by users are at use-case implementation level ( e.g. sensors installed or number of farmers engaged) , and some at use-case impact level on three sustainability dimensions (economic, environmental , social). Use-case implementation related KPIs need to be discussed with WP2. If you find any KPI related to this level, please indicate them on the top raw of each use-case sheet.
2 Categories The KPIs categorised (grouped). You do not need to add/change. WEcR experts will define the categories. Nevertheless, feedback or suggestions are welcome.
3 Indicators Indicators given by use-cases and suggested by experts. Please check the trial implementation plan (D2.1.2. Trial implementation plan, WP2, M6.docx). Sometimes, the use-cases provide different KPIs in the plan than indicated in the sheets of this file.
4 Definition What does the KPI exactly mean? How to operationalize it to be able to measure properly?
5 Use case code Fill-in the code of the use-case to which the specific KPI relates (e.g. 1.1; 2.2; 3.1; etc.)
6 Baseline value Fill-in the baseline values if available. If not, then suggest alternative (e.g. sector average, average of similar farms in the region).
7 Target value Target values per KPI - This is often, but not always, given in the Trial implementation plan. Attention: If a KPI is not quantitatively measurable, try to explore the underlying indicator(s) that are measureable and communicate about it with the business unit managers.
8 Unit E.g. kg/ha, hours per...? , or maybe scale [1-10]
9 Timespan E.g. year, quarter, day
10 Measurement Method
How the certain KPI will be measured? E.g. measurement using certain devices at field??

KPI Catalogue for each use case 19 / 22
11 Data source E.g. farmer, use-case partner, sector average, business manager? Other WP? Yourself??
12 Stakeholder Who has interest or is affected by the KPI? E.g. farmer, consumer, etc.
13 Data delivered by
Fill-in the name of a person or organization who will provide the data.
14 First data delivery date
Fill-in the in which month and year the data will be available.
15 Data delivery frequency
Fill-in the frequency of repetitive data collection.
16 Data format E.g. excel, doc, text, paper, etc.
17 Remarks Add any important remark
Table 8 represents a template that will be used to define each KPI and its boundaries, such as
baseline values, time span and unit of measurement. Additionally, it will help to form a group of
responsible persons who will provide data on time in an agreed frequency, and format.
Below we illustrate the KPIs defined by the use case partners of use case 1.1 as an example (Figure
2, Figure 3, and Figure 4).
Figure 2: Economic KPIs; Use Case 1.1 - Within field management zoning
Figure 2 show the economic KPIs provided by the use case partners. The horizontal axis shows the
specific KPIs that are relevant for the use case 1.1. Vertical axis shows the targeted KPI values that
the use case aims to achieve as a result of IoF implementation, e.g. 2% increase of potato yield per
year.
Similarly, Figure 3 and Figure 4 show the environmental and social KPIs provided by the use case 1.1.
Each horizontal axis of the figures show respectively the environmental and social KPIs that are
relevant for the use case. Each vertical axis shows the targeted KPI values that use-cases aim to
achieve as a result of IoF implementation, e.g. decrease of CO2 emission by 15%.

KPI Catalogue for each use case 20 / 22
Figure 3: Environmental KPIs; Use Case 1.1 - Within field management zoning
Figure 4: Social KPIs; Use Case 1.1 - Within field management zoning
Unfortunately, not all KPIs provided by all use case partners are quantifiable, and clearly defined. For
instance, it is not known which costs are considered under cost reduction KPI, which quality criteria
the product quality KPI refers to (e.g. taste, size, shelf-life). It is the challenge of the experts engaged
in WP4 to further refine and identify quantifiable KPIs in order to calculate the impact which is due to
IoF implementation.
Whenever the targeted KPIs for 19 use cases are defined and the units are refined, we will use the
format presented in the figures 2-4 to communicate with the public.

KPI Catalogue for each use case 21 / 22
4. CONCLUSIONS General conclusions
This deliverable is an outcome of the task 4.1 within WP4 of IoF 2020 project. The deliverable
presents methods to analyse value networks, defines key performance indicators, and measuring
methods.
The main conclusion from value network analysis is that directly engaged actors are easily identifiable,
whereas other stakeholders that can be affected by the IoF solutions are not visible at the first glance.
Stakeholders and actors can play more than one role at the same time, and can share the same role
among themselves. Therefore, it is essential to identify the roles of stakeholders and actors.
Stakeholders and actors with same or similar roles can efficiently collaborate, and eventually avoid
redundancies and potential conflicts.
Exploring the relationships among stakeholders and actors and mapping the flow of value
relationships between them can give a powerful insight into the value networks to understand how
values are realised, and what is required to achieve the maximum value benefit across the entire
system. Value network analysis will help to manage stakeholder relationships, develop business
ecosystem, arrange mergers and acquisitions, develop new business models, support innovation, and
knowledge management.
As follow-up step, we need to identify the important roles per use case, identify which actors and
stakeholders play the role, and which roles are not fulfilled yet. We will use the KPI impacts to draw
the value networks and to analyse them per case.
Regarding the KPIs and KPI catalogue, the KPIs provided by the literature are of a wide range and
include KPIs that have direct and indirect impacts. The KPIs indicated by the use case teams, though,
are more narrow KPIs than literature and experts suggest. The use case teams often overlooked KPIs
that have impact, but are not explicitly noticeable (especially at the 3rd level in Table 2). Some
examples are KPIs related to crisis management, risks, corporate citizenship and education.
Nevertheless, these KPIs can be measured only a few years after the ICT solution has been
implemented. It is the task of our expert team to explore these KPIs and complete the catalogue along
the project. Eventually, most of agricultural productions have a seasonal character and are sensitive to
the external environment, such as weather and market changes. Therefore, we need to regularly (e.g.
yearly) measure the KPIs to control the external influences and measure the impact which is due to
IoF implementation.
Finally, we need to collect data regularly from the field to measure and indicate the KPIs and added
values in value networks. Therefore, we will undertake the following actions:

KPI Catalogue for each use case 22 / 22
Next actions
• Conduct several brainstorming sessions together with WP4 experts and use case partners.
• Identify all stakeholders per use case, their roles and relations.
• Map the flow of value relationships between stakeholders.
• Facilitate users to register their KPIs in an integrated KPI measurement system, and provide a convenient interface to the use case teams to input their data.
• Offer further support on the development and definition of social KPIs as this part is currently underdeveloped in the catalogue.
• Develop the KPI database.
• Conduct impact analysis (beginning of 2018) and start the first MVP cycle.
• Based on the outcomes of the KPIs, the business models will be reviewed and adjusted.
• Start the second cycle of MVP (mid 2018) and compare the impact with previous results.
• Open the follow-up cycles and update data yearly.
5. REFERENCES FREEMAN, R. E. & REED, D. L. 1983. Stockholders and Stakeholders: A new perspective on
corporate governance. California Management Review, 25, 88-106.
HOUGHTON, D. J. & JOINSON, A. N. 2010. Privacy, social network sites, and social relations. Journal of Technology in Human Services, 28, 74-94.
KRUIZE, J. W. 2017. Advancement of farming by facilitating collaboration : reference architectures and models for farm software ecosystems. Includes bibliographic references. - With summaries in English and Dutch, Wageningen University.
NUHOFF-ISAKHANYAN, G. 2016. Inter-organizational collaboration in bio-based business: sustainability-oriented networks in agro-industrial parks. PhD Dissertation, Wageningen University.
NUHOFF-ISAKHANYAN, G., WUBBEN, E. F. M., OMTA, O. & PASCUCCI, S. 2017. Network structure in sustainable agro-industrial parks. Journal of Cleaner Production, 141, 1209-1220.
RODRIGUES, V. P., PIGOSSO, D. C. A. & MCALOONE, T. C. 2016. Process-related key performance indicators for measuring sustainability performance of ecodesign implementation into product development. Journal of Cleaner Production, 139, 416-428.