Koningsstraat 215 / Rue Royale 215 T +32 2 250 10 10 F +32 ... rapporten/CancerInc... · nals de...
94
belgian cancer registry 2004-2005 Cancer Incidence in Belgium
Transcript of Koningsstraat 215 / Rue Royale 215 T +32 2 250 10 10 F +32 ... rapporten/CancerInc... · nals de...

b e l g i a n c a n c e r r e g i s t r y
Koningsstraat 215 / Rue Royale 2151210 Brussel / BruxellesT +32 2 250 10 10F +32 2 250 10 11
www.kankerregister.orgwww.registreducancer.org
2004-2005Cancer Incidence in Belgium
Cancer Incidence in Belgium 2004–2005
In 2005 a total of 57,185 new cases of cancer were diagnosed in Belgium, 31,484 in males and 25,701 in females. About one in three males and one in four females will develop a cancer before the age of 75 years. Childhood cancer forms less than 1% of all malignant tumours, this corresponds with 350 new cancer diagnoses in 2005.
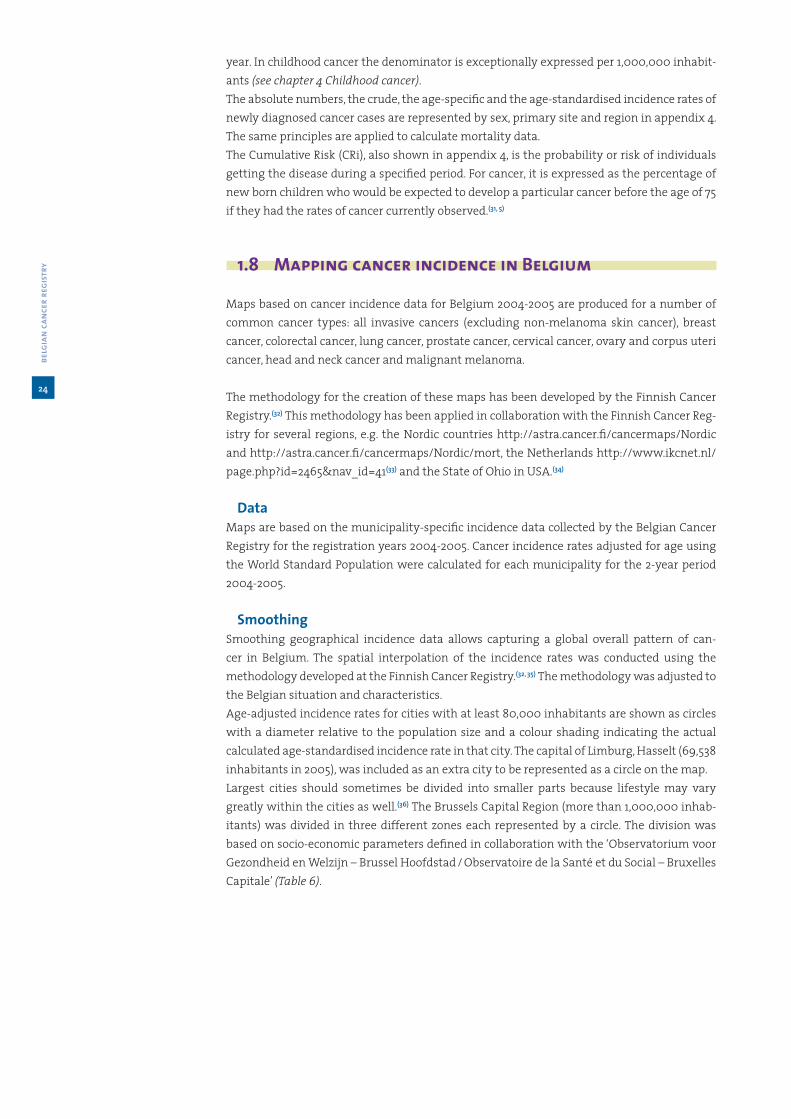
The most frequently occurring tumour in males is prostate cancer, followed by lung cancer and colorectal cancer. Breast, colorectal and lung are the most frequently occurring malignancies in females.
A total number of 25,693 patients died from cancer in 2004 in Belgium, 14,659 males and 11,034 females. The major cause of death by cancer is lung cancer in males and breast cancer in females.
In addition to incidence tables and graphs, a geographical representation of the Belgian cancer incidence is included for a number of common malignancies.

b e l g i a n c a n c e r r e g i s t r y
2004-2005Cancer Incidence in Belgium

With fi nancial support of:
Met steun van deVlaamse overheid
© 2008 Belgian Cancer Registry Stichting Kankerregister - Fondation Registre du Cancer – Stiftung Krebsregister
Editorial team: Kris Henau, Françoise Renard, Cindy De Gendt, Katia Emmerechts, Julie Francart, Lies Peeters, Karen Vos, Liesbet Van Eycken
Staff at the Cancer Registry: Kris Henau, Marleen Deburchgrave, Frederic Calay, Francis Langenbick, Karen Vos, Martine Verstreken, Aline Kayumba, Julie Francart, Françoise Renard, Lies Peeters, Aurore Corfers, Marie-José Hoovelts, Linda Thibaut, Greet Pieters, Isabel de Brito Manique, Claire Mertens, Cindy De Gendt, Aurelie Schmitt, Nathalie De Wever, Katia Emmerechts, Liesbet Van Eycken
Responsible editor: Liesbet Van Eycken, Koningsstraat 215, 1210 Brussels
Design and production: www.Magelaan.be
D/2008/11.846/1
Use of dataThe information in this publication may be used freely on condition of correct quotation of the source and reference.
Recommended referenceCancer Incidence in Belgium, 2004-2005, Belgian Cancer Registry, Brussels 2008
Additional informationCan be requested at:Tel. 0032-2-250 10 10Fax 0032-2-250 10 11e-mail: [email protected] [email protected]
AcknowledgementsWe send our special thanks to prof. Eero Pukkala and Mr. Toni Patama from the Finnish Cancer Registry who generously shared their methodology for mapping cancer incidence and created the published maps.We send our special thanks for the revision of parts of the text and the comments on the results to prof. dr. Fritz Offner, prof. dr. Marie-Rose Christiaens, dr. François Sales, Mrs. Griet Vandewalle, prof. dr. Hendrik Van Poppel, prof. dr. Jan Van Meerbeeck, Mr. Jacques Henkinbrant, prof. dr. Karin Haustermans, dr. Michiel Callens
3
belg
ian
canc
er r
egis
try
intr
oduc
tion
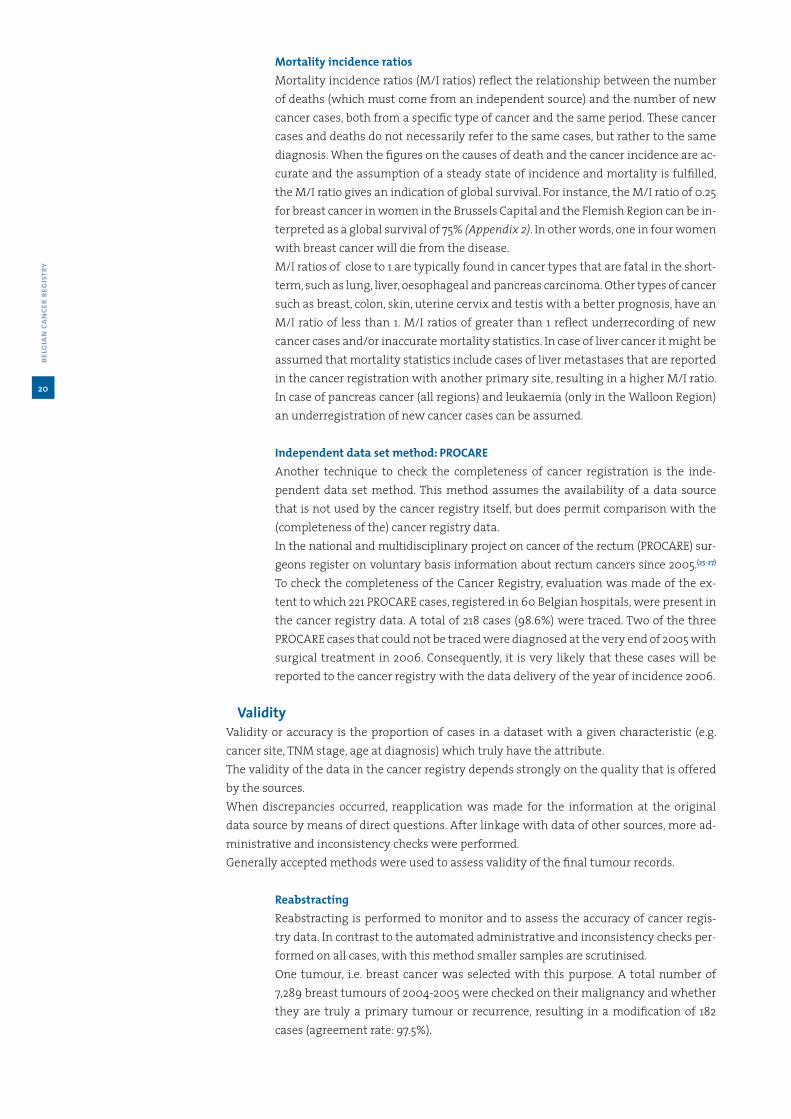
Contents
Voorwoord/ Préface/ Vorwort/ Foreword .........................................................................................................4
Samenvatting/ Résumé/ Zusammenfassung/ Summary .......................................................................8
1 Cancer registration in Belgium: methodology ......................................................................................... 13
1.1 History of the Belgian Cancer Registry ....................................................................................................... 13
1.2 Population and region ....................................................................................................................................... 15
1.3 Data collection, quality control and data linkage ..................................................................................16
1.4 Exclusion criteria and multiple tumours .................................................................................................... 18
1.5 Use of cancer mortality data ........................................................................................................................... 18
1.6 Quality ......................................................................................................................................................................19
1.7 Calculation of incidence rates and risk .......................................................................................................23
1.8 Mapping cancer incidence in Belgium ....................................................................................................... 24
2 Cancer incidence: general results .....................................................................................................................27
3 Cancer incidence: description of several selected malignancies ................................................ 38
3.1 Head and neck cancer ....................................................................................................................................... 38
3.2 Colorectal cancer ................................................................................................................................................. 44
3.3 Lung cancer ............................................................................................................................................................49
3.4 Breast cancer in females ...................................................................................................................................55
3.5 Gynaecological cancer ......................................................................................................................................60
3.6 Prostate cancer .....................................................................................................................................................66
3.7 Bladder cancer ...................................................................................................................................................... 70
3.8 Malignant melanoma of the skin ..................................................................................................................71
3.9 Haematological cancers ................................................................................................................................... 76
4 Childhood cancer ........................................................................................................................................................88
5 References ........................................................................................................................................................................91
6 Appendix ......................................................................................................................................................................... 93
Appendix 1: Data set .......................................................................................................................................... 93
Appendix 2: Mortality incidence ratios 2004 ..........................................................................................94
Appendix 3: Percentage of microscopically verifi ed tumours, 2004-2005 .................................96
Appendix 4: Cancer incidence in Belgium, 2004-2005 .......................................................................98
Appendix 5: Childhood cancer in Belgium, 2004-2005 ..................................................................... 180
Appendix 6: Cancer incidence in the German-speaking community, 2004-2005 ................. 184
Appendix 7: Cancer incidence in the Flemish Region, 1999-2005 ................................................ 188

Voorwoord
Met veel genoegen stel ik u de eerste publicatie ‘Cancer Incidence in Belgium, 2004-2005’ van de Stichting Kankerregister voor. Zoals u zal kunnen lezen, heeft het Kankerregister in een tijdsspanne van 3 jaar een hele weg afgelegd.
Een weg naar volledigheid... Dit is cruciaal voor een Kankerregister! Bij de offi ciële inhuldig-ing van het nieuwe Kankerregister in mei 2006 was dit dan ook de eerste en belangrijkste doelstelling die geformuleerd werd. Vlaanderen nam het voortouw in deze realisatie doordat het reeds beschikte over een registratienetwerk met de zorgprogramma’s voor oncologie/ba-siszorg en alle anatomopathologielaboratoria. De opbouw van het netwerk in het Brussels en het Waals Gewest volgde en kreeg gestaag vorm met eigen accenten. Het is dankzij een prima samenwerking met de artsen van de anatomopathologiediensten en van het klinische netwerk dat de Stichting Kankerregister voor het eerst beschikt over volledige cijfers voor België. De inspanningen van de verschillende overheden bevoegd voor de Gezondheid eve-nals de steun van de Vlaamse Liga tegen Kanker en de Stichting tegen Kanker liggen mee aan de basis van deze resultaten.
Een wettelijke basis... Dertien december 2006 mag terecht beschouwd worden als een mijl-paal in de geschiedenis van de Belgische kankerregistratie. Jarenlang kampte de Belgische kankerregistratie met het ontbreken van een correcte en unieke patiëntidentifi catie omwille van privacyproblematiek. Artikel 39 in de Gezondheidswet van december 2006 legt de ge-gevensstromen voor de kankerregistratie éénduidig vast en verleent de machtiging aan de Stichting Kankerregister tot het gebruik van het nationale unieke identifi catienummer (Identifi catienummer sociale zekerheid-INSZ).
In deze publicatie zijn de incidentiegegevens voor de jaren 2004 en 2005 gebundeld. In het eerste hoofdstuk komt de geschiedenis van de kankerregistratie in België aan bod evenals de huidige werkwijze en een evaluatie van de resultaten. Het tweede en derde hoofdstuk bevat-ten respectievelijk algemene kankerincidentiegegevens en resultaten over een selectie van specifi eke tumorgroepen. In de bijlagen werden de kankerincidentiegegevens opgenomen voor België, de drie Gewesten en de Duitstalige regio in ons land. De cijfers vormen de basis voor inzicht in het voorkomen van kanker en laten voorzichtige vergelijkingen toe binnen de regio’s, maar ook daarbuiten.
En het werk is niet af... Samen met de Belgische Vereniging voor Hematologie zetten we een bijkomende registratiepijler op voor de hematologische maligniteiten. Heel wat wetenschap-pelijke artsenverenigingen gaven de aanzet voor een aantal specifi eke registratieprojecten. Procare (rectumkanker), brachytherapie bij prostaatkanker, oropharynxtumoren... Deze pro-jecten en ook degene die op stapel staan, verdienen uw actieve deelname!
Als kankerregistratieteam hopen wij samen met u verder te mogen bouwen aan een perform-ant kankerregister dat maximaal rendeeert voor de clinici, de onderzoekers, voor de Overheid, voor het brede publiek...
Bij het tot stand komen van deze eerste publicatie van de Stichting Kankerregister, wenst het ganse team u, artsen en registratiemedewerkers, te danken voor uw inzet: dit zijn ook uw gegevens! Ik hoop van harte dat deze informatie nuttig zal zijn voor u in uw dagelijkse professionele activiteiten.
Dr. Liesbet Van EyckenDirecteur

5
belg
ian
canc
er r
egis
try
intr
oduc
tion
Préface
C’est avec grand plaisir que je vous présente la première publication de la Fondation Registre du Cancer ‘Incidence du cancer en Belgique, 2004-2005’. Comme vous pourrez le lire, le Regis-tre du Cancer a parcouru pas mal de chemin depuis 3 ans.
Vers l’exhaustivité de l’enregistrement d’abord… un aspect crucial pour un registre du can-cer! Lors de l’inauguration offi cielle du nouveau Registre du Cancer en 2006, l’atteinte de l’exhaustivité avait déjà été annoncée comme objectif prioritaire. La Flandre, qui possédait déjà un réseau d’enregistrement comprenant tous les laboratoires d’anatomopathologie et certains programmes de soins en oncologie, a pris le fl ambeau. Un réseau d’enregistrement en Wallonie et à Bruxelles s’est mis en place progressivement. C’est grâce à une collabora-tion fructueuse avec les médecins et les services d’anatomopathologie que le Registre dispose maintenant pour la première fois de données complètes pour la Belgique entière. La partici-pation des différentes autorités compétentes dans le domaine de la santé, ainsi que le soutien de la Vlaamse Liga tegen Kanker et de la Fondation contre le Cancer ont également contribué à ce résultat.
Un cadre légal… le 13 décembre 2006 peut être considéré comme une étape dans l’histoire de l’enregistrement du cancer en Belgique. Pendant des années, l’enregistrement du cancer s’est débattu dans les diffi cultés techniques résultant de l’absence d’un identifi ant univoque des patients, en raison de la problématique de la protection de la vie privée. L’article 39 de la Loi de Santé de 2006 établit clairement les fl ux de données et accorde à la Fondation Registre du Cancer l’autorisation d’utiliser le numéro unique de sécurité sociale.
Cette brochure présente les statistiques d’incidence des années 2004 et 2005. Le premier chapitre traite de l’historique de l’enregistrement du cancer en Belgique, des méthodes de travail actuelles et de l’évaluation de la qualité des données. Le deuxième chapitre décrit les résultats généraux de l’enregistrement du cancer, et le troisième approfondit l’épidémiologie des principales tumeurs. En annexe, on trouve les statistiques d’incidence détaillées en Belgique, par Région et pour la Communauté germanophone. Ces chiffres rendent compte de la situation en matière de survenue du cancer et permettent de prudentes comparaisons entre Régions et avec d’autres pays.
Le travail n’est pas fi ni… en collaboration avec la Société Belge d’Hématologie, nous mettons en place un pilier supplémentaire pour l’enregistrement des cancers hématologiques. Beau-coup de Sociétés Scientifi ques médicales ont donné le coup d’envoi pour une série de pro-jets d’enregistrement spécifi ques: notamment pour le cancer du rectum (projet Procare), l’enregistrement de la brachythérapie dans le cancer de la prostate, les cancers de l’oropharynx… tous ces projets et ceux qui attendent leur tour méritent votre participation active!
Toute l’équipe souhaite continuer à construire avec vous un Registre du Cancer performant qui produira de façon optimale des informations utiles aux autorités, aux cliniciens, aux cher-cheurs, au grand public,…
Avec l’aboutissement de cette première publication de la Fondation Registre du Cancer, toute l’équipe souhaite également vous remercier, Médecins et Collaborateurs hospitaliers, pour votre participation: et de fait, ce sont aussi vos données! J’espère de tout cœur que cette information vous sera utile dans votre activité profession-nelle.
Dr Liesbet Van EyckenDirecteur

Vorwort
Mit großer Freude stelle ich Ihnen die erste Publikation ‘Cancer Incidence in Belgium, 2004-2005’ von der Stiftung Krebsregister vor. Wie Sie es lesen werden, hat das Krebsregister in einer Zeit von 3 Jahren eine ganze Evolution durchgemacht.Ein Weg nach Vollständigkeit ... Dies ist die entscheidende Voraussetzung für ein Krebsregis-ter! Bei der offi ziellen Inauguration des neuen Krebsregisters im Mai 2006 war das dann auch der erste und wichtigste Ziel. Flandern ergriff die Initiative in dieser Ausführung, weil sie be-reits über ein Registrierungsnetzwerk mit den Pfl ege-Programmen für Onkologie/Basispfl ege und alle anatomopathologielaboratoria verfügte. Der Aufbau des Netzwerkes in die Region Brüssel-Hauptstadt und die Wallonische Region folgte und nahm stetig Form mit eigenen Akzenten. Es ist dank einer hervorragenden Zusammenarbeit mit den Ärzten der anatomo-pathologiediensten und des klinischen Netzwerkes, dass die Stiftung Krebsregister zum ers-ten Mal über die vollständigen Zahlen für Belgien verfügt. Die Leistungen der verschiedenen Behörden zuständig für die Gesundheit sowie die Unterstützung der Vlaamse Liga tegen Kanker und der Fondation contre le cancer liegen diesen Ergebnissen zugrunde.
Eine gezetzliche Grundlage ... Dreizehnter Dezember 2006 kann mit Recht berücksichtigd worden als ein Meilenstein in der Geschichte der Belgischen Krebsregistrierung. Seit Jahren kämpfte die Belgische Krebsregistrierung gegen dem Mangel einer korrekten und einmali-gen Patientenindentifi kation wegen der Datenschutzproblematik. Artikel 39 in dem Gesund-heitsgesetz von Dezember 2006 legt die Datenströmung für die Krebsregistrierung eindeutig fest und erteilt die Genehmigung an die Krebsregistrierung für die Anwendung der einmali-gen nationalen Identifi kationsnummer (Identifi kationsnummer Sozialen Sicherheit-INSS).
In dieser Publikation sind die Inzidenzdaten für die Jahren 2004 und 2005 aufgenommen. Im ersten Kapitel kommt die Geschichte der Krebsregistrierung in Belgien an der Reihe sowie die aktuelle Arbeitsweise und eine Bewertung der Ergebnisse. Das zweite und dritte Kapitel enthält beziehungsweise allgemeine Krebsinzidenzdaten und Ergebnisse über eine Auswahl von spezifi schen Tumorgruppen. In den Anlagen werden die Krebsinzidenzdaten für Belgien aufgenommen, die drei Regionen und die deutschsprachige Gemeinschaft in unserem Land. Die Zahlen sind die Grundlage für das Vorkommen von Krebs und ermöglichen vorsichtige Vergleichungen innerhalb der Regionen, aber auch darüber hinaus.
Und die Arbeit ist noch nicht zu Ende ... Gemeinsam mit der Belgischen Vereinigung für Hä-matologie stellen wir einen zusätzlichen Registrierungspfeiler auf für die hämatologischen Malignitäten. Viele wissenschaftliche Ärztenvereinigungen gaben den Anstoß für eine Reihe von spezifi schen Registrierungsprojekten. Procare (Rektumkrebs), Brachytherapie für Prosta-takrebs, oropharynxtumoren ... Diese Projekte und auch diejenigen, die auf den Stapel liegen, verdienen Ihre aktive Teilnahme!
Als Krebsregistrierungteam hoffen wir, gemeinsam mit Ihnen, weiter an einer effi zienten Krebsregistrierung bauen zu können, dass maximal effi zient ist für die Kliniken, die Forscher, die Regierung, die breite Öffentlichkeit ...
Für die Aufstellung dieser ersten Publikation der Stiftung Krebsregister, bedankt das ganze Team Sie, Ärzte und Registrierungmitarbeiter, ganz herzlich für Ihren Einsatz: das sind auch Ihre Daten! Ich hoffe von ganzem Herzen, dass diese Informationen nützlich sein werden in Ihren täglichen berufl ichen Aktivitäten.
Doktor Liesbet Van EyckenDirektor

7
belg
ian
canc
er r
egis
try
intr
oduc
tion
Foreword
With great pride I present this fi rst publication ‘Cancer Incidence in Belgium, 2004-2005’ of the Belgian Cancer Registry. The Belgian Cancer Registry made important progress during the past 3 years.
Progress towards completeness…This is a crucial topic for a cancer registry! At the offi cial inauguration of the new Cancer Registry in May 2006, this was already presented as our fi rst and most important objective. The Flemish Region played an initiating role in the realisation of this goal since it already disposed of a registry network with the oncological care programs and all laboratories for pathological anatomy. Subsequently, a similar network with its spe-cifi c characteristics was elaborated in the Brussels Capital Region and the Walloon Region. Thanks to a splendid cooperation with physicians from the laboratories for pathological anat-omy and of the clinical network, the Belgian Cancer Registry is capable to present complete cancer registry data for Belgium. The efforts of the public healthcare authorities and the sup-port of the Vlaamse Liga tegen Kanker (Flemish League against Cancer) also played an impor-tant role in achieving these results.
Progress towards a legal basis… December 13th 2006 can rightfully be considered to be a mile-stone in the history of the Belgian Cancer Registry. Due to privacy issues, the Belgian Can-cer Registry struggled for years with the absence of a correct and unique patient identifi er. Article 39 of the Health Law of December 13th 2006 describes unambiguously the data fl ow of cancer registration and authorizes the Belgian Cancer Registry to use the national social security number (INSZ/NISS).
This publication bundles the incidence data of the years 2004 and 2005. The fi rst chapter describes the history of the cancer registration in Belgium as well as the current working method and an evaluation of the results. The second and third chapters respectively contain general cancer incidence data and data of a selection of specifi c tumour groups. The cancer in-cidence data for Belgium, the three Regions and the German-speaking Community are listed in the appendices. Based on these data, insight in cancer incidence was acquired and careful comparisons can be made.
The work is not fi nished….In collaboration with the Belgian Haematological Society, an extra pillar of registration for haematological malignancies will be created. Moreover, various sci-entifi c medical societies have initiated specifi c registration projects. Procare (rectum cancer), prostate cancer related brachytherapy, oropharynx tumours… these and future projects rely on your active participation!
We, the team of the Belgian Cancer Registry, invite you to collaborate with us to evolve to-wards an even more effective cancer registry of increased value for physicians, researchers, authorities, public.
As a team, we sincerely thank you physicians and registration collaborators for your efforts. These are also your data! I truly hope this information will be of use in your daily professional activities.
Dr. Liesbet Van EyckenDirector

Samenvatting
In het jaar 2005 werden in België 57.185 nieuwe diagnoses van kanker gesteld (exclusief non-melanoma huidkanker), waarvan 31.484 bij mannen en 25.701 bij vrouwen. Bij mannen komt kanker nog steeds frequenter voor dan bij vrouwen. Ongeveer één man op drie en één vrouw op vier krijgt met de ziekte te maken voor de 75ste verjaardag.Kanker treft voornamelijk oudere personen. Ongeveer 62% van de vrouwen en 75% van de mannen is 60 jaar of ouder op het ogenblik van diagnose. In 2005 werden 350 kinderen in België met kanker geconfronteerd (minder dan 1%).
Prostaatkanker is de meest frequent voorkomende tumor bij mannen, onmiddellijk gevolgd door longkanker en colorectale kanker. Bij vrouwen is borstkanker de meest voorkomende kanker. Meer dan één derde van alle invasieve tumoren bij vrouwen is borstkanker. Colorec-tale kanker en longkanker komen bij vrouwen respectievelijk op de tweede en derde plaats.
In 2004 stierven in België 25.693 patienten aan kanker, 14.659 mannen en 11.034 vrouwen. Longkanker is de belangrijkste doodsoorzaak door kanker bij mannen. Ongeveer één op drie sterftes door kanker bij mannen was in datzelfde jaar te wijten aan longkanker. Bij vrouwen is borstkanker de meest frequente doodsoorzaak door kanker.
De vergelijking met registratiecijfers van enkele andere Europese landen suggereert dat Bel-gië één van de hoogste incidentiecijfers heeft voor prostaatkanker, borstkanker en hoofd- en halskanker bij vrouwen.
Door een verbeterde kankerregistratie in België, is het mogelijk om analyses per regio (ge-west) uit te voeren. De algemene resultaten zijn vergelijkbaar in de drie gewesten. Voor enke-le tumortypes zijn er wel verschillen opgemerkt. Hoofd- en halskanker komt meer voor in het zuidwesten van België. In Wallonië en in Brussel is de incidentie van longkanker bij vrouwen hoger dan in Vlaanderen. Een evolutie in incidentie tussen 1999 en 2005 is enkel beschreven voor Vlaanderen aange-zien de gegevens voor het Waals en Brussels Hoofdstedelijk Gewest maar volledig zijn vanaf het incidentiejaar 2004. In Vlaanderen is een stijgende incidentie waargenomen voor borst-kanker en prostaatkanker, voornamelijk ten gevolge van screeningsactiviteiten. Voor heel België kunnen we de laatste jaren wel een belangrijke verschuiving waarnemen in de sex-ratio (M/V) voor longkanker en bepaalde subtypes van hoofd- en halskanker. Vrouwen evo-lueren naar eenzelfde risico voor het ontwikkelen van tumoren die verband houden met het rookgedrag.
Naast de klassieke incidentietabellen en grafi eken wordt in deze publicatie voor specifi eke tumorlokalisaties een geografi sche weergave van de kankerincidentie in België geïncludeerd. Deze door het Fins Kankerregister ontwikkelde methodologie brengt de smoothed incidentie voor België in kaart, met exclusie van de grote steden waar de voor leeftijd gestandaardi-seerde incidentie wordt uitgezet.

9
belg
ian
canc
er r
egis
try
intr
oduc
tion
Résumé
En 2005, un total de 57.185 nouveaux cas de cancer ont été diagnostiqués (cancer de la peau non-mélanome exclus). Dans l’ensemble, les cancers sont plus fréquents chez les hommes (31.484) que chez les femmes (25.701). Environ un homme sur trois et une femme sur quatre présentera un cancer avant sa 75ème année.Le cancer affecte principalement les personnes âgées: approximativement 62% des femmes et 75% des hommes ont 60 ans ou plus au moment du diagnostic. En 2005, un total de 350 nouveaux cas de cancer ont concerné des enfants (moins d’1% des cancers).
Les tumeurs les plus fréquentes chez les hommes sont les cancers de la prostate, suivis par les cancers du poumon et les cancers colorectaux. Chez les femmes, les tumeurs les plus fréquentes sont les cancers du sein (plus d’un tiers des cancers chez les femmes), les cancers colorectaux et les cancers de la peau.
Un total de 25.693 patients sont décédés du cancer en Belgique en 2004, soit 14.659 hommes et 11.034 femmes. La principale cause de décès par cancer chez l’homme est le cancer du pou-mon (environ un tiers des décès par cancer chez l’homme) tandis que le cancer du sein est la cause de décès par cancer la plus fréquente chez la femme.
La comparaison avec les données des autres pays européens suggère que les taux d’incidence des cancers du sein et ceux des cancers tête et cou chez la femme ainsi que ceux des cancers de la prostate chez l’homme sont parmi les plus élevés d’Europe.
Grâce à l’amélioration de l’enregistrement, il a été possible de réaliser des analyses séparées des données des trois régions de Belgique. Globalement, les résultats sont comparables pour les trois régions. Cependant, pour certains types de tumeurs, on observe certaines différenc-es. Une incidence plus élevée pour les cancers tête et cou a été observée dans le sud-ouest du pays. Une incidence plus élevée du cancer du poumon a principalement été observée en Wallonie et dans la région de Bruxelles Capitale. L’évolution des taux d’incidence sur les 7 dernières années n’a été décrite que pour la Flandre car les données des deux autres régions sont incomplètes avant 2004. Les incidences des cancers du sein et de la prostate ont aug-menté, principalement en raison de pratiques de dépistage. Spécifi quement pour les cancers des poumons et certains sous-types des cancers tête et cou, on constate une diminution du sex ratio (M/F) au cours du temps. Les femmes évoluent vers un risque comparable aux hom-mes de développer des cancers liés au tabac.
Outre les tableaux et graphiques standardisés, pour les affections malignes les plus courantes, une représentation géographique des cancers en Belgique a été incluse dans cette brochure. La méthodologie (cartographie de l’incidence standardisée pour l’âge lissée pour l’entièreté du pays à l’exception des grandes villes) a été développée par le Finnish Cancer Registry.

Zusammenfassung
Im Jahre 2005 wurden insgesamt 57.185 neue Fälle von Krebs (mit Ausnahme von Nicht-Me-lanom-Hautkrebs) in Belgien diagnostiziert. Im Allgemeinen tritt Krebs häufi ger bei Männer ein (31.484) als bei Frauen (25.701).
Etwa ein Mann auf drei und eine Frau auf vier werden vor ihrem 75. Geburtstag einen Krebs entwickeln. Krebs tritt vor allem bei älteren Menschen auf: zirka 62 % der Frauen und 75 % der Männer sind 60 Jahre alt oder älter zum Zeitpunkt der Diagnose. Im Jahre 2005 traten insge-samt 350 neue Fälle von Krebs bei Kindern auf (weniger als 1 % der Krebserkrankungen).
Die am häufi gsten vorkommende Tumor bei Männern ist Prostatakrebs, gefolgt von Lungen-krebs und Dickdarmkrebs. Bei Frauen sind die am häufi gsten auftretenden Tumoren Brust-krebs (mehr als ein Drittel aller Krebserkrankungen bei Frauen), Dickdarmkrebs und Lungen-krebs.
Eine Gesamtzahl von 25.693 Patienten starb von Krebs in 2004 in Belgien, 14.659 Männer und 11.034 Frauen. Die Hauptursache für Todesfälle durch Krebs bei Männern ist Lungenkrebs (etwa ein Drittel aller männlichen Krebs-Todesfälle), während Brustkrebs die häufi gste Ursa-che für Tod durch Krebs bei Frauen ist.
Der Vergleich mit der Registrierung von Daten aus anderen europäischen Ländern deutet darauf hin, dass die Inzidenzraten von Brustkrebs, Kopf-Hals-Krebs bei Frauen und Prostata-krebs zu den höchsten in Europa gehören.
Aufgrund der verbesserten Registrierungstechniken war es möglich getrennte Analysen durch zu führen über die Daten aus alle drei Belgischen Regionen. Im Allgemeinen waren die Ergebnisse im Großen und Ganzen vergleichbar zwischen den Regionen. Jedoch wurden Unterschiede für einige Tumor-Arten beobachtet. Ein erhöhtes Risiko für Kopf-Hals-Krebs wurde im Südwesten von Belgien beobachtet. Eine höhere Inzidenz von Lungenkrebs wurde vor allem bei Frauen in der Wallonischen und der Brüssel-Hauptstadt Region beachtet. Die Entwicklung der Inzidenzraten zwischen 1999 und 2005 ist nur für die Flämische Region be-schrieben, da Daten aus den anderen 2 Regionen nur ab 2004 vollständig sind. Brustkrebs und Prostatakrebs sind gestiegen vor allem als Folge der Reihenuntersuchungspraktiken. Spezi-fi sch für Lungenkrebs und einige Subtypen von Kopf-Hals-Krebs wurde über Jahren einen Rückgang in dem Sex-Verhältnis (M/F) festgestellt. Frauen entwickeln sich auf das gleiche Risiko wie Männer bei der Entwicklung dieser tabaksbezogenen Krebserkrankungen.
Zusätzlich zu den Standard-Tabellen und Grafi ken ist eine geografi sche Darstellung der bel-gischen Inzidenz von Krebserkrankungen inbegriffen für die bekannsten Malignitäten. Die Methodik (Kartografi e von smoothed Inzidenz für das ganze Land mit Ausnahme der großen Städte, in denen die Alters-standardisierte Inzidenz dargestellt ist) wurde durch das fi nnische Krebsregister entwickelt.

11
belg
ian
canc
er r
egis
try
intr
oduc
tion
Summary
In 2005 a total number of 57,185 new cases of cancer (excluding non-melanoma skin cancer) were diagnosed in Belgium. In general, cancer occurs more frequently in males (31,484) than in females (25,701). About one in three men and one in four women will develop a cancer before their 75th birthday.Cancer chiefl y affects older persons: approximately 62% of the females and 75% of the males are 60 years or older at the time of diagnosis. In 2005 a total number of 350 new cancer cases occurred in children (less than 1% of the cancers).
The most frequently occurring tumour in males is prostate cancer, followed by lung cancer and colorectal cancer. In females the most frequently occurring tumours are breast cancer (more than one third of all cancers in women), colorectal cancer and lung cancer. A total number of 25,693 patients died from cancer in 2004 in Belgium, 14,659 males and 11,034 females. The major cause of death by cancer in males is lung cancer (about one third of all male cancer deaths) while breast cancer is the most frequent cause of death by cancer in females.
Comparison with registration data from other European countries suggests that the inci-dence rates of breast cancer, head and neck cancer in females and prostate cancer are among the highest in Europe.
Owing to improved registration techniques, it was possible to perform separate analyses on the data from all three Belgian regions. In general, the results were largely comparable be-tween the regions. However for some tumour types, differences were observed. A higher risk for head and neck cancer was observed in the southwest of Belgium. A higher incidence of lung cancer was mainly observed in females in the Walloon and Brussels Capital Region. The evolution of incidence rates over the last 7 years period has only been described for the Flemish Region, because data from the other 2 regions were incomplete before 2004. Breast cancer and prostate cancer incidence have increased, mainly as a result of screening practices. Specifi cally for lung cancer and some subtypes of head and neck cancer a decrease in the sex ratio (M/F) over years was noted. Females are evolving towards the same risk as males in de-veloping these tobacco-related cancers.
In addition to standard tables and graphs, a geographical representation of the Belgian can-cer incidence is included for the more common malignancies. The methodology (mapping of smoothed incidence for the whole country, with exception of the large cities where the age-standardised incidence is represented) was developed by the Finnish Cancer Registry.


1 Cancer registration in Belgium: methodology
1.1 History of the Belgian Cancer Registry
The National Cancer Registry (1983-2005)The founding of the National Cancer Registry as a department of the Belgian Work against Cancer in 1983 was the fi rst step towards a coordinated cancer registration system. The Na-tional Cancer Registry received and managed data obtained from the seven Belgian Health Insurance Companies. Evaluation of these data however, showed a considerable underregis-tration.(1)
The Flemish Cancer Registry Network (1997–2005)With the aim of rectifying this underregistration, various cancer registration initiatives start-ed in the Flemish part of Belgium at the end of the nineteen eighties. None of these separate registration systems however, could depict an accurate illustration of cancer in Flanders. Since 1994 to and including the working year 2005, the Flemish government subsidised extension of a Cancer Registration Network on the basis of integration of the existing registration initia-tives via the Flemish League against Cancer (Vlaamse Liga tegen Kanker). Resources and work forces were combined within a network. This network included all seven national Health Insurance Companies (subsidised by the federal authorities), the provincial cancer registry of Limburg (LIKAR),(2) the Antwerp Cancer Registry (AKR),(3) the Oncology Department of the University Hospital Leuven, the Radiotherapy Department of the University Hospital Ghent and the Oncology Department of the Jules Bordet Institute in Brussels (since the incidence year 2000). In 1998, a direct cooperation started between the Flemish Cancer Registry Net-work and the pathological anatomy laboratories of Flemish-Brabant, East-Flanders and West-Flanders. Also some pathological anatomy laboratories of the Brussels Capital Region and the Walloon Region took part in the registry network (CHU Liège, CMP Bruxelles, Cliniques Universitaires Saint-Luc, Institut Jules Bordet, and Institut de Pathologie et de Génétique Lov-erval). The Bronchus Carcinoma Registry of the Flemish Association for Respiratory Health and Tuberculosis Prevention (VRGT) participated in the network until the end of 1998. The efforts of the Flemish Cancer Registry Network and its partners resulted into international recognition and the subsequent publication of the Flemish data in ‘Cancer Incidence in Five Continents’ in 2002(4) and 2007,(5) publications of the International Agency for Research on Cancer (IARC). The Flemish Cancer Registry Network completed its activities with the publica-tion of ‘Cancer Incidence and Survival in Flanders, 2000-2001’.(6)
The Belgian Cancer Registry, a new foundation in June 2005!In 2005 the National Cancer Registry stopped working because of the dissolution of the Bel-gian Work against Cancer (BWK s.o.n. – OBC f.u.p.). This fact and more important the motiva-tion of all the public-health-care authorities to have a clear insight in cancer incidence in Bel-gium as a tool for prevention and health policy, resulted into the creation of the Foundation Belgian Cancer Registry (BCR) on June 28th 2005. AKR(3) stopped its data collecting activities at the year of incidence 2004, whereas LIKAR(2) continued until the year of incidence 2005. The National Cancer Registry and the Flemish Cancer Registry Network were completely inte-grated in the new foundation.
The involved authorities (Table 1) contribute fi nancially to insure the continuity of cancer reg-istration. The Belgian Cancer Registry also received fi nancial support from the Foundation against Cancer and the Vlaamse Liga tegen Kanker (Flemish League against Cancer).
13
belg
ian
canc
er r
egis
try
canc
er in
cide
nce
in b
elgi
um 20
04–2
005

Table 1 Financial contributors of the Belgian Cancer Registry
FOD Volksgezondheid, Veiligheid van de Voedselketen en Leefmilieu, Minister bevoegd voor VolksgezondheidSPF Santé publique, Sécurité de la Chaîne alimentaire, Ministre de la Santé
Vlaams Agentschap Zorg en Gezondheid, Afdeling Informatie en Ondersteuning, Vlaams Minister van Welzijn, Volksgezondheid en Gezin
Communauté Française, Ministre de l’enfance, de l’aide à la jeunesse et de la Santé
Gouvernement Wallon, Ministre de la Santé, de l’action sociale et de l’égalité des chances
Gemeenschappelijke gemeenschapscommissie van Brussel HoofdstadCommission communautaire commune de Bruxelles-Capitale
RIZIV, Dienst Geneeskundige verzorgingINAMI, Service des soins de santé
Minister der Deutschsprachigen Gemeinschaft für Beschäftigung, Ausbildung, Soziales und Tourismus
Stichting tegen KankerFondation contre le Cancer
Vlaamse Liga tegen Kanker
The Belgian Cancer Registry reports to the Executive Board/Raad van Bestuur/Conseil d’Administration and the Scientifi c Board of Coordination/Raadgevend Comité/Comité Con-sultatif. The Executive Board was founded on July 1st 2005. Representatives of the ministers entitled to Health Policy and all the Health Insurance Companies take part. The Executive Board initiates all actions to insure that the Cancer Registry can obtain its objectives.The Board of Coordination comprises representatives of all involved authorities, scientifi c medical societies involved in oncology, the College of Oncology, the Intermutualistic Agency, the Belgian Health Care Knowledge Centre, the Privacy Commission and the RIZIV/INAMI. The assignments of the Scientifi c Board of Coordination are the supervision and evaluation of the qualitative and quantitative aspects of the cancer registration, to give advice about possible procedures to improve the registration and data analysis and the approval of reports made by the Registry containing analysis demanded by external organisations. In the Bel-gisch Staatsblad / Moniteur Belge (Belgian Law Gazette) of 07/08/2008, the legal basis of the ‘Raadgevend Comité / Comité Consultatif’ was created.(7)
Towards a compulsory cancer registration in BelgiumIn 2003, the refunding of the multidisciplinary oncological consultation and the norms for recognition of the oncological care programs were published in Royal Decrees. From that moment on, the hospitals were committed to register every diagnosis of cancer, irrespective whether or not the diagnosis is discussed during a multidisciplinary oncological consultation.(8)
The Health Law of December 13th 2006(9) can be considered as a milestone in the history of the Belgian cancer registration. Article 39 of this law authorises the Belgian Cancer Registry to use the national social security number (INSZ/NISS) as the unique identifi er of the patient. This authorisation implies severe measures and rules for privacy protection and confi dential-ity. The law also describes the role, objectives and data fl ow of the Belgian Cancer Registry. On one hand, the data fl ow must rely on clinical information from the oncological care programs. On the other hand, the pathological anatomy laboratories and haematology departments should supply the Belgian Cancer Registry with their data.
Construction of the Belgian registration networkThe fi rst goal of the new Belgian Cancer Registry was to achieve completeness in cancer reg-istration for the whole country. For this reason, the Registry fi rst focused on the elaboration of an entire network with the pathological anatomy laboratories. At the start of the new Belgian Cancer Registry, the network was complete in the provinces of Flemish-Brabant, East-Flanders, Limburg (network created by LIKAR) and West-Flanders. Direct collaboration was started with the pathology laboratories of the province of Antwerp, the Walloon Region and the Brussels Capital Region.With the appreciated help and motivation of all Belgian pathologists the Cancer Registry suc-ceeded to create a complete pathology network by the end of 2007 (year of incidence 2004).
14
belg
ian
canc
er r
egis
try

Also the second pillar of the network with the clinical sources was signifi cantly enlarged be-tween 2005 and 2008. Almost all hospitals with an oncological activity fi ll in a standard form at least for cases discussed in the multidisciplinary oncological consultation. A part of them registers those forms and sends them electronically to the Cancer Registry. At the end of 2008, a total number of 45 hospitals were directly collaborating through an electronic registration system with the Belgian Cancer Registry in the Flemish Region, 10 hospitals in the Walloon Region and 6 hospitals in the Brussels Capital Region. The efforts to generalise electronic reg-istration at the level of the hospital and to include cases not discussed at the multidisciplinary consultation continue.The law also foresees the participation of the haematology departments in the cancer regis-tration network. The set up of this network has been initiated in the year 2008. Besides the quantity, the Belgian Cancer Registry continues to improve the quality of the data by extending the data validation procedures, publishing cancer registration manuals, organ-ising registration training sessions etc. Moreover, the Belgian Cancer Registry attempts to decrease the delay between the year of incidence and the publication of the respective data.
1.2 Population and region(10)
Belgium (Figure 1) comprises an area of 30,528 square kilometres. On January 1st 2005, Belgium had a population of 10,445,852 including 5,111,325 males and 5,334,527 females. The population is divided over the Flemish Region (6,043,161), the Walloon Region (3,395,942) and the Brussels Capital Region (1,006,749). Twentytwo percent of the population was 60 years or older and 4.3% was 80 years or older. According to the Directorate-general Statistics and Economic In-formation, the percentage of over-60-years-old will continue to rise to 28% in 2020 and 31.5% in 2050. A total of 8.3% of the Belgian population has a foreign nationality. The population density is 447 inhabitants per square kilometre for the Flemish Region and 202 and 6,238 for the Walloon Region and the Brussels Capital Region respectively. Life expectancy at birth is 82.4 years in females and 76.5 years in males.
Figure 1 Belgium
15
belg
ian
canc
er r
egis
try
canc
er in
cide
nce
in b
elgi
um 20
04–2
005

1.3 Data collection, quality control and data linkage
For the years of incidence 2004 and 2005, the data fl ow (Figure 2) relied on all information (notifi cations) coming from the oncological care programs and from all pathological anatomy laboratories (related to hospitals).
Figure 2 Belgian Cancer Registry: Data fl ow
Hospitals
Health Insurance Companies
Laboratories forPathological
Anatomy
Belgian Cancer Registry
Clinical networkAs mentioned earlier, hospitals have to register all new cancer diagnoses, irrespective of the fact the diagnosis is discussed during a multidisciplinary oncological consultation. Each tumour has to be recorded by means of a standard form including a confi ned set of variables (Appendix 1).(11) To code tumour characteristics (primary localisation and histology), this data set used the International Classifi cation of Diseases for Oncology, third edition (ICD-O-3).(12) The stag-ing of the tumour has to be defi ned according to the TNM Classifi cation of Malignant Tu-mours, sixth edition.(13)
In the future, registration by the hospitals only based on paper will be discouraged. Sending an electronic fi le with all data on a yearly basis, or direct registration via the online Web Based application for Cancer Registration (WBCR) is more straightforward. Moreover, with the start of the National Cancer Plan in March 2008,(14) the hospitals will be refunded to employ a data manager as from July 1st 2008. To be refunded, data managers will have to follow a training organised by the Belgian Cancer Registry whereas before that date, these training sessions were on a complete voluntary basis.
As the data base of the Belgian Cancer Registry contains sensitive and confi dential informa-tion, the online application of the Belgian Cancer Registry has to work under strict safety con-ditions. Therefore, the Belgian Cancer Registry collaborates since September 2007 with the eHealth service platform(15) for the user authentication and the user management procedures. The identifi cation of the users preferentially occurs by electronic identity card although token is also possible. Moreover, to verify the type of user (physician/specialist) the eHealth plat-form uses information of authentic sources like for example the offi cial list of Belgian spe-cialists. The offi cial of the hospital authorises access to medical doctors and administrative collaborators to the online application and also determines the access rights (profi le manage-ment). The Belgian Cancer Registry manages the data base and the application.
16
belg
ian
canc
er r
egis
try

Pathology networkThe pathological anatomy laboratories encode the received specimens following classifi ca-tion rules approved by the Consilium Pathologicum Belgicum. In Flanders most of the labora-tories follow the Codap-2007 classifi cation. Various coding systems are used in the Walloon and Brussels Capital Region. Every (pre-)malignant diagnosis is encoded and yearly trans-ferred to the Belgian Cancer Registry, accompanied by the anonymised protocols as foreseen by law. After quality control, the specimen classifi cation is converted to a tumour registration in ICD-O-3 at the registry.
Quality control and data linkageEvery tumour record is subjected to an automated quality control in which the format and the contents of each fi eld are checked. In addition, the contents of the fi elds are checked for inconsistencies against the other fi elds. Relationships are checked between topography and gender, topography and histology and age and tumour characteristics. These checking pro-cedures were based on the IARC guidelines.(16) Also a number of manual interventions are carried out e.g. all liver tumours are manually checked.Subsequently, the individual tumour records from clinical sources and pathological anatomy laboratories are linked by means of the unique patient identifi er. If these tumour records con-tain data on the same tumour, the data from the various sources are combined to form one defi nitive tumour record (merging process). At this stage it is determined whether or not this concerns a second (third, etc.) primary tumour. The linkage of the data is largely an automat-ed process, but in 17% of the data links, manual intervention is necessary. In the more complex cases, the data source is reconsulted to provide additional information. As mentioned earlier, according to article 39 of the Health Law 2006, the Belgian Cancer Reg-istry is allowed to use the national social security number as a unique patient identifi er. To protect the privacy of the patients, strict rules are applied. Before 2006, identifi cation char-acteristics of the patient (date of birth, name and gender) were encrypted irreversibly at the source into a unique code (hash code) before the information was transferred to the Cancer Registry. Writing errors in the name or date of birth caused serious linkage errors.(17) These errors could only be detected and corrected by means of a labour-intensive correction proce-dure. Such linkage errors will gradually disappear by replacing the hash code by the national social security number (see 1.6 for the availability of the national social security number).
17
belg
ian
canc
er r
egis
try
canc
er in
cide
nce
in b
elgi
um 20
04–2
005

1.4 Exclusion criteria and multiple tumours
All invasive and in situ malignancies were registered, except for basal cell carcinoma of the skin. Also the borderline malignant tumours of the ovary, the non-invasive and borderline malignant tumours of the bladder, borderline malignant and benign tumours of the central nervous system, pituitary gland and craniopharyngeal duct were registered.In this report on cancer incidence, only the invasive malignancies are described, unless ex-plicitly stated otherwise in the tables or fi gures. Squamous cell carcinoma of the skin was reg-istered, but often omitted from the general analysis of the incidence of cancer in a population. For the calculation of the incidence rates of multiple tumours in the same patient, this publi-cation used the IACR/IARC rules(16) except for tumours of the colon, skin, bone or soft tissues. The Belgian Cancer Registry considered these tumours at the sub localisation or 4-character ICD-O-3 topography code to be one tumour. Chronic myeloproliferative diseases and myelodysplastic syndromes are registered as from 2004 on, as they became part of the malignant diseases;(18) they are reported in the booklet.
1.5 Use of cancer mortality data
Cancer mortality data are very useful in cancer epidemiology. They complete the information provided by a cancer registry. Although cancer mortality trends refl ect a complex interaction between incidence, changes in treatment and/or diagnostic procedures (survival), they were often used in the past as a proxy for trends in incidence.(19) It is important to combine both the cancer mortality and the cancer incidence data for the analysis and interpretation of trends. Mortality data are usually routinely available as they represent a basic indicator in public health.
Cancer mortality data are often used and referred to in this book. In Belgium, the mortality statistics are collected and treated by the Communities and the Brussels Capital Region.(20-22) Next, the data from the three regions are merged and published by the General Direction of Statistic and Economic Information of the Federal Government.
Until 1997, the mortality data from the three regions were merged and published by the Gen-eral Direction of Statistic and Economic Information of the Federal Government.(23) They are also at one’s disposal for the three Belgian regions for 1998 and 1999. From 2000 to 2003, the mortality data were published for the Flemish and the Brussels Capital Region. Mor-tality data for the same period in the Walloon Region are missing. In the year 2004, mortality statistics were again available for the 3 regions. The Cancer Registry calculated the Belgian cancer mortality for 2004 by merging the regional data.Table 2 shows the availability of incidence and mortality data by year and by region.
Table 2 Availability of cancer incidence and mortality data by region
<1998 1998 1999 2000 2001 2002 2003 2004 2005 2006
Flemish Region incidence X X X X X X X
mortality X X X X X X X X X X
Brussels Capital Region incidence X X
mortality X X X X X X X X X X
Walloon Region incidence X X
mortality X X X X
Belgium incidence
mortality X *
Status on the 1st of November 2008* Belgian cancer mortality data calculated by the Cancer Registry
18
belg
ian
canc
er r
egis
try

1.6 Quality
This chapter discusses the quality of the cancer registry data which depends on different aspects.(16, 24) Only invasive tumours (ICD-10 C-category) are taken into account. MDS and MPD are excluded in this chapter.
Completeness of the Cancer Registry (degree of coverage)Completeness is the extent to which all incident cancers in the Belgian population are in-cluded in the Cancer Registry. Incidence rates will be close to their true value if maximum completeness in case-fi nding procedures can be achieved.
Number of notifi cations/data sourcesThe number of notifi cations and data sources per tumour is a raw indicator of com-pleteness: the higher the average, the more complete the registration process. The reasoning behind this is that very few cases will be missed when multiple sources are used. Linkage of data from different sources and source types leads to informa-tion that is more complete, precise and reliable.In the period 2004-2005 the Belgian Cancer Registry has recorded 119,454 invasive tumours (non melanoma skin cancer included), originating from 221,976 notifi ca-tions (on average 1.86 notifi cations per tumour, range: 1-10). The average number of notifi cations was higher in the Flemish Region than in the other regions, in 2005 for example 2.00 (range: 1-8) compared to 1.83 (range: 1-6) in the Brussels Capital Region and 1.57 (range: 1-6) in the Walloon Region. In Belgium the average number of sources and source types was 1.79 (range: 1-7) and 1.68 (range: 1-4) respectively. When comparing between regions, this was higher in the Flemish Region than in the Brussels Capital and the Walloon Region.When considering two main groups of source types, pathological anatomy laborato-ries/clinical biology versus hospitals/Health Insurance Companies, 52% of tumours were notifi ed by both groups (Belgium 2005), rising to 60% of tumours in the Flem-ish Region for the same period (Figure 3).
Figure 3 Combination of source types by region, 2005
38% 52% 10%
PathologyLaboratories/Clinical Biology
Hospitals/HealthInsurance Companies
Belgium Brussels-Capital Region
Flemish Region Walloon Region
47% 45% 8%
PathologyLaboratories/Clinical Biology
Hospitals/HealthInsurance Companies
31% 60% 9%
PathologyLaboratories/Clinical Biology
Hospitals/HealthInsurance Companies
51% 38% 11%
PathologyLaboratories/Clinical Biology
Hospitals/HealthInsurance Companies
19
belg
ian
canc
er r
egis
try
canc
er in
cide
nce
in b
elgi
um 20
04–2
005
Mortality incidence ratiosMortality incidence ratios (M/I ratios) refl ect the relationship between the number of deaths (which must come from an independent source) and the number of new cancer cases, both from a specifi c type of cancer and the same period. These cancer cases and deaths do not necessarily refer to the same cases, but rather to the same diagnosis. When the fi gures on the causes of death and the cancer incidence are ac-curate and the assumption of a steady state of incidence and mortality is fulfi lled, the M/I ratio gives an indication of global survival. For instance, the M/I ratio of 0.25 for breast cancer in women in the Brussels Capital and the Flemish Region can be in-terpreted as a global survival of 75% (Appendix 2). In other words, one in four women with breast cancer will die from the disease.M/I ratios of close to 1 are typically found in cancer types that are fatal in the short-term, such as lung, liver, oesophageal and pancreas carcinoma. Other types of cancer such as breast, colon, skin, uterine cervix and testis with a better prognosis, have an M/I ratio of less than 1. M/I ratios of greater than 1 refl ect underrecording of new cancer cases and/or inaccurate mortality statistics. In case of liver cancer it might be assumed that mortality statistics include cases of liver metastases that are reported in the cancer registration with another primary site, resulting in a higher M/I ratio. In case of pancreas cancer (all regions) and leukaemia (only in the Walloon Region) an underregistration of new cancer cases can be assumed.
Independent data set method: PROCAREAnother technique to check the completeness of cancer registration is the inde-pendent data set method. This method assumes the availability of a data source that is not used by the cancer registry itself, but does permit comparison with the (completeness of the) cancer registry data. In the national and multidisciplinary project on cancer of the rectum (PROCARE) sur-geons register on voluntary basis information about rectum cancers since 2005.(25-27) To check the completeness of the Cancer Registry, evaluation was made of the ex-tent to which 221 PROCARE cases, registered in 60 Belgian hospitals, were present in the cancer registry data. A total of 218 cases (98.6%) were traced. Two of the three PROCARE cases that could not be traced were diagnosed at the very end of 2005 with surgical treatment in 2006. Consequently, it is very likely that these cases will be reported to the cancer registry with the data delivery of the year of incidence 2006.
ValidityValidity or accuracy is the proportion of cases in a dataset with a given characteristic (e.g. cancer site, TNM stage, age at diagnosis) which truly have the attribute.The validity of the data in the cancer registry depends strongly on the quality that is offered by the sources. When discrepancies occurred, reapplication was made for the information at the original data source by means of direct questions. After linkage with data of other sources, more ad-ministrative and inconsistency checks were performed.Generally accepted methods were used to assess validity of the fi nal tumour records.
ReabstractingReabstracting is performed to monitor and to assess the accuracy of cancer regis-try data. In contrast to the automated administrative and inconsistency checks per-formed on all cases, with this method smaller samples are scrutinised.One tumour, i.e. breast cancer was selected with this purpose. A total number of 7,289 breast tumours of 2004-2005 were checked on their malignancy and whether they are truly a primary tumour or recurrence, resulting in a modifi cation of 182 cases (agreement rate: 97.5%).
20
belg
ian
canc
er r
egis
try

Microscopically verifi ed tumoursValidity of the diagnosis is likely to be higher if it is based on histological or cyto-logical examination. The percentage of microscopically verifi ed tumours (MV%) is a positive indicator of validity, however, a very high MV% would imply an over-reli-ance on the pathology laboratory as a source of information and failure to fi nd cases diagnosed by other means. The absolute value of MV% has little meaning without comparing it to expected values of similar registries.The MV% for all sites excluding non-melanoma in Belgium was 97.9% in 2005 (Ap-pendix 3). Compared to other cancer registries like in Finland, Austria and Switzer-land with MV% between 90% and 94%, the result for Belgium is higher than ex-pected.(28) Especially in the Brussels Capital Region and the Walloon Region, where cancer registration started more recently than in the Flemish Region, there might be over-reliance on pathology laboratories but this is expected to evolve in the future with the integration of the data coming from the clinical part of the cancer registry network (oncological care programs in the hospitals).As expected, MV% were slightly lower for cancer of the pancreas, liver and hepatic bile duct, central nervous system and meninges as well as for persons aged 75 years and older for whom curative therapy is often not planned or where the tests them-selves are too invasive or distressing (data not shown).
Missing informationThe proportion of registered cases with unknown values for data items is also an in-dicator of data quality. Table 3 shows the percentage of registered cases with known values (as a positive indicator of validity) for the most important data items. The percentage of well specifi ed localisation and histology are reported for topography and histology.Data on the WHO performance score and treatment of the tumour were missing in about 45% of the cases, which makes these results less reliable (possible bias).The basis of diagnosis was an issue to improve in the previous registration years be-cause of the substantial proportion of missing data: the overall proportion of miss-ing data was reduced from 17.0%(6) to 0.3% in 2005.
Table 3 Percentage of registered cases with known values, Belgium
2004(N=59,976)
%
2005(N=59,478)
%
National social security number (INSZ/NISS) 87.8 92.1
Hash code 100.0 100.0
Sex 100.0 100.0
Year of birth 100.0 100.0
Zip code 100.0 100.0
Basis of diagnosis 99.3 99.7
Topography * 99.9 99.9
Histology ** 95.5 96.2
Behavior 100.0 100.0
Incidence date 100.0 100.0
WHO score 54.0 55.5
Treatments 61.0 56.8
* Percentage of well specifi ed localisations: all invasive tumours, excluding C26,C39,C76,C80,C55** Percentage of well specifi ed histology: all invasive tumours, excluding ICD-O-3 morphology < 8041
21
belg
ian
canc
er r
egis
try
canc
er in
cide
nce
in b
elgi
um 20
04–2
005

The percentage of well specifi ed laterality and availability of stage information for the most important sites is shown in table 4. The clinical (cTNM) and pathologi-cal TNM (pTNM) are reported to provide more detail. A combined modality of both staging systems (cTNM and pTNM) is also mentioned. Further in this report, only the results of the ‘combined TNM’ will be reported. To determine the combined TNM, the pathological TNM prevailed over the clinical TNM, except when the clini-cal TNM was stage IV. Clinical TNM stage information is overall quite low, but higher for sites with lit-tle surgical treatment where it is often not possible to determine the pathological TNM (e.g. lung cancer). Rather often there is no clinical counterpart reported for the pathological TNM stage or vice versa, but together they resulted in a combined TNM in about 70% of the cases. When possible, efforts must be made to have both clinical and pathological stages of the tumour.
Table 4 Percentage of well specifi ed laterality and availability of stage information, Belgium
2004 2005
Total % Total %
Laterality * 23,652 76.0 23,820 74.3
All sites, excl non-melanoma (C44) 20,932 82.0 20,863 81.1
C50 breast 9,455 92.8 9,486 92.3
C43 malignant melanoma 1,493 48.3 1,560 47.7
cTNM stage** 51,943 45.9 51,895 40.1
C01 base of tongue 77 72.7 65 69.2
C02 tongue, other 255 63.5 232 57.8
C18-C20 colon, rectosigmoid, rectum 7,570 35.7 7,501 33.2
C32 larynx 507 69.8 453 70.6
C34 lung 6,964 65.9 6,787 59.5
C50 breast 9,402 59.8 9,450 52.2
C53 cervix uteri 649 32.5 647 29.5
C54 corpus uteri 1,289 23.1 1,237 20.5
C61 prostate 9,617 46.3 9,509 40.0
pTNM stage** 51,943 49.6 51,895 48.0
C01 base of tongue 77 24.7 65 24.6
C02 tongue, other 255 45.1 232 42.7
C18-C20 colon, rectosigmoid, rectum 7,570 71.9 7,501 71.9
C32 larynx 507 24.1 453 21.4
C34 lung 6,964 18.3 6,787 16.8
C50 breast 9,402 78.9 9,450 75.0
C53 cervix uteri 649 44.7 647 43.7
C54 corpus uteri 1,289 65.1 1,237 63.1
C61 prostate 9,617 34.8 9,509 34.3
Combined TNM stage** 36,404 70.1 34,483 66.5
C01 base of tongue 77 80.5 65 78.5
C02 tongue, other 255 73.3 232 71.6
C18-C20 colon, rectosigmoid, rectum 7,570 80.9 7,501 80.9
C32 larynx 507 75.1 453 74.8
C34 lung 6,964 70.1 6,787 64.9
C50 breast 9,402 87.7 9,450 83.6
C53 cervix uteri 649 61.5 647 59.0
C54 corpus uteri 1,289 69.4 1,237 67.3
C61 prostate 9,617 61.4 9,509 56.1
Ann Arbor 59,976 5.1 59,478 4.3
C81 Hodgkin’s disease 292 51.4 295 49.5
C82-C85 Non-Hodgkin-lymphoma 1,881 32.8 1,830 34.0
* Only pair organs** Only stageable tumours
22
belg
ian
canc
er r
egis
try
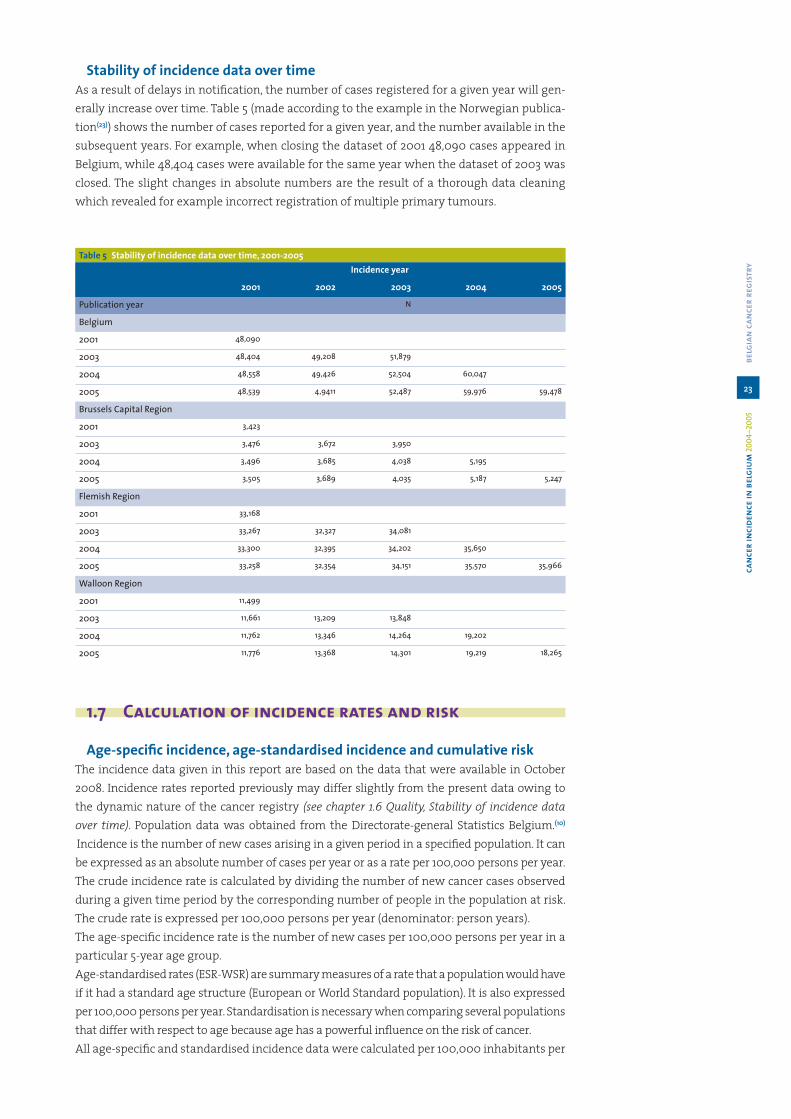
Stability of incidence data over timeAs a result of delays in notifi cation, the number of cases registered for a given year will gen-erally increase over time. Table 5 (made according to the example in the Norwegian publica-tion(23)) shows the number of cases reported for a given year, and the number available in the subsequent years. For example, when closing the dataset of 2001 48,090 cases appeared in Belgium, while 48,404 cases were available for the same year when the dataset of 2003 was closed. The slight changes in absolute numbers are the result of a thorough data cleaning which revealed for example incorrect registration of multiple primary tumours.
Table 5 Stability of incidence data over time, 2001-2005Incidence year
2001 2002 2003 2004 2005
Publication year N
Belgium
2001 48,090
2003 48,404 49,208 51,879
2004 48,558 49,426 52,504 60,047
2005 48,539 4,9411 52,487 59,976 59,478
Brussels Capital Region
2001 3,423
2003 3,476 3,672 3,950
2004 3,496 3,685 4,038 5,195
2005 3,505 3,689 4,035 5,187 5,247
Flemish Region
2001 33,168
2003 33,267 32,327 34,081
2004 33,300 32,395 34,202 35,650
2005 33,258 32,354 34,151 35,570 35,966
Walloon Region
2001 11,499
2003 11,661 13,209 13,848
2004 11,762 13,346 14,264 19,202
2005 11,776 13,368 14,301 19,219 18,265
1.7 Calculation of incidence rates and risk
Age-specifi c incidence, age-standardised incidence and cumulative riskThe incidence data given in this report are based on the data that were available in October 2008. Incidence rates reported previously may differ slightly from the present data owing to the dynamic nature of the cancer registry (see chapter 1.6 Quality, Stability of incidence data over time). Population data was obtained from the Directorate-general Statistics Belgium.(10)
Incidence is the number of new cases arising in a given period in a specifi ed population. It can be expressed as an absolute number of cases per year or as a rate per 100,000 persons per year. The crude incidence rate is calculated by dividing the number of new cancer cases observed during a given time period by the corresponding number of people in the population at risk. The crude rate is expressed per 100,000 persons per year (denominator: person years). The age-specifi c incidence rate is the number of new cases per 100,000 persons per year in a particular 5-year age group.Age-standardised rates (ESR-WSR) are summary measures of a rate that a population would have if it had a standard age structure (European or World Standard population). It is also expressed per 100,000 persons per year. Standardisation is necessary when comparing several populations that differ with respect to age because age has a powerful infl uence on the risk of cancer. All age-specifi c and standardised incidence data were calculated per 100,000 inhabitants per
23
belg
ian
canc
er r
egis
try
canc
er in
cide
nce
in b
elgi
um 20
04–2
005
year. In childhood cancer the denominator is exceptionally expressed per 1,000,000 inhabit-ants (see chapter 4 Childhood cancer).The absolute numbers, the crude, the age-specifi c and the age-standardised incidence rates of newly diagnosed cancer cases are represented by sex, primary site and region in appendix 4. The same principles are applied to calculate mortality data.The Cumulative Risk (CRi), also shown in appendix 4, is the probability or risk of individuals getting the disease during a specifi ed period. For cancer, it is expressed as the percentage of new born children who would be expected to develop a particular cancer before the age of 75 if they had the rates of cancer currently observed.(31, 5)
1.8 Mapping cancer incidence in Belgium
Maps based on cancer incidence data for Belgium 2004-2005 are produced for a number of common cancer types: all invasive cancers (excluding non-melanoma skin cancer), breast cancer, colorectal cancer, lung cancer, prostate cancer, cervical cancer, ovary and corpus uteri cancer, head and neck cancer and malignant melanoma.
The methodology for the creation of these maps has been developed by the Finnish Cancer Registry.(32) This methodology has been applied in collaboration with the Finnish Cancer Reg-istry for several regions, e.g. the Nordic countries http://astra.cancer.fi /cancermaps/Nordic and http://astra.cancer.fi /cancermaps/Nordic/mort, the Netherlands http://www.ikcnet.nl/page.php?id=2465&nav_id=41(33) and the State of Ohio in USA.(34)
Data Maps are based on the municipality-specifi c incidence data collected by the Belgian Cancer Registry for the registration years 2004-2005. Cancer incidence rates adjusted for age using the World Standard Population were calculated for each municipality for the 2-year period 2004-2005.
Smoothing Smoothing geographical incidence data allows capturing a global overall pattern of can-cer in Belgium. The spatial interpolation of the incidence rates was conducted using the methodology developed at the Finnish Cancer Registry.(32, 35) The methodology was adjusted to the Belgian situation and characteristics.Age-adjusted incidence rates for cities with at least 80,000 inhabitants are shown as circles with a diameter relative to the population size and a colour shading indicating the actual calculated age-standardised incidence rate in that city. The capital of Limburg, Hasselt (69,538 inhabitants in 2005), was included as an extra city to be represented as a circle on the map. Largest cities should sometimes be divided into smaller parts because lifestyle may vary greatly within the cities as well.(36) The Brussels Capital Region (more than 1,000,000 inhab-itants) was divided in three different zones each represented by a circle. The division was based on socio-economic parameters defi ned in collaboration with the ‘Observatorium voor Gezondheid en Welzijn – Brussel Hoofdstad / Observatoire de la Santé et du Social – Bruxelles Capitale’ (Table 6).
24
belg
ian
canc
er r
egis
try

Table 6 Three subdivisions of the Brussels Capital Region
West (n=327,251) Middle (n=457,023) East (n=213,582)
Anderlecht Schaarbeek/Schaerbeek Ukkel/UccleKoekelberg Evere Watermaal-Bosvoorde/ Watermael-BoitsfortSint-Jans-Molenbeek/Molenbeek-Saint-Jean
Etterbeek Sint-Lambrechts-Woluwe/Woluwe-Saint-Lambert
Sint-Gillis / Saint-Gilles Vorst/Forest Sint-Pieters-Woluwe/Woluwe-Saint-PierreSint-Joost-Ten-Node/Saint-Josse-Ten-Noode
Elsene/Ixelles Oudergem/Auderghem
Brussel/Bruxelles JetteSint-Agatha-Berchem/Berchem-Sainte-AgatheGanshorenLaken/LaekenNeder-Over-HeembeekHaren
Rates from all remaining zones are shown as fl oating averages of several neighbouring mu-nicipalities. For each grid (size 0.5 x 0.5 km) on the map, a rate was calculated as a weighted average of the age-adjusted incidence rates in all the municipalities with population cen-tres within 100 km from the centre of the grid. The weights were inversely associated with distance, the weight being halved where the distance was 12 km (Figure 4). In addition, the weights were made directly proportional to the sizes of the populations within the 100 km circle. The incidence rates of the cities that were presented as circles on the map were ex-cluded from the smoothing process.
Figure 4 Smoothing Process
Weighting Function: Wd = 1/(1+[d/d0]2)
25
belg
ian
canc
er r
egis
try
canc
er in
cide
nce
in b
elgi
um 20
04–2
005

Smoothing may hide some real high rates in areas with small populations. If there is some underlying knowledge or suspicion of an association between an exposure and disease, other methodologies should be applied for further investigation and analysis.
ScaleA relative scale is used in all maps, with 19 colours, ranging from blue and green shadings depicting low rates, to red and violet depicting high rates (Figure 5). One step change from one colour level to another corresponds to a 10% or 1.1-fold relative change in the incidence rate. The lower limit of the highest category is therefore always 5.05 times (1.117) the upper limit of the lowest category. If the geographical variation for a given cancer is smaller than 5.05, the extreme colours are not used in the maps. The reference rate giving the mid-point for each scale is the age-adjusted incidence rate for Belgium (2004-2005) for the specifi c cancer site and sex.
Figure 5 Principle of the scale
Central value (r):WSR for Belgium 2004-2005
26
belg
ian
canc
er r
egis
try

2 Cancer incidence: general results
Figure 6 Absolute number of invasive tumours in 2004-2005
Flemish Region2004: 34,4582005: 34,686
Walloon Region2004: 18,5132005: 17,494
Brussels Capital Region
2004: 4,9952005: 5,005
Females2004: 25,9282005: 25,701
Males2004: 32,0382005: 31,484
Belgium2004: 57,9662005: 57,185
a Results reported in this chapter include all diagnoses of cancer excluding non-melanoma skin cancer.
a Former borderline haematological malignancies (myeloproliferative diseases and myelo-dysplastic syndromes) are now included in the list of invasive tumours as they are consid-ered malignant since publication of the ICD-O-3 (WHO classifi cation, 2001).
a A decrease of 781 cases was observed for Belgium between 2004 and 2005, although a year-ly increase of about 1.5 % in the absolute numbers of cancer cases is expected due to the ageing of the population. In the Flemish region, an average annual increase of 3% in males and 2.4% in females was observed in the period 1999-2005; half of this increase can be at-tributed to ageing (Appendix 7).
a In the Flemish Region, an increase of 228 cases was observed between 2004 and 2005, which is somewhat less than expected due to ageing. No change was observed for the ab-solute number of cancers in the Brussels Capital Region. In the Walloon Region there was a decrease of 1,019 cases. One third can be explained by a decrease of prostate cancer. In the context of ageing, no conclusions can be drawn for the Walloon and Brussels Capital Region due to a possible inclusion of prevalent cases in 2004, a known and common phenomenon in the fi rst years of a registry. (37)
27
belg
ian
canc
er r
egis
try
canc
er in
cide
nce
in b
elgi
um 20
04–2
005

Table 7 Invasive tumours*: Incidence by sex and region, 2004-2005
Males CR ESR WSR CRi
Belgium 622.9 520.6 359.3 35.2
Brussels Capital Region 520.6 502.1 349.0 34.2
Flemish Region 653.7 521.9 358.5 35.1
Walloon Region 597.1 521.6 362.6 35.8
Females CR ESR WSR CRi
Belgium 485.1 372.4 273.0 26.3
Brussels Capital Region 477.8 396.5 291.8 27.9
Flemish Region 495.2 370.9 270.8 26.0
Walloon Region 469.4 369.6 272.5 26.3
CR: crude (all ages) incidence rate (n/100,000 person years)ESR and WSR: age-standardised incidence rate, using the European or World Standard Population (n/100,000 person years)CRi: Cumulative Risk 0-74 years (%)* excluding non-melanoma skin cancer
a Incidence rates for 2004-2005 for all invasive tumours do not show large differences be-tween the 3 Belgian regions.
a A slightly higher incidence in females in the Brussels Capital Region can be explained by a higher breast cancer incidence.
a The slightly lower incidence rate for males in the Brussels Capital Region can be attributed to a lower prostate cancer incidence.
Figure 7 The 10 most frequently occurring invasive tumours in males, Belgium 2005
28
belg
ian
canc
er r
egis
try

Figure 8 The 10 most frequently occurring invasive tumours in females, Belgium 2005
a Prostate cancer is the most frequent cancer in Belgium.a Breast cancer remains the most important tumour in females.a Combined data for males and females reveals that colorectal cancer (7,519 cases) is the third
most frequent tumour in Belgium, followed by lung cancer (6,808 cases).a Prostate (17%), breast (16%), colorectal (13%) and lung cancer (12%) cover more than 58% of all
new diagnosed malignant tumours in Belgium.
Figure 9 The 10 most frequent causes of death from cancer in males, Belgium 2004
29
belg
ian
canc
er r
egis
try
canc
er in
cide
nce
in b
elgi
um 20
04–2
005

Figure 10 The 10 most frequent causes of death from cancer in females, Belgium 2004
a Belgian cancer mortality data for 2004 shows that lung cancer is by far the most important cause of death by cancer in males.(20-22)
a In females, breast cancer is the most important cause of death by cancer.a Colorectal cancer is the second most important cause of death by cancer in both sexes.a Prostate cancer is the third most common cause of death by cancer in males.a Lung (24%), breast (9%), colorectal (11%) and prostate cancer (5%) are responsible for half
(49%) of all deaths by cancer in Belgium.
Figure 11 Invasive tumours (excl. non-melanoma skin cancer): Age-specifi c incidence by sex, Belgium 2004-2005
a The risk of developing cancer starts to increase at younger age for females than for males. This is mainly caused by malignant melanoma, breast cancer and gynaecological cancer. From the age of 50 years, the age-specifi c incidence starts to increase in males. At 65 years the risk in males is already twice as high as the risk in females, which is mainly attributable to prostate and lung cancer.
a The male/female ratio for patients younger than 50 years is 0.56. For patients of 50 years and older the male/female ratio is 1.38.
30
belg
ian
canc
er r
egis
try

Table 8 The fi ve most frequently occuring invasive tumours by region, age group and sex, 2004-2005
See next pages.
a The distribution of cancer incidence by primary site varies with age.a In children, leukaemia and brain tumours are the most frequently occurring cancers.a Invasive tumours of the genital organs, haematological malignancies and malignant
melanoma are the most important cancers in the adolescents and the young adults (15-44). a In patients of 45 years and older the most frequently occurring tumours are prostate, breast,
lung and colorectal cancer.
31
belg
ian
canc
er r
egis
try
canc
er in
cide
nce
in b
elgi
um 20
04–2
005

Table 8 The fi ve most frequently occuring invasive tumours by region, age group and sex, 2004-2005
Boys & Girls (0-14 years) 1 2 3 4 5
Belgium Leukaemia (30%) Brain (13%) Kidney (7%) Non-Hodgkin lymphoma (7%) Hodgkin lymphoma (7%)
Brussels Capital Region Leukaemia (45%) Adrenal gland (7%) Brain (6%) Soft tissue (6%) Kidney (5%)
Flemish Region Leukaemia (27%) Brain (13%) Kidney (8%) Hodgkin lymphoma (8%) Non-Hodgkin lymphoma (7%)
Walloon Region Leukaemia (27%) Brain (16%) Non-Hodgkin lymphoma (8%) Kidney (7%) Bone (6%)
Males (15-29 years) 1 2 3 4 5
Belgium Testis (26%) Hodgkin lymphoma (12%) Non-Hodgkin lymphoma (10%) Brain (9%) Melanoma (9%)
Brussels Capital Region Testis (19%) Non-Hodgkin lymphoma (17%) Leukaemia (15%) Hodgkin lymphoma (11%) Brain (7%)
Flemish Region Testis (25%) Hodgkin lymphoma (13%) Melanoma (10%) Brain (9%) Non-Hodgkin lymphoma (9%)
Walloon Region Testis (31%) Hodgkin lymphoma (12%) Melanoma (10%) Brain (10%) Non-Hodgkin lymphoma (7%)
Females (15-29 years) 1 2 3 4 5
Belgium Melanoma (20%) Breast (12%) Hodgkin lymphoma (11%) Thyroid gland (11%) Cervix uteri (5%)
Brussels Capital Region Melanoma (14%) Thyroid gland (14%) Leukaemia (12%) Breast (11%) Hodgkin lymphoma (9%)
Flemish Region Melanoma (19%) Breast (13%) Hodgkin lymphoma (12%) Thyroid gland (10%) Cervix uteri (6%)
Walloon Region Melanoma (24%) Thyroid gland (12%) Hodgkin lymphoma (11%) Breast (10%) Brain (6%)
Males (30-44 years) 1 2 3 4 5
Belgium Testis (11%) Melanoma (11%) Colorectal (9%) Head and Neck (8%) Non-Hodgkin lymphoma (8%)
Brussels Capital Region Melanoma (10%) Lung (9%) Head and Neck (9%) Testis (8%) Colorectal (8%)
Flemish Region Melanoma (12%) Testis (11%) Colorectal (11%) Non-Hodgkin lymphoma (8%) Head and Neck (6%)
Walloon Region Testis (13%) Head and Neck (11%) Lung (9%) Melanoma (8%) Colorectal (7%)
Females (30-44 years) 1 2 3 4 5
Belgium Breast (47%) Cervix uteri (9%) Melanoma (9%) Thyroid gland (5%) Colorectal (4%)
Brussels Capital Region Breast (51%) Thyroid gland (7%) Melanoma (7%) Cervix uteri (6%) Non-Hodgkin lymphoma (4%)
Flemish Region Breast (47%) Cervix uteri (11%) Melanoma (10%) Thyroid gland (4%) Colorectal (4%)
Walloon Region Breast (47%) Cervix uteri (9%) Melanoma (8%) Thyroid gland (8%) Colorectal (4%)
32 belgian cancer registry
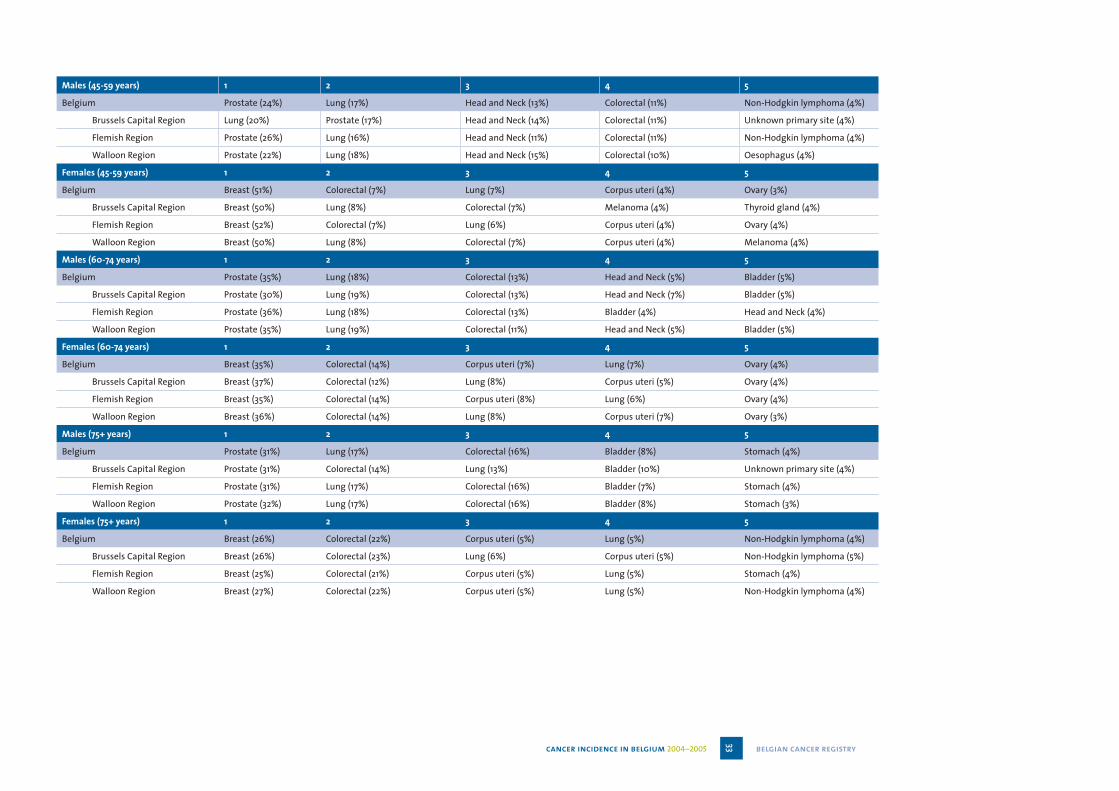
Males (45-59 years) 1 2 3 4 5
Belgium Prostate (24%) Lung (17%) Head and Neck (13%) Colorectal (11%) Non-Hodgkin lymphoma (4%)
Brussels Capital Region Lung (20%) Prostate (17%) Head and Neck (14%) Colorectal (11%) Unknown primary site (4%)
Flemish Region Prostate (26%) Lung (16%) Head and Neck (11%) Colorectal (11%) Non-Hodgkin lymphoma (4%)
Walloon Region Prostate (22%) Lung (18%) Head and Neck (15%) Colorectal (10%) Oesophagus (4%)
Females (45-59 years) 1 2 3 4 5
Belgium Breast (51%) Colorectal (7%) Lung (7%) Corpus uteri (4%) Ovary (3%)
Brussels Capital Region Breast (50%) Lung (8%) Colorectal (7%) Melanoma (4%) Thyroid gland (4%)
Flemish Region Breast (52%) Colorectal (7%) Lung (6%) Corpus uteri (4%) Ovary (4%)
Walloon Region Breast (50%) Lung (8%) Colorectal (7%) Corpus uteri (4%) Melanoma (4%)
Males (60-74 years) 1 2 3 4 5
Belgium Prostate (35%) Lung (18%) Colorectal (13%) Head and Neck (5%) Bladder (5%)
Brussels Capital Region Prostate (30%) Lung (19%) Colorectal (13%) Head and Neck (7%) Bladder (5%)
Flemish Region Prostate (36%) Lung (18%) Colorectal (13%) Bladder (4%) Head and Neck (4%)
Walloon Region Prostate (35%) Lung (19%) Colorectal (11%) Head and Neck (5%) Bladder (5%)
Females (60-74 years) 1 2 3 4 5
Belgium Breast (35%) Colorectal (14%) Corpus uteri (7%) Lung (7%) Ovary (4%)
Brussels Capital Region Breast (37%) Colorectal (12%) Lung (8%) Corpus uteri (5%) Ovary (4%)
Flemish Region Breast (35%) Colorectal (14%) Corpus uteri (8%) Lung (6%) Ovary (4%)
Walloon Region Breast (36%) Colorectal (14%) Lung (8%) Corpus uteri (7%) Ovary (3%)
Males (75+ years) 1 2 3 4 5
Belgium Prostate (31%) Lung (17%) Colorectal (16%) Bladder (8%) Stomach (4%)
Brussels Capital Region Prostate (31%) Colorectal (14%) Lung (13%) Bladder (10%) Unknown primary site (4%)
Flemish Region Prostate (31%) Lung (17%) Colorectal (16%) Bladder (7%) Stomach (4%)
Walloon Region Prostate (32%) Lung (17%) Colorectal (16%) Bladder (8%) Stomach (3%)
Females (75+ years) 1 2 3 4 5
Belgium Breast (26%) Colorectal (22%) Corpus uteri (5%) Lung (5%) Non-Hodgkin lymphoma (4%)
Brussels Capital Region Breast (26%) Colorectal (23%) Lung (6%) Corpus uteri (5%) Non-Hodgkin lymphoma (5%)
Flemish Region Breast (25%) Colorectal (21%) Corpus uteri (5%) Lung (5%) Stomach (4%)
Walloon Region Breast (27%) Colorectal (22%) Corpus uteri (5%) Lung (5%) Non-Hodgkin lymphoma (4%)
33 belgian cancer registrycancer incidence in belgium 2004–2005

Figure 12 Invasive tumours (excl. non-melanoma skin cancer and MDS-MPD): Age-standardised incidence (WSR) by sex, Flemish Region 1999-2005
a Age-standardised incidence in the Flemish Region slightly increases in males and females between 1999 and 2005.
a The increase in males is mainly due to an increase in prostate cancer detection.a The increase in females is mainly due to an increase in breast cancer.
Table 9 New diagnoses of cancer and deaths from cancer, Flemish Region 1999-2005
New cancer diagnoses Deaths from cancer
Year Males Females Males Females
1999 15,976 12,873 8,906 6,382
2000 17,066 13,757 8,886 6,227
2001 17,729 14,295 8,755 6,218
2002 17,055 14,035 8,782 6,366
2003 18,120 14,588 8,749 6,263
2004 19,159 14,802 8,570 6,112
2005 19,182 15,001 8,782 6,338
a In the short observation period from 1999 to 2005 (7 consecutive years) the mortality/in-cidence ratio has decreased from 55% to 45% in males and from 50% to 42% in females. This decrease can mainly be attributed to the continuous improvements in diagnostic and therapeutic procedures and to the screening activities.
34
belg
ian
canc
er r
egis
try

Figure 13 Invasive tumours (excl. non-melanoma skin cancer): Age-standardised incidence rates (WSR) by sex
Males
Females
a Belgium has one of the highest cancer incidence rates in Europe. This can largely be ex-plained by a very high prostate and breast cancer incidence.
35
belg
ian
canc
er r
egis
try
canc
er in
cide
nce
in b
elgi
um 20
04–2
005

Figure 14 The 10 most frequently occurring invasive tumours: Age-standardised incidence (WSR) by region, 2004-2005
Males
Females
a Incidence rates for 2004-2005 are fairly comparable between the 3 Belgian regions.a Compared to the Flemish Region, a higher incidence of head and neck and lung cancer has
been observed in the Walloon and Brussels Capital Region (for both sexes).a Prostate cancer has the lowest incidence rate in the Brussels Capital Region.a A specifi c underregistration of leukaemia in the Walloon Region mainly explains the lower
incidence in that region.
36
belg
ian
canc
er r
egis
try

Figure 15 Incidence of All Cancers, Belgium 2004-2005
Males
Females
37
belg
ian
canc
er r
egis
try
canc
er in
cide
nce
in b
elgi
um 20
04–2
005

3 Cancer incidence: description of several selected malignancies
3.1 Head and neck cancer (icd-10 c00-c14, c30-c32)
Table 10 Head and neck cancer: Incidence by sex and region, 2004-2005
Males CR ESR WSR CRi
Belgium 37.0 33.3 24.0 2.8
Brussels Capital Region 35.4 37.6 27.6 3.3
Flemish Region 34.1 29.3 20.9 2.4
Walloon Region 42.7 39.8 28.8 3.4
Females CR ESR WSR CRi
Belgium 10.5 8.6 6.3 0.7
Brussels Capital Region 12.1 10.7 7.7 0.9
Flemish Region 9.3 7.4 5.4 0.6
Walloon Region 12.2 10.3 7.6 0.8
CR: crude (all ages) incidence rate (n/100,000 person years)ESR and WSR: age-standardised incidence rate, using the European or World Standard Population (n/100,000 person years)CRi: Cumulative Risk 0-74 years (%)
a Belgium 2005: 1,806 new diagnoses of head and neck cancer in males and 553 in females.a Head and neck cancer is the fourth most frequent tumour in males (6%) and the ninth most
frequent in females (2%).a Head and neck cancer incidence is higher in the Walloon and Brussels Capital Region than
in the Flemish Region.a Belgium 2004: 601 males and 176 females died from head and neck cancer.a Head and neck cancer is the fi fth most important cause of death by cancer in males (4%).a The risk of being diagnosed with head and neck cancer before the age of 75 is 2.8% for males
and 0.7% for females.a The incidence rates for head and neck cancer are lower in the Flemish Region when com-
pared to the Brussels Capital and the Walloon Region.
Figure 16 Head and neck cancer: Age-specifi c incidence by sex, Belgium 2004-2005
a Mean age at diagnosis was 62 years in males and 63 years in females.a Until the age of 35 the risk of head and neck cancer is comparable for males and females.
Between the ages of 40 and 65 a steep increase in incidence in males is observed. At the peak incidence (age group 60-64 years) the risk for males is four times higher than the risk for females.
38
belg
ian
canc
er r
egis
try

Figure 17a Head and neck cancer: Age-standardised incidence (WSR) by sex, Flemish Region 1999-2005
Figure 17b Head and neck cancer in males: Age-standardised incidence (WSR) by age group, Flemish Region 1999-2005
Figure 17c Head and neck cancer in females: Age-standardised incidence (WSR) by age group, Flemish Region 1999-2005
a Age-standardised incidence rates in the Flemish Region between 1999 and 2005 show little variation for males. In females an increase of incidence rates is observed. This increase can almost completely be attributed to an increase of incidence for women in the age group of 60-74 years.
39
belg
ian
canc
er r
egis
try
canc
er in
cide
nce
in b
elgi
um 20
04–2
005

Figure 18 Head and neck cancer: Age-standardised incidence rates (WSR) by sex
Males
Females
a The incidence rates for head and neck cancer in Belgium are among the highest in Europe. For females, the incidence rate is even the highest among the selected European data.
40
belg
ian
canc
er r
egis
try

Table 11 Head and neck cancer: Primary tumour localisations by sex, Belgium 2005
Belgium 2005 Total Males Females
Primary site n % n % n %
Lip and oral cavity 717 30.4 507 28.1 210 38.0
Lip 87 3.7 63 3.5 24 4.3
Tongue 235 10.0 171 9.5 64 11.6
Gum 50 2.1 29 1.6 21 3.8
Floor of mouth 185 7.8 149 8.3 36 6.5
Hard palate and palate unspecifi ed 40 1.7 25 1.4 15 2.7
Mouth, nos 120 5.1 70 3.9 50 9.0
Pharynx 678 28.7 538 29.8 140 25.3
Oropharynx 440 18.7 337 18.7 103 18.6
Base of tongue 65 2.8 50 2.8 15 2.7
Soft palate and uvula 57 2.4 39 2.2 18 3.3
Tonsil 204 8.6 151 8.4 53 9.6
Oropharynx, other and unspecifi ed 114 4.8 97 5.4 17 3.1
Nasopharynx 46 1.9 38 2.1 8 1.4
Hypopharynx 192 8.1 163 9.0 29 5.2
Pyriform sinus 132 5.6 118 6.5 14 2.5
Hypopharynx 60 2.5 45 2.5 15 2.7
Larynx 628 26.6 543 30.1 85 15.4
Glottis 290 12.3 262 14.5 28 5.1
Supraglottis 159 6.7 128 7.1 31 5.6
Larynx other and unspecifi ed 179 7.6 153 8.5 26 4.7
Nasal Cavity and Paranasal Sinuses 128 5.4 92 5.1 36 6.5
Nasal cavity and middle ear 38 1.6 22 1.2 16 2.9
Accesory sinuses 90 3.8 70 3.9 20 3.6
Salivary Glands 146 6.2 75 4.2 71 12.8
Parotid gland 93 3.9 48 2.7 45 8.1
Salivary glands, nos 53 2.2 27 1.5 26 4.7
Lip, oral cavity and pharynx, nos 62 2.6 51 2.8 11 2.0
Head and neck cancer 2,359 100 1,806 100 553 100
a The male/female ratio of head and neck cancer is 3.2. There are however important differ-ences by sublocalisation. Cancer of the larynx is the most common cancer in the head and neck area in males (M/F ratio = 6.4), whereas in females the majority of the head and neck cancers are located in the oral cavity (M/F ratio = 2.4). The incidence for salivary glands is equally divided between the sexes (M/F ratio = 1.1).
41
belg
ian
canc
er r
egis
try
canc
er in
cide
nce
in b
elgi
um 20
04–2
005

Figure 19 Head and neck cancer: evolution of the male/female risk ratio, Belgium 1997-2005
a Combined data from the Flemish Cancer Registry Network (1997-2001) and the Belgian Cancer Registry (2002-2005) show decreasing trends in the male/female ratio for head and neck cancer. This decrease is most apparent for laryngeal cancer and to a smaller extent for cancer of the lip and the oral cavity. The M/F ratio for cancer of the pharynx remains stable.
42
belg
ian
canc
er r
egis
try

Figure 20 Incidence of head and neck cancer, Belgium 2004-2005
Males
Females
43
belg
ian
canc
er r
egis
try
canc
er in
cide
nce
in b
elgi
um 20
04–2
005

3.2 Colorectal cancer (icd-10 c18-c20)
Table 12 Colorectal cancer: Incidence by sex and region, 2004-2005
Males CR ESR WSR CRi
Belgium 80.4 65.4 43.3 5.0
Brussels Capital Region 65.0 61.8 41.3 5.0
Flemish Region 88.4 68.9 45.5 5.3
Walloon Region 70.4 59.6 39.5 4.6
Females CR ESR WSR CRi
Belgium 64.8 41.3 27.7 3.2
Brussels Capital Region 63.0 40.7 27.1 3.0
Flemish Region 66.5 41.8 28.0 3.2
Walloon Region 62.4 40.5 27.3 3.2
CR: crude (all ages) incidence rate (n/100,000 person years)ESR and WSR: age-standardised incidence rate, using the European or World Standard Population (n/100,000 person years)CRi: Cumulative Risk 0-74 years (%)
a Belgium 2005: 4,111 new diagnoses in males and 3,408 in females.a Colorectal cancer is the 3rd most frequent cancer in males and the second in females.a Colorectal cancers represent about 13% of all types of cancer.a Colorectal cancer is the second cause of death by cancer in males and females.a Belgium 2004: 1,072 males and 940 females died from colorectal cancer. The mortality inci-
dence ratio is 0.26.a The risk of being diagnosed with colorectal cancer before the age of 75 is 5% in males and
3.2% in females.a The incidence in males is slightly higher in the Flemish Region than in the other regions.
There is no such difference in females.
Figure 21 Colorectal cancer: Age-specifi c incidence by sex, Belgium 2004-2005
a The mean age at diagnosis is 70 years in males and 72 in females.a The age specifi c incidence sharply increases with age.a Until the age of 50 years, the risk is comparable in males and females; after the age of 50
years, the incidence is higher in males than in females.a Age-standardised rates differ greatly between males and females: the sex ratio (M/F) is 1.6.
44
belg
ian
canc
er r
egis
try

Figure 22 Colorectal cancer: Primary tumour localisation, Belgium 2004-2005 (excl. colon not otherwise specifi ed, N = 1,937 (12.8%))
Splenic fl exure1.6%
Descending colon5.5%
Sigmoid colon23.9%
Rectosigmoid7.2%Rectum
31.7%
Appendix1.6%
Caecum10.8%
Ascending colon12.0%
Hepatic fl exure1.7%
Transverse colon3.9%
a 60% of all colorectal cancers are diagnosed in the distal part of the colon (sigmoid, rectosig-moid junction and rectum).
Figure 23 Colorectal cancer: Age-standardised incidence (WSR) by sex, Flemish Region 1999-2005
a The age-standardised incidence of colorectal cancer in males shows a slight increase be-tween 1999 and 2005 and remains relatively stable in females.
45
belg
ian
canc
er r
egis
try
canc
er in
cide
nce
in b
elgi
um 20
04–2
005

Figure 24 Colorectal cancer (males and females): Stage by region, 2004-2005
a 50 % of colorectal cancer cases have advanced stages at diagnosis (stage III or IV).a There is no difference in stage distribution between the regions.a No information on stage is available in 19% of the colorectal cancer cases.
46
belg
ian
canc
er r
egis
try

Figure 25 Colorectal cancer: age-standardised incidence rates (WSR) by sex
Males
Females
a Colorectal cancer incidence in males is relatively high in comparison with other European countries. The incidence in females is positioned in the middle among the selected Euro-pean data.
47
belg
ian
canc
er r
egis
try
canc
er in
cide
nce
in b
elgi
um 20
04–2
005
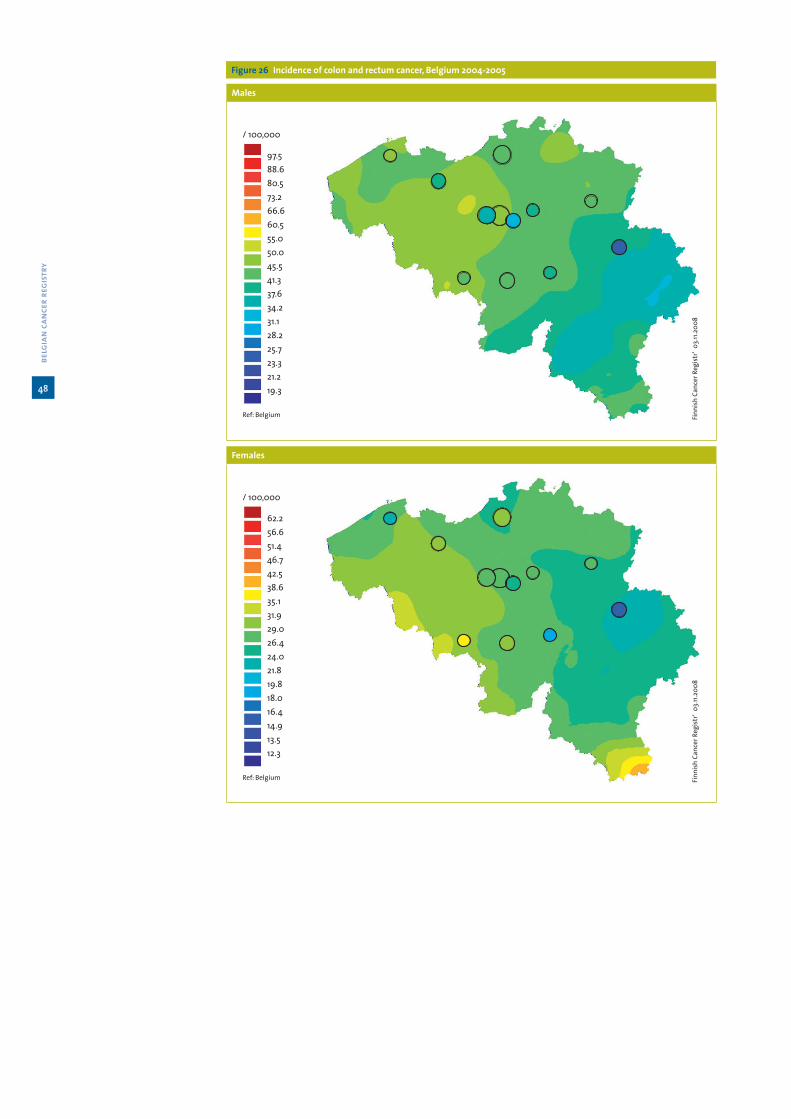
Figure 26 Incidence of colon and rectum cancer, Belgium 2004-2005
Males
Females
48
belg
ian
canc
er r
egis
try

3.3 Lung cancer (icd-10 c34)
Table 13 Lung cancer: Incidence by sex and region, 2004-2005
Males CR ESR WSR CRi
Belgium 105.1 86.8 58.8 7.2
Brussels Capital Region 83.8 83.6 58.1 7.3
Flemish Region 108.1 84.6 56.8 7.0
Walloon Region 106.1 92.0 62.9 7.8
Females CR ESR WSR CRi
Belgium 28.9 22.7 16.2 1.9
Brussels Capital Region 33.4 28.6 20.3 2.4
Flemish Region 27.6 20.8 14.8 1.8
Walloon Region 29.9 24.7 17.8 2.1
CR: crude (all ages) incidence rate (n/100,000 person years)ESR and WSR: age-standardised incidence rate, using the European or World Standard Population (n/100,000 person years)CRi: Cumulative Risk 0-74 years (%)
a Belgium 2005: 5,268 new lung cancer diagnoses in males and 1,540 in females.a Lung cancer is the second most frequent tumour in males (17%) and the third most frequent
in females (7%).a Belgium 2004: 4,828 males and 1,274 females died from lung cancer.a Lung cancer is the most important cause of death by cancer in males (33%).a The risk of being diagnosed with lung cancer before the age of 75 is 7.2% for males and 1.9%
for females.a Lung cancer incidence in females is higher in the Walloon and Brussels Capital Region than
in the Flemish Region.
Figure 27 Lung cancer: Age-specifi c incidence by sex, Belgium 2004-2005
a Mean age at diagnosis was 68 years in males and 65 years in females.a Until the age of 45 the risk of lung cancer is comparable for males and females.
49
belg
ian
canc
er r
egis
try
canc
er in
cide
nce
in b
elgi
um 20
04–2
005

Figure 28 Lung cancer: Age-standardised incidence (WSR) by age group, Flemish Region 1999-2005
Males
Females
a Rapid increase of lung cancer in females, while the incidence rates in males are more stable and seem to decrease.
Figure 29 Lung cancer: evolution of the male/female risk ratio, Belgium 1987-2005
a Combined data from the National Cancer Registry (1987-1995), the Flemish Cancer Registry Network (1996-2001) and the Belgian Cancer Registry (2002-2005) show decreasing trends in the male/female ratio. Younger females are evolving towards the same risk of developing lung cancer as males.
50
belg
ian
canc
er r
egis
try
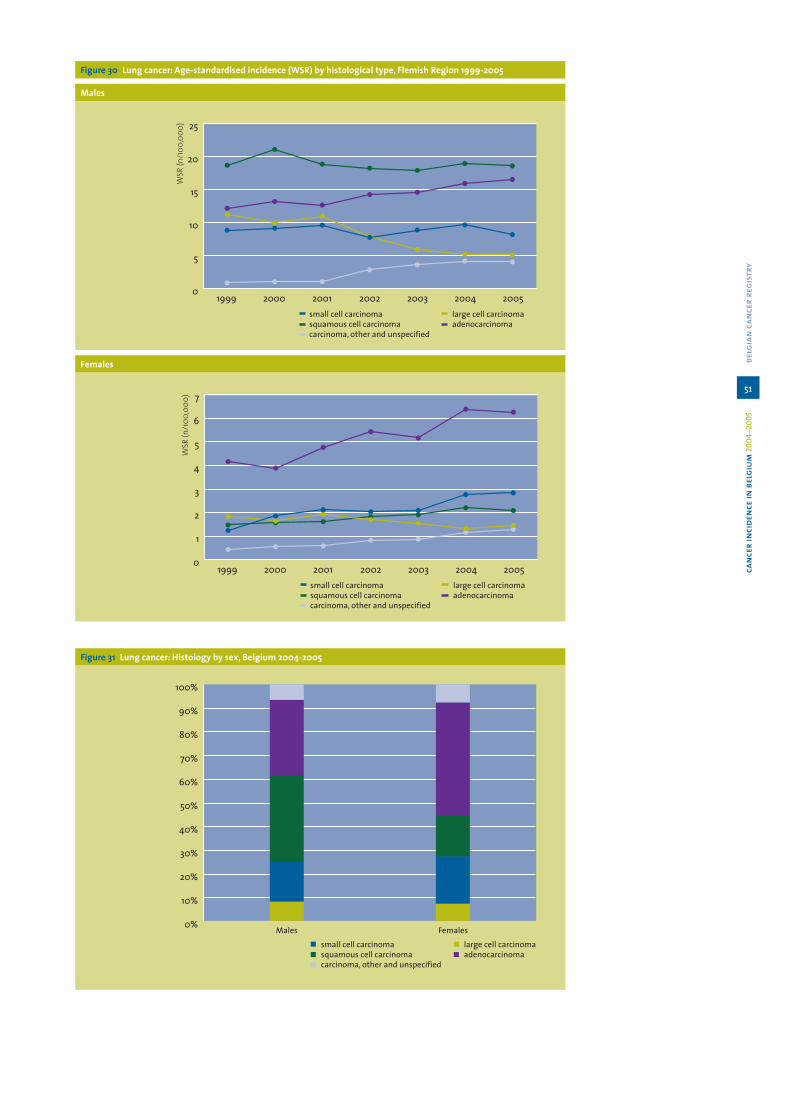
Figure 30 Lung cancer: Age-standardised incidence (WSR) by histological type, Flemish Region 1999-2005
Males
Females
Figure 31 Lung cancer: Histology by sex, Belgium 2004-2005
51
belg
ian
canc
er r
egis
try
canc
er in
cide
nce
in b
elgi
um 20
04–2
005

Figure 32 Lung cancer (males & females): Stage by histological type, Belgium 2004-2005
a Main types of lung cancer are non-small cell lung carcinoma (adenocarcinoma, squamous cell carcinoma, large cell undifferentiated carcinoma) and small cell lung carcinoma.
a 10% of lung cancer in males and females are small cell lung carcinoma.a In females small cell lung carcinoma incidence increases.a Adenocarcinoma is the most common histological type in females.a In males squamous cell carcinoma still predominates, but adenocarcinoma incidence is rising.a In males and females an increase in incidence of lung adenocarcinoma is observed.a More than 60% of all lung cancers are diagnosed in a prognostic unfavourable stage (stage
III and IV).a Information on stage is missing in 30% of the lung cancer cases.
52
belg
ian
canc
er r
egis
try

Figure 33 Lung cancer: age-standardised incidence rates (WSR) by sex
Males
Females
a Lung cancer incidence in males still remains among the highest in Europa.
53
belg
ian
canc
er r
egis
try
canc
er in
cide
nce
in b
elgi
um 20
04–2
005

Figure 34 Incidence of lung cancer, Belgium 2004-2005
Males
Females
54
belg
ian
canc
er r
egis
try

3.4 Breast cancer in females (icd-10 c50)
Table 14 Breast Cancer: Incidence by region, 2004-2005
Females CR ESR WSR CRi
Belgium 176.4 146.4 108.3 11.5
Brussels Capital Region 174.1 158.5 117.5 12.5
Flemish Region 177.8 144.4 106.8 11.2
Walloon Region 174.6 147.1 109.0 11.6
CR: crude (all ages) incidence rate (n/100,000 person years)ESR and WSR: age-standardised incidence rate, using the European or World Standard Population (n/100,000 person years)CRi: Cumulative Risk 0-74 years (%)
a Belgium 2005: 9,405 new breast cancer cases.a Most frequent cancer in females (35%).a Belgium 2004: 2,286 females died from breast cancer (Mortality/incidence ratio = 0.24).a Breast cancer is the leading cause of death by cancer in females (20.6% of all cancer
deaths).a The risk of being diagnosed with breast cancer before the age of 75 years is 11.5 %.a The highest incidence rate for breast cancer in Belgium is found in the Brussels Capital
Region.
Figure 35 Breast cancer: Age-specifi c incidence, Belgium 2004-2005
a Mean age at diagnosis is 61 years.a Incidence increases slowly from the age of 20 years, and then sharply rises between 40 and
60 years. It decreases slightly from the age of 65 years on.a 25% of the breast cancer cases occurs before the age of 50 years.
55
belg
ian
canc
er r
egis
try
canc
er in
cide
nce
in b
elgi
um 20
04–2
005

Table 15 Breast cancer: Incidence and mortality data by region, Belgium 1998-2006
1998 1999 2000 2001 2002 2003 2004 2005 2006
Flemish Region
Incidence
N 4,686 4,914 5,352 5,290 5,585 5,345 5,524
ESR 133.0 138.3 149.3 145.8 152.7 143.4 145.5
WSR 98.6 102.6 110.5 107.6 112.8 106.0 107.5
Mortality
N 1,435 1,396 1,372 1,391 1,366 1,298 1,356 1,321 1,352
ESR 36.0 34.6 33.8 33.3 31.8 29.7 30.6 30.1 29.6
WSR 24.9 24.2 23.8 23.1 21.9 20.5 21.1 20.9 20.3
Brussels Capital Region
Incidence
N 929 886
ESR 164.6 152.5
WSR 122.5 112.5
Mortality
N 230 227 247 235 228 243 228 199 198
ESR 32.0 32.2 34.6 34.0 32.8 36.7 30.7 26.8 27.0
WSR 22.4 22.1 24.3 23.7 23.1 26.0 20.9 18.4 18.7
Walloon Region
Incidence
N 3,095 2,995
ESR 151.3 142.9
WSR 112.2 105.8
Mortality
N 702
ESR 28.3
WSR 19.6
ESR and WSR: age-standardised incidence rate, using the European or World Standard Population (n/100,000 person years)
a Since 1999, the incidence in the Flemish Region has increased with 900 cases; part of this increase is due to the ageing of the population. Age-standardised incidence rates increased from 1999 to 2003, then seem to decrease.
a Mortality in the Flemish Region decreases systematically over the years.a Mortality in the Brussels Capital Region increased irregularly till 2003, afterwards it begins
to decrease.
56
belg
ian
canc
er r
egis
try

Figure 36a Breast cancer: Age-standardised incidence (WSR) by year and age group, Flemish Region 1999-2005
Figure 36b Breast cancer: Age-standardised mortality (WSR) by age group, Flemish Region 1998-2006
Figure 36c Breast cancer: Age-standardised mortality (WSR) by age group, Brussels Capital Region 1998-2006
a Breast cancer incidence in the Flemish Region remains stable in the younger age groups. a In the age group 50-69 years the incidence has increased since 2001, it started to decrease
from 2004 on. The incidence always remains higher than in the group of older females.a The pattern of the evolution in females of 50-69 years could partly be explained by the role
of screening programs set up in 2001; screening leads to earlier detection of cancers and is responsible for a transient increase in incidence. Moreover, the administration of hormone substitution therapy (HST) at menopausal age could be responsible for a real increase of hormonodependent tumours; the decrease of incidence in this age group after 2003 could be related to a decrease of HST use.
a In the group of females older than 70 years, the incidence increases slowly.a In the Flemish Region, mortality decreases since 1998 in the age groups 50-69 and <50
years; it remains stable in the older females.a In the Brussels Capital Region, the decrease in mortality occurs since 2003 in the age group
50-69 years, and remains stable in the other groups.
57
belg
ian
canc
er r
egis
try
canc
er in
cide
nce
in b
elgi
um 20
04–2
005

Figure 37 Breast cancer: Stage by age group, Belgium 2004-2005
a More favorable stages (stage I and II) are found in the age group submitted to screening (50-69 years). Only 15% in this group has advanced tumour stages (stage III or IV).
a Younger females have more stage II and less stage I tumours when compared to females of the age group 50-69 years.
a Older females present with more advanced stage tumours (25% with stage III or IV tu-mours).
Figure 38 Breast cancer: Age-standardised incidence rates (WSR)
a Belgium has one of the highest incidence rates for breast cancer in Europe.
58
belg
ian
canc
er r
egis
try

Figure 39 Incidence of breast cancer, Belgium 2004-2005
Females
59
belg
ian
canc
er r
egis
try
canc
er in
cide
nce
in b
elgi
um 20
04–2
005

3.5 Gynaecological cancer (icd-10 c53-c56)
Table 16 Gynaecological cancer: Incidence by primary site, sex and region, 2004-2005
Cervix uteri CR ESR WSR CRi
Belgium 12.2 10.8 8.6 0.8
Brussels Capital Region 12.2 11.1 8.7 0.8
Flemish Region 12.7 11.2 8.9 0.9
Walloon Region 11.4 10.1 8.1 0.8
Corpus uteri CR ESR WSR CRi
Belgium 25.7 18.9 13.2 1.7
Brussels Capital Region 20.2 15.5 10.7 1.3
Flemish Region 27.6 19.9 13.9 1.8
Walloon Region 24.0 18.0 12.6 1.6
Uterus, unspecifi ed CR ESR WSR CRi
Belgium 1.3 1.0 0.7 0.1
Brussels Capital Region 0.6 0.4 0.3 0.0
Flemish Region 0.9 0.6 0.5 0.1
Walloon Region 2.2 1.6 1.2 0.1
Ovary CR ESR WSR CRi
Belgium 16.9 12.9 9.4 1.1
Brussels Capital Region 15.0 12.7 9.4 1.1
Flemish Region 18.5 13.9 10.0 1.1
Walloon Region 14.8 11.4 8.3 1.0
CR: crude (all ages) incidence rate (n/100,000 person years)ESR and WSR: age-standardised incidence rate, using the European or World Standard Population (n/100,000 person years)CRi: Cumulative Risk 0-74 years (%)
a Belgium 2005: 651 new diagnoses of cervical cancer, 1,344 of corpus uteri cancer and 908 of ovarian cancer (67 cases were reported as ‘uterus, not otherwise specifi ed’).
a 1,802 new cases of cervical carcinoma in situ were reported in 2004 and 1,687 in 2005.a Incidence rates for cervical and ovarian cancer were very similar in the three Belgian re-
gions. The incidence rate for corpus uteri cancer was lower in the Brussels Capital Region.a Tumours of the corpus uteri, the ovary and the cervix uteri were respectively the 4th, 6th
and 8th most frequent tumour in females.a The risk of being diagnosed with cervix cancer before the age of 75 is 0.8%, while it is 1.7%
for corpus and 1.1% for ovary.a Ovarian cancer was responsible for the death of 679 women in Belgium in 2004, and cancer
of the uterus for 532 deaths (cervix, corpus and uterus unspecifi ed are taken together).
60
belg
ian
canc
er r
egis
try
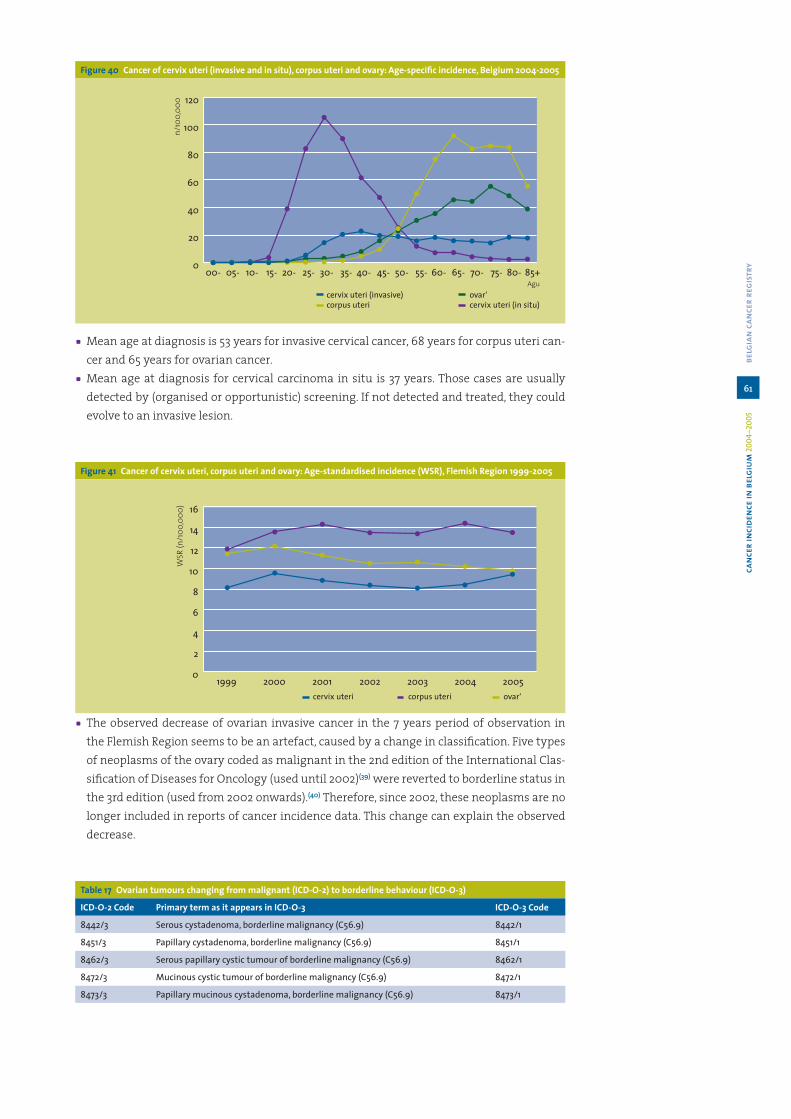
Figure 40 Cancer of cervix uteri (invasive and in situ), corpus uteri and ovary: Age-specifi c incidence, Belgium 2004-2005
a Mean age at diagnosis is 53 years for invasive cervical cancer, 68 years for corpus uteri can-cer and 65 years for ovarian cancer.
a Mean age at diagnosis for cervical carcinoma in situ is 37 years. Those cases are usually detected by (organised or opportunistic) screening. If not detected and treated, they could evolve to an invasive lesion.
Figure 41 Cancer of cervix uteri, corpus uteri and ovary: Age-standardised incidence (WSR), Flemish Region 1999-2005
a The observed decrease of ovarian invasive cancer in the 7 years period of observation in the Flemish Region seems to be an artefact, caused by a change in classifi cation. Five types of neoplasms of the ovary coded as malignant in the 2nd edition of the International Clas-sifi cation of Diseases for Oncology (used until 2002)(39) were reverted to borderline status in the 3rd edition (used from 2002 onwards).(40) Therefore, since 2002, these neoplasms are no longer included in reports of cancer incidence data. This change can explain the observed decrease.
Table 17 Ovarian tumours changing from malignant (ICD-O-2) to borderline behaviour (ICD-O-3)
ICD-O-2 Code Primary term as it appears in ICD-O-3 ICD-O-3 Code
8442/3 Serous cystadenoma, borderline malignancy (C56.9) 8442/1
8451/3 Papillary cystadenoma, borderline malignancy (C56.9) 8451/1
8462/3 Serous papillary cystic tumour of borderline malignancy (C56.9) 8462/1
8472/3 Mucinous cystic tumour of borderline malignancy (C56.9) 8472/1
8473/3 Papillary mucinous cystadenoma, borderline malignancy (C56.9) 8473/1
61
belg
ian
canc
er r
egis
try
canc
er in
cide
nce
in b
elgi
um 20
04–2
005

Figure 42 Ovarian Cancer: Age-standardised incidence (WSR), Infl uence of changes in classifi cation of borderline malignant ovarian tumours, Flemish Region 1999-2005
Figure 43 Cervix uteri cancer: age-standardised incidence rates (WSR)
Figure 44 Corpus uteri cancer: age-standardised incidence rates (WSR)
62
belg
ian
canc
er r
egis
try

Figure 45 Ovarian cancer: age-standardised incidence rates (WSR)
a Age-standardised incidence of cervical cancer varies considerably.(41) In our selection of Eu-ropean data, incidence varies from 3 per 100,000 in Finland to 13 per 100,000 in Slovenia. The Belgian incidence rate (9 per 100,000) is positioned in the middle among the selected European rates, although the repartition is not homogenous in the country (Figure 46).
a Age-standardised incidence rates of corpus uteri and ovarian cancer are also positioned in the middle among the selected European data.
Figure 46 Incidence of cervical cancer, Belgium 2004-2005
63
belg
ian
canc
er r
egis
try
canc
er in
cide
nce
in b
elgi
um 20
04–2
005

Table 18 Gynaecological cancer: Histological type, Belgium 2005
Cervix uteri (invasive tumours)
Histological type N %
Carcinoma 638 98.0
Squamous Cell Carcinoma 512 78.6
Adenocarcinoma 101 15.5
Other specifi ed Carcinoma 20 3.1
Unspecifi ed Carcinoma 5 0.8
Sarcoma 1 0.2
Other Specifi ed Malignant Neoplasm 3 0.5
Unspecifi ed malignant neoplasm 9 1.4
Total 651 100
Ovary (invasive tumours)
Histological type N %
Carcinoma 826 91.0
Serous Carcinoma 387 42.6
Mucinous Carcinoma 91 10.0
Endometroid Carcinoma 73 8.0
Clear cell Carcinoma 33 3.6
Adenocarcinoma, NOS 181 19.9
Other Specifi ed Carcinoma 43 4.7
Unspecifi ed Carcinoma 18 2.0
Sex-Cord-Stromal tumours 7 0.8
Germ Cell tumours 15 1.7
Other Specifi ed Malignant neoplasm 25 2.8
Unspecifi ed Malignant neoplasm 35 3.9
Total 908 100
a Carcinoma is the most commonly observed histological type of ovarian cancer (91%). The observed distribution of different histological types is very similar to what is described in the literature http://seer.cancer.gov/publications/mecc/mecc_ovarian.pdf
Figure 47 Incidence of corpus uteri cancer, Belgium 2004-2005
64
belg
ian
canc
er r
egis
try

Figure 48 Incidence of ovarian cancer, Belgium 2004-2005
a We observe a higher incidence of cervical cancer in some big cities such as Antwerp, Ghent, the west side of Brussels, Charleroi, Hasselt and Mons. The ‘Westhoek’ (district of Veurne) also has a relatively high rate of cervical cancer. The very low rates in the region of Arlon are diffi cult to interpret because of the small numbers of cancer cases and low density of population. Five years maps would be more appropriate to comment this observation.
65
belg
ian
canc
er r
egis
try
canc
er in
cide
nce
in b
elgi
um 20
04–2
005

3.6 Prostate cancer (icd-10 c61)
Table 19 Prostate cancer: Incidence by region, 2004-2005
Males CR ESR WSR CRi
Belgium 187.6 154.3 103.2 12.7
Brussels Capital Region 133.0 125.7 82.8 10.2
Flemish Region 202.6 159.0 106.2 13.0
Walloon Region 176.4 152.4 102.5 12.7
CR: crude (all ages) incidence rate (n/100,000 person years)ESR and WSR: age-standardised incidence rate, using the European or World Standard Population (n/100,000 person years)CRi: Cumulative Risk 0-74 years (%)
a With 9,510 new cases in 2005 in Belgium, prostate cancer is the most frequent cancer in males (31% of cancer in males), and even the most frequent of all cancers (both sexes taken into account).
a Development of indolent prostate cancer with ageing is a well known phenomenon; wide application of early detection by means of prostate-specifi c antigen blood analyses can par-tially explain the very high prostate cancer detection rates.
Figure 49 Prostate cancer: Age-specifi c incidence, Belgium 2004-2005
a Prostate cancer is a rare disease before the age of 50 years, afterwards the incidence in-creases sharply with age.
a Mean age at diagnosis is 70 years.
66
belg
ian
canc
er r
egis
try

Figure 50 Prostate cancer: Age-standardised incidence and mortality (WSR) by age group, Flemish Region 1999-2005
All ages
45-59 years
60-74 years
67
belg
ian
canc
er r
egis
try
canc
er in
cide
nce
in b
elgi
um 20
04–2
005

75+ years
a As prostate cancer detection is closely related to the practice of PSA-screening, an increase of incidence over years is more likely due to screening practices rather than a true increase of risk.
a Incidence of prostate cancer increases through the period 1999-2005, while mortality re-mains stable till 2002. Mortality seems to decrease slowly from 2002 on.
a The largest increase of incidence occurs in the age group of 45-59 years. Mortality remains stable.
a In the age group of 60-74 years incidence increases moderately and mortality decreases.a In the oldest age group (75+), incidence and mortality remain stable over time.a Belgian rates of prostate cancer are quite high when compared to other European data.
Figure 51 Prostate cancer: age-standardised incidence rates (WSR)
a Prostate cancer was the cause of death in 1,377 males in 2004 in Belgium, with a mortality/incidence ratio of 0.14. It is the third cause of death by cancer in males (9.3%).
a The risk of being diagnosed with a prostate cancer before the age of 75 years is 12.7%.
68
belg
ian
canc
er r
egis
try
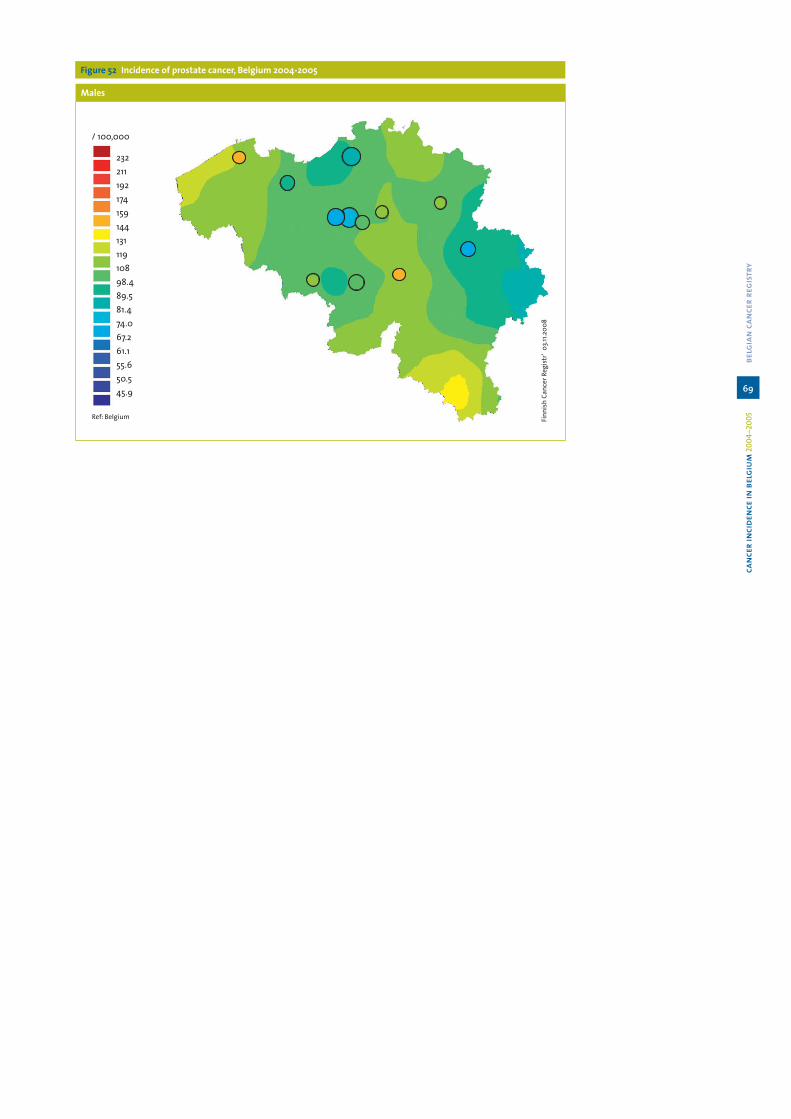
Figure 52 Incidence of prostate cancer, Belgium 2004-2005
Males
69
belg
ian
canc
er r
egis
try
canc
er in
cide
nce
in b
elgi
um 20
04–2
005

3.7 Bladder cancer (icd-10 c67)
Table 20 Bladder cancer: Incidence by sex and region, 2004-2005
Males CR ESR WSR CRi
Belgium 32.0 25.7 16.4 1.8
Brussels Capital Region 29.7 26.5 16.6 1.8
Flemish Region 32.5 25.0 15.9 1.7
Walloon Region 31.8 26.8 17.4 2.0
Females CR ESR WSR CRi
Belgium 7.8 4.6 3.0 0.3
Brussels Capital Region 7.7 5.1 3.3 0.4
Flemish Region 8.4 4.9 3.2 0.4
Walloon Region 6.8 4.1 2.7 0.3
CR: crude (all ages) incidence rate (n/100,000 person years)ESR and WSR: age-standardised incidence rate, using the European or World Standard Population (n/100,000 person years)CRi: Cumulative Risk 0-74 years (%)
a Belgium 2005: 1,611 new diagnoses of invasive bladder cancer in males and 441 in females.a Sex ratio (M/F) is 5.5.a Belgium 2004: 600 males and 199 females died from bladder cancer.a The risk of being diagnosed with bladder cancer before 75 years is 1.8 % in males and 0.3%
in females.
Figure 53 Bladder cancer: Age-specifi c incidence by sex, Belgium 2004-2005
a Bladder cancer mainly affects older people and is very rare before the age of 50 years.a Mean age at diagnosis is 72 years.a It is well-known that international differences in registration and coding practices vary
considerably and can lead to bias when age-standardised incidence rates are compared. For this reason no overview is given of European data.
70
belg
ian
canc
er r
egis
try

3.8 Malignant melanoma of the skin (icd-10 c43)
Table 21 Malignant melanoma: Incidence by sex and region, 2004-2005
Males CR ESR WSR CRi
Belgium 12.2 10.7 8.1 0.8
Brussels Capital Region 12.4 11.7 8.4 0.9
Flemish Region 12.2 10.5 8.1 0.8
Walloon Region 12.0 10.8 8.2 0.9
Females CR ESR WSR CRi
Belgium 17.0 14.7 11.9 1.2
Brussels Capital Region 16.4 14.5 11.1 1.2
Flemish Region 17.1 14.5 11.7 1.1
Walloon Region 17.1 15.3 12.5 1.2
CR: crude (all ages) incidence rate (n/100,000 person years)ESR and WSR: age-standardised incidence rate, using the European or World Standard Population (n/100,000 person years)CRi: Cumulative Risk 0-74 years (%)
a Malignant melanoma is the most aggressive form of skin cancer, but it is one of the tu-mours suitable for primary preventive measures.
a Malignant melanoma is more common in females than in males (M/F ratio = 0.66).a Belgium 2005: In females, malignant melanoma was the fi fth most frequent occurring tu-
mour (3.7%).a Belgium 2004: 130 males and 145 females died from malignant melanoma.a Age-standardised incidence rates in the three Belgian regions are comparable.
Figure 54 Malignant melanoma: Age-specifi c incidence by sex, Belgium 2004-2005
a In the age group 15-29 years, malignant melanoma was the most important malignancy in females.
a The mean age at diagnosis was 59 years in males and 55 years in females.
71
belg
ian
canc
er r
egis
try
canc
er in
cide
nce
in b
elgi
um 20
04–2
005

Figure 55a Malignant melanoma: Age-standardised incidence (WSR) by sex, Flemish Region 1999-2005
Figure 55b Malignant melanoma: Age-standardised incidence (WSR) by sex and age group, Flemish Region 1999-2005
a In the Flemish Region an increase in incidence of malignant melanoma in both sexes was observed between 1999 and 2005.
a Up to the age of 65 years malignant melanoma is more common in females. In the age group of 15-44 years, the incidence in females is almost twice the incidence in males. This difference disappears with increasing age.
a In the Flemish Region and the Brussels Capital Region malignant melanoma has become the most important malignancy in males in the age group of 30-44 years (Table 8).
72
belg
ian
canc
er r
egis
try

Table 22 Malignant melanoma of the skin: Primary tumour localisation by age and sex, Belgium 2004-2005
All ages 00-29 30-44 45-59 60-74 75+
Localisation M F M F M F M F M F M F(N = 1,241)
%(N = 1,812)
%(N = 69)
%(N = 164)
%(N = 230)
%(N = 433)
%(N = 320)
%(N = 478)
%(N = 383)
%(N = 424)
%(N = 239)
%(N = 313)
%
Head and neck 17.4 9.8 7.2 4.3 10.0 4.2 8.4 5.9 19.3 14.4 36.4 20.4
Lip 0.2 0.1 0.0 0.0 0.0 0.0 0.0 0.0 0.3 0.0 0.8 0.6
Eyelid 0.8 0.8 1.4 0.6 0.0 0.2 0.3 0.0 0.8 0.9 2.1 2.6
External ear 3.1 0.6 0.0 0.0 0.9 0.9 1.3 0.4 5.5 0.9 5.0 0.0
Face, unspecifi ed 8.2 6.3 0.0 1.2 3.9 1.6 2.5 3.6 8.4 9.9 22.2 15.0
Scalp and neck 5.0 2.0 5.8 2.4 5.2 1.4 4.4 1.9 4.4 2.6 6.3 2.2
Trunk 27.0 16.8 21.7 17.7 31.3 22.9 29.4 21.8 32.1 11.8 13.0 7.3
Upper limb and shoulder 13.8 14.2 8.7 14.6 16.5 11.3 16.6 14.9 12.0 15.3 11.7 15.7
Lower limb and hip 13.3 33.5 29.0 29.9 13.5 36.7 16.9 35.4 9.9 32.1 9.2 30.0
Skin, NOS 28.5 25.6 33.3 33.5 28.7 24.9 28.8 22.2 26.6 26.4 29.7 26.5
a Primary tumour localisation of malignant melanoma skin cancer differs by sex. In males the most common primary site is the skin of the trunk and the skin of head and neck, while in females the majority of the malignant melanomas are diagnosed on the lower extremi-ties. These differences become more apparent with increasing age at diagnosis. In the age group of 0-29 years there are only little differences in primary skin site.
Figure 56 Malignant melanoma: Stage by sex, Belgium 2004-2005
a Malignant melanoma in males tends to be diagnosed in a more advanced stage than in females. Rates of melanoma in situ were the same in males and females (~20%).
73
belg
ian
canc
er r
egis
try
canc
er in
cide
nce
in b
elgi
um 20
04–2
005

Figure 57 Malignant melanoma: Age-standardised incidence rates (WSR) by sex
Males
Females
a Comparison with European countries revealed a low incidence of malignant melanoma in males. The incidence rate for females was positioned approximately in the middle of the selected European data.
74
belg
ian
canc
er r
egis
try
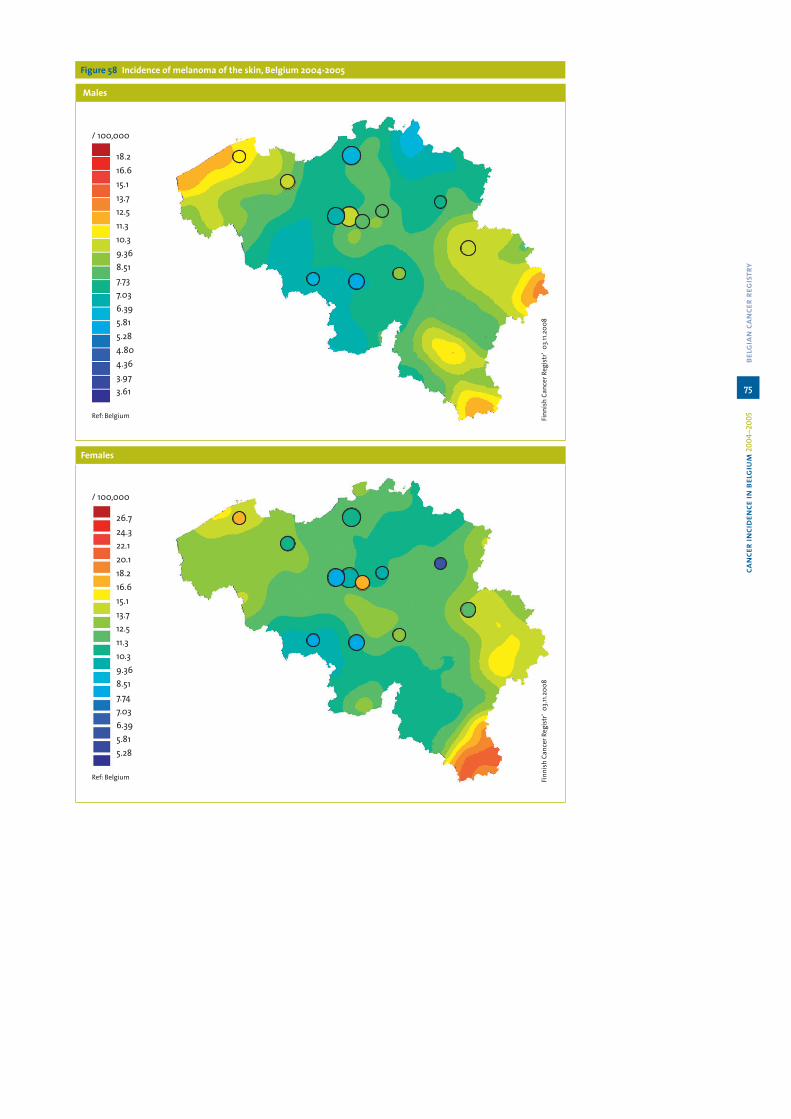
Figure 58 Incidence of melanoma of the skin, Belgium 2004-2005
Males
Females
75
belg
ian
canc
er r
egis
try
canc
er in
cide
nce
in b
elgi
um 20
04–2
005

3.9 Haematological cancers
Classifi cation and reportingOver the past 60 years, many different classifi cations have been used to classify lymphomas (Rappaport(42), Kiel, Lukes(43), NCI Working group(44)) and leukaemias (French-American-British FAB(45)). Developments in immunophenotypic and molecular biological techniques have brought new insight in this fi eld and have changed dramatically the classifi cation of leukaemias and lymphomas. In 1994, the International Lymphoma Study Group defi ned a new classifi cation for lymphoid neoplasms: the REAL classifi cation.(46) This approach uses all available morphologic, immu-nophenotypic and genetic information to defi ne a disease entity. The third WHO classifi cation of haematological malignancies (2001) extends the principles of classifi cation to myeloid diseases.(47)
The main changes in those new classifi cations are:! The neoplasms are stratifi ed according to the lineage of the cells: myeloid, lymphoid, his-
tiocytic, mast cell.! Within each category, distinct diseases are defi ned according to a combination of mor-
phologic, immunophenotypic and genetic features.! The distinction between lymphomas and lymphoid leukaemia is largely artifi cial and
refl ects in fact a pattern of spread in the individual patient rather than a basic cellular difference.
! The regrouping of lymphoma into ‘grades’(44) was potentially misleading as the defi ni-tion of grade differed considerably from one classifi cation to another.
! Behaviour: some chronic myeloproliferative diseases (polycythaemia vera, essential thrombocythaemia and chronic myelofi brosis) and the myelodysplastic syndromes were previously considered as borderline malignant. They are considered malignant since the introduction of the ICD-O-3.(40) This change leads to a slight increase of the incidence rate of haematological malignancies.
The ICD-O-3(40)classifi cation incorporates terms from the WHO classifi cation as preferred terms for haematological malignancies, but terms for older classifi cations are retained to per-mit universal coding and analysis of historical data.
A 4th edition of the WHO classifi cation has been published very recently in 2008.(48) This edi-tion incorporates new information that has emerged from clinical investigations in the inter-val since publication of the 3rd edition. It includes new defi ning criteria for some diseases, as well as new entities.
Grouping malignancies in categories for cancer incidence reporting purposes is classically done with the ICD-10 classifi cation.(49) Haematological neoplasms are reported in broad class-es with the codes C>=81 in the appendices of this book.On the other hand, in this chapter ‘haematological cancers’, the WHO classifi cation for tu-mours of haematopoietic and lymphoid tissues(47) is used.
76
belg
ian
canc
er r
egis
try

Haematological malignancies, descriptionWith a total number of almost 4,800 new cases per year, haematological malignancies repre-sent 8.5% of all cancers in Belgium. They are slightly more frequent in males, with a sex ratio (M/F) calculated on standardised incidence rates being 1.4 in 2005.
The haematological malignancies differ considerably in epidemiology, prognosis and treat-ment. The most important entities are described in this chapter.
77
belg
ian
canc
er r
egis
try
canc
er in
cide
nce
in b
elgi
um 20
04–2
005

Table 23a Haematological neoplasms in males. Belgium 2004-2005
Absolute numbers 2004 Absolute numbers 2005 Incidence rates 2004-2005
Tot 0-14 15-29 30-59 60+ Tot 0-14 15-29 30-59 60+ CR ESR WSR CRi
Chronic Myeloproliferative Disease 213 1 9 69 134 188 1 6 69 112 3.9 3.3 2.4 0.3
Chronic Myeloid Leukaemia 1 84 0 6 33 45 68 1 4 30 33 1.5 1.3 1.0 0.1
Others 2 129 1 3 36 89 120 0 2 39 79 2.4 2.0 1.4 0.2
MDS-MPD 3 42 0 1 6 35 45 0 0 10 35 0.9 0.7 0.5 0.1
Myelodysplastic Syndromes 4 231 1 1 24 205 200 2 1 23 174 4.2 3.3 2.1 0.2
Acute Myeloid Leukaemia 185 5 6 47 127 219 10 11 62 136 4.0 3.5 2.7 0.3
Precursor Cell Neoplasms 5 83 40 15 12 16 74 35 11 10 18 1.5 1.7 2.1 0.1
Mature B-Cell Neoplasms 1,523 11 22 471 1,019 1,496 11 28 404 1,053 29.6 24.9 17.4 2.0
Leukaemic/disseminated 6 424 1 2 118 303 410 0 1 108 301 8.2 6.8 4.6 0.5
Plasma cell 7 338 0 2 81 255 338 0 0 75 263 6.6 5.4 3.6 0.4
Extranodal 8 79 2 0 20 57 69 0 4 19 46 1.5 1.2 0.9 0.1
Nodal, indolent 9 240 0 1 98 141 231 0 2 83 146 4.6 4.0 2.8 0.3
Nodal, aggressive 10 322 8 14 107 193 320 9 18 85 208 6.3 5.4 4.0 0.4
Other or not further specifi ed 120 0 3 47 70 128 2 3 34 89 2.4 2.1 1.5 0.2
Mature T-Cell And NK-Cell Neoplasms 111 3 4 32 72 125 2 4 46 73 2.3 2.0 1.5 0.2
Leukaemic/disseminated 11 4 0 0 0 4 7 0 0 4 3 0.1 0.1 0.1 0.0
Cutaneous 12 59 1 1 18 39 59 1 2 18 38 1.2 1.0 0.7 0.1
Extra-nodal 13 4 0 1 2 1 3 0 0 1 2 0.1 0.1 0.1 0.0
Nodal 14 44 2 2 12 28 56 1 2 23 30 1.0 0.9 0.6 0.1
Hodgkin Lymphoma 161 8 38 80 35 171 18 50 68 35 3.3 3.2 3.0 0.2
Histiocytic And Dendritic-Cell Neoplasms 7 2 0 2 3 0 0 0 0 0 0.1 0.1 0.1 0.0
Mast Cell Diseases 3 2 0 1 0 2 2 0 0 0 0.0 0.1 0.1 0.0
Lymphomas/Lymphoid leukaemias, other or not further specifi ed 54 1 5 14 34 46 0 2 10 34 1.0 0.8 0.6 0.1
Myeloid leukaemia not further specifi ed 7 0 1 0 6 5 0 1 0 4 0.1 0.1 0.1 0.0
Leukaemias, other or not further specifi ed 8 0 0 2 6 11 0 0 5 6 0.2 0.2 0.1 0.0
TOTAL 2,628 74 102 760 1,692 2,582 81 114 707 1,680 51.1 43.8 32.6 3.4
CR: crude (all ages) incidence rate (n/100,000 person years); ESR and WSR: age-standardised incidence rate, using the European or World Standard Population (n/100,000 person years); CRi: Cumulative Risk 0-74 years (%)
1 Chronic Myelogenous Leukaemia. Bcr/Abl; Chronic Neutrophilic Leukaemia; Chronic Eosinophilic Leukaemia; myeloid leukaemia, NOS2 Polycytaemia Vera. Chronic Idiopathic Myelofi brosis; Essential Thrombocythaemia; Hypereosinophilic Syndrome; Chronic myeloproliferative disease, NOS3 Atypical Chronic Myeloid Leukaemia; Chronic Myelomonocytic Leukaemia; Juvenile Myelomonocytic Leukaemia 4 Refractory Anaemia; Myelodysplastic Syndrome Associated With Isolated Del(5Q) Abnormality; Myelodysplastic Syndrome. Unclassifi able (Nos); Therapy-related myelodysplastic syndrome, NOS5 Precursor B-Cell Lymphoblastic Leukaemia/ Lymphoma; Precursor T Lymphoblastic Leukaemia/Lymphoma; Precursor NK or NOS cell lymphoblastic leukaemia6 Chronic Lymphocytic leukaemia/Small lymphocytic Lymph.; Lymphoplasmacytic Lymph.; Splenic Marginal Zone Lymphoma; Heavy Chain Disease.Nos; Waldenstrom macroglobulinaemia; Immunoproliferative small intestinal disease;
B-Cell Prolymphocytic Leukaemia; Hairy Cell Leukaemia; Immunoprol. disease, NOS; Lymphoid Leukaemia, NOS7 Plasma Cell Myeloma; Solitary Plasmacytoma Of Bone; Plasma cell leukaemia; Extraosseous Plasmacytoma8 MALT lymphoma9 Mantle Cell Lymphoma; Follicular Lymphoma10 Diffuse Large B-Cell Lymphom; Mediastinal (Thymic) Large B-Cell Lymphoma; Primary Effusion Lymphoma; Malignant lymphoma. large B-cell. diffuse. immunoblastic, NOS; Burkitt Lymphoma11 Adult T-Cell Leukaemia / Lymphoma; T-Cell Large Granular Lymphocytic Leukaemia; T-Cell Prolymphocytic Leukaemia; Aggressive NK Cell Leukaemia12 Mycosis Fungoides; Sezary Syndrome; Primary Cutaneous Anaplastic Large Cell Lymphoma; Cutaneous T-cell lymphoma, NOS13 Subcutaneous Panniculitis-Like T-Cell Lymphoma; Hepatosplenic T-Cell Lymphoma; Enteropathy-Type T-Cell Lymphoma; Extranodal NK / T Cell Lymphoma. Nasal Type14 T-Cell Lymphoma. NOS; Angioimmunoblastic T-Cell Lymphoma; Anaplastic Large Cell Lymphoma
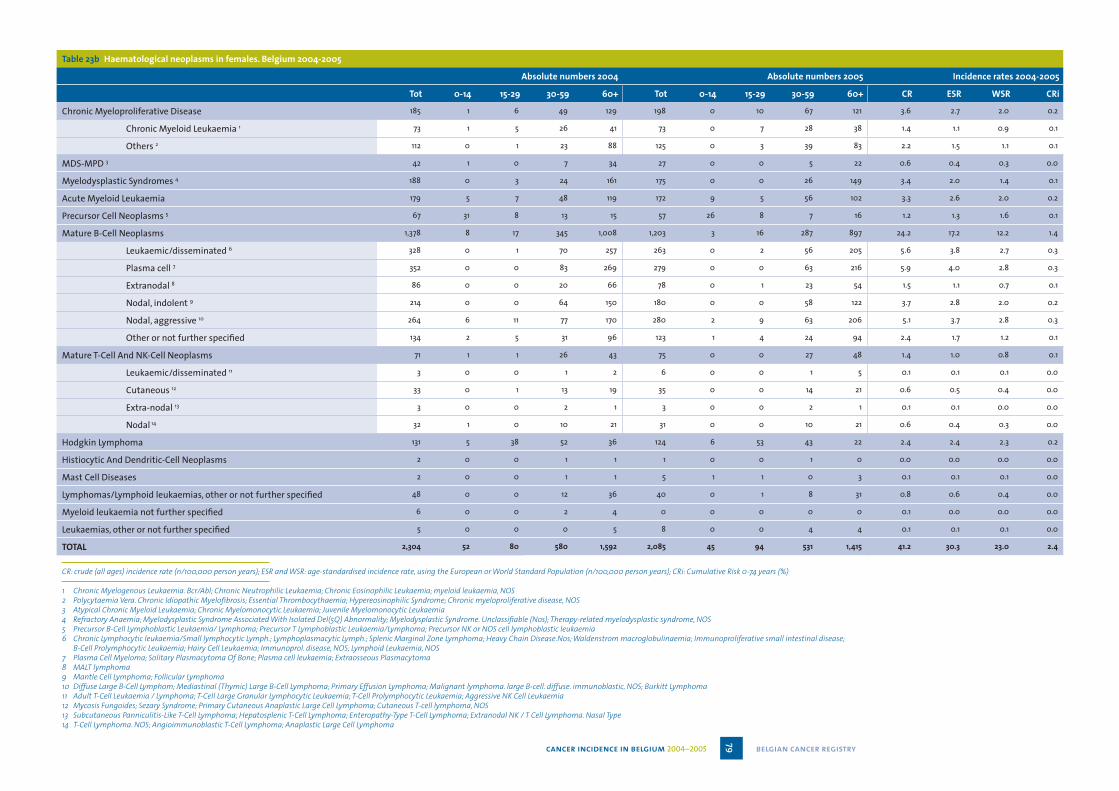
Table 23b Haematological neoplasms in females. Belgium 2004-2005
Absolute numbers 2004 Absolute numbers 2005 Incidence rates 2004-2005
Tot 0-14 15-29 30-59 60+ Tot 0-14 15-29 30-59 60+ CR ESR WSR CRi
Chronic Myeloproliferative Disease 185 1 6 49 129 198 0 10 67 121 3.6 2.7 2.0 0.2
Chronic Myeloid Leukaemia 1 73 1 5 26 41 73 0 7 28 38 1.4 1.1 0.9 0.1
Others 2 112 0 1 23 88 125 0 3 39 83 2.2 1.5 1.1 0.1
MDS-MPD 3 42 1 0 7 34 27 0 0 5 22 0.6 0.4 0.3 0.0
Myelodysplastic Syndromes 4 188 0 3 24 161 175 0 0 26 149 3.4 2.0 1.4 0.1
Acute Myeloid Leukaemia 179 5 7 48 119 172 9 5 56 102 3.3 2.6 2.0 0.2
Precursor Cell Neoplasms 5 67 31 8 13 15 57 26 8 7 16 1.2 1.3 1.6 0.1
Mature B-Cell Neoplasms 1,378 8 17 345 1,008 1,203 3 16 287 897 24.2 17.2 12.2 1.4
Leukaemic/disseminated 6 328 0 1 70 257 263 0 2 56 205 5.6 3.8 2.7 0.3
Plasma cell 7 352 0 0 83 269 279 0 0 63 216 5.9 4.0 2.8 0.3
Extranodal 8 86 0 0 20 66 78 0 1 23 54 1.5 1.1 0.7 0.1
Nodal, indolent 9 214 0 0 64 150 180 0 0 58 122 3.7 2.8 2.0 0.2
Nodal, aggressive 10 264 6 11 77 170 280 2 9 63 206 5.1 3.7 2.8 0.3
Other or not further specifi ed 134 2 5 31 96 123 1 4 24 94 2.4 1.7 1.2 0.1
Mature T-Cell And NK-Cell Neoplasms 71 1 1 26 43 75 0 0 27 48 1.4 1.0 0.8 0.1
Leukaemic/disseminated 11 3 0 0 1 2 6 0 0 1 5 0.1 0.1 0.1 0.0
Cutaneous 12 33 0 1 13 19 35 0 0 14 21 0.6 0.5 0.4 0.0
Extra-nodal 13 3 0 0 2 1 3 0 0 2 1 0.1 0.1 0.0 0.0
Nodal 14 32 1 0 10 21 31 0 0 10 21 0.6 0.4 0.3 0.0
Hodgkin Lymphoma 131 5 38 52 36 124 6 53 43 22 2.4 2.4 2.3 0.2
Histiocytic And Dendritic-Cell Neoplasms 2 0 0 1 1 1 0 0 1 0 0.0 0.0 0.0 0.0
Mast Cell Diseases 2 0 0 1 1 5 1 1 0 3 0.1 0.1 0.1 0.0
Lymphomas/Lymphoid leukaemias, other or not further specifi ed 48 0 0 12 36 40 0 1 8 31 0.8 0.6 0.4 0.0
Myeloid leukaemia not further specifi ed 6 0 0 2 4 0 0 0 0 0 0.1 0.0 0.0 0.0
Leukaemias, other or not further specifi ed 5 0 0 0 5 8 0 0 4 4 0.1 0.1 0.1 0.0
TOTAL 2,304 52 80 580 1,592 2,085 45 94 531 1,415 41.2 30.3 23.0 2.4
CR: crude (all ages) incidence rate (n/100,000 person years); ESR and WSR: age-standardised incidence rate, using the European or World Standard Population (n/100,000 person years); CRi: Cumulative Risk 0-74 years (%)
1 Chronic Myelogenous Leukaemia. Bcr/Abl; Chronic Neutrophilic Leukaemia; Chronic Eosinophilic Leukaemia; myeloid leukaemia, NOS2 Polycytaemia Vera. Chronic Idiopathic Myelofi brosis; Essential Thrombocythaemia; Hypereosinophilic Syndrome; Chronic myeloproliferative disease, NOS3 Atypical Chronic Myeloid Leukaemia; Chronic Myelomonocytic Leukaemia; Juvenile Myelomonocytic Leukaemia 4 Refractory Anaemia; Myelodysplastic Syndrome Associated With Isolated Del(5Q) Abnormality; Myelodysplastic Syndrome. Unclassifi able (Nos); Therapy-related myelodysplastic syndrome, NOS5 Precursor B-Cell Lymphoblastic Leukaemia/ Lymphoma; Precursor T Lymphoblastic Leukaemia/Lymphoma; Precursor NK or NOS cell lymphoblastic leukaemia6 Chronic Lymphocytic leukaemia/Small lymphocytic Lymph.; Lymphoplasmacytic Lymph.; Splenic Marginal Zone Lymphoma; Heavy Chain Disease.Nos; Waldenstrom macroglobulinaemia; Immunoproliferative small intestinal disease;
B-Cell Prolymphocytic Leukaemia; Hairy Cell Leukaemia; Immunoprol. disease, NOS; Lymphoid Leukaemia, NOS7 Plasma Cell Myeloma; Solitary Plasmacytoma Of Bone; Plasma cell leukaemia; Extraosseous Plasmacytoma8 MALT lymphoma9 Mantle Cell Lymphoma; Follicular Lymphoma10 Diffuse Large B-Cell Lymphom; Mediastinal (Thymic) Large B-Cell Lymphoma; Primary Effusion Lymphoma; Malignant lymphoma. large B-cell. diffuse. immunoblastic, NOS; Burkitt Lymphoma11 Adult T-Cell Leukaemia / Lymphoma; T-Cell Large Granular Lymphocytic Leukaemia; T-Cell Prolymphocytic Leukaemia; Aggressive NK Cell Leukaemia12 Mycosis Fungoides; Sezary Syndrome; Primary Cutaneous Anaplastic Large Cell Lymphoma; Cutaneous T-cell lymphoma, NOS13 Subcutaneous Panniculitis-Like T-Cell Lymphoma; Hepatosplenic T-Cell Lymphoma; Enteropathy-Type T-Cell Lymphoma; Extranodal NK / T Cell Lymphoma. Nasal Type14 T-Cell Lymphoma. NOS; Angioimmunoblastic T-Cell Lymphoma; Anaplastic Large Cell Lymphoma
79 belgian cancer registrycancer incidence in belgium 2004–2005

Myeloid neoplasms
The chronic myeloproliferative diseases (cmpd)The CMPDs are characterised by clonal proliferation in the bone marrow of one of the myeloid cell lineages, resulting in increased numbers of granulocytes, red blood cells or platelets in the peripheral blood.It is a disease chiefl y present in adults, with the highest incidence rates reached at the age of 60-70 years. Mean age is 63 years.Some disorders of this group (polycythaemia vera, essential thombocytaemia, chronic myelofi brosis) were previously classifi ed as borderline malignancies(39) and therefore not reported as cancer. Since 2001, they are considered malignant in the WHO classifi cation. In the Belgian Cancer Registry, they are reported as such since 2004. This change in classifi cation was responsible for about 220 additional new cases yearly for CMPD, corresponding to an increase of 0.4% in the overall incidence of cancer in Belgium.
Figure 59 Myeloproliferative diseases: Age-specifi c incidence by sex, Belgium 2004-2005
The myelodysplastic syndromes (mds)Myelodysplastic syndromes are a heterogeneous group of disorders, which present some evidence of bone marrow failure and dysplasia in at least one myeloid cell lin-eage. MDS can occur de novo or as a result of exposure to alkylating agent therapy or radiotherapy. It may evolve to acute leukaemia. Those affections were previously considered as borderline malignant affections(39) and are now regarded as cancers. This entity is responsible for a rise of the total number of cancers of 300 cases per year, or an increase of 0.6% of the global inci-dence rate (only due to change in classifi cation).
Myelodysplastic syndromes generally affect older people, with very few cases be-fore the age of 55 years and a gradual increase in incidence after that age. Mean age at the moment of diagnosis is 70 years.
80
belg
ian
canc
er r
egis
try

Figure 60 Myelodysplastic syndromes: Age-specifi c incidence by sex, Belgium 2004-2005
Acute myeloid leukaemia (aml)Acute myeloid leukaemia is a clonal expansion of myeloid blasts in bone marrow and blood. Associated etiological factors include ionizing radiation, chemotherapy and benzenes. With 391 cases in 2005 for both sexes, AML represents in Belgium 75% of all acute leukaemias (the other 25% being precursor lymphoid cell leukaemia). The vast majority of acute myeloid leukaemias occurs in adults (mean age: 60 years), but can infrequently present in children (less than 5%). In contrast with the adult pattern, AML represents 20% of the acute leukaemias in children.
Figure 61 Acute Myeloid Leukaemia: Age-specifi c incidence by sex, Belgium 2004-2005
Lymphoid neoplasmsAs discussed before, the distinction between lymphoid leukaemias and lymphomas is now considered as artifi cial as it refl ects more the pattern of spread of the disease than real dif-ferent entities. The WHO classifi cation recognises 3 major categories of lymphoid neoplams: the B-cell neoplasms, the T or NK-cell neoplasms and Hodgkin’s disease. Within the B- and T-cell categories, 2 major distinctions are made: the precursor cell neoplasms (or lymphoblastic leukaemia/lymphoma) and the mature cell neoplasms (plasma cell neoplasms are part of the latter). Lymphoid neoplasms account for 3,411 new cases in Belgium in 2005. The following table shows for each detailed lymphoid neoplasm the absolute number oc-curred in 2005, the standardised incidence rates (ESR and WSR) and the percentage of the total number of lymphoid neoplasms. Morton et al.(50) have recently published data on the incidence of lymphoid neoplasm sub-types. The study was based on 17 registries from the SEER. Their results are comparable with the Belgian distribution of Hodgkin lymphoma, T-cell lymphoma, plasma cell neoplasms and CLL. Other entities show small variation, for instance the precursor cell neoplasms are repre-sented slightly lower in our series.
81
belg
ian
canc
er r
egis
try
canc
er in
cide
nce
in b
elgi
um 20
04–2
005
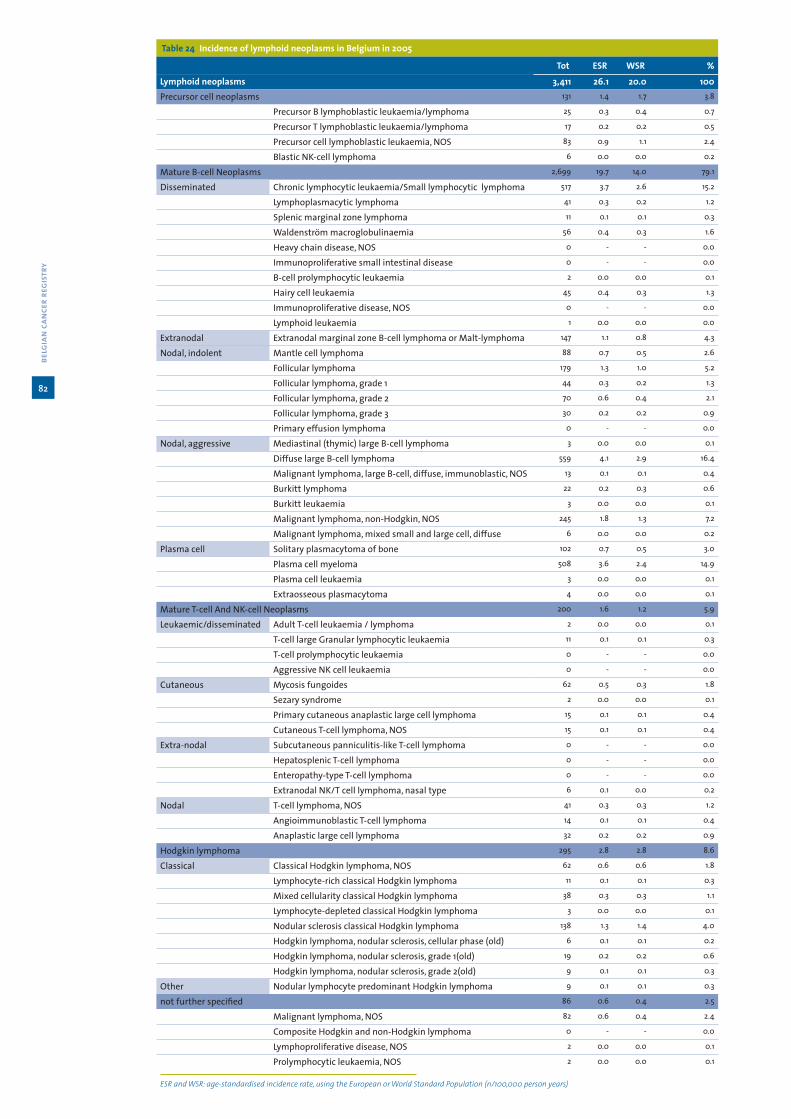
Table 24 Incidence of lymphoid neoplasms in Belgium in 2005
Tot ESR WSR %
Lymphoid neoplasms 3,411 26.1 20.0 100Precursor cell neoplasms 131 1.4 1.7 3.8
Precursor B lymphoblastic leukaemia/lymphoma 25 0.3 0.4 0.7
Precursor T lymphoblastic leukaemia/lymphoma 17 0.2 0.2 0.5
Precursor cell lymphoblastic leukaemia, NOS 83 0.9 1.1 2.4
Blastic NK-cell lymphoma 6 0.0 0.0 0.2
Mature B-cell Neoplasms 2,699 19.7 14.0 79.1
Disseminated Chronic lymphocytic leukaemia/Small lymphocytic lymphoma 517 3.7 2.6 15.2
Lymphoplasmacytic lymphoma 41 0.3 0.2 1.2
Splenic marginal zone lymphoma 11 0.1 0.1 0.3
Waldenström macroglobulinaemia 56 0.4 0.3 1.6
Heavy chain disease, NOS 0 - - 0.0
Immunoproliferative small intestinal disease 0 - - 0.0
B-cell prolymphocytic leukaemia 2 0.0 0.0 0.1
Hairy cell leukaemia 45 0.4 0.3 1.3
Immunoproliferative disease, NOS 0 - - 0.0
Lymphoid leukaemia 1 0.0 0.0 0.0
Extranodal Extranodal marginal zone B-cell lymphoma or Malt-lymphoma 147 1.1 0.8 4.3
Nodal, indolent Mantle cell lymphoma 88 0.7 0.5 2.6
Follicular lymphoma 179 1.3 1.0 5.2
Follicular lymphoma, grade 1 44 0.3 0.2 1.3
Follicular lymphoma, grade 2 70 0.6 0.4 2.1
Follicular lymphoma, grade 3 30 0.2 0.2 0.9
Primary effusion lymphoma 0 - - 0.0
Nodal, aggressive Mediastinal (thymic) large B-cell lymphoma 3 0.0 0.0 0.1
Diffuse large B-cell lymphoma 559 4.1 2.9 16.4
Malignant lymphoma, large B-cell, diffuse, immunoblastic, NOS 13 0.1 0.1 0.4
Burkitt lymphoma 22 0.2 0.3 0.6
Burkitt leukaemia 3 0.0 0.0 0.1
Malignant lymphoma, non-Hodgkin, NOS 245 1.8 1.3 7.2
Malignant lymphoma, mixed small and large cell, diffuse 6 0.0 0.0 0.2
Plasma cell Solitary plasmacytoma of bone 102 0.7 0.5 3.0
Plasma cell myeloma 508 3.6 2.4 14.9
Plasma cell leukaemia 3 0.0 0.0 0.1
Extraosseous plasmacytoma 4 0.0 0.0 0.1
Mature T-cell And NK-cell Neoplasms 200 1.6 1.2 5.9
Leukaemic/disseminated Adult T-cell leukaemia / lymphoma 2 0.0 0.0 0.1
T-cell large Granular lymphocytic leukaemia 11 0.1 0.1 0.3
T-cell prolymphocytic leukaemia 0 - - 0.0
Aggressive NK cell leukaemia 0 - - 0.0
Cutaneous Mycosis fungoides 62 0.5 0.3 1.8
Sezary syndrome 2 0.0 0.0 0.1
Primary cutaneous anaplastic large cell lymphoma 15 0.1 0.1 0.4
Cutaneous T-cell lymphoma, NOS 15 0.1 0.1 0.4
Extra-nodal Subcutaneous panniculitis-like T-cell lymphoma 0 - - 0.0
Hepatosplenic T-cell lymphoma 0 - - 0.0
Enteropathy-type T-cell lymphoma 0 - - 0.0
Extranodal NK/T cell lymphoma, nasal type 6 0.1 0.0 0.2
Nodal T-cell lymphoma, NOS 41 0.3 0.3 1.2
Angioimmunoblastic T-cell lymphoma 14 0.1 0.1 0.4
Anaplastic large cell lymphoma 32 0.2 0.2 0.9
Hodgkin lymphoma 295 2.8 2.8 8.6
Classical Classical Hodgkin lymphoma, NOS 62 0.6 0.6 1.8
Lymphocyte-rich classical Hodgkin lymphoma 11 0.1 0.1 0.3
Mixed cellularity classical Hodgkin lymphoma 38 0.3 0.3 1.1
Lymphocyte-depleted classical Hodgkin lymphoma 3 0.0 0.0 0.1
Nodular sclerosis classical Hodgkin lymphoma 138 1.3 1.4 4.0
Hodgkin lymphoma, nodular sclerosis, cellular phase (old) 6 0.1 0.1 0.2
Hodgkin lymphoma, nodular sclerosis, grade 1(old) 19 0.2 0.2 0.6
Hodgkin lymphoma, nodular sclerosis, grade 2(old) 9 0.1 0.1 0.3
Other Nodular lymphocyte predominant Hodgkin lymphoma 9 0.1 0.1 0.3
not further specifi ed 86 0.6 0.4 2.5
Malignant lymphoma, NOS 82 0.6 0.4 2.4
Composite Hodgkin and non-Hodgkin lymphoma 0 - - 0.0
Lymphoproliferative disease, NOS 2 0.0 0.0 0.1
Prolymphocytic leukaemia, NOS 2 0.0 0.0 0.1
ESR and WSR: age-standardised incidence rate, using the European or World Standard Population (n/100,000 person years)
82
belg
ian
canc
er r
egis
try

Distribution of non-Hodgkin-lymphomas (nhl)Standardisation of grouping is essential for epidemiologic purposes, to allow comparisons between countries and to follow up on time trends. The succession of several classifi cations for non-Hodgkin lymphoma has made this standardisation diffi cult to achieve.The grouping of NHL proposed by the WHO(47) - consistent with the concept of no distinc-tion between lymphoid leukaemia and lymphoma - pools together several lymphoma types, the lymphoblastic leukaemia, chronic myeloid leukaemia/small lymphocytic lymphoma and other entities previously not comprised in the NHL group. While some authors even go fur-ther in considering plasma cell neoplasm as non-Hodgkin lymphomas(50), other are reluctant to such important grouping.In the following graph showing the distribution of non-Hodgkin lymphomas in Belgium, the method proposed by the WHO(47) is used: all precursor and mature B-and T-cell neoplasms with the exception of plasma cell tumours are included.In Belgium, according to this defi nition, approximately 2,400 new diagnoses of non-Hodgkin lymphoma are made per year (both sexes together). This is 500 cases more than the number of NHL reported with the ICD-10 classifi cation in appendix 4. The higher number can be ex-plained by the inclusion of the lymphoid leukaemias.
Figure 62 Distribution of non-Hodgkin lymphoma/lymphoid leukaemia, Belgium 2004-2005
83
belg
ian
canc
er r
egis
try
canc
er in
cide
nce
in b
elgi
um 20
04–2
005

Precursor cell lymphoid neoplasms (b- or t-cell)Precursor cell lymphoid neoplasms are the typical haematological neoplasms of children and they are also the most frequent malignancy in children (see chapter of Childhood Cancer).Precursor lymphoblastic leukaemia (ALL)/lymphoblastic lymphoma (LBL) are neoplasms of lymphoblasts involving bone marrow and blood (acute lymphoblastic leukaemia). They oc-casionally present with primary involvement of nodal or extranodal sites (lymphoblastic lymphoma). Precursor cell lymphoid neoplasms represent 5.7% of non-Hodgkin lymphomas. They are re-sponsible for about 130 to 150 cases per year in Belgium; half of them (45-50%) arise in children.
Figure 63 Precursor lymphoblastic leukaemia/lymphoma: Age-specifi c incidence by sex, Belgium 2004-2005
Mature B-cell neoplasmsMature B-cell neoplasms are usually grouped following their pattern of spread:
! Leukaemic/disseminated ! Nodal; they are further classifi ed into relatively indolent or aggressive entities. ! Extranodal (MALT)
We preferred to present the plasma cell neoplasms in a separate category.
a Leukaemic/ disseminated (relatively indolent)This subcategory includes chronic lymphoid leukaemia/small lymphocytic lym-phoma, B-cell prolymphocytic leukaemia, lymphoplasmacytic lymphoma /Walden-ström macroglobulinemia, hairy cell leukaemia and splenic marginal lymphoma.The most frequent disease is the chronic lymphoid leukaemia, predominantly af-fecting older people (mean age: 68 years), with a sex ratio (M/F) of 1.8.
Figure 64 Chronic lymphocytic leukaemia/small lymphocytic lymphoma: Age-specifi c incidence by sex, Belgium 2004-2005
84
belg
ian
canc
er r
egis
try

a Predominantly nodal lymphomas
Indolent lymphomasSmall cell nodal lymphomas are generally considered as ‘indolent’ because their evolution is slow (mostly for follicular lymphoma). They respond to treatment but tend to relapse and are still considered incurable. This category chiefl y includes fol-licular lymphoma and mantle cell lymphomas; with a total of 400 to 450 new cases per year, they represent 17.5 % of the non-Hodgkin lymphomas in Belgium.Follicular lymphoma is the predominant type in this category, with 320 new cases per year. It predominantly affects adults, with a mean age of 63 years. The incidence gradually increases from the age of 35 years on. Mantle cell lymphoma is somewhat more aggressive.
Figure 65 Follicular lymphoma : Age-specifi c incidence by sex, Belgium 2004-2005
Aggressive lymphomasThis category represents 24% of all non-Hodgkin lymphomas in Belgium. The main types are the diffuse large B-cell lymphomas and the Burkitt lymphomas.
Diffuse large B-cell lymphoma is the most common NHL. In the period 2004-2005 a total of 1,132 new diagnoses were made; they represent 20% of all NHL in Belgium. Mean age at diagnosis is 65 years. Diffuse large B-cell lymphoma can also be found in adolescents and young adults.
Figure 66 Diffuse large B-cell lymphoma: Age-specifi c incidence by sex, Belgium 2004-2005
Burkitt lymphomas are highly aggressive lymphomas; they are rare in our regions (much more frequent in Africa). They are predominantly a disease of children and adolescents and are 3 times more frequent in boys than in girls.
85
belg
ian
canc
er r
egis
try
canc
er in
cide
nce
in b
elgi
um 20
04–2
005

a Extranodal lymphomaMALT is the only entity in its category. Because of its specifi c natural history and treatment, it is preferable to report separately on this disease. In Belgium, Malt lym-phoma represents 6.3% of the non-Hodgkin lymphomas.
a Plasma cell neoplasmsPlasma cells are very mature B-cells. We preferred to present the plasma cell neoplasms in a separate category mainly to preserve comparability with older classifi cations.The most frequent occurring disease of this group is multiple myeloma. With re-spectively 690 and 617 new cases in 2004 and 2005, it represents a quite frequent haematological affection. It is a disease of older patients with a mean age of 69 years. Incidence starts to increase from the age of 40 years on.
Figure 67 Multiple myeloma: Age-specifi c incidence by sex, Belgium 2004-2005
Mature T-cell neoplasmsMature T-cell neoplasms derive from mature postthymic T-cells (NK cells are closely related). As well as the mature B-cell lymphomas, they are subdivided following their pattern of spread into:
! Leukaemic or disseminated! Extranodal! Cutaneous! Nodal
The mature T-cell lymphomas are relatively uncommon and represent 180-200 new cases per year in Belgium (7.8% of all NHL lymphomas). Mean age at diagnosis is 62 years, the disease can also be observed in adolescents and young adults. Sex ratio (M/F) is 1.7.
Figure 68 T-cell Lymphoma: Age-specifi c incidence by sex, Belgium 2004-2005
86
belg
ian
canc
er r
egis
try

Hodgkin lymphomaHodgkin lymphoma represents 8.6% of all lymphoid neoplasms. It mostly affects young adults, with a peak of the incidence rate around the age of 20 years; the incidence decreases after the age of 20 years, a second peak is observed around the age of 60-70 years.Incidence seems to be stable over the years.(47)
Classical Hodgkin lymphoma represents 97% of the Hodgkin lymphomas, while nodular lym-phocyte predominant Hodgkin lymphoma represents 3%.
Figure 69 Hodgkin lymphoma: Age-specifi c incidence by sex, Belgium 2004-2005
87
belg
ian
canc
er r
egis
try
canc
er in
cide
nce
in b
elgi
um 20
04–2
005

4 Childhood cancer
Table 25 Childhood cancer (Birch-Marsden) by sex and region, 2004-2005
Boys CR ESR WSR CRi
Belgium 192.8 197.2 199.5 0.291
Brussels Capital Region 250.8 248.7 254.6 0.365
Flemish Region 187.4 191.4 192.5 0.282
Walloon Region 184.3 189.2 192.5 0.280
Girls CR ESR WSR CRi
Belgium 163.4 167.4 169.4 0.247
Brussels Capital Region 212.0 209.6 214.7 0.304
Flemish Region 161.0 165.3 166.6 0.243
Walloon Region 152.9 156.0 158.2 0.231
CR: crude (all ages) incidence rate (n/1,000,000 person years)ESR and WSR: age-standardised incidence rate, using the European or World Standard Population (n/1,000,000 person years)CRi: Cumulative Risk 0-14 years (%)
a Cancer is an extremely rare disease in children (0-14 years old). In European populations, childhood cancer forms less than 1% of all malignant tumours.
a Incidence rates for childhood cancer are expressed per 1,000,000 children per year (interna-tional standard).
a Belgium 2005: 350 cases of childhood cancer, 186 boys and 164 girls.a 11% of the children was diagnosed before the age of 1 year, 43% was diagnosed before the
age of 5 years.a Boys have higher incidence rates than girls.a In boys and girls, the highest incidence rates are observed between 0-4 years of age.a Specifi cation of the various malignant tumours in children is completely different from
adults. In adults, tumours are mainly classifi ed according to the affected organ whereas in children a specifi c international classifi cation has been formulated, mainly based on the morphology of the tumours.(51)
88
belg
ian
canc
er r
egis
try

Table 26 Childhood cancer: Incidence by sex, age group and histological type, Belgium 2004-2005
Birch-Marsden Boys Girls
2004 2005 2004-2005 2004 2005 2004-2005
N % N % CR ESR WSR CRi N % N % CR ESR WSR CRi
I Leukaemias, myeloproliferative and myelodysplastic diseases 48 28.6 46 24.7 51.2 54.3 56.1 0.079 40 32.5 35 21.3 42.7 44.4 45.4 0.065
II Lymphomas and reticuloendothelial neoplasms 25 14.9 34 18.3 32.1 31.1 30.4 0.048 12 9.8 10 6.1 12.5 12.0 11.6 0.018
III CNS and miscellaneous intracranial and intraspinal neoplasms 39 23.2 38 20.4 41.9 42.6 43.0 0.063 32 26.0 31 18.9 35.9 36.4 36.8 0.054
IV Neuroblastoma and other peripheal nervous cell tumours 10 6.0 13 7.0 12.5 14.1 14.9 0.020 10 8.1 13 7.9 13.1 14.6 15.5 0.020
V Retinoblastoma 1 0.6 7 3.8 4.4 5.0 5.3 0.007 1 0.8 7 4.3 4.6 5.2 5.5 0.007
VI Renal tumours 12 7.1 10 5.4 12.0 13.2 13.9 0.019 8 6.5 10 6.1 10.2 11.3 11.8 0.016
VII Hepatic tumours 1 0.6 - - 0.5 0.6 0.7 0.001 2 1.6 2 1.2 2.3 2.6 2.8 0.004
VIII Malignant bone tumours 9 5.4 8 4.3 9.3 8.6 8.2 0.013 1 0.8 15 9.1 9.1 8.3 7.8 0.013
IX Soft tissue and other extraosseous sarcomas 8 4.8 8 4.3 8.7 8.7 8.7 0.013 2 1.6 7 4.3 5.1 5.5 5.6 0.008
X Germ cell tumours, trophoblastic tumours and neoplasms of gonads 5 3.0 2 1.1 3.8 3.5 3.2 0.005 3 2.4 7 4.3 5.7 6.0 6.1 0.009
XI Other malignant epithelial neoplasms and malignant melanomas 9 5.4 20 10.8 15.8 14.9 14.4 0.023 10 8.1 26 15.9 20.5 19.3 18.6 0.030
XII Other and unspecifi ed malignant neoplasms 1 0.6 - - 0.5 0.6 0.7 0.001 2 1.6 1 0.6 1.7 1.8 1.9 0.003
I-XII Total 168 186 192.8 197.2 199.5 0.291 123 164 163.4 167.4 169.4 0.247
CR: crude (all ages) incidence rate (n/1,000,000 person years)ESR and WSR: age-standardised incidence rate, using the European or World Standard Population (n/1,000,000 person years)CRi: Cumulative Risk 0-14 years (%)
89 belgian cancer registrycancer incidence in belgium 2004–2005

Table 27 Childhood cancer incidence: Absolute numbers by sex and age group, Flemish Region, 1997-2005
Boys Girls
Flemish Region Total <1 1-4 5-9 10-14 Total <1 1-4 5-9 10-14
1997 85 9 28 20 28 62 4 29 12 17
1998 84 10 31 21 22 81 9 30 26 16
1999 89 10 21 26 32 76 9 21 21 25
2000 82 7 25 22 28 77 7 18 28 24
2001 89 5 35 24 25 90 12 31 24 23
2002 89 5 36 28 20 72 5 14 29 24
2003 107 9 36 31 31 67 10 22 13 22
2004 90 5 30 24 31 71 9 25 17 20
2005 101 12 32 18 39 86 8 26 16 36
Total 816 72 274 214 256 682 73 216 186 207
a Analyses from the Accis-project(52) showed an annual average increase of 1.1% in childhood cancer incidence in Europe. It is not yet possible to draw reliable conclusions on trends based on the Belgian cancer incidence data.
a Lymphoid leukaemia is the most common malignancy in childhood, followed by brain tu-mours and lymphoma. Lymphoid Leukaemia represents 21% of all childhood tumours 78% of childhood leukaemia is acute lymphoid leukaemia.90
belg
ian
canc
er r
egis
try

5 References1. Haustermans K, Van Oyen H. Kankerregistratie in Vlaanderen: Inventarisatie van de bestaande registers
en voorstel voor een uniform kankerregistratiesysteem [Cancer registration in Flanders: Inventory of the existing registries and proposal for a uniform cancer registration system]. IHE, Brussel, 1996 .
2. Limburgse kanker samenwerking Limburgs kankerregister. Ten years of cancer in the Belgian Province of Limburg, 1996-2005. Hasselt/Leuven, 2007.
3. AKR-Antwerps Kankerregister. Kankerregistratie in de provincie Antwerpen incidentiejaar 2003 [Antwerp Cancer Registry: Cancer registration in the province of Antwerp incidence year 2003]. Antwerp, Septem-ber 2006.
4. Parkin DM, Whelan SL, Ferlay J, et al. Cancer Incidence in Five Continents, Vol. VIII. IARC Scientifi c Publica-tions No. 155, Lyon, 2002.
5. Curado MP, Edwards B, Shin HR, et al. Cancer Incidence in Five Continents, Vol. IX. IARC Scientifi c Publica-tions No. 160, Lyon, 2007. (http://www-dep.iarc.fr/)
6. Van Eycken E, De Wever N. Cancer Incidence and Survival in Flanders, 2000-2001. Flemish Cancer Registry Network - Vlaamse Liga tegen Kanker, Brussels, 2006.
7. Koninklijk Besluit tot wijziging van het Koninklijk Besluit nr.78 van 10 november 1967 betreffende de uitoefening van de gezondheidszorgberoepen. Belgisch Staatsblad, 7 augustus 2008.
Arrêté Royal: Modifi cation de l’Arrêté Royal n° 78 du 10 novembre 1967 relatif à l’exercice des professions des soins de santé. Moniteur Belge, 7 août 2008.
8. Koninklijk Besluit houdende vaststelling van de normen waaraan het zorgprogramma voor oncologische basiszorg en het zorgprogramma voor oncologie moeten voldoen om te worden erkend. Belgisch Staats-blad, 21 maart 2003.
Arrêté Royal: Fixe les normes auxquelles les programmes de soins de base en oncologie et les program-mes de soin en oncologie doivent répondre pour être agréés. Moniteur Belge, 21 mars 2003.
9. Wet houdende diverse bepalingen betreffende gezondheid van 13 december 2006, artikel 39. Belgisch Staatsblad, 22 december 2006.
Loi portant dispositons diverses en matière de santé du 13 décembre 2006, article 39. Monteur Belge, 22 décembre 2006.
10. Directorate-general Statistics Belgium and Economic Information, Federal Public Service Economy, SMEs, Self-employed and Energy. (http://www.statbel.fgov.be/)
11. Handleiding voor de klinische kankerregistratie bij een nieuwe diagnose en bij follow-up. Stichting Kanker register, Brussel, augustus 2008.
Manuel pour l’enregistrement du cancer nouveau diagnostic et follow-up. Fondation Registre du Cancer, Bruxelles, août 2008.
12. International Classifi cation of Diseases for Oncology (ICD-O-3), third edition. WHO, Geneva, 2000.13. Sobin LH, Wittekind CH. TNM Classifi cation of Malignant Tumours, sixth edition. International Union
Against Cancer, Wiley-Liss, Geneva, 2002.14. Nationaal Kankerplan, Laurette Onkelinx Minister van Sociale Zaken en Volksgezondheid, maart 2008. Plan Cancer, Laurette Onkelinx Ministre Affaires Sociales et de la Santé Publique, mars 2008.15. Wet houdende de oprichting en organisatie van het eHealth platform van 21 augustus 2008. Belgisch
Staatsblad, 13 oktober 2008. Loi relative à l’institution et à l’organisation de place-forme eHealth du 21 août 2008. Monteur Belge,
13 octobre 2008.16. Parkin DM, Chen VW, Ferlay J, et al. Comparability and quality control in cancer registration. IARC Techni-
cal Report No. 19, Lyon, 1994.17. Van Eycken E, Haustermans K, Butinx F. Evaluation of the encryption procedure and record linkage in the
Belgian National Cancer Registry. Archives of Public Health 2000; 58: 281-294.18. Tefferi A, Vardiman JW. Classifi cation and diagnosis of myeloproliferative neoplasms: the 2008 World
Health Organization criteria and point-of-care diagnostic algorithms. Leukaemia 2008; 22(1):14-22.19. Tyczynski JE, Bray F, Parkin M. Breast Cancer in Europe. ENCR Fact Sheets 2002. (http://www.encr.com.fr/breast-factsheets.pdf)20. Vlaams Agentschap Zorg en Gezondheid. Vlaamse gezondheidsindicatoren. Statistiek van de doods -
oorzaken. 1997. (http://www.zorg-en-gezondheid.be/cijfers.aspx)21. Observatoire de la Santé et du Social de Bruxelles. Bulletins statistiques de décès. 2008.22. Ministère de la Communauté française-Direction générale de la Santé-Cellule des statistiques des nais-
sances et des décès. Bulletins statistiques de décès. 2008.23. Scientifi c Institute of Public Health (http://www.iph.fgov.be/epidemio/spma/index.htm)24. Larsen IK, Smastuen M, Parkin DM, Bray F. Data quality in the Cancer Registry of Norway. Cancer in Nor-
way 2006 - Cancer incidence, mortality, survival and prevalence in Norway. Cancer Registry of Norway, Oslo, 2007.
25. PROCARE website. (http://www.kankerregister.org/).26. Penninckx F, Roels S, Leonard D, Laurent S, Decaestecker J, De Vleeschouwer C. Kwaliteit van rectale kanker-
zorg - Fase 1 - Een praktijkrichtlijn voor rectale kanker. KCE reports 69A. Federaal Kenniscentrum voor de Gezondheidszorg / Centre fédéral d’expertise des soins de santé, Brussels, 2007.
27. Vlayen J, Verstreken M, Mertens C, Van Eycken E, Penninckx F. Kwaliteit van rectale kankerzorg – Fase 2 - ontwikkeling en test van een set van kwaliteitsindicatoren. KCE reports 81A. Federaal Kenniscentrum voor de Gezondheidszorg / Centre fédéral d’expertise des soins de santé, Brussels, 2008.
91
belg
ian
canc
er r
egis
try
canc
er in
cide
nce
in b
elgi
um 20
04–2
005

28. Curado MP, Edwards B, Shin HR, et al. Cancer Incidence in Five Continents, Vol. IX. IARC Scientifi c Publica-tions No. 160, Lyon, 2007.
(http://www-dep.iarc.fr/CI5-IX/PDF/INDICES/I_25.pdf)29. Van Eycken E. Kankerincidentie in Vlaanderen 1997-1999 [Incidence of cancer in Flanders 1997-1999].
Vlaams Kankerregistratienetwerk – Vlaamse Liga tegen Kanker, Brussel, 2002.30. Waterhouse J, Muir C, Correa P, Powell J. Cancer Incidence in Five Continents, Vol. III. IARC Scientifi c Publi-
cations No. 15, Lyon, 1976.31. Jensen OM, Parkin DM, MacLennan R, et al. Cancer Registration: Principles and Methods - Chapter 11. IARC
Scientifi c Publications, Lyon, 1991.32. Pukkala E, Söderman B, Okeanov A,et al. Cancer atlas of Northern Europe. Cancer Society of Finland Pub-
lication No. 62, Helsinki, 2001. (http://www.cancerregistry.fi /atlasweb/index.htm)33. Siesling S, van der Aa MA, Coebergh JWW, Pukkala E. Time-space trends in cancer incidence in the Neth-
erlands in 1989–2003. International Journal of Cancer 2008; 122: 2106-2214.34. Tyczynski JE, Pasanen K, Berkel HJ, Pukkala E. Atlas of cancer incidence & mortality in Ohio 1996-2001.
Cancer Prevention Institute, Dayton, Ohio, USA, 2006.35. Pukkala E, Patama T, Engholm G, et al. Small-area based map animations of cancer incidence in the Nordic
countries, 1971-2003. Nordic Cancer Union, 2007. (http://astra.cancer.fi /cancermaps/Nordic)36. Pönkä A, Pukkala E, Hakulinen T. Lung cancer and ambient air pollution in Helsinki. Environment Interna-
tional 1993; 19: 221-231.37. Jensen OM, Parkin DM, MacLennan R, et al. Cancer registration: principles and methods. IARC Scientifi c
Publications No. 95, Lyon, 1991.38. • Nordcan (Island, Norway, Sweden, Finland, Denmark): Engholm G, Ferlay J, Christensen N, et al. 2008.
NORDCAN: Cancer Incidence, Mortality and Prevalence in the Nordic Countries, Version 3.2. Association of Nordic Cancer Registries. Danish Cancer Society. (http://www.ancr.nu)
• Germany, Saarland: Cancer incidence in Saarland (Germany) 2004-2005. Epidemiologisches Krebsreg-ister Saarland. (www.krebsregister.saarland.de/datenbank/datenbank.html)
• England: Cancer statistics - registrations of cancer diagnosed in 2005, England. Series MB1 no. 36. London: Offi ce for National Statistics, 2008. • France: Belot A, Grosclaude P, Bossard N, et al. 2008. Cancer incidence and mortality in France over the
period 1980-2005. Revue d’Epidémiologie et de Santé Publique 2008 ; 56(3): 159-175. (www.invs.sante.fr/surveillance/cancers/estimations_cancers/default.htm • Poland: Cancer incidence in Poland, 2005. The Maria Sk_odowska - Curie memorial Cancer Center De-
partment of Epidemiology and Cancer Prevention National Cancer Registry (http://85.128.14.124/krn/english/)
• The Netherlands: Cancer incidence in the Netherlands, 2005. Netherlands Cancer Registry (www.ikcnet.nl) • Slovenia: Cancer incidence in Slovenia 2005. Cancer registry of Slovenia (personal communication dd. ).
39. Percy C, Van Holten V, Muir C. International Classifi cation of disease for Oncology. Second edition. WHO, Genève, 1990.
40. Fritz A, Percy C, Jack A et al. International Classifi cation of Disease for Oncology. Third edition. WHO, Geneve, 2000.
41. Ferlay J, Bray F, Pisani P, Parkin M. GLOBOCAN 2002: Cancer Incidence, Mortality and Prevalence World-wide. IARCPress, Lyon, 2004.
42. Rappaport H. Tumors of hematopoietic system. Atlas of tumor pathology. AFIP, Washington DC,1966.43. Lukes RJ, Collins RD. Immunologic characterization of human malignant lymphomas. Cancer 1974; 34(4
Suppl): 503.44. National Cancer Institute sponsored study of classifi cations of non-Hodgkin’s lymphomas: summary and
description of a working formulation for clinical usage. The Non-Hodgkin’s Lymphoma Pathologic Clas-sifi cation Project. Cancer 1982; 49(10):2112-2135.
45. Bennett JM, Catovsky D, Daniel MT et al. Proposals for the classifi cation of the acute leukaemia’s. French-American-British (FAB) co-operative group. British Journal of Haematology 1976; 33(4):451-458.
46. Harris NL, Jaffe ES, Stein H. A revised European-American classifi cation of lymphoid neoplasms: a proposal from the International Lymphoma Study Group. Blood 1994; 84(5):1361-1392.
47. Jaffe ES, Harris NL, Stein H, Vardiman JW. Classifi cation of Tumours. Pathology and genetics of tumours of haematopoietic and lymphoid tissues. Third edition. IARC Press, Lyon, 2001.
48. Swerdlow S, Campo E, Harris NL et al. WHO Classifi cation of Tumours of Haematopoietic and Lymphoid Tissues. Fourth edition. Lyon, 2008.
49. International Classifi cation of diseases and health-related problems-10th revision. Second edition. WHO, Genève, 2004.
50. Morton LM, Turner JJ, Cerhan JR et al.. Proposed classifi cation of lymphoid neoplasms for epidemiologic research from the Pathology Working Group of the International Lymphoma Epidemiology Consortium (InterLymph). Blood 2007; 110(2): 695-708.
51. Steliarova-Foucher E, Stiller C, Lacour B, Kaatsch P et al. International Classifi cation of Childhood Cancer. Third Edition. Cancer 2005;103:1457-1467.
52. Steliarova-Foucher E, Stiller Ch, Kaatsch P et al. Geographical patterns and time trends of cancer incidence and survival among children and adolescents in Europe since the 1970s (the ACCIS project): an epidemio-logical study. Lancet 2004; 364: 2097-2105.
92
belg
ian
canc
er r
egis
try

b e l g i a n c a n c e r r e g i s t r y
Koningsstraat 215 / Rue Royale 2151210 Brussel / BruxellesT +32 2 250 10 10F +32 2 250 10 11
www.kankerregister.orgwww.registreducancer.org
2004-2005Cancer Incidence in Belgium
Cancer Incidence in Belgium 2004–2005
In 2005 a total of 57,185 new cases of cancer were diagnosed in Belgium, 31,484 in males and 25,701 in females. About one in three males and one in four females will develop a cancer before the age of 75 years. Childhood cancer forms less than 1% of all malignant tumours, this corresponds with 350 new cancer diagnoses in 2005.
The most frequently occurring tumour in males is prostate cancer, followed by lung cancer and colorectal cancer. Breast, colorectal and lung are the most frequently occurring malignancies in females.
A total number of 25,693 patients died from cancer in 2004 in Belgium, 14,659 males and 11,034 females. The major cause of death by cancer is lung cancer in males and breast cancer in females.
In addition to incidence tables and graphs, a geographical representation of the Belgian cancer incidence is included for a number of common malignancies.