Konecranes Annual Report 2016 · Dear shareholders, 2016 was clearly dominated by a number of major...
71
Konecranes Annual Report 2016
Transcript of Konecranes Annual Report 2016 · Dear shareholders, 2016 was clearly dominated by a number of major...
Konecranes Annual Report 2016
ORGANIZATION
GROWTH
ENVIRONMENT
The moment has arrived to consolidate Konecranes’ key strengths, clarify where the greatest potential lies, and assert a new stage on which to build progress.
A foundation for the future.
The company has been poised for change for some time, a situation which has bred both agility and the capacity to work under pressure. Change always brings opportunities, but can also represent uncertainty. It’s time to remove the question marks – Konecranes’ business transformation is now more fully realized than ever.
As the result of our acquisition of Terex’s Material Handling & Port Solutions segment, Konecranes will achieve substantial growth opportunities in the service business as well as critical scale for further technological development. Our recent investments in business infrastructure and global footprint optimization will also provide significant earnings leverage.
There can be no solid future unless we take care of our people and the environment. Recent employee satisfaction and company culture surveys have been highly positive, with development points now mapped out. We have also set targets for ISO implementation and energy efficiency, developed Environmental Product Declarations, and launched our circular economy program.
Our organizational changes serve as the foundation for increased efficiency, lower fixed costs, and increased sales. Replacing our matrix organization with a line-based approach has provided clearer accountability. In addition, business benefits are being realized in the organization owing to the new IT systems implemented under oneKONECRANES.
CONTENTS2 Konecranes in a snapshot
4 2016 highlights
6 CEO's letter
8 Company narrative
9 Konecranes and MHPS
10 Business environment
12 Business Area Service
15 Business Area Equipment
18 Regional fact & figures
19 Research & Development
22 Core of Lifting
24 Product overview
27 Corporate responsibility
36 GRI content index
38 Corporate Governance
46 Risk management, internal control, and internal auditing
54 Board of Directors
56 Group Executive Board
58 Senior Management
FINANCIAL STATEMENTS 2016
60 Report of the Board of Directors
71 Consolidated statement of income – IFRS
72 Consolidated balance sheet – IFRS
74 Consolidated statement of changes in equity – IFRS
75 Consolidated cash flow statement – IFRS
76 Notes to the consolidated financial statements
115 Konecranes Group 2012–2016
116 Calculation of key figures
117 Company list
120 Parent company statement of income – FAS
121 Parent company cash flow – FAS
122 Parent company balance sheet – FAS
124 Notes to the parent company’s financial statements
127 Board of Directors’ proposal to the Annual General Meeting
128 Auditor’s report
131 Shares and shareholders
136 Investor information
137 Contact details
This publication is for general informational purposes only. Konecranes reserves the right at any time, without notice, to
alter or discontinue the products and/or specifications referenced herein. This publication creates no warranty on the part of
Konecranes, express or implied, including but not limited to any implied warranty or merchantability or fitness for a particular
purpose.
© 2017 Konecranes. All rights reserved. ‘Konecranes’, ‘Lifting Businesses’, , ‘SMARTON’, ‘TRUCONNECT’, ‘Agilon’,
‘BOXHUNTER’, 'BOXPORTER', ‘CXT’, ‘UNO’ and ‘UNITON’ are either registered trademarks or trademarks of Konecranes.
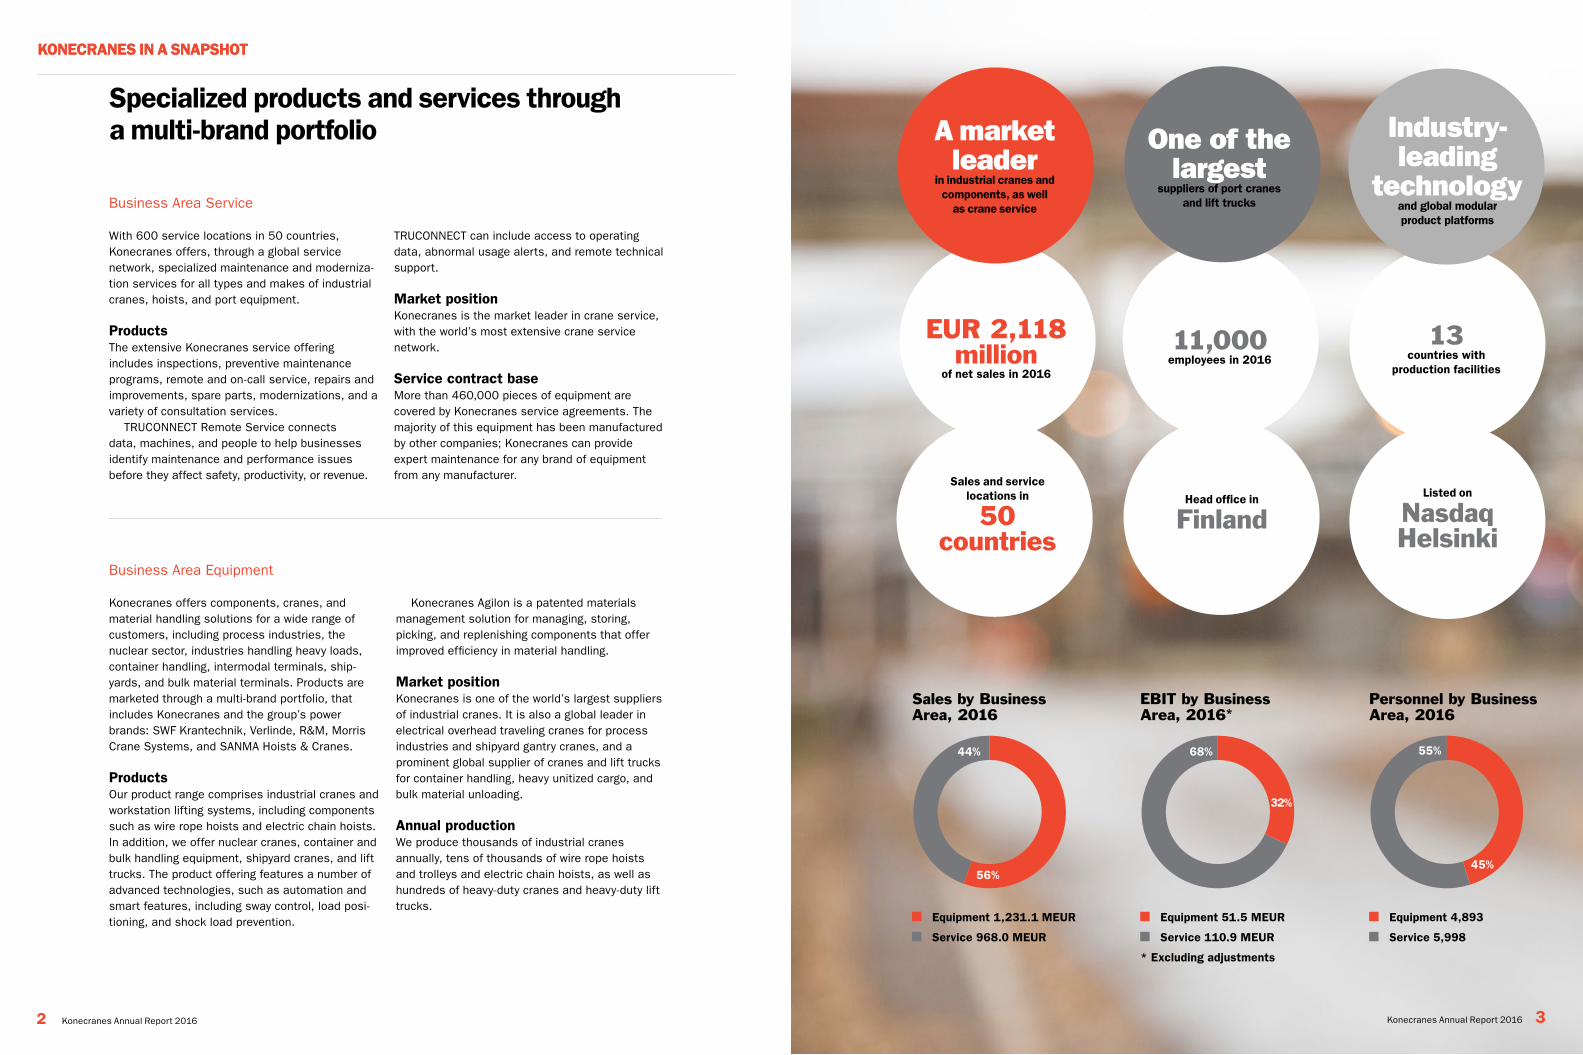
Business Area Service
With 600 service locations in 50 countries, Konecranes offers, through a global service network, specialized maintenance and moderniza-tion services for all types and makes of industrial cranes, hoists, and port equipment.
ProductsThe extensive Konecranes service offering includes inspections, preventive maintenance programs, remote and on-call service, repairs and improvements, spare parts, modernizations, and a variety of consultation services.
TRUCONNECT Remote Service connects data, machines, and people to help businesses identify maintenance and performance issues before they affect safety, productivity, or revenue.
Business Area Equipment
Konecranes offers components, cranes, and material handling solutions for a wide range of customers, including process industries, the nuclear sector, industries handling heavy loads, container handling, intermodal terminals, ship-yards, and bulk material terminals. Products are marketed through a multi-brand portfolio, that includes Konecranes and the group’s power brands: SWF Krantechnik, Verlinde, R&M, Morris Crane Systems, and SANMA Hoists & Cranes.
ProductsOur product range comprises industrial cranes and workstation lifting systems, including components such as wire rope hoists and electric chain hoists. In addition, we offer nuclear cranes, container and bulk handling equipment, shipyard cranes, and lift trucks. The product offering features a number of advanced technologies, such as automation and smart features, including sway control, load posi-tioning, and shock load prevention.
Specialized products and services through a multi-brand portfolio
11,000employees in 2016
Head office in
Finland
One of the largest
suppliers of port cranes and lift trucks
EUR 2,118 million
of net sales in 2016
A market leader
in industrial cranes and components, as well
as crane service
Sales and service locations in
50 countries
13countries with
production facilities
Industry- leading
technology and global modular product platforms
Listed on
Nasdaq Helsinki
TRUCONNECT can include access to operating data, abnormal usage alerts, and remote technical support.
Market position Konecranes is the market leader in crane service, with the world’s most extensive crane service network.
Service contract base More than 460,000 pieces of equipment are covered by Konecranes service agreements. The majority of this equipment has been manufactured by other companies; Konecranes can provide expert maintenance for any brand of equipment from any manufacturer.
Konecranes Agilon is a patented materials management solution for managing, storing, picking, and replenishing components that offer improved efficiency in material handling.
Market positionKonecranes is one of the world’s largest suppliers of industrial cranes. It is also a global leader in electrical overhead traveling cranes for process industries and shipyard gantry cranes, and a prominent global supplier of cranes and lift trucks for container handling, heavy unitized cargo, and bulk material unloading.
Annual productionWe produce thousands of industrial cranes annually, tens of thousands of wire rope hoists and trolleys and electric chain hoists, as well as hundreds of heavy-duty cranes and heavy-duty lift trucks.
Sales by Business Area, 2016
Equipment 1,231.1 MEUR
Service 968.0 MEUR
56%
44%
EBIT by Business Area, 2016*
Equipment 51.5 MEUR
Service 110.9 MEUR
* Excluding adjustments
32%
68%
Personnel by Business Area, 2016
Equipment 4,893
Service 5,998
45%
55%
Konecranes Annual Report 2016 32 Konecranes Annual Report 2016
KonecrAneS in A SnAPSHotKonecrAneS in A SnAPSHot
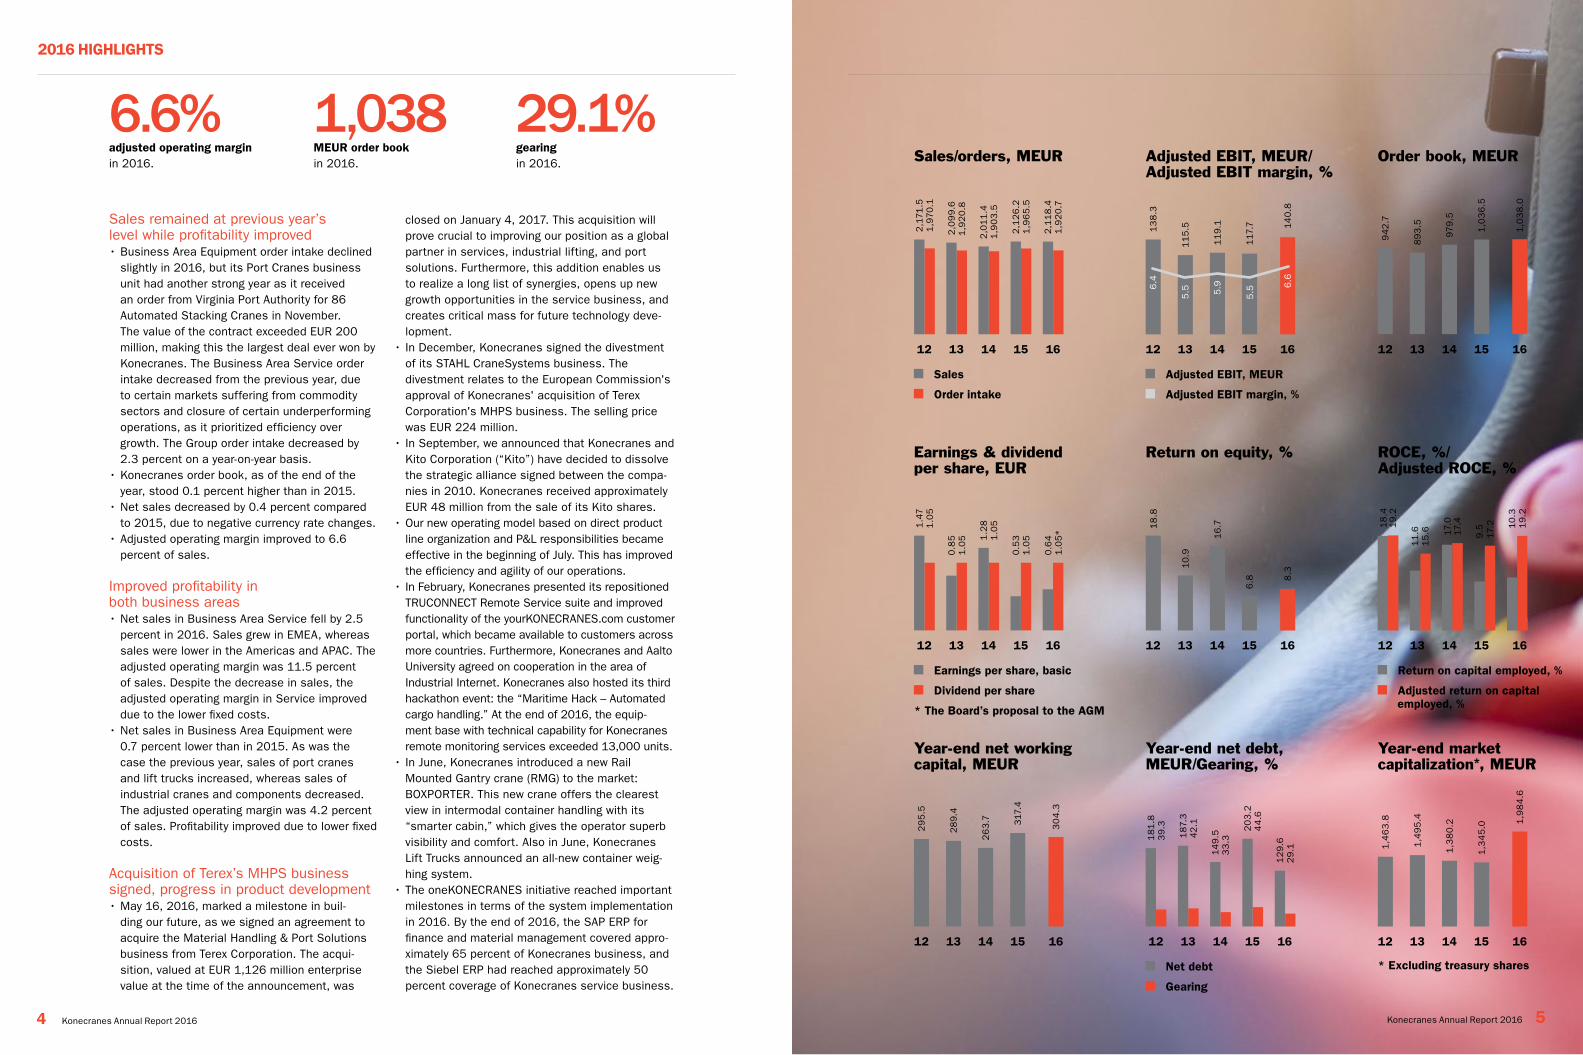
Sales remained at previous year’s level while profitability improved• Business Area Equipment order intake declined
slightly in 2016, but its Port Cranes business unit had another strong year as it received an order from Virginia Port Authority for 86 Automated Stacking Cranes in November. The value of the contract exceeded EUR 200 million, making this the largest deal ever won by Konecranes. The Business Area Service order intake decreased from the previous year, due to certain markets suffering from commodity sectors and closure of certain underperforming operations, as it prioritized efficiency over growth. The Group order intake decreased by 2.3 percent on a year-on-year basis.
• Konecranes order book, as of the end of the year, stood 0.1 percent higher than in 2015.
• Net sales decreased by 0.4 percent compared to 2015, due to negative currency rate changes.
• Adjusted operating margin improved to 6.6 percent of sales.
Improved profitability in both business areas• Net sales in Business Area Service fell by 2.5
percent in 2016. Sales grew in EMEA, whereas sales were lower in the Americas and APAC. The adjusted operating margin was 11.5 percent of sales. Despite the decrease in sales, the adjusted operating margin in Service improved due to the lower fixed costs.
• Net sales in Business Area Equipment were 0.7 percent lower than in 2015. As was the case the previous year, sales of port cranes and lift trucks increased, whereas sales of industrial cranes and components decreased. The adjusted operating margin was 4.2 percent of sales. Profitability improved due to lower fixed costs.
Acquisition of Terex’s MHPS business signed, progress in product development• May 16, 2016, marked a milestone in buil-
ding our future, as we signed an agreement to acquire the Material Handling & Port Solutions business from Terex Corporation. The acqui-sition, valued at EUR 1,126 million enterprise value at the time of the announcement, was
6.6%adjusted operating margin in 2016.
1,038MeUr order bookin 2016.
29.1%gearing in 2016.
closed on January 4, 2017. This acquisition will prove crucial to improving our position as a global partner in services, industrial lifting, and port solutions. Furthermore, this addition enables us to realize a long list of synergies, opens up new growth opportunities in the service business, and creates critical mass for future technology deve-lopment.
• In December, Konecranes signed the divestment of its STAHL CraneSystems business. The divestment relates to the European Commission's approval of Konecranes' acquisition of Terex Corporation's MHPS business. The selling price was EUR 224 million.
• In September, we announced that Konecranes and Kito Corporation (“Kito”) have decided to dissolve the strategic alliance signed between the compa-nies in 2010. Konecranes received approximately EUR 48 million from the sale of its Kito shares.
• Our new operating model based on direct product line organization and P&L responsibilities became effective in the beginning of July. This has improved the efficiency and agility of our operations.
• In February, Konecranes presented its repositioned TRUCONNECT Remote Service suite and improved functionality of the yourKONECRANES.com customer portal, which became available to customers across more countries. Furthermore, Konecranes and Aalto University agreed on cooperation in the area of Industrial Internet. Konecranes also hosted its third hackathon event: the “Maritime Hack – Automated cargo handling.” At the end of 2016, the equip-ment base with technical capability for Konecranes remote monitoring services exceeded 13,000 units.
• In June, Konecranes introduced a new Rail Mounted Gantry crane (RMG) to the market: BOXPORTER. This new crane offers the clearest view in intermodal container handling with its “smarter cabin,” which gives the operator superb visibility and comfort. Also in June, Konecranes Lift Trucks announced an all-new container weig-hing system.
• The oneKONECRANES initiative reached important milestones in terms of the system implementation in 2016. By the end of 2016, the SAP ERP for finance and material management covered appro-ximately 65 percent of Konecranes business, and the Siebel ERP had reached approximately 50 percent coverage of Konecranes service business.
12 13 14 15 16
Sales/orders, MEUR
Sales
Order intake
2,1
71.5
1,9
70.1
2,0
99.6
1,9
20.8
2,0
11
.41
,90
3.5
2,1
26
.2
2,1
18
.4
1,9
65
.5
1,9
20.7
12 13 14 15 16
Adjusted EBIT, MEUR/Adjusted EBIT margin, %
Adjusted EBIT, MEUR
Adjusted EBIT margin, %
13
8.3
11
5.5
11
9.1
117
.7 14
0.8
6.4
5.5 5.9
5.5
6.6
12 13 14 15 16
Order book, MEUR
942
.7
89
3.5
979.5
1,0
38
.0
1,0
36
.5
12 13 14 15 16
Earnings & dividend per share, EUR
Earnings per share, basic
Dividend per share
* The Board’s proposal to the AGM
1.4
71
.05
0.8
51
.05 1
.28
1.0
5
0.5
3
0.6
4
1.0
5
1.0
5*
12 13 14 15 16
Return on equity, %
18
.8
10.9
6.8
16
.7
8.3
12 13 14 15 16
ROCE, %/ Adjusted ROCE, %
18
.4
11
.6 17.0
9.5 1
0.3
19.2
15
.6 17.4
17.2 1
9.2
Return on capital employed, %
Adjusted return on capital employed, %
12 13 14 15 16
Year-end net working capital, MEUR
29
5.5
28
9.4
26
3.7 317
.4
30
4.3
12 13 14 15 16
Year-end net debt, MEUR/Gearing, %
Net debt
Gearing
181
.83
9.3
187.
342
.1
14
9.5
33
.3
20
3.2
12
9.6
44
.6
29.1
12 13 14 15 16
Year-end market capitalization*, MEUR
* Excluding treasury shares
1,3
45
.0
1,4
63
.8
1,4
95
.4
1,3
80.2 1
,98
4.6
4 Konecranes Annual Report 2016 Konecranes Annual Report 2016 5
2016 HigHLigHtS
Dear shareholders,2016 was clearly dominated by a number of major events for Konecranes.
We entered the year committed to a merger of equals with Terex Corporation, but as time proceeded, this began to look increasingly uncer-tain. It gradually became clear that the most advantageous outcome for Konecranes would be the acquisition of Terex’s Material Handling & Port Solutions business (MHPS), and we reoriented our efforts accordingly.
Irrespective of this acquisition, significant orga-nizational change was an operational necessity for us in 2016. Beginning in January, we underwent a complete reorganization in three steps. We reduced the number of regions, centralized our functional operations, and went from a matrix to a fully business-line-oriented organization. This, together with other restructuring activities, had the effect of reducing total personnel by over 900 positions, a significant component of which were in middle management.
There were three main reasons for such a profound and wide-reaching set of changes.
Firstly, as I explained this time last year, our fixed costs were too high, and actions to reduce them were a necessity. Secondly, the changes gave clarity to the organization; operations are in charge of the business – let them also run the business.
Thirdly, and perhaps most significantly in retro-spect, the integration of MHPS – including the addition of around 7,000 new colleagues – would not have been possible within the matrix organiza-tion that we formerly had in place.
Having reached agreement with Terex by May, we used the summer to begin the necessary anti-trust review and other legal proceedings, and the planning of the integration itself started in September, by which time the organization was well prepared and ready to adapt to its many implications.
This preparation can now be seen in our finan-cial performance for the year. With our business areas having had three to four months to settle into their own changes before the integration planning began, their operations were not too disturbed.
Another consequence of the acquisition was our voluntary divestment remedy, which repre-sented the best available alternative from a
value-creation perspective. The divestment was concluded in record time and at a satisfactory price level.
In 2016, the Group’s adjusted operating profit improved by 20 percent to reach EUR 141 million, despite sales levels remaining virtually unchanged. The adjusted operating margin rose from 5.5 percent to 6.6 percent. The profitability improvement ably demonstrated that our actions to cut manufacturing capacity and introduce a new operating model have improved our competitive-ness. Owing to these factors, coupled with our streamlining of middle management, we achieved cost savings of more than EUR 30 million in 2016, which was visible in lower fixed costs. More-over, our cash flow was markedly strengthened compared with 2015, which lowered gearing to 29 percent.
The market itself continued to be challenging – Group order intake decreased by two percent on a year-on-year basis in 2016 – though certain macroeconomic indicators did improve somewhat towards the end of the year. In order intake, the ports side was dominated by one huge order published in Q4 – the biggest in our company’s history, in fact. This was the sale of 86 Automated Stacking Cranes (ASCs) to Virginia Port Authority (marketed as The Port of Virginia), worth over EUR 200 million. Our other businesses continued to suffer from low investment within the process industries and commodity sectors. The demand situation in Europe and North America was mixed, while in emerging markets it continued to be hampered by a slow-down in economic growth rates.
During the twelve months summarized in this report, a huge amount of work has been done to bring our organization to the point at which we now find ourselves. Many legal steps had to be taken related to the MHPS acquisition, not least our agreements with the EU, the US competition authorities, and other jurisdictions.
I would like to take this opportunity to thank all our personnel for the patience, understanding and hard work they demonstrated during this process. We begin 2017 – and a new era – more agile, more focused, and with greater potential than ever to deliver strong results for all our stakeholders.
Panu routilaPresident and CEO
Shaping our future through acquisition We begin 2017 more agile, more focused, and with greater potential than ever to deliver strong results for all our stakeholders.
Konecranes Annual Report 2016 76 Konecranes Annual Report 2016
ceo'S Letter
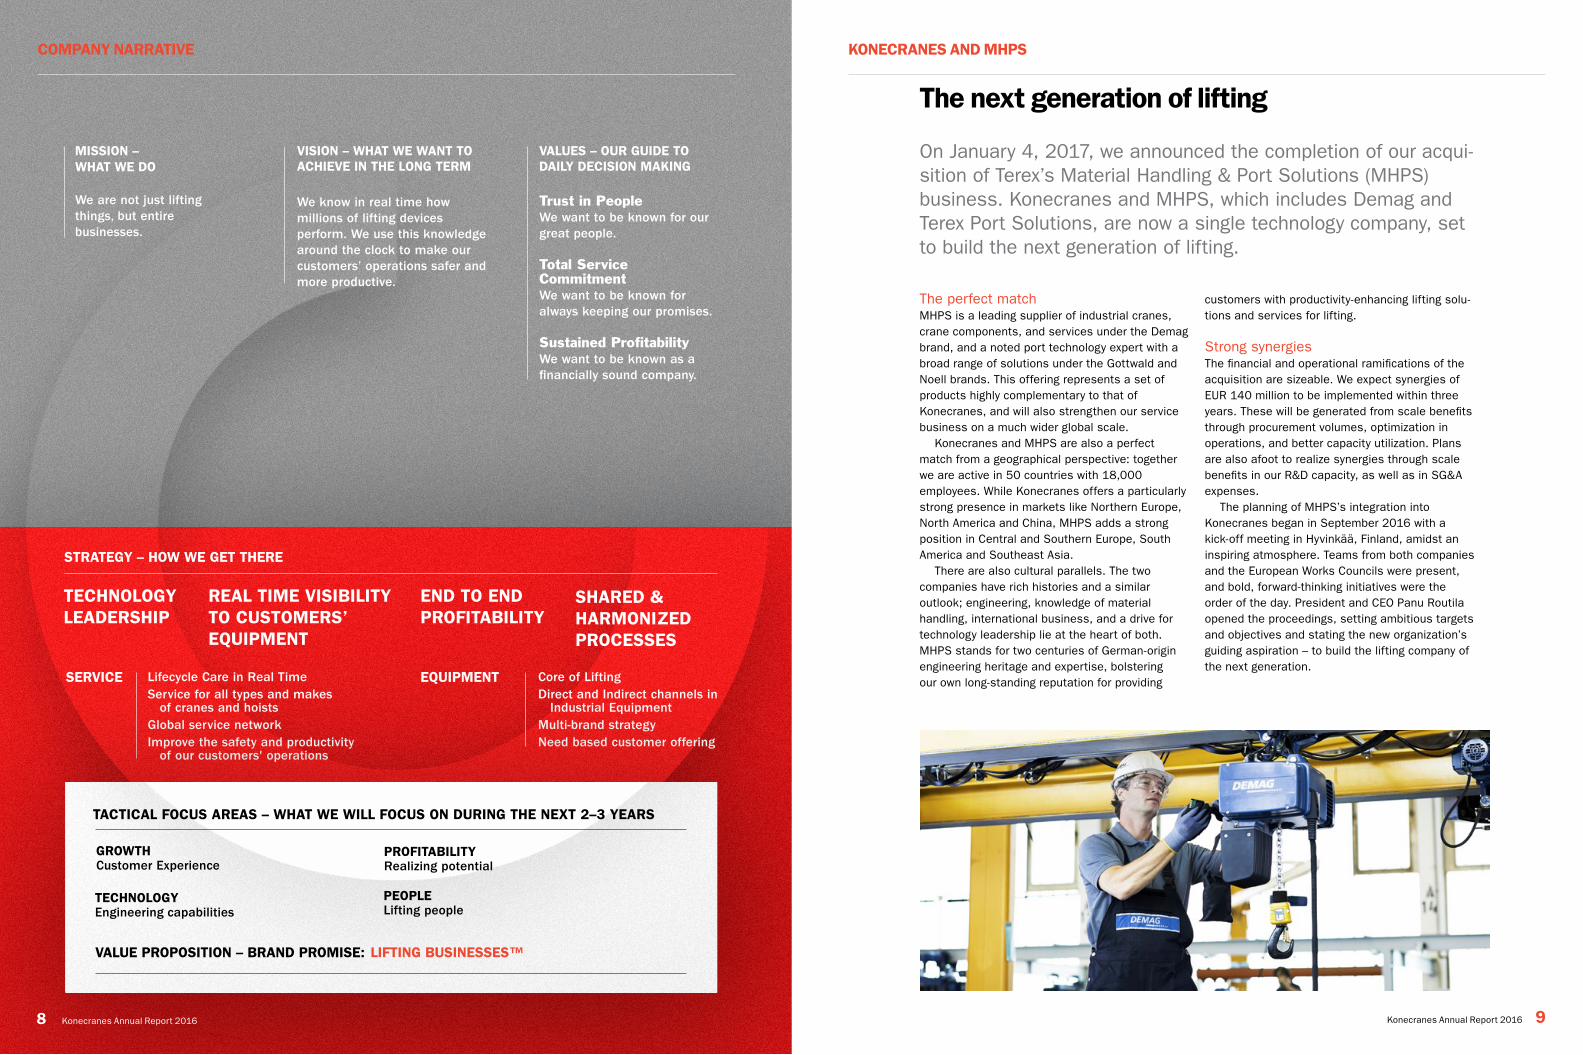
StrAtegY – HoW We get tHere
Lifecycle Care in Real TimeService for all types and makes of cranes and hoistsGlobal service networkImprove the safety and productivity of our customers' operations
SerVice Core of LiftingDirect and Indirect channels in Industrial Equipment Multi-brand strategyNeed based customer offering
eQUiPMent
enD to enD ProFitABiLitY
reAL tiMe ViSiBiLitY to cUStoMerS’ eQUiPMent
SHAreD & HArMoniZeD ProceSSeS
tecHnoLogY LeADerSHiP
VALUeS – oUr gUiDe to DAiLY DeciSion MAKing
Trust in PeopleWe want to be known for our great people.
Total Service CommitmentWe want to be known for always keeping our promises.
Sustained ProfitabilityWe want to be known as a financially sound company.
MiSSion – WHAt We Do
We are not just lifting things, but entire businesses.
ViSion – WHAt We WAnt to AcHieVe in tHe Long terM
We know in real time how millions of lifting devices perform. We use this knowledge around the clock to make our customers’ operations safer and more productive.
tActicAL FocUS AreAS – WHAt We WiLL FocUS on DUring tHe neXt 2–3 YeArS
VALUe ProPoSition – BrAnD ProMiSe:
tecHnoLogY Engineering capabilities
groWtH Customer Experience
ProFitABiLitY Realizing potential
PeoPLe Lifting people
LiFting BUSineSSeS™
The perfect matchMHPS is a leading supplier of industrial cranes, crane components, and services under the Demag brand, and a noted port technology expert with a broad range of solutions under the Gottwald and Noell brands. This offering represents a set of products highly complementary to that of Konecranes, and will also strengthen our service business on a much wider global scale.
Konecranes and MHPS are also a perfect match from a geographical perspective: together we are active in 50 countries with 18,000 employees. While Konecranes offers a particularly strong presence in markets like Northern Europe, North America and China, MHPS adds a strong position in Central and Southern Europe, South America and Southeast Asia.
There are also cultural parallels. The two companies have rich histories and a similar outlook; engineering, knowledge of material handling, international business, and a drive for technology leadership lie at the heart of both. MHPS stands for two centuries of German-origin engineering heritage and expertise, bolstering our own long-standing reputation for providing
customers with productivity-enhancing lifting solu-tions and services for lifting.
Strong synergiesThe financial and operational ramifications of the acquisition are sizeable. We expect synergies of EUR 140 million to be implemented within three years. These will be generated from scale benefits through procurement volumes, optimization in operations, and better capacity utilization. Plans are also afoot to realize synergies through scale benefits in our R&D capacity, as well as in SG&A expenses.
The planning of MHPS’s integration into Konecranes began in September 2016 with a kick-off meeting in Hyvinkää, Finland, amidst an inspiring atmosphere. Teams from both companies and the European Works Councils were present, and bold, forward-thinking initiatives were the order of the day. President and CEO Panu Routila opened the proceedings, setting ambitious targets and objectives and stating the new organization’s guiding aspiration – to build the lifting company of the next generation.
the next generation of lifting
On January 4, 2017, we announced the completion of our acqui-sition of Terex’s Material Handling & Port Solutions (MHPS) business. Konecranes and MHPS, which includes Demag and Terex Port Solutions, are now a single technology company, set to build the next generation of lifting.
Konecranes Annual Report 2016 9
KonecrAneS AnD MHPS
8 Konecranes Annual Report 2016
coMPAnY nArrAtiVe
The activity in the world’s manufacturing sector, according to the aggregated JPMorgan Global Manufacturing Purchasing Managers’ Index (PMI), picked up steam in the second half of 2016. This followed stagnant development in the first half of 2016. By area, growth was generally led by the US and Western Europe regions. However, the perfor-mance of the Asia region also improved.
According to the PMI surveys in the Eurozone, expansion of the manufacturing production accel-erated toward year-end 2016. In December, the Eurozone manufacturing PMI was at its highest level since April 2011. National data pointed to a broad-based improvement. Growth was strongest in the Netherlands and Austria, which were closely followed by Germany and Spain. Also France, where manufacturing production contracted in the three first quarters of 2016, saw a return to growth in the fourth quarter.
Outside the Eurozone, the UK PMI posted a strong finish to 2016 following a short period of volatility around the EU referendum in June as the weaker Sterling exchange rate drove export orders higher. In Sweden, manufacturing activity continued to expand strongly throughout the year. The European Union manufacturing capacity utili-zation rate slightly improved in 2016.
Similar to Europe, the economic activity in the US manufacturing sector, measured by the PMI, picked up toward the end of 2016. This did not yet reflect in the US manufacturing capacity utilization rate, which declined slightly from 2015. The total industrial capacity utilization rate, which declined heavily in 2015 due to commodity sectors, stabi-lized in 2016.
Based on the PMIs, the BRIC countries remained the weakest links. The year 2016
started on a weak note in Chinese and Russian manufacturing sectors, but they finished the year in a growth mode. Modest growth could be observed overall in India. In Brazil, the PMI pointed to a continued contraction in manufacturing output the entire year.
Compared to the previous year, the demand for industrial cranes improved in 2016, mainly owing to the pick-up in orders for heavy-duty cranes in the Americas. The demand for industrial cranes was at a par with the previous year’s level in EMEA, whereas the demand weakened in APAC. The demand for hoists declined in all regions.
The global container throughput grew only by approximately 1 percent in 2016. The number of idle container ships – ships not used for commercial operations – doubled in 2016 due to overcapacity. The bright spots for container traffic included Europe-Middle East, Asia-North America, and Asia-Oceania routes. The weakest routes were between Europe-South America, Asia-South America, and Asia-West Africa.
Due to weak growth in container throughput and focus on M&A, most of the terminal operators’ capacity expansion plans were put under review in 2016. This affected the demand for port cranes. However, the interest in automated port solutions remained high.
The demand for lift trucks declined from the previous year, mainly due to weaker demand in the Americas. The demand was rather stable in EMEA, while the demand grew in APAC.
The demand for lifting equipment services grew in EMEA, whereas the demand for services decreased from the previous year in the Americas and APAC. The demand in the Americas and APAC was hit by commodity sectors.
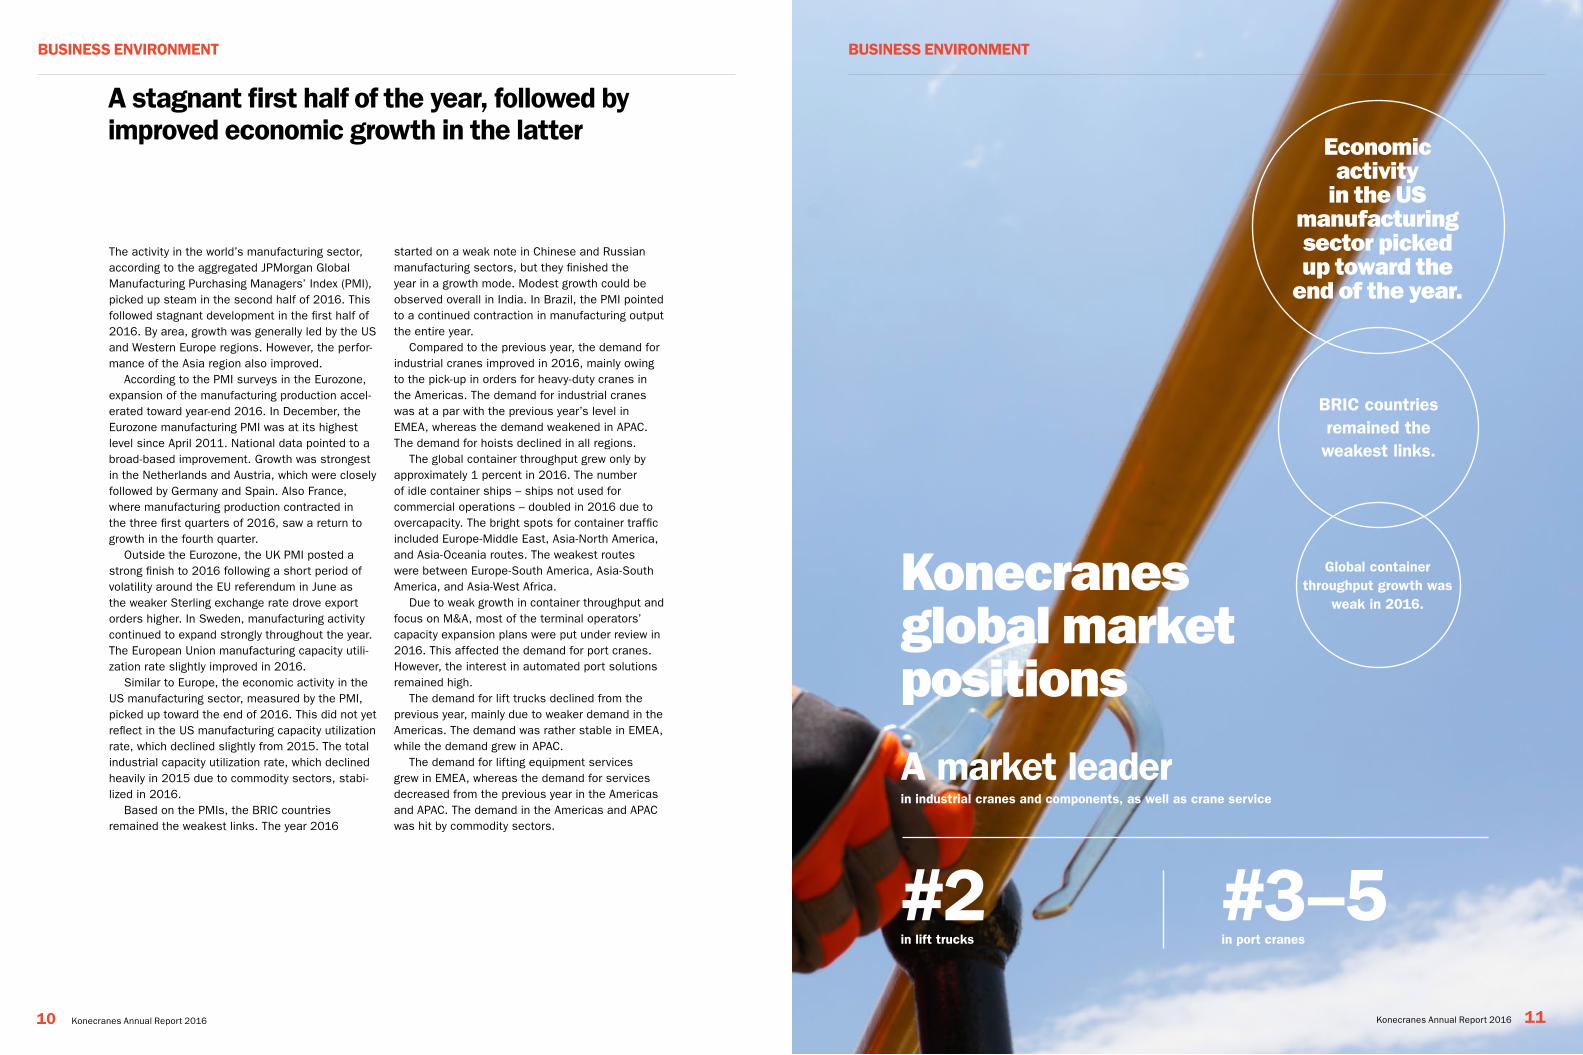
#2in lift trucks
#3–5in port cranes
A market leaderin industrial cranes and components, as well as crane service
A stagnant first half of the year, followed by improved economic growth in the latter
10 Konecranes Annual Report 2016 Konecranes Annual Report 2016 11
BUSineSS enVironMent BUSineSS enVironMent
global container throughput growth was
weak in 2016.
Bric countries remained the weakest links.
Economic activity
in the US manufacturing sector picked up toward the
end of the year.
Konecranes global market positions
In 2016, Business Area Service continued its evolution. Profitability developed well thanks to cost containment as part of our business transfor-mation program, which is building momentum and steadily delivering on its aims. All told, the positive indicators in our core offering look set to continue.
The net decrease in our agreement base was mainly in non-core businesses, but also included the impacts of our discontinuing certain under-performing operations, changes to the scope of certain agreements, and a few large customers downsizing or closing facilities. These events were somewhat offset, however, by organic growth.
Our service business transformation process, based on our Lifecycle Care approach to main-tenance, continued its run of successful imple-mentations. This transformation entails a focus on customers who are looking for Konecranes to manage their assets, with increased efforts to develop our relationships beyond transactional business to the benefit of both parties.
Another development has been the expansion of eCommerce via STORE.Konecranes.com. Our online store is now live in a growing number of countries.
Despite adverse conditions in some of our customers’ business environments, there is still a generally strong demand for service. This may,
of course, vary across industries and regions. However, with a diversified customer base and a strong value proposition emphasizing a constant need for safety and productivity, our offering continues to resonate well.
The global perspectiveIn the US, the relatively strong dollar as well as weakness in the oil and gas sector and other commodity-based industries created some slug-gishness in demand. Industrial production trended down during the year. On the positive side, we made good progress in certain segments, such as automotive.
Similarly, Western Canada was impacted by oil and gas and other commodities. The central and eastern parts of the country benefited from its industrial base.
Mexico has been a strong market for us, espe-cially in the automotive sector. In South America, Chile and Peru demonstrated healthy sales, while in Brazil, our modest service business maintained its market position.
In Europe, we enjoyed good growth in the UK, and continued to thrive in Spain. In Germany, the implementation of our new business model was largely completed, and we are now in good shape to capture more of the sizeable existing market
Key figuresProportion of group total, % 2016 2015 change, %
Orders received, MEUR 38.9 774.5 809.5 -4.3%
Order book, MEUR 16.7 173.3 165.8 4.5%
Net sales, MEUR 44.0 968.0 992.3 -2.5%
Adjusted operating profit (EBIT), MEUR 68.3 110.9 102.9 7.8%
Adjusted operating margin (EBIT), % 11.5% 10.4%
Operating profit (EBIT), MEUR 70.4 102.2 98.9 3.4%
Operating margin (EBIT), % 10.6% 10.0%
Personnel at the end of period 55.1 5,998 6,503 -7.8%
Business Area Service works to improve the safety and produc-tivity of our customers’ operations with specialized mainte-nance services and spare parts for all varieties and brands of industrial cranes, hoists, and port equipment. We maintain installations of every scale, from the smallest piece of equip-ment to entire operations.
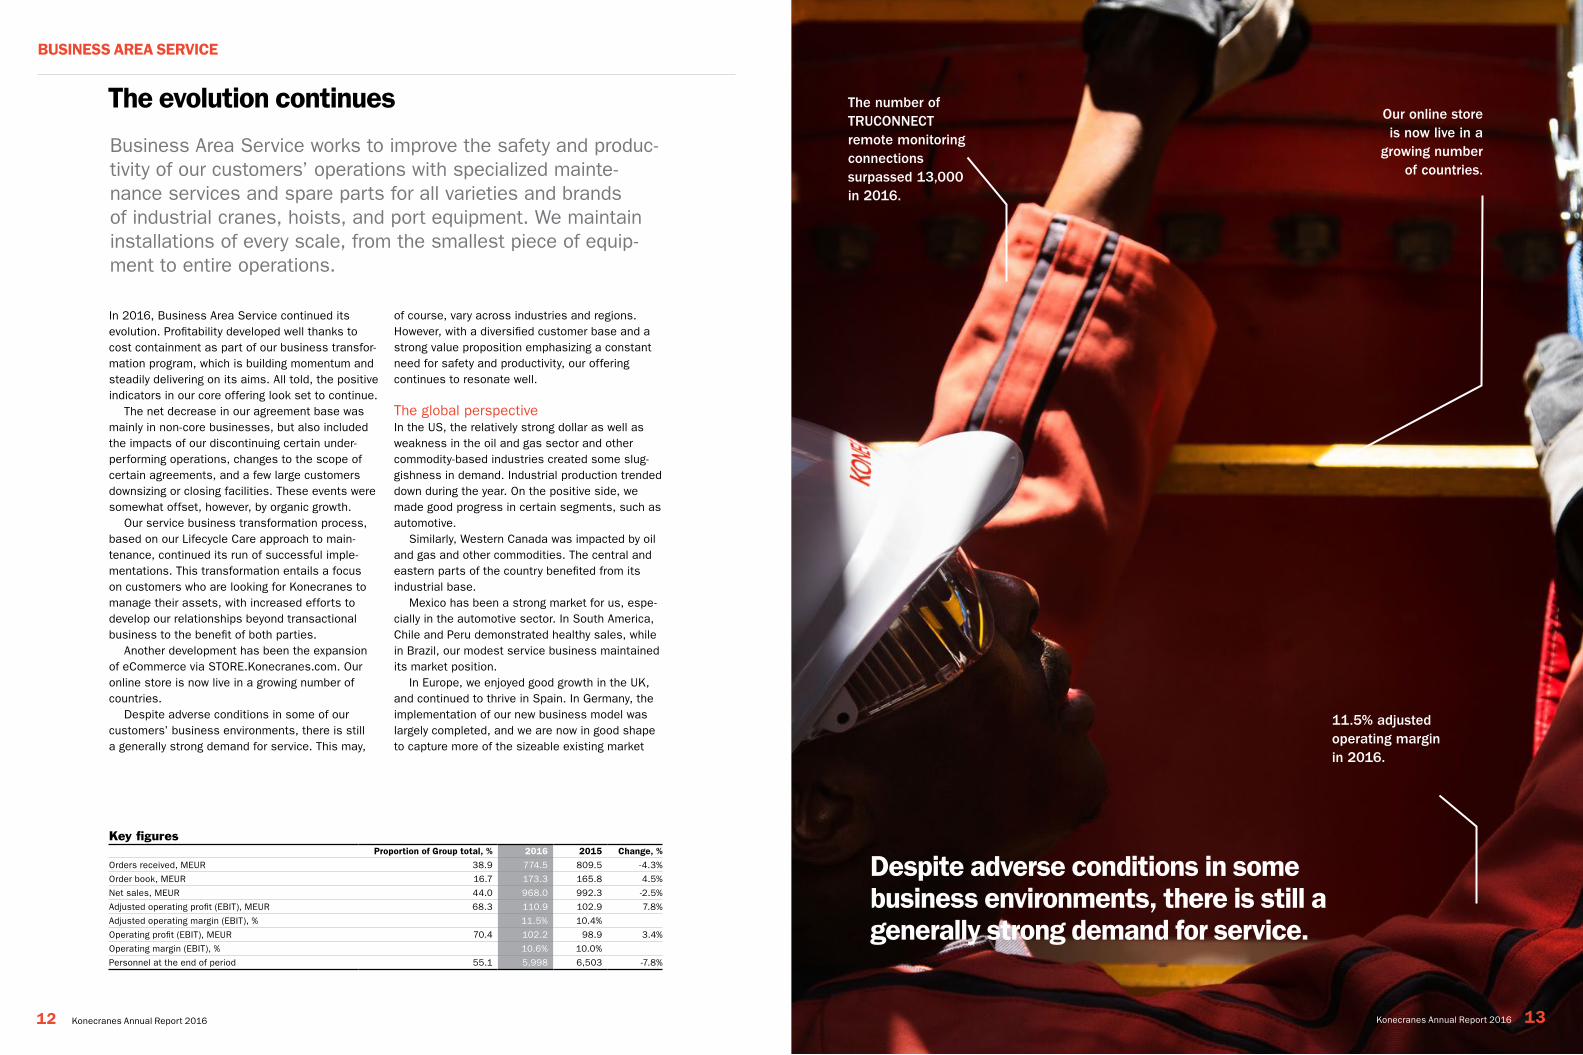
Our online store is now live in a
growing number of countries.
11.5% adjusted operating margin in 2016.
The number of TRUCONNECT remote monitoring connections surpassed 13,000 in 2016.
Despite adverse conditions in some business environments, there is still a generally strong demand for service.
the evolution continues
Konecranes Annual Report 2016 1312 Konecranes Annual Report 2016
BUSineSS AreA SerVice
for service. Despite challenges in certain Eastern European states and in Russia, these areas performed relatively well for us, as did Switzerland and Austria.
The Middle East and Africa remained troubling environments, geopolitically speaking, but once again Saudi Arabia performed well thanks to the large installed base we have built up over the years. South Africa, in turn, showed good growth. Our Morocco service business was divested.
In China, despite less than inspiring trends as a market, we have done well, and customers are increasingly receptive of the improvements in safety and productivity we offer. We continued to find stronger awareness and openness to outsourcing and increased interest in and demand for our consultation services.
Australia continues to be challenging in the commodity-based industries. However, having implemented our transformation here, we are now more able than ever to proactively serve our customers. We have seen some good growth in India, with indications of recovery in the process industries. Our modest business in Japan continues to grow, with other Asian countries remaining steady.
Lifecycle Care in Real TimeLifecycle Care, our systematic approach to main-tenance, is well established in key markets. In recent years, however, its tools and processes have been evolving, as has productization of the entire offering to facilitate delivery in all markets
with high quality and consistency. Today, we are using the Industrial Internet to deliver Lifecycle Care in Real Time. The interest in TRUCONNECT and real-time service is evidenced by the growing number of remote monitoring connections, which surpassed 13,000 in 2016.
Further confirmation is evident in the steadily increasing number of customers who see value in the insights and optimization to be gleaned through our customer portal, yourKONECRANES.com. The site’s user figures are growing exponentially, and it is now at the epicenter of our exchange of information in many of our major markets. Our customers have been incredibly pleased with the speed of delivery, validating our investment in this truly transformational platform.
In combination with our mobile-enabled techni-cians and the many crane installations equipped with TRUCONNECT remote monitoring, the portal enables usage, maintenance, and asset details to be viewed, analyzed, and shared quickly. The connected customer is in a unique position to opti-mize their operations and maintenance activities by leveraging these synergies.
By concentrating our resources on service process development, consistency of delivery, and end-to-end processes, we have made considerable advances in many markets. And with an influx of talent from the acquisition of Terex Corporation’s Material Handling & Port Solutions – as well as the vast growth opportunities to be derived from their installed base – the next phase of transformation looks just as exciting.
In 2016, the market for our equipment did not demonstrate a substantial recovery from the rather muted conditions of the previous year, although slight positive development did none-theless occur in certain geographical regions at the end of the year. Despite this, we were able to reduce our cost base, and profitability improved notably as a result.
The cost-reducing actions we had already initiated in 2015 provided the savings they were projected to early in the year. We went on to build on this progress, continuing to bolster our efficiency and agility by launching a new product-line-based organization with direct P&L responsibil-ities. While eliminating redundancy in the way we operate, this new structure also had the effect of increasing customer intimacy.
In 2016, operational costs were also reduced thanks to the closure of our industrial cranes manufacturing plants in the US (Franklin, Ohio), Brazil (near Sao Paolo), and part of our plant in India (Pune). We finalized the changes to our production operations in Shanghai, begun in 2015, which have now been completely transferred to
Jingjiang, in Jiangsu Province. We also adjusted our industrial cranes distribution model in some ASEAN countries, working with a lower cost base to address the prevailing lower demand.
Additionally, our new SAP-based ERP system was taken into use at the majority of our major component manufacturing sites. This, in conjunc-tion with other previously implemented IT system renewals, is expected to deliver further cost savings in the future.
The regional viewOver all, the market for industrial cranes and their components did not recover substantially in 2016. Companies active in emerging markets were cautious in their investments, while the UK’s Brexit decision and the US presidential elections caused further uncertainty and low oil prices dampened oil-and-gas-related businesses. Political tensions in Eastern Europe and war in the Middle East also worked against resurgence in market demand in these regions also.
Global container-handling volumes growth remained flat throughout the year. However, recent
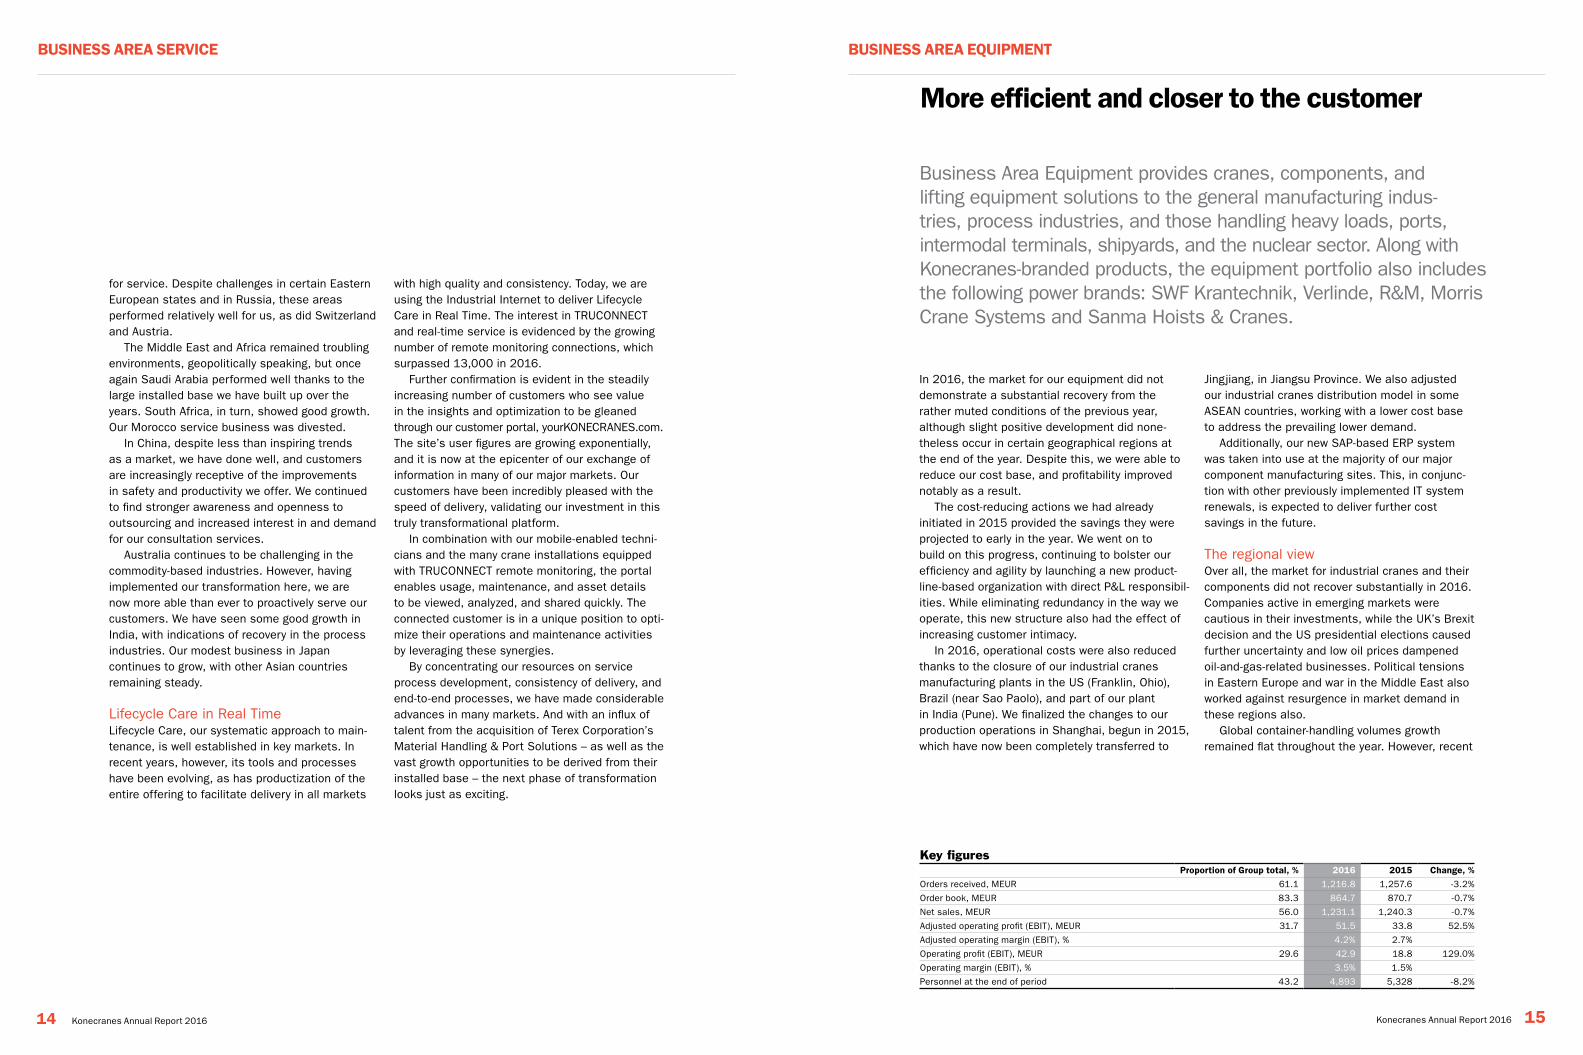
Business Area Equipment provides cranes, components, and lifting equipment solutions to the general manufacturing indus-tries, process industries, and those handling heavy loads, ports, intermodal terminals, shipyards, and the nuclear sector. Along with Konecranes-branded products, the equipment portfolio also includes the following power brands: SWF Krantechnik, Verlinde, R&M, Morris Crane Systems and Sanma Hoists & Cranes.
Key figuresProportion of group total, % 2016 2015 change, %
Orders received, MEUR 61.1 1,216.8 1,257.6 -3.2%
Order book, MEUR 83.3 864.7 870.7 -0.7%
Net sales, MEUR 56.0 1,231.1 1,240.3 -0.7%
Adjusted operating profit (EBIT), MEUR 31.7 51.5 33.8 52.5%
Adjusted operating margin (EBIT), % 4.2% 2.7%
Operating profit (EBIT), MEUR 29.6 42.9 18.8 129.0%
Operating margin (EBIT), % 3.5% 1.5%
Personnel at the end of period 43.2 4,893 5,328 -8.2%
More efficient and closer to the customer
14 Konecranes Annual Report 2016 Konecranes Annual Report 2016 15
BUSineSS AreA SerVice BUSineSS AreA eQUiPMent
trends for larger container ships and the need for productivity and safety improvements in terminals kept handling-equipment investments at a reason-able level. In 2016, we saw fewer green field proj-ects realized than in previous years.
In terms of order intake, pockets of growth still emerged, however. Europe demonstrated growth in industrial cranes in Spain, France, Germany and Hungary, despite generally low demand. In the Middle East, we lacked bigger projects, while smaller projects were still active and provided noteworthy growth. We also saw slightly increasing activity in ports, including in Europe and in some parts of the Middle East.
In China, demand for larger investment projects was low, and we tentatively anticipate that the bottom has been reached in regards to general investment activity, as there were slight indica-tions of emerging growth in demand towards the end of the year. For Konecranes, this meant opportunities particularly in waste-to-energy proj-ects, as well as some signs of minor recovery in relation to our standard offering. This may also signal a swing towards growth for the generally low prevailing demand in ASEAN countries. Invest-ments in India showed signs of recovering gradu-ally, and we were able to gain higher growth there.
In the US, we showed good growth in ports and engineered solutions, while the market for stan-dard cranes experienced a slowdown, which will hopefully recover in 2017. One particular highlight in ports was our sale of 86 Automated Stacking Cranes (ASCs) to the Virginia Port Authority (marketed as The Port of Virginia), the fifth largest port in the US. This order, worth over EUR 200 million, was in fact the largest in the history of Konecranes.
Demand in Canada remained subdued. In South America, markets were not buoyant, and expecting growth here in the near future is most probably too optimistic.
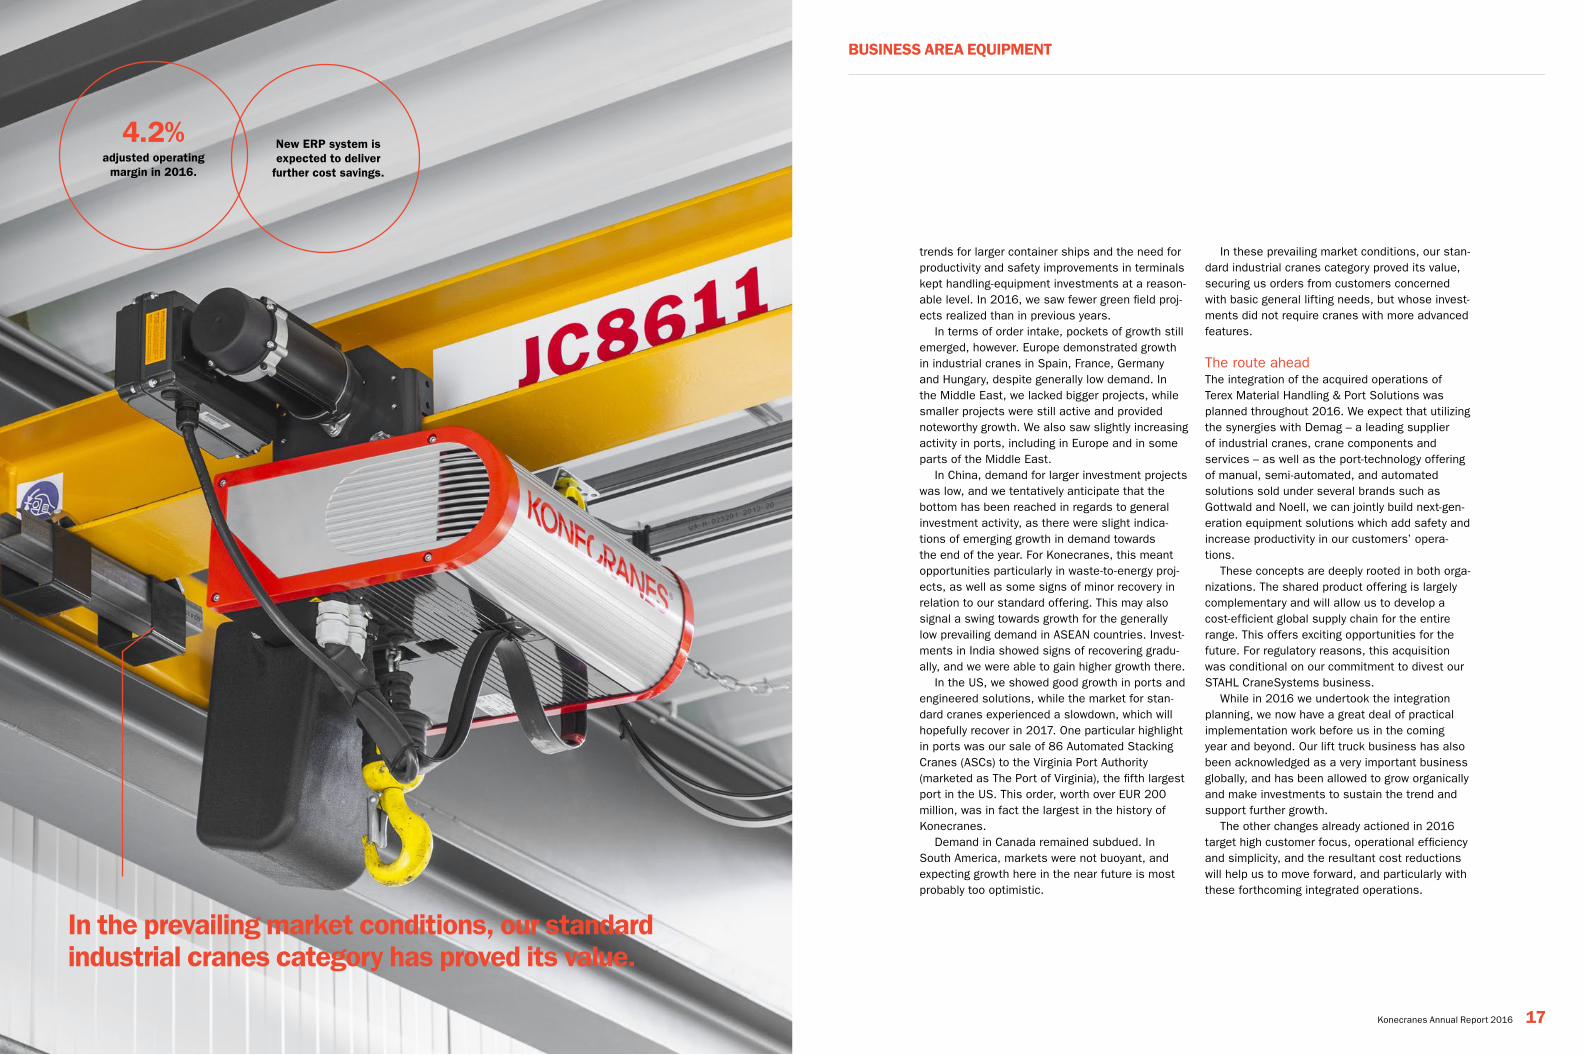
In these prevailing market conditions, our stan-dard industrial cranes category proved its value, securing us orders from customers concerned with basic general lifting needs, but whose invest-ments did not require cranes with more advanced features.
The route aheadThe integration of the acquired operations of Terex Material Handling & Port Solutions was planned throughout 2016. We expect that utilizing the synergies with Demag – a leading supplier of industrial cranes, crane components and services – as well as the port-technology offering of manual, semi-automated, and automated solutions sold under several brands such as Gottwald and Noell, we can jointly build next-gen-eration equipment solutions which add safety and increase productivity in our customers’ opera-tions.
These concepts are deeply rooted in both orga-nizations. The shared product offering is largely complementary and will allow us to develop a cost-efficient global supply chain for the entire range. This offers exciting opportunities for the future. For regulatory reasons, this acquisition was conditional on our commitment to divest our STAHL CraneSystems business.
While in 2016 we undertook the integration planning, we now have a great deal of practical implementation work before us in the coming year and beyond. Our lift truck business has also been acknowledged as a very important business globally, and has been allowed to grow organically and make investments to sustain the trend and support further growth.
The other changes already actioned in 2016 target high customer focus, operational efficiency and simplicity, and the resultant cost reductions will help us to move forward, and particularly with these forthcoming integrated operations.
XX.X%operating profit excluding restructuring costs in 2015
XX.X%higher order book compared to 2014
XX.X%increase in net sales in 2015
Konecranes Annual Report 2016 17
BUSineSS AreA eQUiPMent
16 Konecranes Annual Report 2016
in the prevailing market conditions, our standard industrial cranes category has proved its value.
4.2%adjusted operating
margin in 2016.
new erP system is expected to deliver
further cost savings.
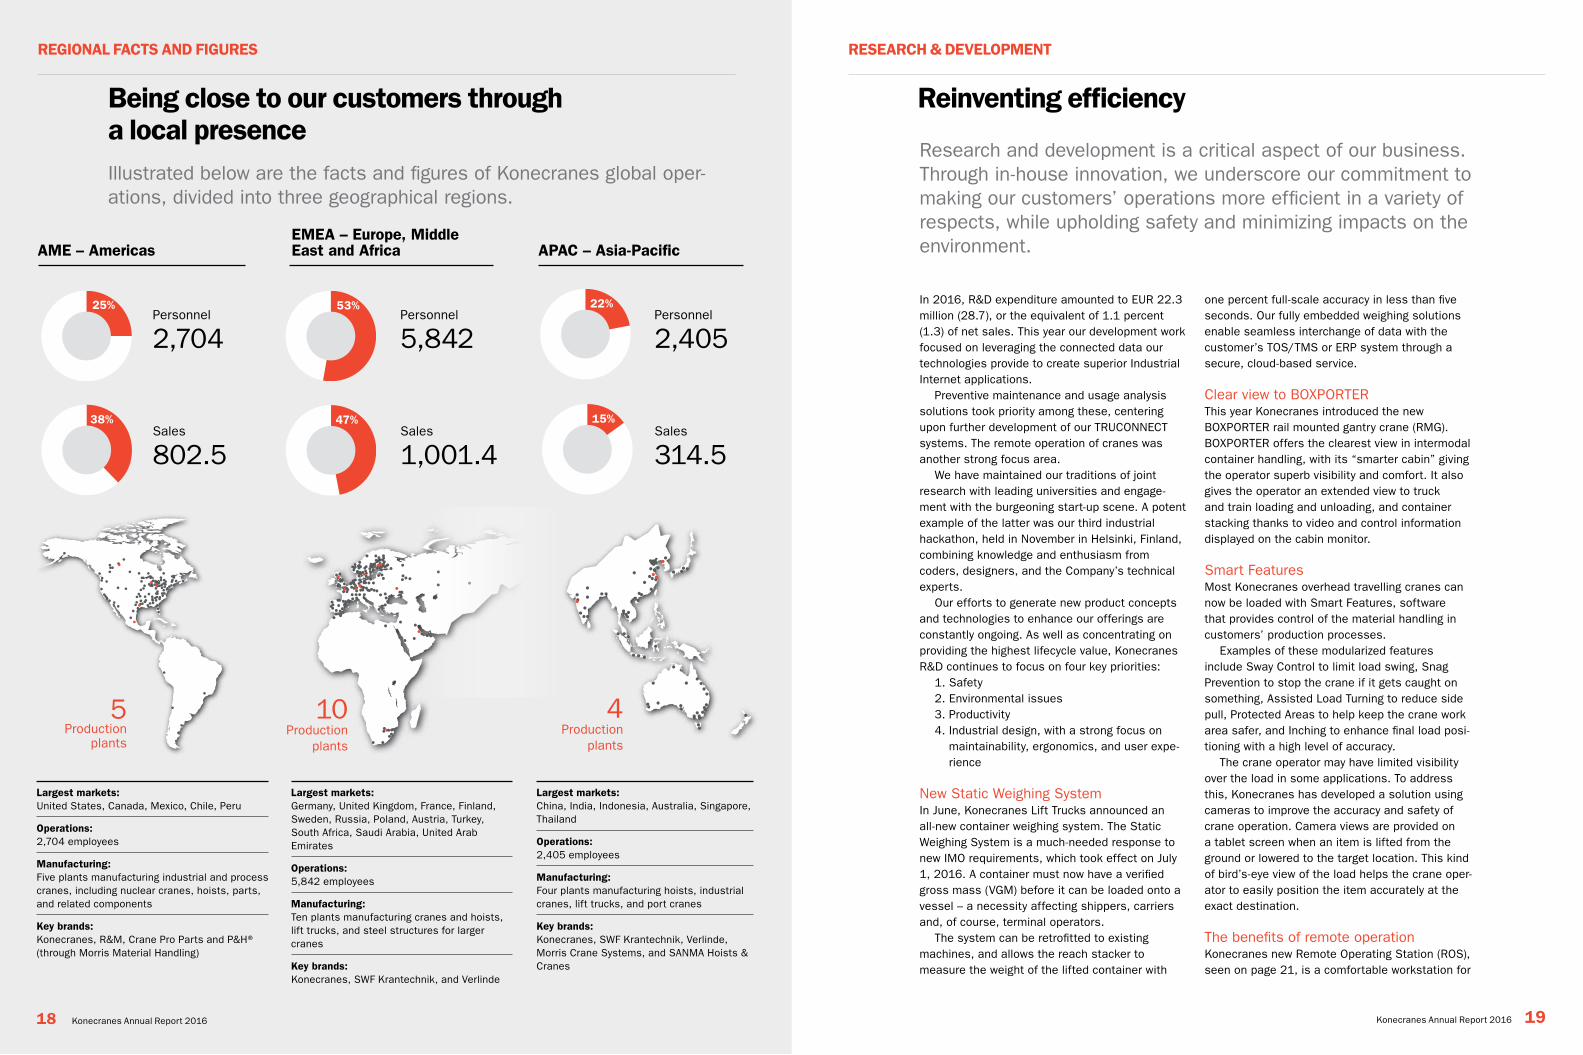
Largest markets:United States, Canada, Mexico, Chile, Peru
operations:2,704 employees
Manufacturing: Five plants manufacturing industrial and process cranes, including nuclear cranes, hoists, parts, and related components
Key brands: Konecranes, R&M, Crane Pro Parts and P&H® (through Morris Material Handling)
Largest markets:Germany, United Kingdom, France, Finland, Sweden, Russia, Poland, Austria, Turkey, South Africa, Saudi Arabia, United Arab Emirates
operations: 5,842 employees
Manufacturing:Ten plants manufacturing cranes and hoists, lift trucks, and steel structures for larger cranes
Key brands: Konecranes, SWF Krantechnik, and Verlinde
10 Production
plants
Largest markets: China, India, Indonesia, Australia, Singapore, Thailand
operations: 2,405 employees
Manufacturing: Four plants manufacturing hoists, industrial cranes, lift trucks, and port cranes
Key brands: Konecranes, SWF Krantechnik, Verlinde, Morris Crane Systems, and SANMA Hoists & Cranes
Illustrated below are the facts and figures of Konecranes global oper-ations, divided into three geographical regions.
Research and development is a critical aspect of our business. Through in-house innovation, we underscore our commitment to making our customers’ operations more efficient in a variety of respects, while upholding safety and minimizing impacts on the environment.
Being close to our customers through a local presence
In 2016, R&D expenditure amounted to EUR 22.3 million (28.7), or the equivalent of 1.1 percent (1.3) of net sales. This year our development work focused on leveraging the connected data our technologies provide to create superior Industrial Internet applications.
Preventive maintenance and usage analysis solutions took priority among these, centering upon further development of our TRUCONNECT systems. The remote operation of cranes was another strong focus area.
We have maintained our traditions of joint research with leading universities and engage-ment with the burgeoning start-up scene. A potent example of the latter was our third industrial hackathon, held in November in Helsinki, Finland, combining knowledge and enthusiasm from coders, designers, and the Company’s technical experts.
Our efforts to generate new product concepts and technologies to enhance our offerings are constantly ongoing. As well as concentrating on providing the highest lifecycle value, Konecranes R&D continues to focus on four key priorities:
1. Safety 2. Environmental issues 3. Productivity 4. Industrial design, with a strong focus on
maintainability, ergonomics, and user expe-rience
New Static Weighing System In June, Konecranes Lift Trucks announced an all-new container weighing system. The Static Weighing System is a much-needed response to new IMO requirements, which took effect on July 1, 2016. A container must now have a verified gross mass (VGM) before it can be loaded onto a vessel – a necessity affecting shippers, carriers and, of course, terminal operators.
The system can be retrofitted to existing machines, and allows the reach stacker to measure the weight of the lifted container with
one percent full-scale accuracy in less than five seconds. Our fully embedded weighing solutions enable seamless interchange of data with the customer’s TOS/TMS or ERP system through a secure, cloud-based service.
Clear view to BOXPORTERThis year Konecranes introduced the new BOXPORTER rail mounted gantry crane (RMG). BOXPORTER offers the clearest view in intermodal container handling, with its “smarter cabin” giving the operator superb visibility and comfort. It also gives the operator an extended view to truck and train loading and unloading, and container stacking thanks to video and control information displayed on the cabin monitor.
Smart FeaturesMost Konecranes overhead travelling cranes can now be loaded with Smart Features, software that provides control of the material handling in customers’ production processes.
Examples of these modularized features include Sway Control to limit load swing, Snag Prevention to stop the crane if it gets caught on something, Assisted Load Turning to reduce side pull, Protected Areas to help keep the crane work area safer, and Inching to enhance final load posi-tioning with a high level of accuracy.
The crane operator may have limited visibility over the load in some applications. To address this, Konecranes has developed a solution using cameras to improve the accuracy and safety of crane operation. Camera views are provided on a tablet screen when an item is lifted from the ground or lowered to the target location. This kind of bird’s-eye view of the load helps the crane oper-ator to easily position the item accurately at the exact destination.
The benefits of remote operationKonecranes new Remote Operating Station (ROS), seen on page 21, is a comfortable workstation for
reinventing efficiency
AMe – AmericaseMeA – europe, Middle east and Africa APAc – Asia-Pacific
Personnel
2,704Personnel
5,842Personnel
2,405
Sales
802.5Sales
1,001.4Sales
314.5
4 Production
plants
5
Production plants
38%
53%
47%
22%
15%
25%
18 Konecranes Annual Report 2016 Konecranes Annual Report 2016 19
regionAL FActS AnD FigUreS reSeArcH & DeVeLoPMent

cooperation with Aalto University supports industrial internet research and innovation.
eUr 22.3 million of r&D expenditure in 2016.
Focus on trUconnect systems and remote operation of cranes.
the operators who remotely carry out truck loading and unloading operations in semi-automated container stacks, which must be carried out manu-ally for safety reasons. In a container terminal, a number of ROSs can work in a remote control room, which takes the form of a comfortable office environment for personnel. Along with its ergo-nomic benefits, the graphical user interface (GUI) of the ROS provides highly intuitive and precise control.
A similar ROS workstation can also be used in other applications such as in waste-to-energy plants, where the solution reduces total plant investment costs. Load handling operations can now be centralized into one control room common to the whole plant, rather than having an addi-tional such room close to the cranes.
Lifting educationKonecranes and Aalto University have agreed on cooperation within the area of Industrial Internet. As part of this arrangement, in autumn 2016 we installed a smart CXT NEO-based crane on the Aalto University Industrial Internet Campus (AIIC) in Otaniemi, Finland.
The crane was equipped with TRUCONNECT Remote Monitoring technology and the smart features mentioned above, enabling large Indus-trial Internet ecosystem integration and further full-scale research and innovation work.
Konecranes Annual Report 2016 21
reSeArcH & DeVeLoPMent
20 Konecranes Annual Report 2016
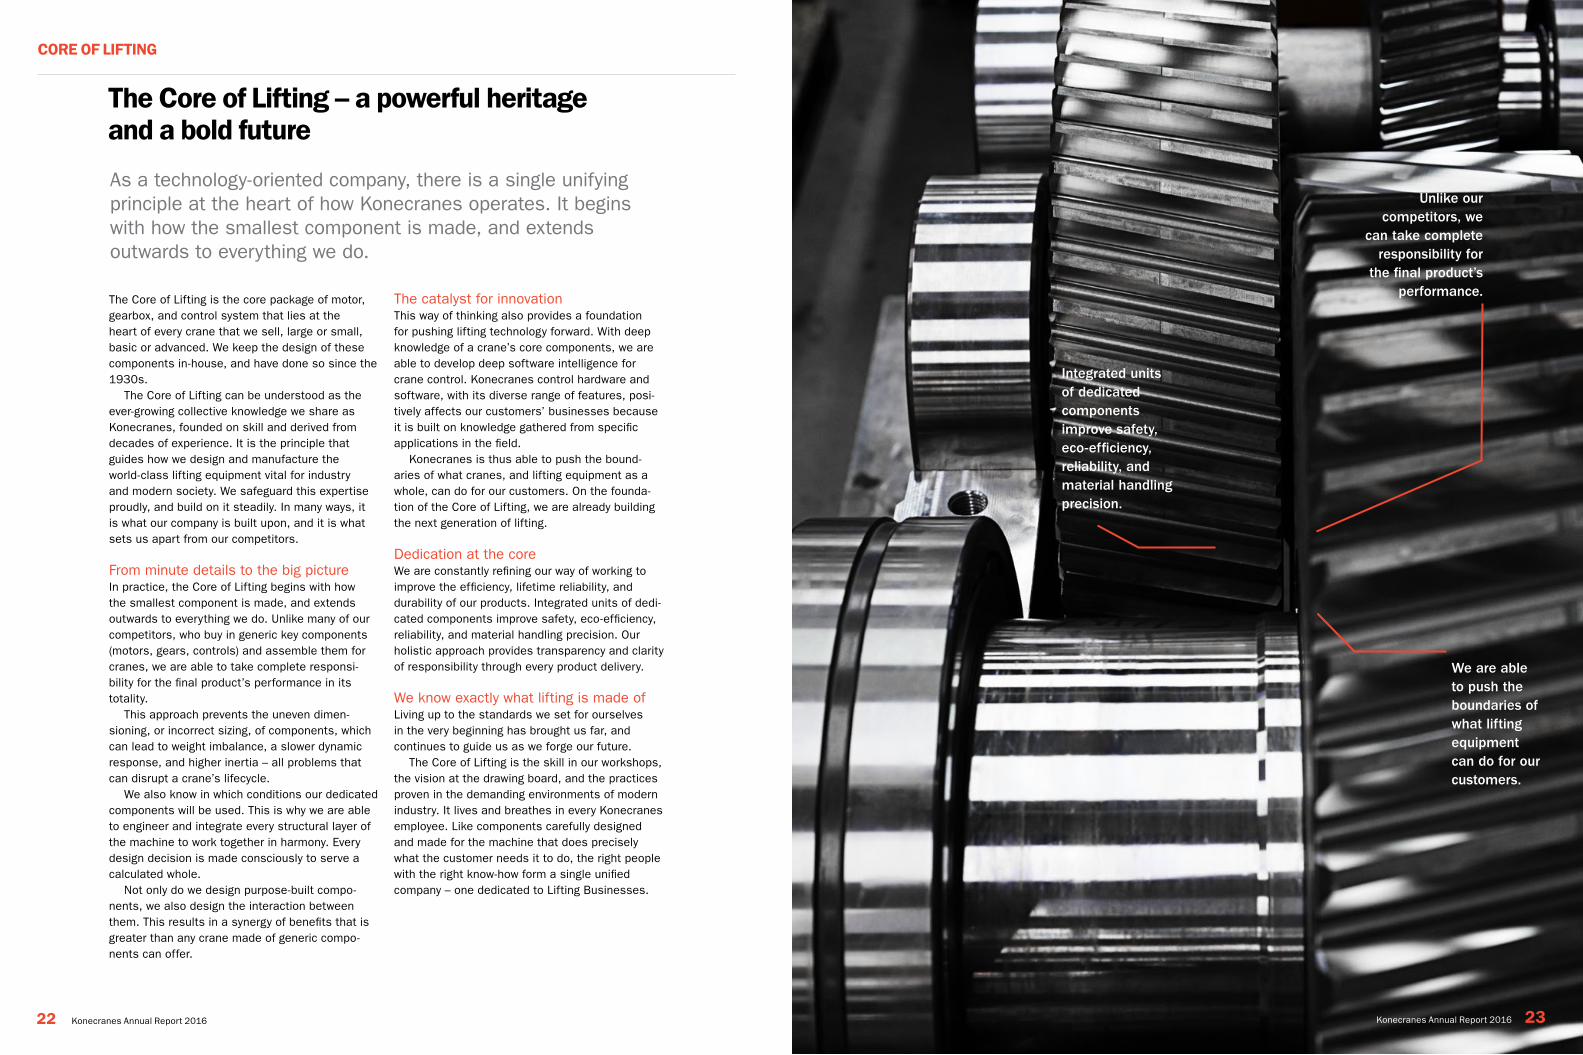
The Core of Lifting is the core package of motor, gearbox, and control system that lies at the heart of every crane that we sell, large or small, basic or advanced. We keep the design of these components in-house, and have done so since the 1930s.
The Core of Lifting can be understood as the ever-growing collective knowledge we share as Konecranes, founded on skill and derived from decades of experience. It is the principle that guides how we design and manufacture the world-class lifting equipment vital for industry and modern society. We safeguard this expertise proudly, and build on it steadily. In many ways, it is what our company is built upon, and it is what sets us apart from our competitors.
From minute details to the big pictureIn practice, the Core of Lifting begins with how the smallest component is made, and extends outwards to everything we do. Unlike many of our competitors, who buy in generic key components (motors, gears, controls) and assemble them for cranes, we are able to take complete responsi-bility for the final product’s performance in its totality.
This approach prevents the uneven dimen-sioning, or incorrect sizing, of components, which can lead to weight imbalance, a slower dynamic response, and higher inertia – all problems that can disrupt a crane’s lifecycle.
We also know in which conditions our dedicated components will be used. This is why we are able to engineer and integrate every structural layer of the machine to work together in harmony. Every design decision is made consciously to serve a calculated whole.
Not only do we design purpose-built compo-nents, we also design the interaction between them. This results in a synergy of benefits that is greater than any crane made of generic compo-nents can offer.
The catalyst for innovationThis way of thinking also provides a foundation for pushing lifting technology forward. With deep knowledge of a crane’s core components, we are able to develop deep software intelligence for crane control. Konecranes control hardware and software, with its diverse range of features, posi-tively affects our customers’ businesses because it is built on knowledge gathered from specific applications in the field.
Konecranes is thus able to push the bound-aries of what cranes, and lifting equipment as a whole, can do for our customers. On the founda-tion of the Core of Lifting, we are already building the next generation of lifting.
Dedication at the coreWe are constantly refining our way of working to improve the efficiency, lifetime reliability, and durability of our products. Integrated units of dedi-cated components improve safety, eco-efficiency, reliability, and material handling precision. Our holistic approach provides transparency and clarity of responsibility through every product delivery.
We know exactly what lifting is made ofLiving up to the standards we set for ourselves in the very beginning has brought us far, and continues to guide us as we forge our future.
The Core of Lifting is the skill in our workshops, the vision at the drawing board, and the practices proven in the demanding environments of modern industry. It lives and breathes in every Konecranes employee. Like components carefully designed and made for the machine that does precisely what the customer needs it to do, the right people with the right know-how form a single unified company – one dedicated to Lifting Businesses.
As a technology-oriented company, there is a single unifying principle at the heart of how Konecranes operates. It begins with how the smallest component is made, and extends outwards to everything we do.
the core of Lifting – a powerful heritage and a bold future
Unlike our competitors, we
can take complete responsibility for
the final product’s performance.
We are able to push the boundaries of what lifting equipment can do for our customers.
Integrated units of dedicated components improve safety, eco-efficiency, reliability, and material handling precision.
Konecranes Annual Report 2016 2322 Konecranes Annual Report 2016
core oF LiFting
An extensive portfolio of expert solutions
Process cranes Konecranes produces a wide range of pre-engineered and tailored cranes for almost any industrial lifting need. Combining the latest in lifting technology with over 80 years of crane-building knowledge and experience, our cranes are designed to be reliable, safe and more eco-efficient. Our standard industrial cranes can lift up to 500 tons, and a tailored crane even more. Our recent innovations include several features and details designed to assist operators, to minimize load damages, and lower running costs in addition to energy consumption. TRUCONNECT Remote Service offers real-time monitoring of the crane, allowing better planning, preventive maintenance and technical support, helping to extend the lifetime of the crane.
Industrial overhead cranes
The Konecranes CLX chain hoist cranes and CXT wire rope hoist cranes are ideal for lifting up to 80 tons in most industrial settings. Both cranes can be bought as stan-dard packages or tailored to your specific needs. Simple to use, with a self- adjusting magnetic brake and maintenance-free gearbox, the CLX crane is espe-cially suited for lighter loads up to five tons. The CXT crane can be equipped with several high-tech Smart Features, including Sway Control, Target Positioning, and Protected Areas, making the load control easier and safer for operators, in addition to improving productivity with shorter cycle times. Customers can also have the CXT crane specially adapted for various hazardous environments. TRUCONNECT Remote Service provides real-time visibility to crane usage and operating data, helping deter-mine maintenance investments and productivity, as well as collecting information on safety-related issues, such as emergency stops and overloads.
Forklift trucks With lifting capacities ranging from 10 to 65 tons, our forklift trucks are used in various applications and heavy-duty work in the steel, pulp and paper, and oil and gas industries, as well as at ports. Our lift trucks have an ergonomic and spacious OPTIMA cabin, which provides increased safety and visibility for the driver. Equipped with the latest engines, these lift trucks are both eco-efficient and more powerful. With TRUCONNECT remote monitoring, one will not only be able to track the efficiency of the lift truck fleet, but also plan the maintenance.
Container lift trucks Our container lift trucks handle empty (8–10 ton) and laden (30–45 ton) containers at ports and intermodal terminals. Our lift trucks have an ergonomic and spacious OPTIMA cabin, which provides increased safety and visibility for the driver. Equipped with the latest engines, these lift trucks are both eco-efficient and more powerful. With TRUCONNECT remote monitoring, one will not only be able to track the efficiency of the lift truck fleet, but also plan the maintenance.
Reach stackers With lifting capacities ranging from 10 to 80 tons, our reach stackers are used in container handling, as well as in intermodal and industrial applications. Our lift trucks have an ergonomic and spacious OPTIMA cabin, which provides increased safety and visibility for the driver. Equipped with the latest engines, these lift trucks are both eco-efficient and more powerful. With TRUCONNECT remote monitoring, one will not only be able to track the efficiency of the lift truck fleet, but also plan the maintenance.
Goliath gantry cranes
Used for heavy-duty assembly lifts, our Goliath gantry cranes can be found at ship-yards, offshore facilities, and other heavy industrial sites. Loads weighing thousands of tons can be moved hundreds of meters horizontally, over a hundred meters verti-cally, and positioned to assembly tolerances of just a few millimeters.
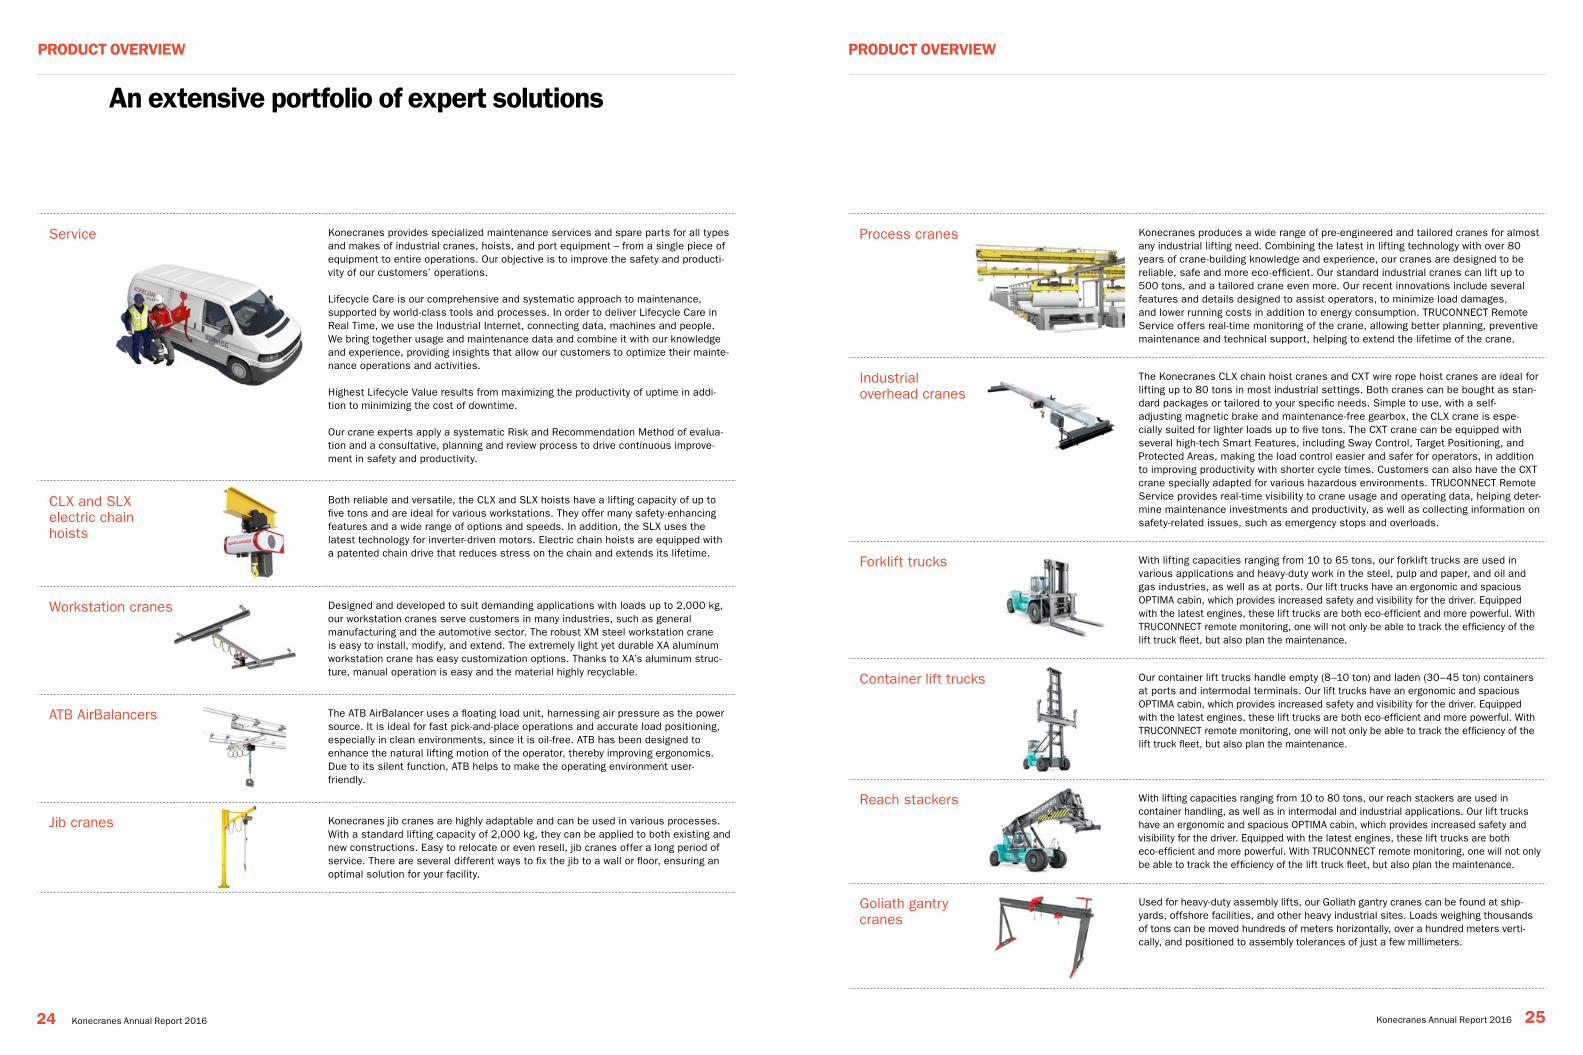
Service Konecranes provides specialized maintenance services and spare parts for all types and makes of industrial cranes, hoists, and port equipment – from a single piece of equipment to entire operations. Our objective is to improve the safety and producti-vity of our customers’ operations.
Lifecycle Care is our comprehensive and systematic approach to maintenance, supported by world-class tools and processes. In order to deliver Lifecycle Care in Real Time, we use the Industrial Internet, connecting data, machines and people. We bring together usage and maintenance data and combine it with our knowledge and experience, providing insights that allow our customers to optimize their mainte-nance operations and activities.
Highest Lifecycle Value results from maximizing the productivity of uptime in addi-tion to minimizing the cost of downtime.
Our crane experts apply a systematic Risk and Recommendation Method of evalua-tion and a consultative, planning and review process to drive continuous improve-ment in safety and productivity.
CLX and SLX electric chain hoists
Both reliable and versatile, the CLX and SLX hoists have a lifting capacity of up to five tons and are ideal for various workstations. They offer many safety-enhancing features and a wide range of options and speeds. In addition, the SLX uses the latest technology for inverter-driven motors. Electric chain hoists are equipped with a patented chain drive that reduces stress on the chain and extends its lifetime.
Workstation cranes Designed and developed to suit demanding applications with loads up to 2,000 kg, our workstation cranes serve customers in many industries, such as general manufacturing and the automotive sector. The robust XM steel workstation crane is easy to install, modify, and extend. The extremely light yet durable XA aluminum workstation crane has easy customization options. Thanks to XA’s aluminum struc-ture, manual operation is easy and the material highly recyclable.
ATB AirBalancers The ATB AirBalancer uses a floating load unit, harnessing air pressure as the power source. It is ideal for fast pick-and-place operations and accurate load positioning, especially in clean environments, since it is oil-free. ATB has been designed to enhance the natural lifting motion of the operator, thereby improving ergonomics. Due to its silent function, ATB helps to make the operating environment user-friendly.
Jib cranes Konecranes jib cranes are highly adaptable and can be used in various processes. With a standard lifting capacity of 2,000 kg, they can be applied to both existing and new constructions. Easy to relocate or even resell, jib cranes offer a long period of service. There are several different ways to fix the jib to a wall or floor, ensuring an optimal solution for your facility.
24 Konecranes Annual Report 2016 Konecranes Annual Report 2016 25
ProDUct oVerVieW ProDUct oVerVieW
Yard cranes Our yard cranes for container terminals include RTGs, RMGs, automated RMGs (ARMGs), and automated RTGs (ARTGs). These cranes usually have a lifting capacity of around 50 tons and can stack one over six containers high, and seven container rows wide plus truck lane at container ports and intermodal terminals. Our RTGs can be diesel-powered, in which case we offer Diesel Fuel Saver technology to increase their eco-efficiency. We also offer cable reel and busbar systems for fully electric operation, increasing eco-efficiency and decreasing emissions. Our yard cranes are available with TRUCONNECT remote service, which provides information on how the cranes are being used in real-time, allowing customers to optimize the timing of maintenance and reduce crane downtime.
Automated stacking crane systems
Konecranes offers Automated Rail Mounted Gantry (ARMG) and Automated Rubber Tired Gantry (ARTG) crane systems. Introduced in 2013, the Konecranes ARTG system offers RTG-based container terminals a growth path towards fully automated operation. It includes ARTG cranes, Remote Operating Stations (ROSs), automation software, and all the required yard infrastructure, including intelligent gates for road trucks.
BOXPORTER RMG The Konecranes BOXPORTER RMG (rail mounted gantry crane) offers the clearest view in intermodal container handling. It incorporates a host of technological inno-vations, most notably the smarter cabin with video and monitoring technology, that provides superb visibility to container handling operations.
Ship-to-shore (STS) cranes
Used for loading and unloading containers from ships, Konecranes STS cranes have a lifting capacity of up to 65 tons and an outreach of up to 70 meters. We can deliver our STS cranes with advanced noise reduction technology and camouflage paint schemes, making the cranes very silent and inconspicuous in container termi-nals close to urban areas.
Nuclear cranes Konecranes Nuclear Equipment and Services provides nuclear cranes and specia-lized lifting equipment for our customers throughout the global nuclear industry. The nuclear quality control system meets the strict regulatory requirements of our global customers and their individual specification requirements, such as NRC 10CFR50 Appendix B, ASME NQA-1, and KTA 1401.
Brands The Group’s brand strategy is centered upon the corporate Konecranes master brand, which is complemented by a portfolio of freestanding power brands. Konecranes-branded products are sold directly to end-users, while power-branded products are sold to distributors and independent crane builders. Konecranes’ power brands include R&M, SWF Krantechnik, Verlinde, Morris Crane Systems, and Sanma Hoists & Cranes.
Corporate responsibility at KonecranesCorporate responsibility work at Konecranes is focused on four areas: People, Safety, Environ-ment and Integrity. The People area is operation-ally driven by human resources. The Safety and Environment focus areas are driven by the safety and environmental management team and func-tion, with strong links to product management and product development. The Integrity focus area is a collaborative effort by multiple operational func-tions within Konecranes, such as Legal, Corpo-rate Responsibility, Finance, Investor relations, Sourcing, and Marketing and Communication.
In 2016 we continued our systematic work on corporate responsibility, focusing on the mate-rial topics that we revisited and revalidated from the previous year via stakeholder dialogue and business workshops. Our key stakeholders are our customers, employees, and shareholders. In addition to these, we have identified other rele-vant stakeholder groups, which are increasingly important for Konecranes. These include our suppliers, sub-contractors, and business part-ners; society, local communities, and authorities; students, universities, and research institutes; media; and non-governmental organizations.
At Konecranes, corporate responsibility is integrated into our business processes and oper-ations on multiple fronts. The Group Executive Board has overall accountability for corporate responsibility. In addition, the Corporate Responsi-bility Steering Group provides an efficient discus-sion forum for reviewing the progress and direction of this work. The Corporate Responsibility Director at group headquarters leads the topic, coordinates the work in practice, and reports about the activi-ties to the Group Executive Board.
Konecranes holds positions on the boards of the European Materials Handling Federation (FEM), Port Equipment Manufacturers Associa-tion (PEMA), East Office of Finnish Industries Ltd, The Federation of Finnish Technology Industries, and Finnish Metals and Engineering Competence
The remarkable events of 2016 continued to push businesses to seek opportunities offered by a responsible approach, the Paris Climate Agreement being one of the year’s highlights. At Konecranes, we continued our systematic work on corporate responsibility, with a strong focus on our Lifting People strategy, proactive safety manage-ment, efficiency improvements, and transparent communication.
Cluster (FIMECC). In addition, Konecranes partici-pates in committees of the European Committee for Standardization (CEN).
Communicating on progressOur approach towards corporate responsibility reporting is to embed it into our business reporting, i.e. this Annual Report. The reporting scope is business that we have operational control over, and reporting is aligned with the financial year’s reporting (i.e. calendar year). The previous report was Konecranes Annual Report 2015, which was published in March 2016.
Our reporting aims to provide interested parties with information on our progress, material indi-cators and some additional indicators, which are deemed interesting to a wider audience, while not necessarily considered material in our industry. We use Global Reporting Initiative (GRI) G4 as a framework and as guidance for our reporting. The report contains Standard Disclosures from the GRI Sustainability Reporting Guidelines, but has not fulfilled all the requirements of either ‘in accor-dance’ option (Core or Comprehensive).
Corporate responsibility reporting at Konecranes covers our major supply chain units and opera-tions, using data that has been gathered through internal information systems, and supplemented with information sourced separately. Some of the data included has been scaled up to provide an
Making responsible business a habit and tradition
Board
GXB
People Safety Environment Integrity
Corporate Responsibility Steering Group /Director Corporate Responsibility
CEO
26 Konecranes Annual Report 2016 Konecranes Annual Report 2016 27
ProDUct oVerVieW corPorAte reSPonSiBiLitY
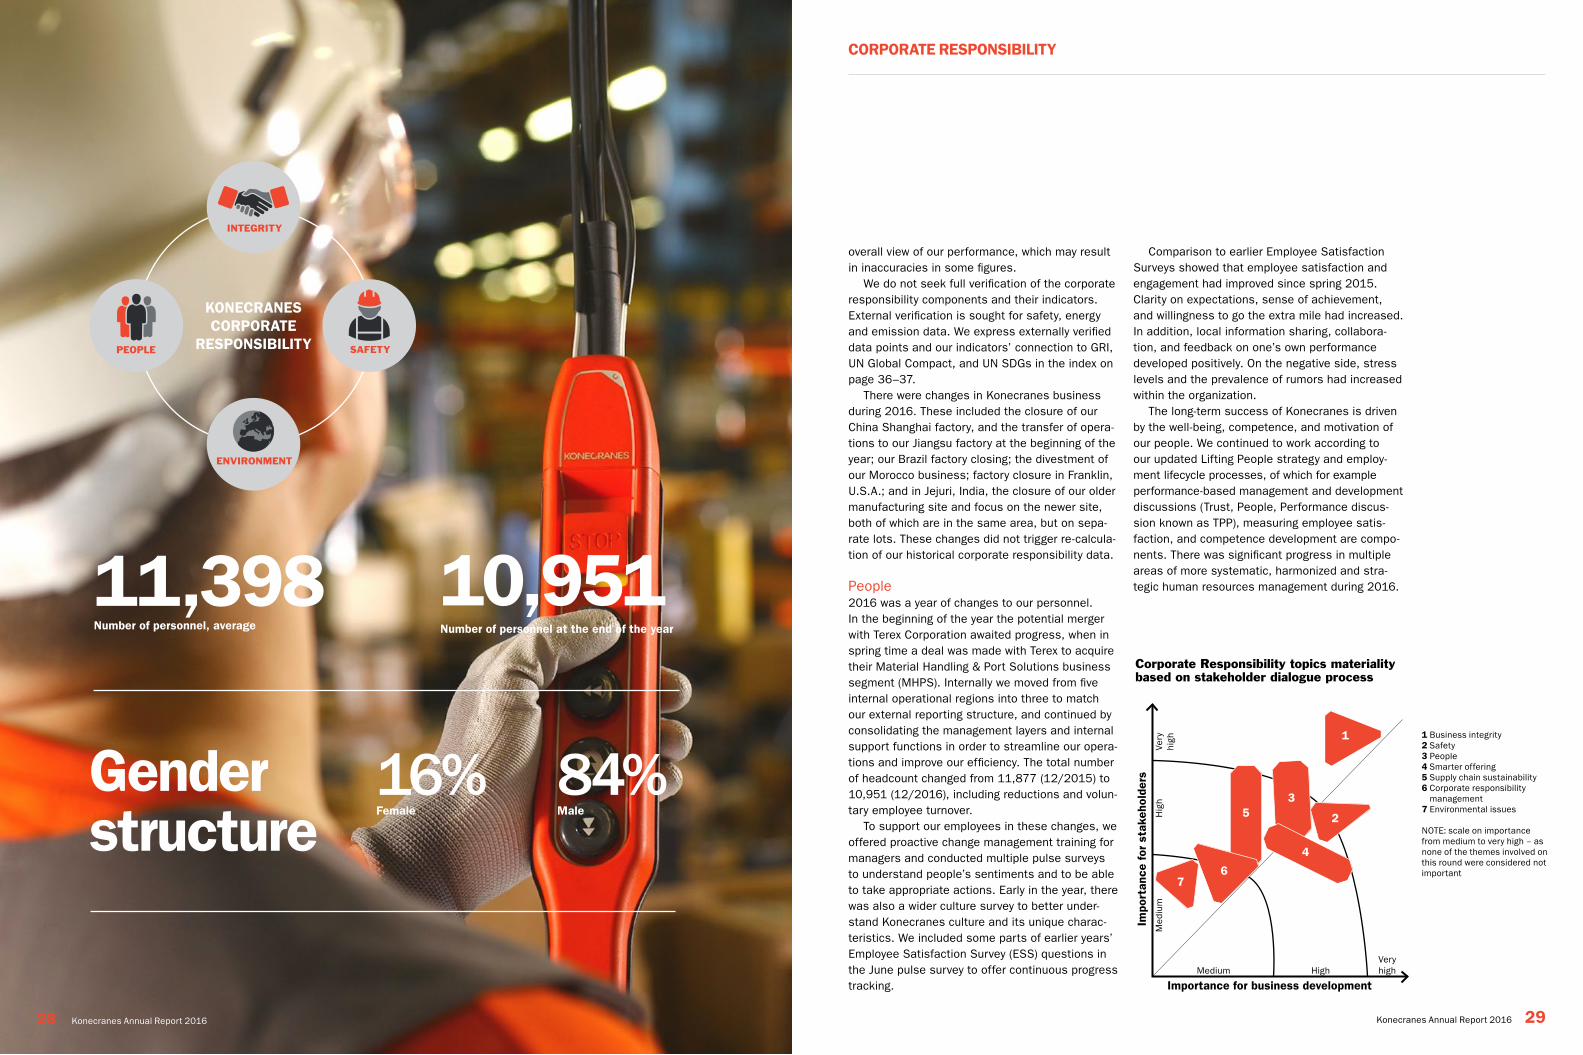
10,951number of personnel at the end of the year
11,398number of personnel, average
16%Female
84%Male
gender structure
KonecrAneS corPorAte
reSPonSiBiLitY
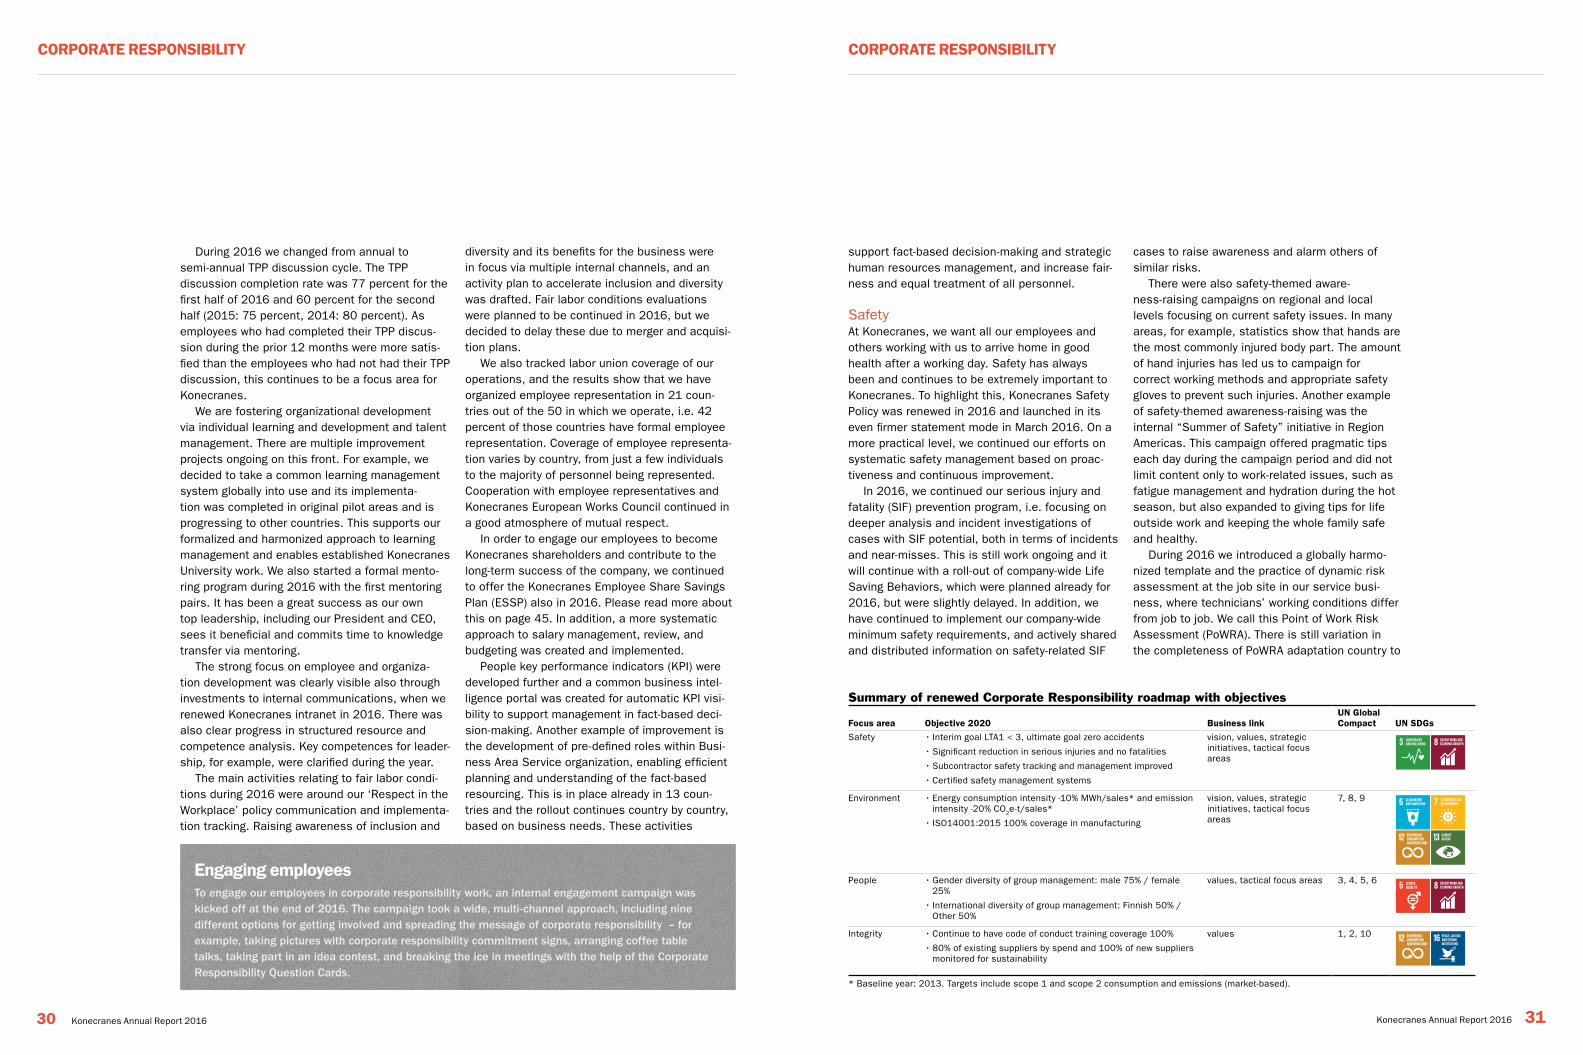
Corporate Responsibility topics materiality based on stakeholder dialogue process
overall view of our performance, which may result in inaccuracies in some figures.
We do not seek full verification of the corporate responsibility components and their indicators. External verification is sought for safety, energy and emission data. We express externally verified data points and our indicators’ connection to GRI, UN Global Compact, and UN SDGs in the index on page 36–37.
There were changes in Konecranes business during 2016. These included the closure of our China Shanghai factory, and the transfer of opera-tions to our Jiangsu factory at the beginning of the year; our Brazil factory closing; the divestment of our Morocco business; factory closure in Franklin, U.S.A.; and in Jejuri, India, the closure of our older manufacturing site and focus on the newer site, both of which are in the same area, but on sepa-rate lots. These changes did not trigger re-calcula-tion of our historical corporate responsibility data.
People2016 was a year of changes to our personnel. In the beginning of the year the potential merger with Terex Corporation awaited progress, when in spring time a deal was made with Terex to acquire their Material Handling & Port Solutions business segment (MHPS). Internally we moved from five internal operational regions into three to match our external reporting structure, and continued by consolidating the management layers and internal support functions in order to streamline our opera-tions and improve our efficiency. The total number of headcount changed from 11,877 (12/2015) to 10,951 (12/2016), including reductions and volun-tary employee turnover.
To support our employees in these changes, we offered proactive change management training for managers and conducted multiple pulse surveys to understand people’s sentiments and to be able to take appropriate actions. Early in the year, there was also a wider culture survey to better under-stand Konecranes culture and its unique charac-teristics. We included some parts of earlier years’ Employee Satisfaction Survey (ESS) questions in the June pulse survey to offer continuous progress tracking.
Comparison to earlier Employee Satisfaction Surveys showed that employee satisfaction and engagement had improved since spring 2015. Clarity on expectations, sense of achievement, and willingness to go the extra mile had increased. In addition, local information sharing, collabora-tion, and feedback on one’s own performance developed positively. On the negative side, stress levels and the prevalence of rumors had increased within the organization.
The long-term success of Konecranes is driven by the well-being, competence, and motivation of our people. We continued to work according to our updated Lifting People strategy and employ-ment lifecycle processes, of which for example performance-based management and development discussions (Trust, People, Performance discus-sion known as TPP), measuring employee satis-faction, and competence development are compo-nents. There was significant progress in multiple areas of more systematic, harmonized and stra-tegic human resources management during 2016.
1
2
3
4
67
5
1 Business integrity2 Safety3 People4 Smarter offering5 Supply chain sustainability6 Corporate responsibility
management7 Environmental issues
NOTE: scale on importance from medium to very high – as none of the themes involved on this round were considered not important
Impo
rtan
ce f
or s
take
hold
ers
Importance for business developmentMedium
Med
ium
High
Hig
h
Very high
Very
hi
gh
INTEGRITY
SAFETYPEOPLE
ENVIRONMENT
Konecranes Annual Report 2016 29
corPorAte reSPonSiBiLitY
28 Konecranes Annual Report 2016
During 2016 we changed from annual to semi-annual TPP discussion cycle. The TPP discussion completion rate was 77 percent for the first half of 2016 and 60 percent for the second half (2015: 75 percent, 2014: 80 percent). As employees who had completed their TPP discus-sion during the prior 12 months were more satis-fied than the employees who had not had their TPP discussion, this continues to be a focus area for Konecranes.
We are fostering organizational development via individual learning and development and talent management. There are multiple improvement projects ongoing on this front. For example, we decided to take a common learning management system globally into use and its implementa-tion was completed in original pilot areas and is progressing to other countries. This supports our formalized and harmonized approach to learning management and enables established Konecranes University work. We also started a formal mento-ring program during 2016 with the first mentoring pairs. It has been a great success as our own top leadership, including our President and CEO, sees it beneficial and commits time to knowledge transfer via mentoring.
The strong focus on employee and organiza-tion development was clearly visible also through investments to internal communications, when we renewed Konecranes intranet in 2016. There was also clear progress in structured resource and competence analysis. Key competences for leader-ship, for example, were clarified during the year.
The main activities relating to fair labor condi-tions during 2016 were around our ‘Respect in the Workplace’ policy communication and implementa-tion tracking. Raising awareness of inclusion and
Summary of renewed Corporate Responsibility roadmap with objectives
Focus area objective 2020 Business link Un global compact Un SDgs
Safety • Interim goal LTA1 < 3, ultimate goal zero accidents
• Significant reduction in serious injuries and no fatalities
• Subcontractor safety tracking and management improved
• Certified safety management systems
vision, values, strategic initiatives, tactical focus areas
Environment • Energy consumption intensity -10% MWh/sales* and emission intensity -20% CO2e-t/sales*
• ISO14001:2015 100% coverage in manufacturing
vision, values, strategic initiatives, tactical focus areas
7, 8, 9
People • Gender diversity of group management: male 75% / female 25%
• International diversity of group management: Finnish 50% / Other 50%
values, tactical focus areas 3, 4, 5, 6
Integrity • Continue to have code of conduct training coverage 100%
• 80% of existing suppliers by spend and 100% of new suppliers monitored for sustainability
values 1, 2, 10
* Baseline year: 2013. Targets include scope 1 and scope 2 consumption and emissions (market-based).
support fact-based decision-making and strategic human resources management, and increase fair-ness and equal treatment of all personnel.
SafetyAt Konecranes, we want all our employees and others working with us to arrive home in good health after a working day. Safety has always been and continues to be extremely important to Konecranes. To highlight this, Konecranes Safety Policy was renewed in 2016 and launched in its even firmer statement mode in March 2016. On a more practical level, we continued our efforts on systematic safety management based on proac-tiveness and continuous improvement.
In 2016, we continued our serious injury and fatality (SIF) prevention program, i.e. focusing on deeper analysis and incident investigations of cases with SIF potential, both in terms of incidents and near-misses. This is still work ongoing and it will continue with a roll-out of company-wide Life Saving Behaviors, which were planned already for 2016, but were slightly delayed. In addition, we have continued to implement our company-wide minimum safety requirements, and actively shared and distributed information on safety-related SIF
cases to raise awareness and alarm others of similar risks.
There were also safety-themed aware-ness-raising campaigns on regional and local levels focusing on current safety issues. In many areas, for example, statistics show that hands are the most commonly injured body part. The amount of hand injuries has led us to campaign for correct working methods and appropriate safety gloves to prevent such injuries. Another example of safety-themed awareness-raising was the internal “Summer of Safety” initiative in Region Americas. This campaign offered pragmatic tips each day during the campaign period and did not limit content only to work-related issues, such as fatigue management and hydration during the hot season, but also expanded to giving tips for life outside work and keeping the whole family safe and healthy.
During 2016 we introduced a globally harmo-nized template and the practice of dynamic risk assessment at the job site in our service busi-ness, where technicians’ working conditions differ from job to job. We call this Point of Work Risk Assessment (PoWRA). There is still variation in the completeness of PoWRA adaptation country to
diversity and its benefits for the business were in focus via multiple internal channels, and an activity plan to accelerate inclusion and diversity was drafted. Fair labor conditions evaluations were planned to be continued in 2016, but we decided to delay these due to merger and acquisi-tion plans.
We also tracked labor union coverage of our operations, and the results show that we have organized employee representation in 21 coun-tries out of the 50 in which we operate, i.e. 42 percent of those countries have formal employee representation. Coverage of employee representa-tion varies by country, from just a few individuals to the majority of personnel being represented. Cooperation with employee representatives and Konecranes European Works Council continued in a good atmosphere of mutual respect.
In order to engage our employees to become Konecranes shareholders and contribute to the long-term success of the company, we continued to offer the Konecranes Employee Share Savings Plan (ESSP) also in 2016. Please read more about this on page 45. In addition, a more systematic approach to salary management, review, and budgeting was created and implemented.
People key performance indicators (KPI) were developed further and a common business intel-ligence portal was created for automatic KPI visi-bility to support management in fact-based deci-sion-making. Another example of improvement is the development of pre-defined roles within Busi-ness Area Service organization, enabling efficient planning and understanding of the fact-based resourcing. This is in place already in 13 coun-tries and the rollout continues country by country, based on business needs. These activities
engaging employeesTo engage our employees in corporate responsibility work, an internal engagement campaign was kicked off at the end of 2016. The campaign took a wide, multi-channel approach, including nine different options for getting involved and spreading the message of corporate responsibility – for example, taking pictures with corporate responsibility commitment signs, arranging coffee table talks, taking part in an idea contest, and breaking the ice in meetings with the help of the Corporate Responsibility Question Cards.
30 Konecranes Annual Report 2016 Konecranes Annual Report 2016 31
corPorAte reSPonSiBiLitY corPorAte reSPonSiBiLitY
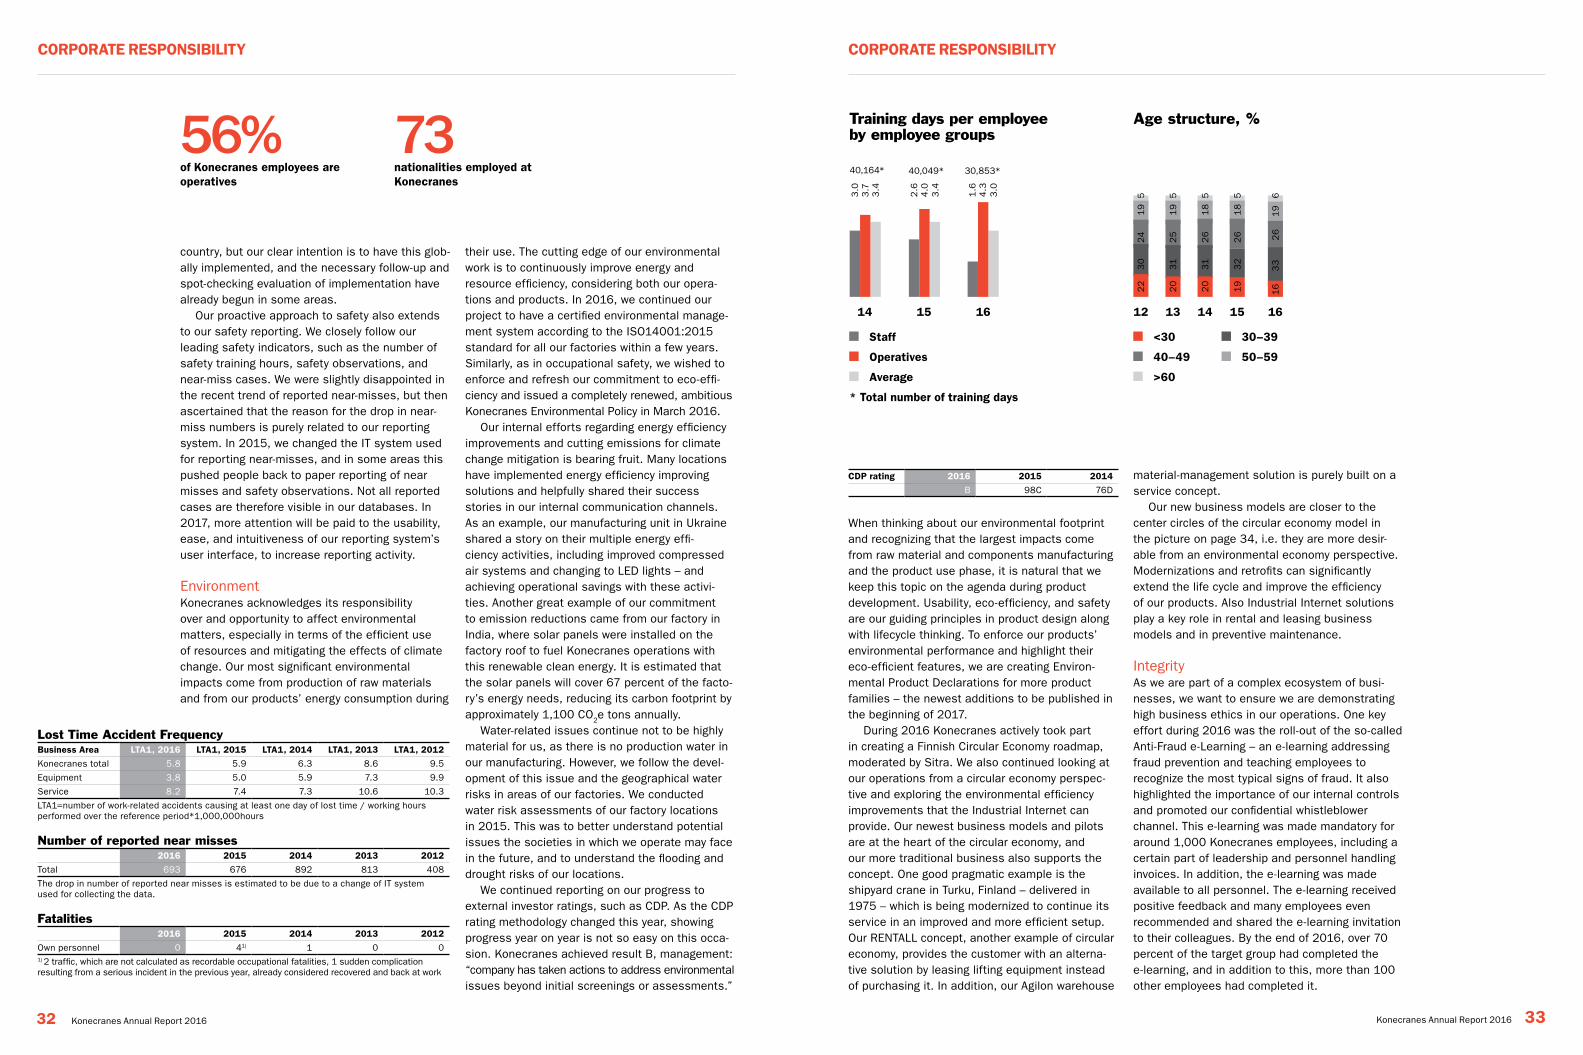
country, but our clear intention is to have this glob-ally implemented, and the necessary follow-up and spot-checking evaluation of implementation have already begun in some areas.
Our proactive approach to safety also extends to our safety reporting. We closely follow our leading safety indicators, such as the number of safety training hours, safety observations, and near-miss cases. We were slightly disappointed in the recent trend of reported near-misses, but then ascertained that the reason for the drop in near-miss numbers is purely related to our reporting system. In 2015, we changed the IT system used for reporting near-misses, and in some areas this pushed people back to paper reporting of near misses and safety observations. Not all reported cases are therefore visible in our databases. In 2017, more attention will be paid to the usability, ease, and intuitiveness of our reporting system’s user interface, to increase reporting activity.
EnvironmentKonecranes acknowledges its responsibility over and opportunity to affect environmental matters, especially in terms of the efficient use of resources and mitigating the effects of climate change. Our most significant environmental impacts come from production of raw materials and from our products’ energy consumption during
their use. The cutting edge of our environmental work is to continuously improve energy and resource efficiency, considering both our opera-tions and products. In 2016, we continued our project to have a certified environmental manage-ment system according to the ISO14001:2015 standard for all our factories within a few years. Similarly, as in occupational safety, we wished to enforce and refresh our commitment to eco-effi-ciency and issued a completely renewed, ambitious Konecranes Environmental Policy in March 2016.
Our internal efforts regarding energy efficiency improvements and cutting emissions for climate change mitigation is bearing fruit. Many locations have implemented energy efficiency improving solutions and helpfully shared their success stories in our internal communication channels. As an example, our manufacturing unit in Ukraine shared a story on their multiple energy effi-ciency activities, including improved compressed air systems and changing to LED lights – and achieving operational savings with these activi-ties. Another great example of our commitment to emission reductions came from our factory in India, where solar panels were installed on the factory roof to fuel Konecranes operations with this renewable clean energy. It is estimated that the solar panels will cover 67 percent of the facto-ry’s energy needs, reducing its carbon footprint by approximately 1,100 CO
2e tons annually. Water-related issues continue not to be highly
material for us, as there is no production water in our manufacturing. However, we follow the devel-opment of this issue and the geographical water risks in areas of our factories. We conducted water risk assessments of our factory locations in 2015. This was to better understand potential issues the societies in which we operate may face in the future, and to understand the flooding and drought risks of our locations.
We continued reporting on our progress to external investor ratings, such as CDP. As the CDP rating methodology changed this year, showing progress year on year is not so easy on this occa-sion. Konecranes achieved result B, management: “company has taken actions to address environmental issues beyond initial screenings or assessments.”
Lost Time Accident Frequency Business Area LtA1, 2016 LtA1, 2015 LtA1, 2014 LtA1, 2013 LtA1, 2012
Konecranes total 5.8 5.9 6.3 8.6 9.5
Equipment 3.8 5.0 5.9 7.3 9.9
Service 8.2 7.4 7.3 10.6 10.3
LTA1=number of work-related accidents causing at least one day of lost time / working hours performed over the reference period*1,000,000hours
Number of reported near misses2016 2015 2014 2013 2012
Total 693 676 892 813 408
The drop in number of reported near misses is estimated to be due to a change of IT system used for collecting the data.
Fatalities2016 2015 2014 2013 2012
Own personnel 0 41) 1 0 01) 2 traffic, which are not calculated as recordable occupational fatalities, 1 sudden complication resulting from a serious incident in the previous year, already considered recovered and back at work
cDP rating 2016 2015 2014
B 98C 76D
When thinking about our environmental footprint and recognizing that the largest impacts come from raw material and components manufacturing and the product use phase, it is natural that we keep this topic on the agenda during product development. Usability, eco-efficiency, and safety are our guiding principles in product design along with lifecycle thinking. To enforce our products’ environmental performance and highlight their eco-efficient features, we are creating Environ-mental Product Declarations for more product families – the newest additions to be published in the beginning of 2017.
During 2016 Konecranes actively took part in creating a Finnish Circular Economy roadmap, moderated by Sitra. We also continued looking at our operations from a circular economy perspec-tive and exploring the environmental efficiency improvements that the Industrial Internet can provide. Our newest business models and pilots are at the heart of the circular economy, and our more traditional business also supports the concept. One good pragmatic example is the shipyard crane in Turku, Finland – delivered in 1975 – which is being modernized to continue its service in an improved and more efficient setup. Our RENTALL concept, another example of circular economy, provides the customer with an alterna-tive solution by leasing lifting equipment instead of purchasing it. In addition, our Agilon warehouse
material-management solution is purely built on a service concept.
Our new business models are closer to the center circles of the circular economy model in the picture on page 34, i.e. they are more desir-able from an environmental economy perspective. Modernizations and retrofits can significantly extend the life cycle and improve the efficiency of our products. Also Industrial Internet solutions play a key role in rental and leasing business models and in preventive maintenance.
IntegrityAs we are part of a complex ecosystem of busi-nesses, we want to ensure we are demonstrating high business ethics in our operations. One key effort during 2016 was the roll-out of the so-called Anti-Fraud e-Learning – an e-learning addressing fraud prevention and teaching employees to recognize the most typical signs of fraud. It also highlighted the importance of our internal controls and promoted our confidential whistleblower channel. This e-learning was made mandatory for around 1,000 Konecranes employees, including a certain part of leadership and personnel handling invoices. In addition, the e-learning was made available to all personnel. The e-learning received positive feedback and many employees even recommended and shared the e-learning invitation to their colleagues. By the end of 2016, over 70 percent of the target group had completed the e-learning, and in addition to this, more than 100 other employees had completed it.
56%of Konecranes employees are operatives
73nationalities employed at Konecranes
14 15 16
Training days per employee by employee groups
Staff
Operatives
Average
* Total number of training days
40,164* 40,049* 30,853*
3.0
2.6
1.6
3.7
4.0
4.3
3.4
3.4
3.0
<30 30–39
40–49 50–59
>60
12 13 14 15 16
65 5 5 5
26
19
24
19
25
19
26
18
26
18
16
33
22
30
20
31
20
31
19
32
Age structure, %
32 Konecranes Annual Report 2016 Konecranes Annual Report 2016 33
corPorAte reSPonSiBiLitY corPorAte reSPonSiBiLitY
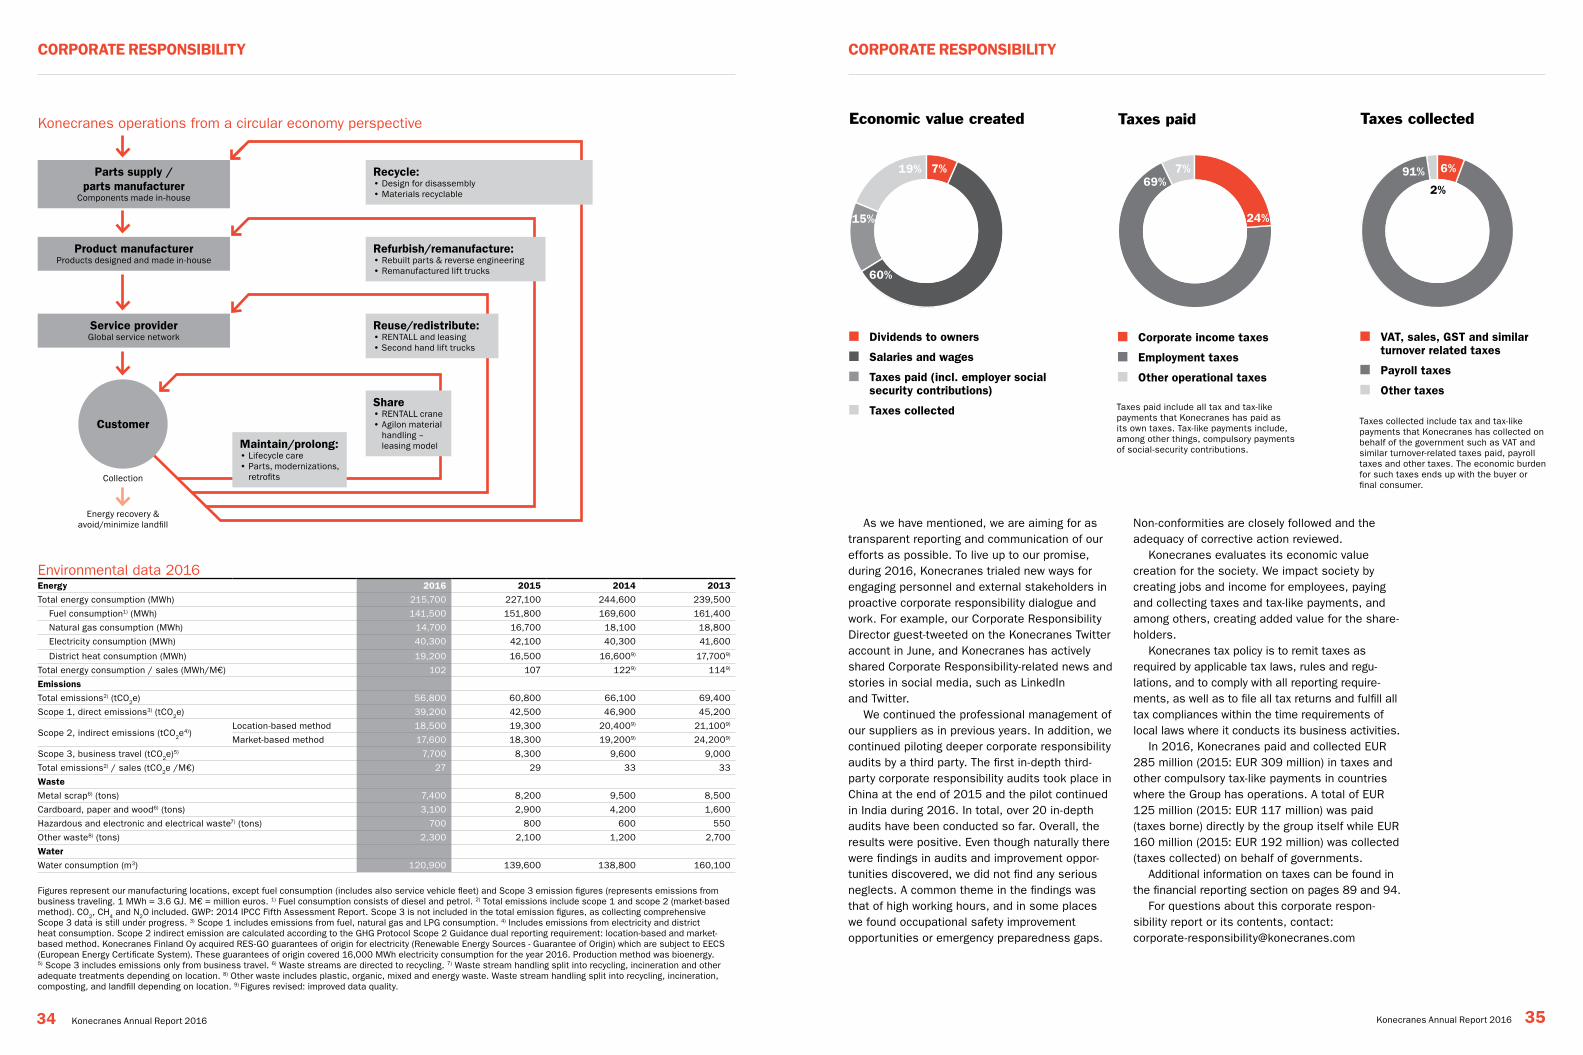
As we have mentioned, we are aiming for as transparent reporting and communication of our efforts as possible. To live up to our promise, during 2016, Konecranes trialed new ways for engaging personnel and external stakeholders in proactive corporate responsibility dialogue and work. For example, our Corporate Responsibility Director guest-tweeted on the Konecranes Twitter account in June, and Konecranes has actively shared Corporate Responsibility-related news and stories in social media, such as LinkedIn and Twitter.
We continued the professional management of our suppliers as in previous years. In addition, we continued piloting deeper corporate responsibility audits by a third party. The first in-depth third-party corporate responsibility audits took place in China at the end of 2015 and the pilot continued in India during 2016. In total, over 20 in-depth audits have been conducted so far. Overall, the results were positive. Even though naturally there were findings in audits and improvement oppor-tunities discovered, we did not find any serious neglects. A common theme in the findings was that of high working hours, and in some places we found occupational safety improvement opportunities or emergency preparedness gaps.
Environmental data 2016 energy 2016 2015 2014 2013
Total energy consumption (MWh) 215,700 227,100 244,600 239,500
Fuel consumption1) (MWh) 141,500 151,800 169,600 161,400
Natural gas consumption (MWh) 14,700 16,700 18,100 18,800
Electricity consumption (MWh) 40,300 42,100 40,300 41,600
District heat consumption (MWh) 19,200 16,500 16,6009) 17,7009)
Total energy consumption / sales (MWh/M€) 102 107 1229) 1149)
emissions
Total emissions2) (tCO2e) 56,800 60,800 66,100 69,400
Scope 1, direct emissions3) (tCO2e) 39,200 42,500 46,900 45,200
Scope 2, indirect emissions (tCO2e4))
Location-based method 18,500 19,300 20,4009) 21,1009)
Market-based method 17,600 18,300 19,2009) 24,2009)
Scope 3, business travel (tCO2e)5) 7,700 8,300 9,600 9,000
Total emissions2) / sales (tCO2e /M€) 27 29 33 33
Waste
Metal scrap6) (tons) 7,400 8,200 9,500 8,500
Cardboard, paper and wood6) (tons) 3,100 2,900 4,200 1,600
Hazardous and electronic and electrical waste7) (tons) 700 800 600 550
Other waste8) (tons) 2,300 2,100 1,200 2,700
Water
Water consumption (m3) 120,900 139,600 138,800 160,100
Figures represent our manufacturing locations, except fuel consumption (includes also service vehicle fleet) and Scope 3 emission figures (represents emissions from business traveling. 1 MWh = 3.6 GJ. M€ = million euros. 1) Fuel consumption consists of diesel and petrol. 2) Total emissions include scope 1 and scope 2 (market-based method). CO2, CH4 and N2O included. GWP: 2014 IPCC Fifth Assessment Report. Scope 3 is not included in the total emission figures, as collecting comprehensive Scope 3 data is still under progress. 3) Scope 1 includes emissions from fuel, natural gas and LPG consumption. 4) Includes emissions from electricity and district heat consumption. Scope 2 indirect emission are calculated according to the GHG Protocol Scope 2 Guidance dual reporting requirement: location-based and market-based method. Konecranes Finland Oy acquired RES-GO guarantees of origin for electricity (Renewable Energy Sources - Guarantee of Origin) which are subject to EECS (European Energy Certificate System). These guarantees of origin covered 16,000 MWh electricity consumption for the year 2016. Production method was bioenergy. 5) Scope 3 includes emissions only from business travel. 6) Waste streams are directed to recycling. 7) Waste stream handling split into recycling, incineration and other adequate treatments depending on location. 8) Other waste includes plastic, organic, mixed and energy waste. Waste stream handling split into recycling, incineration, composting, and landfill depending on location. 9) Figures revised: improved data quality.
Parts supply / parts manufacturer
Components made in-house
Product manufacturerProducts designed and made in-house
Service providerGlobal service network
Refurbish/remanufacture:• Rebuilt parts & reverse engineering• Remanufactured lift trucks
Recycle:• Design for disassembly• Materials recyclable
Customer
Collection
Energy recovery & avoid/minimize landfill
Reuse/redistribute:• RENTALL and leasing• Second hand lift trucks
Maintain/prolong:• Lifecycle care• Parts, modernizations,
retrofits
Share• RENTALL crane• Agilon material
handling – leasing model
Non- conformities are closely followed and the adequacy of corrective action reviewed.
Konecranes evaluates its economic value creation for the society. We impact society by creating jobs and income for employees, paying and collecting taxes and tax-like payments, and among others, creating added value for the share-holders.
Konecranes tax policy is to remit taxes as required by applicable tax laws, rules and regu-lations, and to comply with all reporting require-ments, as well as to file all tax returns and fulfill all tax compliances within the time requirements of local laws where it conducts its business activities.
In 2016, Konecranes paid and collected EUR 285 million (2015: EUR 309 million) in taxes and other compulsory tax-like payments in countries where the Group has operations. A total of EUR 125 million (2015: EUR 117 million) was paid (taxes borne) directly by the group itself while EUR 160 million (2015: EUR 192 million) was collected (taxes collected) on behalf of governments.
Additional information on taxes can be found in the financial reporting section on pages 89 and 94.
For questions about this corporate respon-sibility report or its contents, contact: [email protected]
Konecranes operations from a circular economy perspective
Taxes paid include all tax and tax-like payments that Konecranes has paid as its own taxes. Tax-like payments include, among other things, compulsory payments of social-security contributions.
Taxes collected include tax and tax-like payments that Konecranes has collected on behalf of the government such as VAT and similar turnover-related taxes paid, payroll taxes and other taxes. The economic burden for such taxes ends up with the buyer or final consumer.
Economic value created
Dividends to owners
Salaries and wages
Taxes paid (incl. employer social security contributions)
Taxes collected
15%
19%
60%
7%
Taxes paid
Corporate income taxes
Employment taxes
Other operational taxes
69%7%
24%
Taxes collected
VAT, sales, GST and similar turnover related taxes
Payroll taxes
Other taxes
2%
6%91%
34 Konecranes Annual Report 2016 Konecranes Annual Report 2016 35
corPorAte reSPonSiBiLitY corPorAte reSPonSiBiLitY
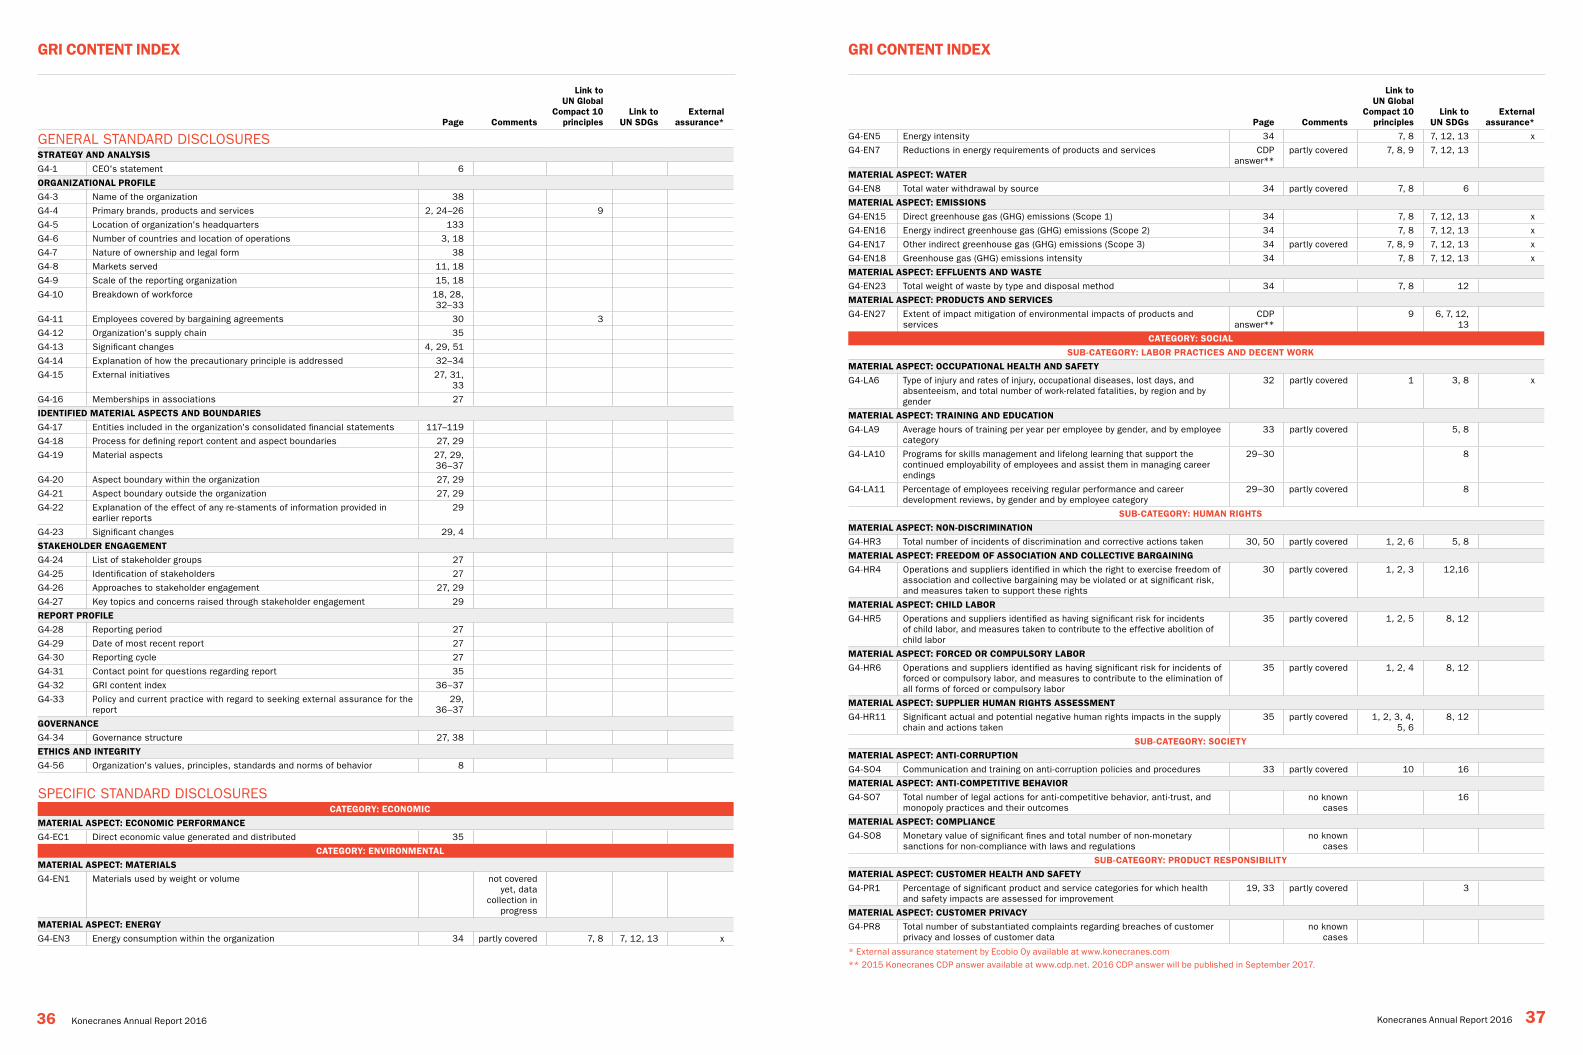
Page comments
Link to Un global
compact 10 principles
Link to Un SDgs
external assurance*
GENERAL STANDARD DISCLOSURESStrAtegY AnD AnALYSiS
G4-1 CEO's statement 6
orgAniZAtionAL ProFiLe
G4-3 Name of the organization 38
G4-4 Primary brands, products and services 2, 24–26 9
G4-5 Location of organization's headquarters 133
G4-6 Number of countries and location of operations 3, 18
G4-7 Nature of ownership and legal form 38
G4-8 Markets served 11, 18
G4-9 Scale of the reporting organization 15, 18
G4-10 Breakdown of workforce 18, 28, 32–33
G4-11 Employees covered by bargaining agreements 30 3
G4-12 Organization's supply chain 35
G4-13 Significant changes 4, 29, 51
G4-14 Explanation of how the precautionary principle is addressed 32–34
G4-15 External initiatives 27, 31, 33
G4-16 Memberships in associations 27
iDentiFieD MAteriAL ASPectS AnD BoUnDArieS
G4-17 Entities included in the organization's consolidated financial statements 117–119
G4-18 Process for defining report content and aspect boundaries 27, 29
G4-19 Material aspects 27, 29, 36–37
G4-20 Aspect boundary within the organization 27, 29
G4-21 Aspect boundary outside the organization 27, 29
G4-22 Explanation of the effect of any re-staments of information provided in earlier reports
29
G4-23 Significant changes 29, 4
StAKeHoLDer engAgeMent
G4-24 List of stakeholder groups 27
G4-25 Identification of stakeholders 27
G4-26 Approaches to stakeholder engagement 27, 29
G4-27 Key topics and concerns raised through stakeholder engagement 29
rePort ProFiLe
G4-28 Reporting period 27
G4-29 Date of most recent report 27
G4-30 Reporting cycle 27
G4-31 Contact point for questions regarding report 35
G4-32 GRI content index 36–37
G4-33 Policy and current practice with regard to seeking external assurance for the report
29, 36–37
goVernAnce
G4-34 Governance structure 27, 38
etHicS AnD integritY
G4-56 Organization's values, principles, standards and norms of behavior 8
SPECIFIC STANDARD DISCLOSUREScAtegorY: econoMic
MAteriAL ASPect: econoMic PerForMAnce
G4-EC1 Direct economic value generated and distributed 35
cAtegorY: enVironMentAL
MAteriAL ASPect: MAteriALS
G4-EN1 Materials used by weight or volume not covered yet, data
collection in progress
MAteriAL ASPect: energY
G4-EN3 Energy consumption within the organization 34 partly covered 7, 8 7, 12, 13 x
Page comments
Link to Un global
compact 10 principles
Link to Un SDgs
external assurance*
G4-EN5 Energy intensity 34 7, 8 7, 12, 13 x
G4-EN7 Reductions in energy requirements of products and services CDP answer**
partly covered 7, 8, 9 7, 12, 13
MAteriAL ASPect: WAter
G4-EN8 Total water withdrawal by source 34 partly covered 7, 8 6
MAteriAL ASPect: eMiSSionS
G4-EN15 Direct greenhouse gas (GHG) emissions (Scope 1) 34 7, 8 7, 12, 13 x
G4-EN16 Energy indirect greenhouse gas (GHG) emissions (Scope 2) 34 7, 8 7, 12, 13 x
G4-EN17 Other indirect greenhouse gas (GHG) emissions (Scope 3) 34 partly covered 7, 8, 9 7, 12, 13 x
G4-EN18 Greenhouse gas (GHG) emissions intensity 34 7, 8 7, 12, 13 x
MAteriAL ASPect: eFFLUentS AnD WASte
G4-EN23 Total weight of waste by type and disposal method 34 7, 8 12
MAteriAL ASPect: ProDUctS AnD SerViceS
G4-EN27 Extent of impact mitigation of environmental impacts of products and services
CDP answer**
9 6, 7, 12, 13
cAtegorY: SociAL
SUB-cAtegorY: LABor PrActiceS AnD Decent WorK
MAteriAL ASPect: occUPAtionAL HeALtH AnD SAFetY
G4-LA6 Type of injury and rates of injury, occupational diseases, lost days, and absenteeism, and total number of work-related fatalities, by region and by gender
32 partly covered 1 3, 8 x
MAteriAL ASPect: trAining AnD eDUcAtion
G4-LA9 Average hours of training per year per employee by gender, and by employee category
33 partly covered 5, 8
G4-LA10 Programs for skills management and lifelong learning that support the continued employability of employees and assist them in managing career endings
29–30 8
G4-LA11 Percentage of employees receiving regular performance and career development reviews, by gender and by employee category
29–30 partly covered 8
SUB-cAtegorY: HUMAn rigHtS
MAteriAL ASPect: non-DiScriMinAtion
G4-HR3 Total number of incidents of discrimination and corrective actions taken 30, 50 partly covered 1, 2, 6 5, 8
MAteriAL ASPect: FreeDoM oF ASSociAtion AnD coLLectiVe BArgAining
G4-HR4 Operations and suppliers identified in which the right to exercise freedom of association and collective bargaining may be violated or at significant risk, and measures taken to support these rights
30 partly covered 1, 2, 3 12,16
MAteriAL ASPect: cHiLD LABor
G4-HR5 Operations and suppliers identified as having significant risk for incidents of child labor, and measures taken to contribute to the effective abolition of child labor
35 partly covered 1, 2, 5 8, 12
MAteriAL ASPect: ForceD or coMPULSorY LABor
G4-HR6 Operations and suppliers identified as having significant risk for incidents of forced or compulsory labor, and measures to contribute to the elimination of all forms of forced or compulsory labor
35 partly covered 1, 2, 4 8, 12
MAteriAL ASPect: SUPPLier HUMAn rigHtS ASSeSSMent
G4-HR11 Significant actual and potential negative human rights impacts in the supply chain and actions taken
35 partly covered 1, 2, 3, 4, 5, 6
8, 12
SUB-cAtegorY: SocietY
MAteriAL ASPect: Anti-corrUPtion
G4-SO4 Communication and training on anti-corruption policies and procedures 33 partly covered 10 16
MAteriAL ASPect: Anti-coMPetitiVe BeHAVior
G4-SO7 Total number of legal actions for anti-competitive behavior, anti-trust, and monopoly practices and their outcomes
no known cases
16
MAteriAL ASPect: coMPLiAnce
G4-SO8 Monetary value of significant fines and total number of non-monetary sanctions for non-compliance with laws and regulations
no known cases
SUB-cAtegorY: ProDUct reSPonSiBiLitY
MAteriAL ASPect: cUStoMer HeALtH AnD SAFetY
G4-PR1 Percentage of significant product and service categories for which health and safety impacts are assessed for improvement
19, 33 partly covered 3
MAteriAL ASPect: cUStoMer PriVAcY
G4-PR8 Total number of substantiated complaints regarding breaches of customer privacy and losses of customer data
no known cases
* External assurance statement by Ecobio Oy available at www.konecranes.com** 2015 Konecranes CDP answer available at www.cdp.net. 2016 CDP answer will be published in September 2017.
36 Konecranes Annual Report 2016 Konecranes Annual Report 2016 37
gri content inDeX gri content inDeX
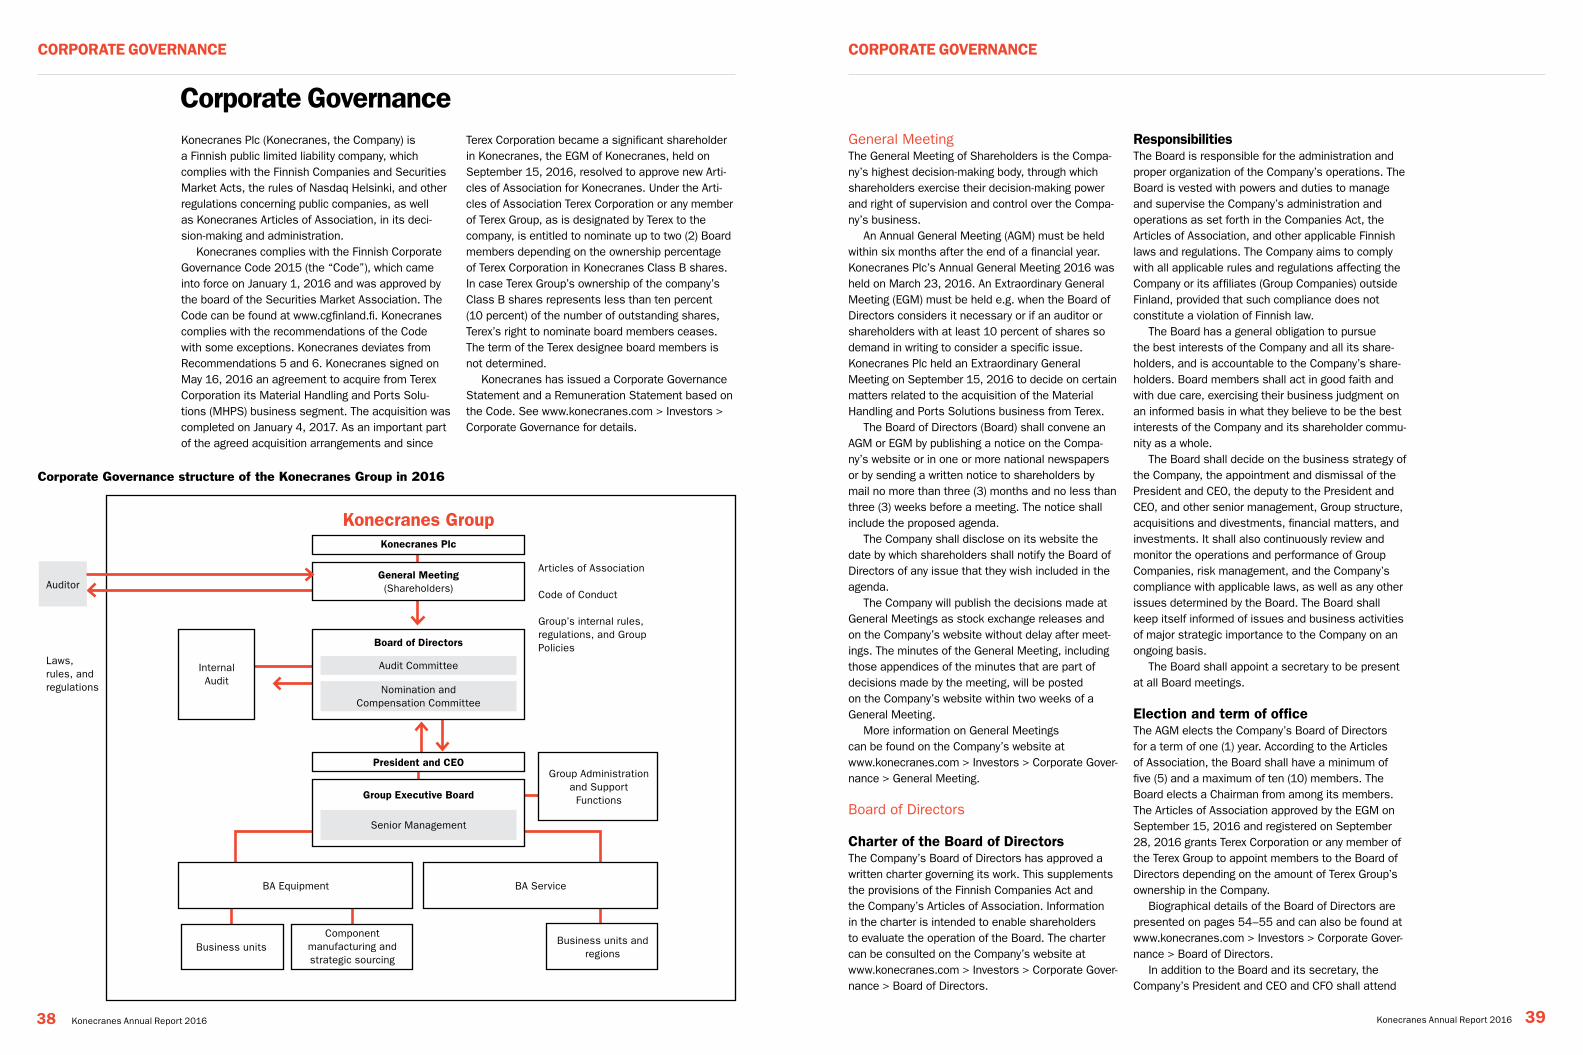
Corporate Governance structure of the Konecranes Group in 2016
Konecranes Plc (Konecranes, the Company) is a Finnish public limited liability company, which complies with the Finnish Companies and Securities Market Acts, the rules of Nasdaq Helsinki, and other regulations concerning public companies, as well as Konecranes Articles of Association, in its deci-sion-making and administration.
Konecranes complies with the Finnish Corporate Governance Code 2015 (the “Code”), which came into force on January 1, 2016 and was approved by the board of the Securities Market Association. The Code can be found at www.cgfinland.fi. Konecranes complies with the recommendations of the Code with some exceptions. Konecranes deviates from Recommendations 5 and 6. Konecranes signed on May 16, 2016 an agreement to acquire from Terex Corporation its Material Handling and Ports Solu-tions (MHPS) business segment. The acquisition was completed on January 4, 2017. As an important part of the agreed acquisition arrangements and since
Terex Corporation became a significant shareholder in Konecranes, the EGM of Konecranes, held on September 15, 2016, resolved to approve new Arti-cles of Association for Konecranes. Under the Arti-cles of Association Terex Corporation or any member of Terex Group, as is designated by Terex to the company, is entitled to nominate up to two (2) Board members depending on the ownership percentage of Terex Corporation in Konecranes Class B shares. In case Terex Group’s ownership of the company’s Class B shares represents less than ten percent (10 percent) of the number of outstanding shares, Terex’s right to nominate board members ceases. The term of the Terex designee board members is not determined.
Konecranes has issued a Corporate Governance Statement and a Remuneration Statement based on the Code. See www.konecranes.com > Investors > Corporate Governance for details.
General MeetingThe General Meeting of Shareholders is the Compa-ny’s highest decision-making body, through which shareholders exercise their decision-making power and right of supervision and control over the Compa-ny’s business.
An Annual General Meeting (AGM) must be held within six months after the end of a financial year. Konecranes Plc’s Annual General Meeting 2016 was held on March 23, 2016. An Extraordinary General Meeting (EGM) must be held e.g. when the Board of Directors considers it necessary or if an auditor or shareholders with at least 10 percent of shares so demand in writing to consider a specific issue. Konecranes Plc held an Extraordinary General Meeting on September 15, 2016 to decide on certain matters related to the acquisition of the Material Handling and Ports Solutions business from Terex.
The Board of Directors (Board) shall convene an AGM or EGM by publishing a notice on the Compa-ny’s website or in one or more national newspapers or by sending a written notice to shareholders by mail no more than three (3) months and no less than three (3) weeks before a meeting. The notice shall include the proposed agenda.
The Company shall disclose on its website the date by which shareholders shall notify the Board of Directors of any issue that they wish included in the agenda.
The Company will publish the decisions made at General Meetings as stock exchange releases and on the Company’s website without delay after meet-ings. The minutes of the General Meeting, including those appendices of the minutes that are part of decisions made by the meeting, will be posted on the Company’s website within two weeks of a General Meeting.
More information on General Meetings can be found on the Company’s website at www.konecranes.com > Investors > Corporate Gover-nance > General Meeting.
Board of Directors
charter of the Board of DirectorsThe Company’s Board of Directors has approved a written charter governing its work. This supplements the provisions of the Finnish Companies Act and the Company’s Articles of Association. Information in the charter is intended to enable shareholders to evaluate the operation of the Board. The charter can be consulted on the Company’s website at www.konecranes.com > Investors > Corporate Gover-nance > Board of Directors.
responsibilitiesThe Board is responsible for the administration and proper organization of the Company’s operations. The Board is vested with powers and duties to manage and supervise the Company’s administration and operations as set forth in the Companies Act, the Articles of Association, and other applicable Finnish laws and regulations. The Company aims to comply with all applicable rules and regulations affecting the Company or its affiliates (Group Companies) outside Finland, provided that such compliance does not constitute a violation of Finnish law.
The Board has a general obligation to pursue the best interests of the Company and all its share-holders, and is accountable to the Company’s share-holders. Board members shall act in good faith and with due care, exercising their business judgment on an informed basis in what they believe to be the best interests of the Company and its shareholder commu-nity as a whole.
The Board shall decide on the business strategy of the Company, the appointment and dismissal of the President and CEO, the deputy to the President and CEO, and other senior management, Group structure, acquisitions and divestments, financial matters, and investments. It shall also continuously review and monitor the operations and performance of Group Companies, risk management, and the Company’s compliance with applicable laws, as well as any other issues determined by the Board. The Board shall keep itself informed of issues and business activities of major strategic importance to the Company on an ongoing basis.
The Board shall appoint a secretary to be present at all Board meetings.
election and term of officeThe AGM elects the Company’s Board of Directors for a term of one (1) year. According to the Articles of Association, the Board shall have a minimum of five (5) and a maximum of ten (10) members. The Board elects a Chairman from among its members. The Articles of Association approved by the EGM on September 15, 2016 and registered on September 28, 2016 grants Terex Corporation or any member of the Terex Group to appoint members to the Board of Directors depending on the amount of Terex Group’s ownership in the Company.
Biographical details of the Board of Directors are presented on pages 54–55 and can also be found at www.konecranes.com > Investors > Corporate Gover-nance > Board of Directors.
In addition to the Board and its secretary, the Company’s President and CEO and CFO shall attend
Konecranes GroupKonecranes Plc
Board of Directors
President and CEO
Group Executive Board
General Meeting(Shareholders)
Audit Committee
Senior Management
BA Equipment
Business unitsBusiness units and
regions
Component manufacturing and strategic sourcing
BA Service
Articles of Association
Code of Conduct
Group’s internal rules, regulations, and GroupPolicies
InternalAudit
Group Administration and Support Functions
Auditor
Laws, rules, and regulations Nomination and
Compensation Committee
corporate governance
38 Konecranes Annual Report 2016 Konecranes Annual Report 2016 39
corPorAte goVernAnce corPorAte goVernAnce
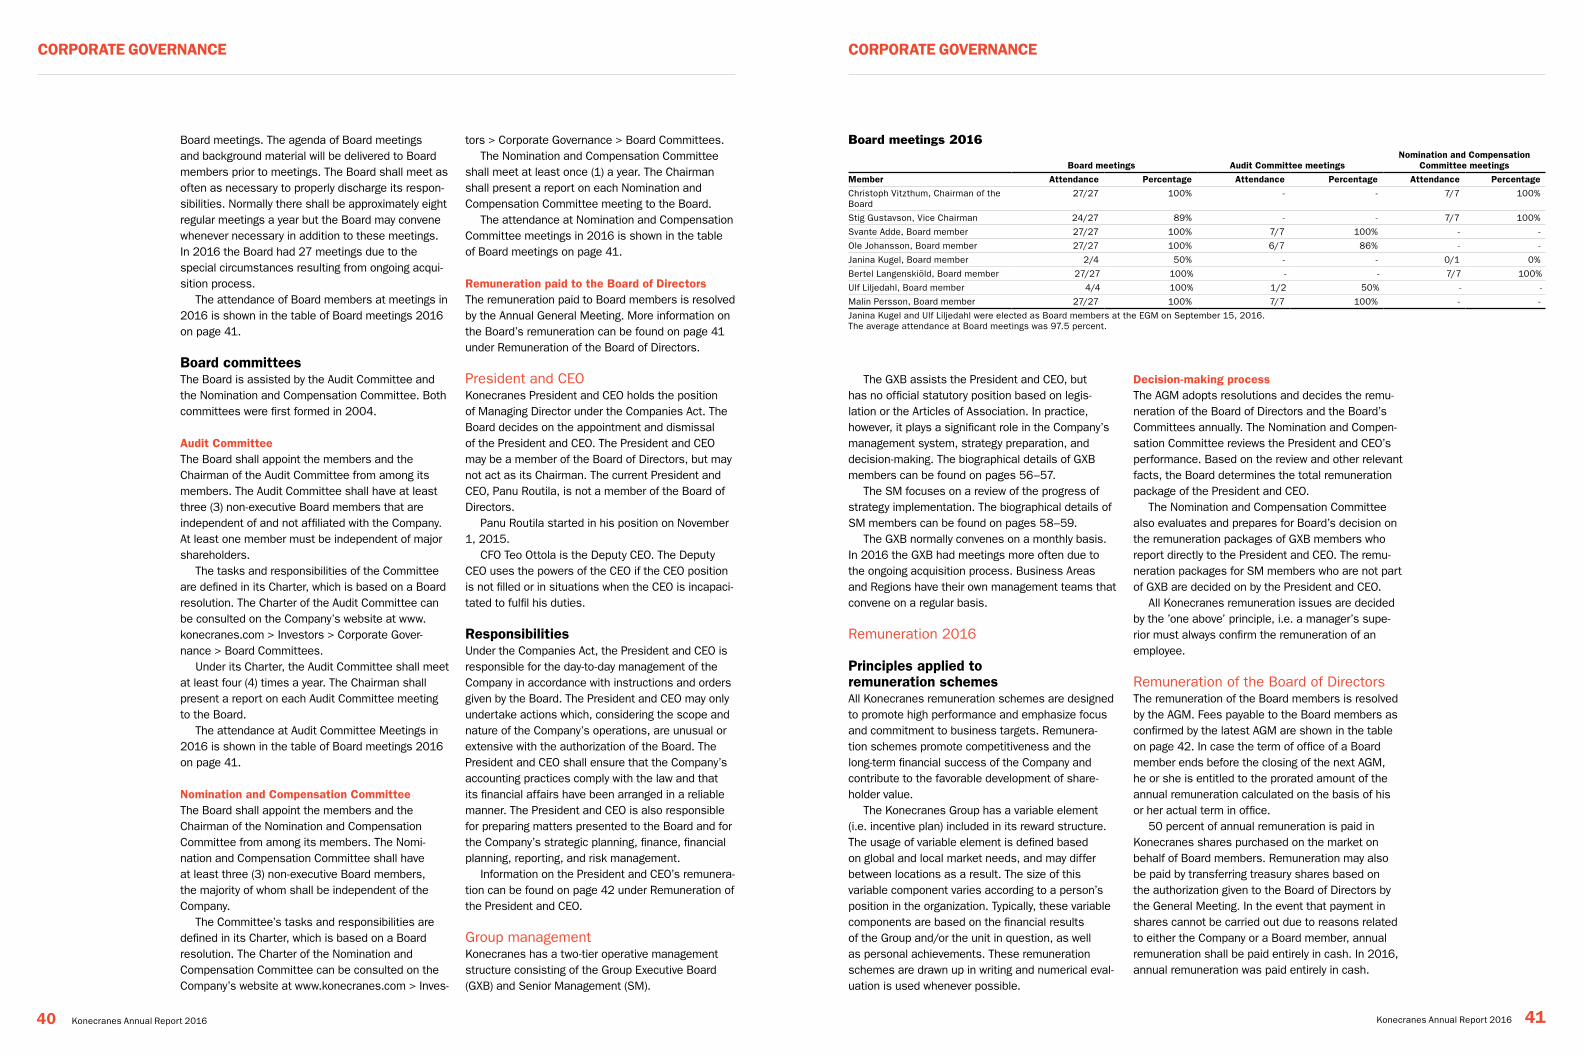
Board meetings. The agenda of Board meetings and background material will be delivered to Board members prior to meetings. The Board shall meet as often as necessary to properly discharge its respon-sibilities. Normally there shall be approximately eight regular meetings a year but the Board may convene whenever necessary in addition to these meetings. In 2016 the Board had 27 meetings due to the special circumstances resulting from ongoing acqui-sition process.
The attendance of Board members at meetings in 2016 is shown in the table of Board meetings 2016 on page 41.
Board committeesThe Board is assisted by the Audit Committee and the Nomination and Compensation Committee. Both committees were first formed in 2004.
Audit committeeThe Board shall appoint the members and the Chairman of the Audit Committee from among its members. The Audit Committee shall have at least three (3) non-executive Board members that are independent of and not affiliated with the Company. At least one member must be independent of major shareholders.
The tasks and responsibilities of the Committee are defined in its Charter, which is based on a Board resolution. The Charter of the Audit Committee can be consulted on the Company’s website at www. konecranes.com > Investors > Corporate Gover-nance > Board Committees.
Under its Charter, the Audit Committee shall meet at least four (4) times a year. The Chairman shall present a report on each Audit Committee meeting to the Board.
The attendance at Audit Committee Meetings in 2016 is shown in the table of Board meetings 2016 on page 41.
nomination and compensation committeeThe Board shall appoint the members and the Chairman of the Nomination and Compensation Committee from among its members. The Nomi-nation and Compensation Committee shall have at least three (3) non-executive Board members, the majority of whom shall be independent of the Company.
The Committee’s tasks and responsibilities are defined in its Charter, which is based on a Board resolution. The Charter of the Nomination and Compensation Committee can be consulted on the Company’s website at www.konecranes.com > Inves-
tors > Corporate Governance > Board Committees.The Nomination and Compensation Committee
shall meet at least once (1) a year. The Chairman shall present a report on each Nomination and Compensation Committee meeting to the Board.
The attendance at Nomination and Compensation Committee meetings in 2016 is shown in the table of Board meetings on page 41.
remuneration paid to the Board of DirectorsThe remuneration paid to Board members is resolved by the Annual General Meeting. More information on the Board’s remuneration can be found on page 41 under Remuneration of the Board of Directors.
President and CEOKonecranes President and CEO holds the position of Managing Director under the Companies Act. The Board decides on the appointment and dismissal of the President and CEO. The President and CEO may be a member of the Board of Directors, but may not act as its Chairman. The current President and CEO, Panu Routila, is not a member of the Board of Directors.
Panu Routila started in his position on November 1, 2015.
CFO Teo Ottola is the Deputy CEO. The Deputy CEO uses the powers of the CEO if the CEO position is not filled or in situations when the CEO is incapaci-tated to fulfil his duties.
responsibilitiesUnder the Companies Act, the President and CEO is responsible for the day-to-day management of the Company in accordance with instructions and orders given by the Board. The President and CEO may only undertake actions which, considering the scope and nature of the Company’s operations, are unusual or extensive with the authorization of the Board. The President and CEO shall ensure that the Company’s accounting practices comply with the law and that its financial affairs have been arranged in a reliable manner. The President and CEO is also responsible for preparing matters presented to the Board and for the Company’s strategic planning, finance, financial planning, reporting, and risk management.
Information on the President and CEO’s remunera-tion can be found on page 42 under Remuneration of the President and CEO.
Group managementKonecranes has a two-tier operative management structure consisting of the Group Executive Board (GXB) and Senior Management (SM).
Board meetings 2016
Board meetings Audit committee meetingsnomination and compensation
committee meetings
Member Attendance Percentage Attendance Percentage Attendance Percentage
Christoph Vitzthum, Chairman of the Board
27/27 100% - - 7/7 100%
Stig Gustavson, Vice Chairman 24/27 89% - - 7/7 100%
Svante Adde, Board member 27/27 100% 7/7 100% - -
Ole Johansson, Board member 27/27 100% 6/7 86% - -
Janina Kugel, Board member 2/4 50% - - 0/1 0%
Bertel Langenskiöld, Board member 27/27 100% - - 7/7 100%
Ulf Liljedahl, Board member 4/4 100% 1/2 50% - -
Malin Persson, Board member 27/27 100% 7/7 100% - -
Janina Kugel and Ulf Liljedahl were elected as Board members at the EGM on September 15, 2016. The average attendance at Board meetings was 97.5 percent.
The GXB assists the President and CEO, but has no official statutory position based on legis-lation or the Articles of Association. In practice, however, it plays a significant role in the Company’s management system, strategy preparation, and decision-making. The biographical details of GXB members can be found on pages 56–57.
The SM focuses on a review of the progress of strategy implementation. The biographical details of SM members can be found on pages 58–59.
The GXB normally convenes on a monthly basis. In 2016 the GXB had meetings more often due to the ongoing acquisition process. Business Areas and Regions have their own management teams that convene on a regular basis.
Remuneration 2016
Principles applied to remuneration schemesAll Konecranes remuneration schemes are designed to promote high performance and emphasize focus and commitment to business targets. Remunera-tion schemes promote competitiveness and the long-term financial success of the Company and contribute to the favorable development of share-holder value.
The Konecranes Group has a variable element (i.e. incentive plan) included in its reward structure. The usage of variable element is defined based on global and local market needs, and may differ between locations as a result. The size of this variable component varies according to a person’s position in the organization. Typically, these variable components are based on the financial results of the Group and/or the unit in question, as well as personal achievements. These remuneration schemes are drawn up in writing and numerical eval-uation is used whenever possible.
Decision-making processThe AGM adopts resolutions and decides the remu-neration of the Board of Directors and the Board’s Committees annually. The Nomination and Compen-sation Committee reviews the President and CEO’s performance. Based on the review and other relevant facts, the Board determines the total remuneration package of the President and CEO.
The Nomination and Compensation Committee also evaluates and prepares for Board’s decision on the remuneration packages of GXB members who report directly to the President and CEO. The remu-neration packages for SM members who are not part of GXB are decided on by the President and CEO.
All Konecranes remuneration issues are decided by the ’one above’ principle, i.e. a manager’s supe-rior must always confirm the remuneration of an employee.
Remuneration of the Board of DirectorsThe remuneration of the Board members is resolved by the AGM. Fees payable to the Board members as confirmed by the latest AGM are shown in the table on page 42. In case the term of office of a Board member ends before the closing of the next AGM, he or she is entitled to the prorated amount of the annual remuneration calculated on the basis of his or her actual term in office.
50 percent of annual remuneration is paid in Konecranes shares purchased on the market on behalf of Board members. Remuneration may also be paid by transferring treasury shares based on the authorization given to the Board of Directors by the General Meeting. In the event that payment in shares cannot be carried out due to reasons related to either the Company or a Board member, annual remuneration shall be paid entirely in cash. In 2016, annual remuneration was paid entirely in cash.
40 Konecranes Annual Report 2016 Konecranes Annual Report 2016 41
corPorAte goVernAnce corPorAte goVernAnce
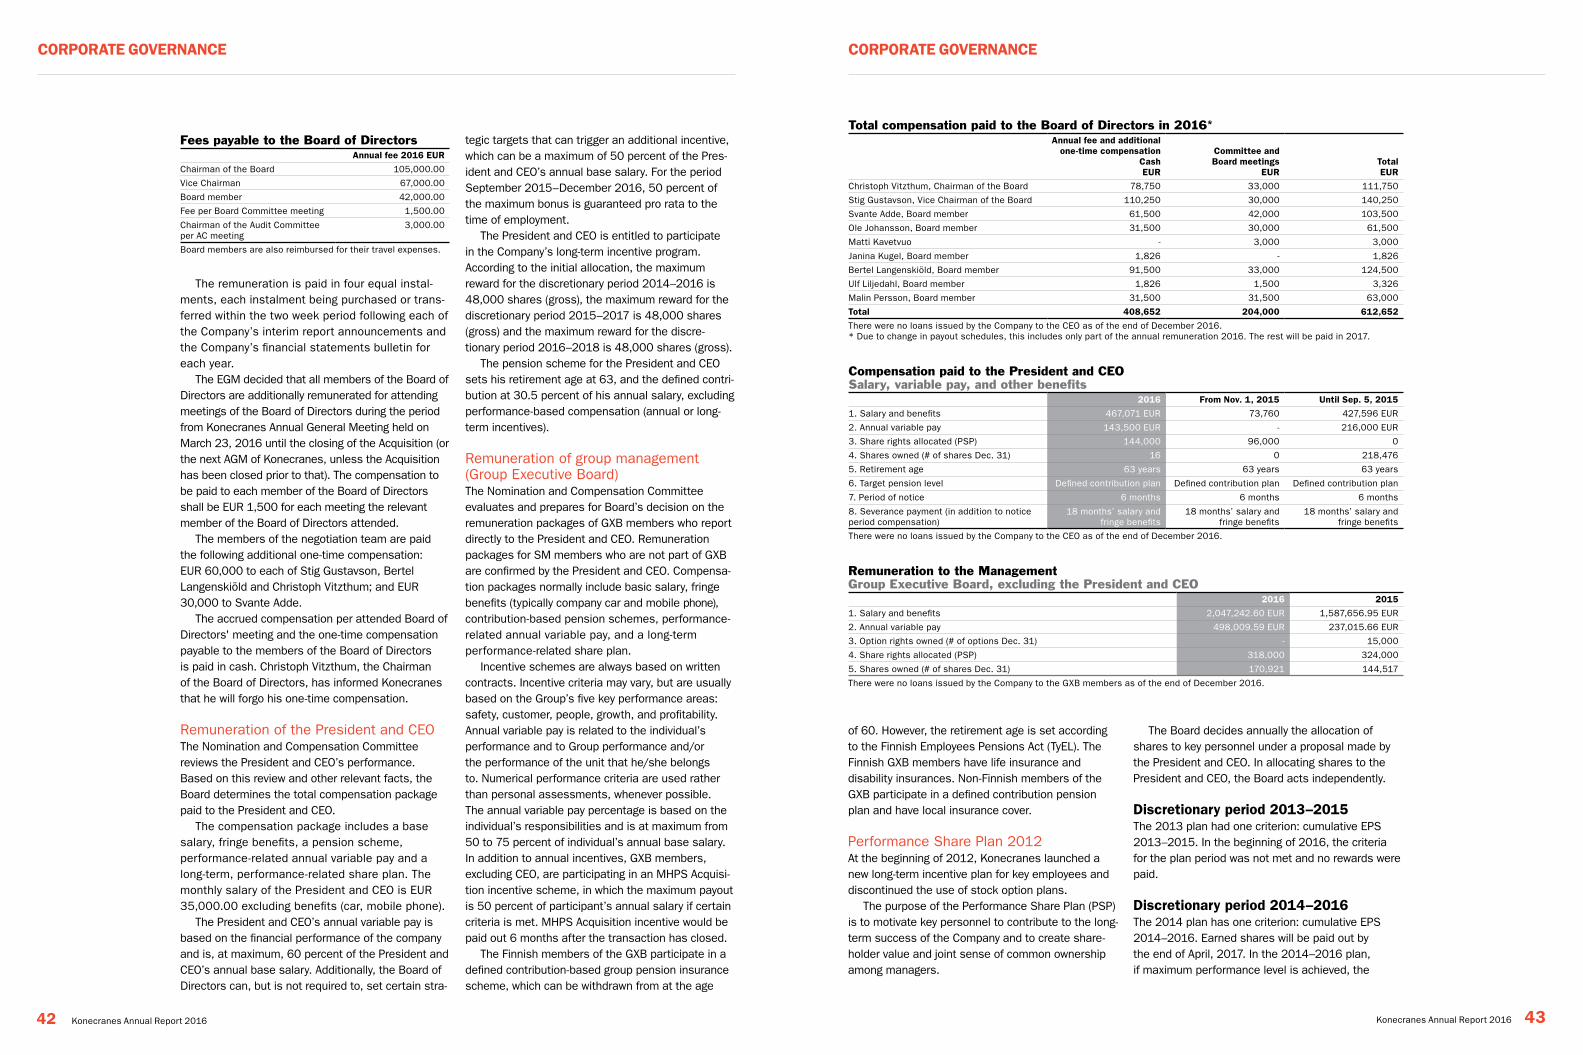
Total compensation paid to the Board of Directors in 2016*
Annual fee and additional one-time compensation
casheUr
committee and Board meetings
eUrtotaleUr
Christoph Vitzthum, Chairman of the Board 78,750 33,000 111,750
Stig Gustavson, Vice Chairman of the Board 110,250 30,000 140,250
Svante Adde, Board member 61,500 42,000 103,500
Ole Johansson, Board member 31,500 30,000 61,500
Matti Kavetvuo - 3,000 3,000
Janina Kugel, Board member 1,826 - 1,826
Bertel Langenskiöld, Board member 91,500 33,000 124,500
Ulf Liljedahl, Board member 1,826 1,500 3,326
Malin Persson, Board member 31,500 31,500 63,000
total 408,652 204,000 612,652
There were no loans issued by the Company to the CEO as of the end of December 2016. * Due to change in payout schedules, this includes only part of the annual remuneration 2016. The rest will be paid in 2017.
Compensation paid to the President and CEO Salary, variable pay, and other benefits 2016 From nov. 1, 2015 Until Sep. 5, 2015
1. Salary and benefits 467,071 EUR 73,760 427,596 EUR
2. Annual variable pay 143,500 EUR - 216,000 EUR
3. Share rights allocated (PSP) 144,000 96,000 0
4. Shares owned (# of shares Dec. 31) 16 0 218,476
5. Retirement age 63 years 63 years 63 years
6. Target pension level Defined contribution plan Defined contribution plan Defined contribution plan
7. Period of notice 6 months 6 months 6 months
8. Severance payment (in addition to notice period compensation)
18 months’ salary and fringe benefits
18 months’ salary and fringe benefits
18 months’ salary and fringe benefits
There were no loans issued by the Company to the CEO as of the end of December 2016.
The remuneration is paid in four equal instal-ments, each instalment being purchased or trans-ferred within the two week period following each of the Company’s interim report announcements and the Company’s financial statements bulletin for each year.
The EGM decided that all members of the Board of Directors are additionally remunerated for attending meetings of the Board of Directors during the period from Konecranes Annual General Meeting held on March 23, 2016 until the closing of the Acquisition (or the next AGM of Konecranes, unless the Acquisition has been closed prior to that). The compensation to be paid to each member of the Board of Directors shall be EUR 1,500 for each meeting the relevant member of the Board of Directors attended.
The members of the negotiation team are paid the following additional one-time compensation: EUR 60,000 to each of Stig Gustavson, Bertel Langenskiöld and Christoph Vitzthum; and EUR 30,000 to Svante Adde.
The accrued compensation per attended Board of Directors' meeting and the one-time compensation payable to the members of the Board of Directors is paid in cash. Christoph Vitzthum, the Chairman of the Board of Directors, has informed Konecranes that he will forgo his one-time compensation.
Remuneration of the President and CEO The Nomination and Compensation Committee reviews the President and CEO’s performance. Based on this review and other relevant facts, the Board determines the total compensation package paid to the President and CEO.
The compensation package includes a base salary, fringe benefits, a pension scheme, performance-related annual variable pay and a long-term, performance-related share plan. The monthly salary of the President and CEO is EUR 35,000.00 excluding benefits (car, mobile phone).
The President and CEO’s annual variable pay is based on the financial performance of the company and is, at maximum, 60 percent of the President and CEO’s annual base salary. Additionally, the Board of Directors can, but is not required to, set certain stra-
tegic targets that can trigger an additional incentive, which can be a maximum of 50 percent of the Pres-ident and CEO’s annual base salary. For the period September 2015–December 2016, 50 percent of the maximum bonus is guaranteed pro rata to the time of employment.
The President and CEO is entitled to participate in the Company’s long-term incentive program. According to the initial allocation, the maximum reward for the discretionary period 2014–2016 is 48,000 shares (gross), the maximum reward for the discretionary period 2015–2017 is 48,000 shares (gross) and the maximum reward for the discre-tionary period 2016–2018 is 48,000 shares (gross).
The pension scheme for the President and CEO sets his retirement age at 63, and the defined contri-bution at 30.5 percent of his annual salary, excluding performance-based compensation (annual or long-term incentives).
Remuneration of group management (Group Executive Board)The Nomination and Compensation Committee evaluates and prepares for Board’s decision on the remuneration packages of GXB members who report directly to the President and CEO. Remuneration packages for SM members who are not part of GXB are confirmed by the President and CEO. Compensa-tion packages normally include basic salary, fringe benefits (typically company car and mobile phone), contribution-based pension schemes, performance- related annual variable pay, and a long-term performance-related share plan.
Incentive schemes are always based on written contracts. Incentive criteria may vary, but are usually based on the Group’s five key performance areas: safety, customer, people, growth, and profitability. Annual variable pay is related to the individual’s performance and to Group performance and/or the performance of the unit that he/she belongs to. Numerical performance criteria are used rather than personal assessments, whenever possible. The annual variable pay percentage is based on the individual’s responsibilities and is at maximum from 50 to 75 percent of individual’s annual base salary. In addition to annual incentives, GXB members, excluding CEO, are participating in an MHPS Acquisi-tion incentive scheme, in which the maximum payout is 50 percent of participant’s annual salary if certain criteria is met. MHPS Acquisition incentive would be paid out 6 months after the transaction has closed.
The Finnish members of the GXB participate in a defined contribution-based group pension insurance scheme, which can be withdrawn from at the age
Fees payable to the Board of DirectorsAnnual fee 2016 eUr
Chairman of the Board 105,000.00
Vice Chairman 67,000.00
Board member 42,000.00
Fee per Board Committee meeting 1,500.00
Chairman of the Audit Committee per AC meeting
3,000.00
Board members are also reimbursed for their travel expenses.
Remuneration to the Management Group Executive Board, excluding the President and CEO 2016 2015
1. Salary and benefits 2,047,242.60 EUR 1,587,656.95 EUR
2. Annual variable pay 498,009.59 EUR 237,015.66 EUR
3. Option rights owned (# of options Dec. 31) - 15,000
4. Share rights allocated (PSP) 318,000 324,000
5. Shares owned (# of shares Dec. 31) 170,921 144,517
There were no loans issued by the Company to the GXB members as of the end of December 2016.
of 60. However, the retirement age is set according to the Finnish Employees Pensions Act (TyEL). The Finnish GXB members have life insurance and disability insurances. Non-Finnish members of the GXB participate in a defined contribution pension plan and have local insurance cover.
Performance Share Plan 2012At the beginning of 2012, Konecranes launched a new long-term incentive plan for key employees and discontinued the use of stock option plans.
The purpose of the Performance Share Plan (PSP) is to motivate key personnel to contribute to the long-term success of the Company and to create share-holder value and joint sense of common ownership among managers.
The Board decides annually the allocation of shares to key personnel under a proposal made by the President and CEO. In allocating shares to the President and CEO, the Board acts independently.
Discretionary period 2013–2015The 2013 plan had one criterion: cumulative EPS 2013–2015. In the beginning of 2016, the criteria for the plan period was not met and no rewards were paid.
Discretionary period 2014–2016The 2014 plan has one criterion: cumulative EPS 2014–2016. Earned shares will be paid out by the end of April, 2017. In the 2014–2016 plan, if maximum performance level is achieved, the
42 Konecranes Annual Report 2016 Konecranes Annual Report 2016 43
corPorAte goVernAnce corPorAte goVernAnce
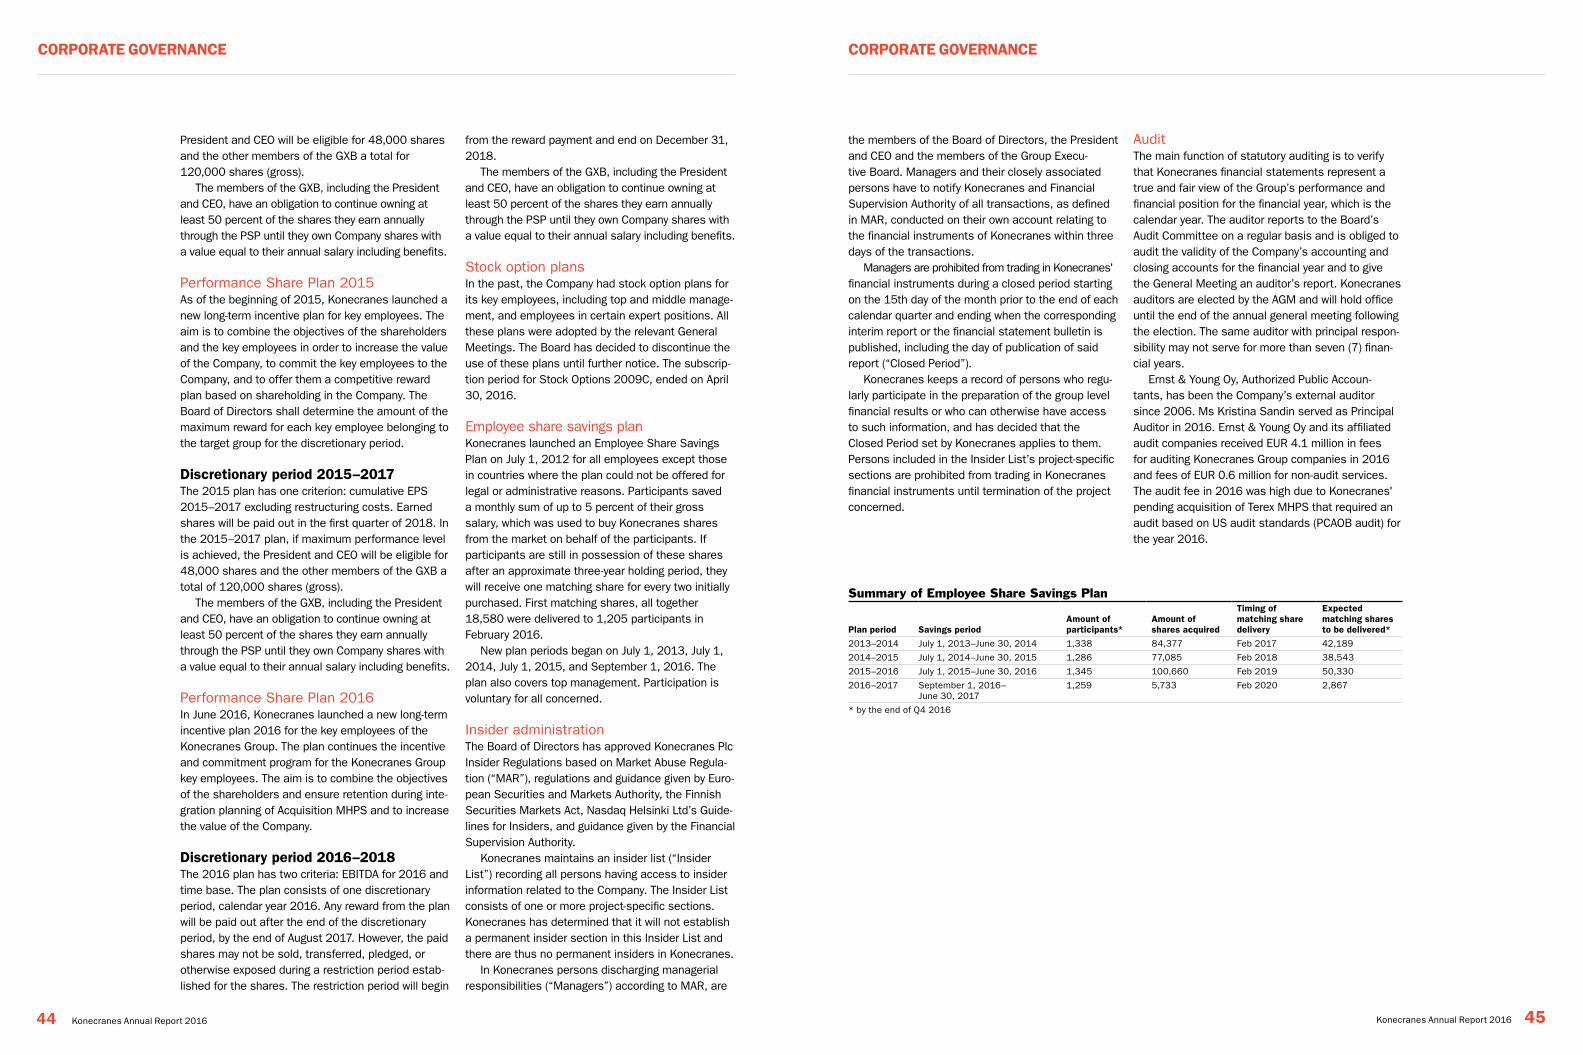
President and CEO will be eligible for 48,000 shares and the other members of the GXB a total for 120,000 shares (gross).
The members of the GXB, including the President and CEO, have an obligation to continue owning at least 50 percent of the shares they earn annually through the PSP until they own Company shares with a value equal to their annual salary including benefits.
Performance Share Plan 2015As of the beginning of 2015, Konecranes launched a new long-term incentive plan for key employees. The aim is to combine the objectives of the shareholders and the key employees in order to increase the value of the Company, to commit the key employees to the Company, and to offer them a competitive reward plan based on shareholding in the Company. The Board of Directors shall determine the amount of the maximum reward for each key employee belonging to the target group for the discretionary period.
Discretionary period 2015–2017The 2015 plan has one criterion: cumulative EPS 2015–2017 excluding restructuring costs. Earned shares will be paid out in the first quarter of 2018. In the 2015–2017 plan, if maximum performance level is achieved, the President and CEO will be eligible for 48,000 shares and the other members of the GXB a total of 120,000 shares (gross).
The members of the GXB, including the President and CEO, have an obligation to continue owning at least 50 percent of the shares they earn annually through the PSP until they own Company shares with a value equal to their annual salary including benefits.
Performance Share Plan 2016In June 2016, Konecranes launched a new long-term incentive plan 2016 for the key employees of the Konecranes Group. The plan continues the incentive and commitment program for the Konecranes Group key employees. The aim is to combine the objectives of the shareholders and ensure retention during inte-gration planning of Acquisition MHPS and to increase the value of the Company.
Discretionary period 2016–2018The 2016 plan has two criteria: EBITDA for 2016 and time base. The plan consists of one discretionary period, calendar year 2016. Any reward from the plan will be paid out after the end of the discretionary period, by the end of August 2017. However, the paid shares may not be sold, transferred, pledged, or otherwise exposed during a restriction period estab-lished for the shares. The restriction period will begin
from the reward payment and end on December 31, 2018.
The members of the GXB, including the President and CEO, have an obligation to continue owning at least 50 percent of the shares they earn annually through the PSP until they own Company shares with a value equal to their annual salary including benefits.
Stock option plansIn the past, the Company had stock option plans for its key employees, including top and middle manage-ment, and employees in certain expert positions. All these plans were adopted by the relevant General Meetings. The Board has decided to discontinue the use of these plans until further notice. The subscrip-tion period for Stock Options 2009C, ended on April 30, 2016.
Employee share savings planKonecranes launched an Employee Share Savings Plan on July 1, 2012 for all employees except those in countries where the plan could not be offered for legal or administrative reasons. Participants saved a monthly sum of up to 5 percent of their gross salary, which was used to buy Konecranes shares from the market on behalf of the participants. If participants are still in possession of these shares after an approximate three-year holding period, they will receive one matching share for every two initially purchased. First matching shares, all together 18,580 were delivered to 1,205 participants in February 2016.
New plan periods began on July 1, 2013, July 1, 2014, July 1, 2015, and September 1, 2016. The plan also covers top management. Participation is voluntary for all concerned.
Insider administration The Board of Directors has approved Konecranes Plc Insider Regulations based on Market Abuse Regula-tion (“MAR”), regulations and guidance given by Euro-pean Securities and Markets Authority, the Finnish Securities Markets Act, Nasdaq Helsinki Ltd’s Guide-lines for Insiders, and guidance given by the Financial Supervision Authority.
Konecranes maintains an insider list (“Insider List”) recording all persons having access to insider information related to the Company. The Insider List consists of one or more project-specific sections. Konecranes has determined that it will not establish a permanent insider section in this Insider List and there are thus no permanent insiders in Konecranes.
In Konecranes persons discharging managerial responsibilities (“Managers”) according to MAR, are
the members of the Board of Directors, the President and CEO and the members of the Group Execu-tive Board. Managers and their closely associated persons have to notify Konecranes and Financial Supervision Authority of all transactions, as defined in MAR, conducted on their own account relating to the financial instruments of Konecranes within three days of the transactions.
Managers are prohibited from trading in Konecranes' financial instruments during a closed period starting on the 15th day of the month prior to the end of each calendar quarter and ending when the corresponding interim report or the financial statement bulletin is published, including the day of publication of said report (“Closed Period”).
Konecranes keeps a record of persons who regu-larly participate in the preparation of the group level financial results or who can otherwise have access to such information, and has decided that the Closed Period set by Konecranes applies to them. Persons included in the Insider List’s project-specific sections are prohibited from trading in Konecranes financial instruments until termination of the project concerned.
Audit The main function of statutory auditing is to verify that Konecranes financial statements represent a true and fair view of the Group’s performance and financial position for the financial year, which is the calendar year. The auditor reports to the Board’s Audit Committee on a regular basis and is obliged to audit the validity of the Company’s accounting and closing accounts for the financial year and to give the General Meeting an auditor’s report. Konecranes auditors are elected by the AGM and will hold office until the end of the annual general meeting following the election. The same auditor with principal respon-sibility may not serve for more than seven (7) finan-cial years.
Ernst & Young Oy, Authorized Public Accoun-tants, has been the Company’s external auditor since 2006. Ms Kristina Sandin served as Principal Auditor in 2016. Ernst & Young Oy and its affiliated audit companies received EUR 4.1 million in fees for auditing Konecranes Group companies in 2016 and fees of EUR 0.6 million for non-audit services. The audit fee in 2016 was high due to Konecranes' pending acquisition of Terex MHPS that required an audit based on US audit standards (PCAOB audit) for the year 2016.
Summary of Employee Share Savings Plan
Plan period Savings periodAmount of participants*
Amount of shares acquired
timing of matching share delivery
expected matching shares to be delivered*
2013–2014 July 1, 2013–June 30, 2014 1,338 84,377 Feb 2017 42,189
2014–2015 July 1, 2014–June 30, 2015 1,286 77,085 Feb 2018 38,543
2015–2016 July 1, 2015–June 30, 2016 1,345 100,660 Feb 2019 50,330
2016–2017 September 1, 2016– June 30, 2017
1,259 5,733 Feb 2020 2,867
* by the end of Q4 2016
44 Konecranes Annual Report 2016 Konecranes Annual Report 2016 45
corPorAte goVernAnce corPorAte goVernAnce
Konecranes Board of Directors has defined and adopted a set of risk management principles based on widely accepted international good management practices. The Audit Committee eval-uates and reports on the adequacy and appropri-ateness of internal controls and risk management to the Board.
Risk management principlesRisk is anything that will clearly affect Konecranes ability to achieve its business objectives and execute its strategies. Risk management is part of Konecranes control system and is designed to ensure that any risks related to the Company’s business operations, are identified and managed adequately and appropriately to safeguard the continuity of Konecranes business at all times.
The Group’s risk management principles provide a basic framework for risk management across Konecranes, and each Group company or operating unit is responsible for its own risk management. This approach guarantees the best possible knowledge of local conditions, experi-ence, and relevance.
The Group’s risk management principles define risk management as a continuous and system-atic activity aimed at protecting employees from personal injury, safeguarding the assets of all Group companies and the Group as a whole, and ensuring stable and profitable financial perfor-mance. By minimizing losses due to realized risks, and optimizing the cost of risk management, Konecranes can safeguard its overall long-term competitiveness.
Significant risks for Konecranes Konecranes has assessed its strategic, opera-tional, financial, and hazard-related risks. The list of risks below, and the risk management methods described here, are intended to be indicative only and should not be considered exhaustive.
Market risksDemand for Konecranes products and services is affected by the development of local and global economies, regional and country-specific political issues and stability, as well as the busi-ness cycles of Konecranes customer industries. Currency fluctuations may cause changes in
competitiveness of our products in a specific market and affect our customers’ businesses. Capital expenditure on industrial cranes varies with the development of industrial production and production capacity, while demand for port equip-ment follows trends in global transportation and, over the shorter term, port investment cycles. The lift truck cycle follows other product segments. Demand for maintenance services is driven by the capacity utilization rates of our customers. In addition to risks related to sales volumes, adverse changes in demand can also result in overcapacity and affect market prices, as can the actions of competitors.
Konecranes aim is to increase the proportion of service revenue in its total revenue stream and thereby reduce its exposure to economic cycles. In general, the demand for service is less volatile than that for equipment.
As part of its strategy, Konecranes strives to maintain a reasonably wide geographical market presence to balance out economic trends in different market areas, while paying attention to relevant distribution costs. Konecranes also aims to limit the risks resulting from changes in demand in different customer segments, as well as the demand for certain products by maintaining a diverse customer base and offering a wide range of products and services. By active product devel-opment, Konecranes also strives to differentiate itself from its competitors and reduce the compet-itive pressures that it experiences.
During 2016 the rollout of new IT-systems continued and we started to see these systems improve our capabilities in risk management, as they improved transparency to the local oper-ations and markets. In addition, Konecranes adjusted its market presence, channel strategy, and supply operations to address specific market needs.
Customer credit risks Challenges with customer payments could adversely affect Konecranes financial situation. To limit this risk, we apply a conservative credit policy in respect of our customers. It is Konecranes prac-tice to review customers carefully before entering into a formal business relationship with them and to require credit reports from new customers. The
credit risks of our customers are mitigated with advance payments, letters of credit, payment guarantees, and credit insurance where appli-cable. By using these tools and carefully moni-toring customer payments, we have been able to successfully limit our credit risks.
During 2016, Konecranes increased its focus towards Know Your Customer (KYC) topics. Exten-sive internal education programs and third party due diligence reports were used to support the KYC process in the frontline units.
Technology risks Konecranes recognizes that there are various threats and opportunities related to the develop-ment of new products and services in its busi-ness. Active management of intellectual property rights is essential in the global marketplace.
Konecranes continuously monitors general market trends, technological developments, competitors’ actions, customer behavior, and developments in various industry segments, in order to identify signs of potential changes that could impact us.
We have developed internal processes to secure systematic follow-up of key technolo-gies. Similarly, we have refined process-driven approaches, from innovations to needed techno-logical research, all the way to product develop-ment projects. The processes contain checkpoints to ensure management of commercial viability and technical risks. We actively seek opportunities to work with external research institutes, univer-sities, and specialized companies with specific know-how, experience, and skills. All of these reduce technical risks, provide awareness of and secure access to technological development in our field of business.
We utilize our testing centers to further improve safety and reliability of our products. We carry out extensive life-time testing of our new and existing products, creating new knowledge to reduce tech-nical risks. Testing centers are also an integral part of our in-house research.
During 2016, we continued to analyze tech-nical data collected from cranes via our Industrial Internet solution, to increase our awareness of how cranes behave in daily operations. Based on this, we continue to develop algorithms, helping us predict issues related to crane safety and oper-ations. All this limits the technical risks in crane usage, and grants us better knowledge for crane designs and service operations.
Active management of our intellectual property rights gets constant attention. We aim to secure our freedom to operate. In 2016 we continued to actively protect our designs, innovations, trade-marks, and domains. We have a regular process to monitor possible violations and react on those.
Our testing centers are audited to ISO 17025 standard, which ensures the quality of testing processes, including proper test planning and documentation of the results. We use the results actively to develop the reliability of our products.
In 2016, our cooperation with university part-ners continued. We donated a modern industrial crane for development and research purposes to Aalto University in Finland.
Technical training of our service technicians is an essential risk management effort. The same applies to lifting equipment specific to training engineers and designers. Service technician training continued actively during the year. For engineers, we developed specific training material and conducted trainings based on this. Both of the above practices will continue in the future.
Personnel Konecranes ability to operate is dependent on the availability, expertise, and competence of profes-sional personnel.
During 2016, Konecranes continued its invest-ments in personnel development. The key focus of our investment was on industry-leading technical skills of service technicians, leadership develop-ment, along with customer-centric and effective sales and sales management skills. In these focus areas, Konecranes invested in training efforts to ensure customer satisfaction.
In addition to training, Konecranes continued investing in safety programs and proactive safety management, and improved its point of risk assessment process. Konecranes sought to ensure key employees’ commitment to the Company given the pending M&A activities.
Furthermore, Konecranes continued employee- engagement programs, such as our Employee Share Savings Plan, and invested in employee well-being.
Acquisitions Unsuccessful acquisitions or a failure to success-fully integrate an acquired company, could result in reduced profitability or hamper the implementation of corporate strategy. Konecranes reduces the risks associated with acquisitions by carrying out
risk management, internal control, and internal auditing
46 Konecranes Annual Report 2016 Konecranes Annual Report 2016 47
riSK MAnAgeMent riSK MAnAgeMent
due diligence analyses, using external advisors when needed.
On May 16, 2016 Konecranes signed an agree-ment to acquire from Terex Corporation its Mate-rial Handling & Port Solutions segment. During 2016, Konecranes invested substantial resources first to secure the acquisition, then to plan and execute the successful closing of the transaction, and finally to prepare for a professional integration of acquired entities. Please find more details of the acquisition on page 9. The scale and expected benefits of this acquisition will create unprece-dented opportunities for Konecranes, while failure to achieve the objectives may result in substantial risks.
Production risks Konecranes strategy is to maintain the in-house production of key components that have high added value, and/or provide core competitive advantages. There are specific risks involved with different aspects of production, such as produc-tion capacity management, operational efficiency, continuity, and quality.
During 2016, activities were continued to further enhance our supply chain capabilities. Our production capacity was adjusted to market demand and streamlined. Replacement invest-ment programs continued during 2016, with increased focus on preventive maintenance. Safety trainings and security improvements continued throughout the year.
Material management and procurement risksMaterial management and procurement oper-ations require a proactive approach and devel-opment to avoid risks related to issues such as pricing, quality, capacity, availability, inventory values, supplier Code of Conduct, and other expectations as expressed in Konecranes Global Supplier Manual. Inefficiencies and deficiencies in these areas could affect the performance and reputation of Konecranes adversely. Konecranes manages its purchases, and the logistics of materials and components of substantial impor-tance for its operations, on a centralized basis. Contracts with key suppliers are designed to opti-mize these purchases globally.
In 2016, Konecranes continued to develop the quality and scope of supplier cooperation and its audit process. We also continued to improve demand-supply monitoring, balancing, forecasting,
and supplier communications to improve our ability to respond to customer needs rapidly. During the year Konecranes performed a substantial amount of supplier assessments, striving to ensure that supplier cooperation meets expectations. We also initiated third-party social assessments of our supplier network.
Quality risks High-quality products along with business proce-dures, processes, and services, play a key role in minimizing Konecranes business risks. Most companies in the Group and all major Group operations use certified quality procedures. Our multisite quality certificate covers several main production units and has supported our actions to harmonize quality processes throughout the corporation.
In 2016, Konecranes continued developing both its local and global quality improvement processes. That development was supported by continuing to deploy the Company’s shared IT tools to better register customer experiences and approaches to problem-solving, with the goal of improving our business performance. To strive for operational excellence, Konecranes continued to use and develop the Lean Six Sigma methodology with good results. The methodology plays a key role in systematic improvement of the Company’s processes and quality.
Supplier risks Konecranes recognizes that price and conti-nuity risks are associated with some of its key suppliers, as they could be difficult to replace. In the event of major production problems, this could undermine our delivery capability. Quality risks and defects associated with subcontracted compo-nents are also quality risks for Konecranes.
To reduce subcontracting risks, Konecranes constantly seeks competitive alternative suppliers while improving cooperation with existing suppliers. When available, alternative suppliers enhance price competition, increase production capacity, and reduce risks of single supplier dependency.
To reduce exchange rate risks, a global supply arrangement strives to find a geographical balance that naturally adapts to long-term changes in exchange rates, potentially affecting the competi-tiveness of our operations.
In 2016, Konecranes continued and enhanced the cooperation with critical suppliers to generate
mutual benefits. We also continued to drive busi-ness continuity management development efforts with selected suppliers.
IT risks Konecranes IT is responsible for all IT services, applications, and assets used by Group compa-nies. Konecranes operations depend on the availability, reliability, quality, confidentiality, and integrity of information. Any and all information security risks, and incidents, may affect business performance adversely.
Konecranes uses reliable IT solutions and employs efficient information security manage-ment, to avoid data loss and prevent the confiden-tiality, availability, or integrity of data from being compromised. User care and support is exercised with internal and outsourced IT services to ensure the high availability, resiliency, and continuity of services, combined with rapid recovery in the event of any temporary loss of key services. Third party experts are utilized to audit, test, and improve cyber security for internally and externally developed IT services.
During 2016, implementation of global IT applications and harmonized business processes entered its final stage. All systems are either completely or for the most part implemented into Group companies. Focus is now gradually shifting to optimizing and enhancing delivered solutions, in order to derive more value from the made investment, and start benefiting from created global visibility. Analytics and BI capabilities have been enhanced to turn increasing amounts of business-, user-, and device-generated data into new business opportunities. IT is also investing in infrastructure enhancements to further improve the operational robustness and reliability of inte-grated, business-critical systems.
Contract and product liability risks Konecranes can be subject to various legal actions, claims, and other proceedings in various countries, typical for a company in its industry and consistent with a global business that encom-passes a wide range of products and services. These may involve contractual disputes, warranty claims, product liability (including design defects, manufacturing defects, failure to post appropriate warnings, and asbestos legacy), employment, auto liability, and other matters involving claims related to general liability. These risks are managed by continuously monitoring operations, improving
product safety and documentation, training customers, and enhancing sales terms.
In 2016, Konecranes continued contractual training, development of contract language, and contracts management.
Illegal activities Konecranes issues written policies to ensure compliance with legislation, regulations, and our own principles across the Konecranes Group. Particular emphasis is placed on training, to ensure that employees are aware of and comply with the applicable legislation, regulations, internal policies, practices, and principles relating to their work.
Konecranes is committed to complying with all applicable laws and regulations, but breaches of the Company’s policies resulting in illegal activities can threaten the Company. Konecranes considers the potential risks to be limited, although it recognizes that even small-scale illegal activity could damage its reputation and affect its financials and results adversely. Internal proce-dures, supervision, audits, and practical tools are used to reduce Konecranes exposure to these types of risks.
Illegal and fraudulent criminal activities targeting Konecranes cause risks that may have substantial impact on our financial results. The amount of such criminal attempts targeting Konecranes has remained high during 2016.
Konecranes continued its efforts to ensure good governance and management practices throughout the year. Comprehensive training programs for global target groups covered controls, policies, and many best practices that mitigate the risks related to illegal activities. Konecranes also actively decreased the exposure to fraudulent and criminal activity.
Damage risks Damage risks include business interruption risks, occupational health and safety-related risks, envi-ronmental risks, fire and other disasters, natural events, and premises security risks. Konecranes identifies and assesses these risks continuously as part of its business processes. To mitigate these risks, we have adopted a number of occu-pational health and safety guidelines, rescue planning, and premises security instructions. Konecranes has also sought to prepare for the materialization of these risks through various insurance programs and by continuously improving
48 Konecranes Annual Report 2016 Konecranes Annual Report 2016 49
riSK MAnAgeMent riSK MAnAgeMent
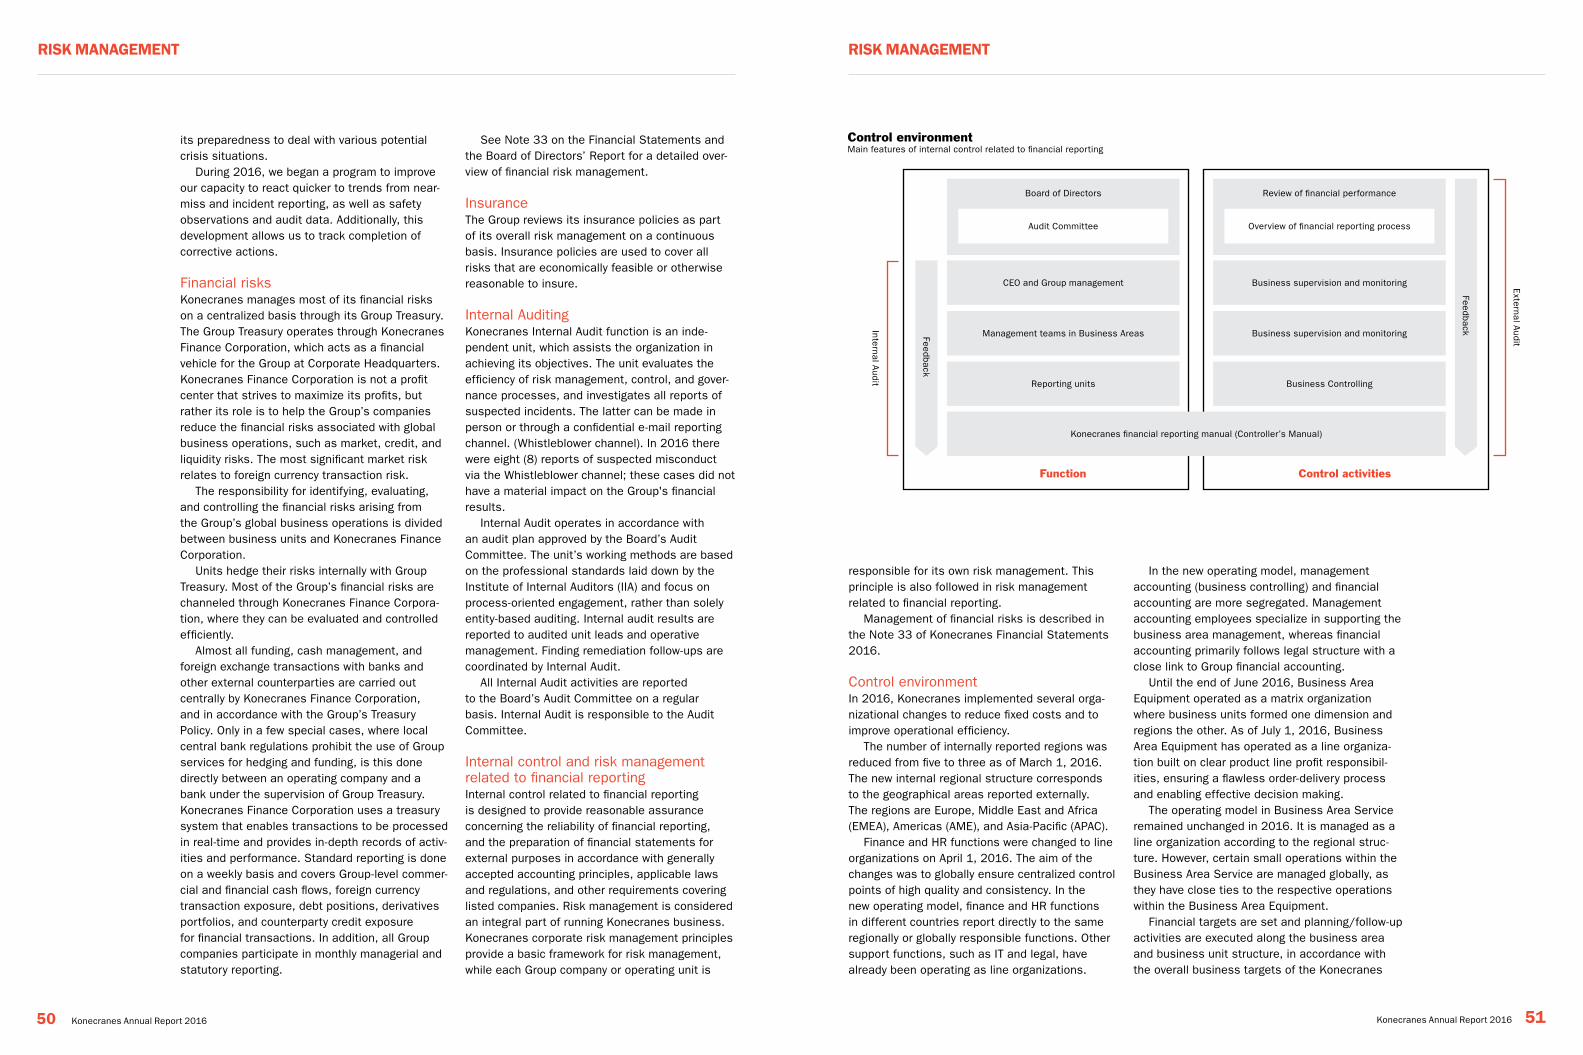
its preparedness to deal with various potential crisis situations.
During 2016, we began a program to improve our capacity to react quicker to trends from near-miss and incident reporting, as well as safety observations and audit data. Additionally, this development allows us to track completion of corrective actions.
Financial risks Konecranes manages most of its financial risks on a centralized basis through its Group Treasury. The Group Treasury operates through Konecranes Finance Corporation, which acts as a financial vehicle for the Group at Corporate Headquarters. Konecranes Finance Corporation is not a profit center that strives to maximize its profits, but rather its role is to help the Group’s companies reduce the financial risks associated with global business operations, such as market, credit, and liquidity risks. The most significant market risk relates to foreign currency transaction risk.
The responsibility for identifying, evaluating, and controlling the financial risks arising from the Group’s global business operations is divided between business units and Konecranes Finance Corporation.
Units hedge their risks internally with Group Treasury. Most of the Group’s financial risks are channeled through Konecranes Finance Corpora-tion, where they can be evaluated and controlled efficiently.
Almost all funding, cash management, and foreign exchange transactions with banks and other external counterparties are carried out centrally by Konecranes Finance Corporation, and in accordance with the Group’s Treasury Policy. Only in a few special cases, where local central bank regulations prohibit the use of Group services for hedging and funding, is this done directly between an operating company and a bank under the supervision of Group Treasury. Konecranes Finance Corporation uses a treasury system that enables transactions to be processed in real-time and provides in-depth records of activ-ities and performance. Standard reporting is done on a weekly basis and covers Group-level commer-cial and financial cash flows, foreign currency transaction exposure, debt positions, derivatives portfolios, and counterparty credit exposure for financial transactions. In addition, all Group companies participate in monthly managerial and statutory reporting.
See Note 33 on the Financial Statements and the Board of Directors’ Report for a detailed over-view of financial risk management.
Insurance The Group reviews its insurance policies as part of its overall risk management on a continuous basis. Insurance policies are used to cover all risks that are economically feasible or otherwise reasonable to insure.
Internal Auditing Konecranes Internal Audit function is an inde-pendent unit, which assists the organization in achieving its objectives. The unit evaluates the efficiency of risk management, control, and gover-nance processes, and investigates all reports of suspected incidents. The latter can be made in person or through a confidential e-mail reporting channel. (Whistleblower channel). In 2016 there were eight (8) reports of suspected misconduct via the Whistleblower channel; these cases did not have a material impact on the Group's financial results.
Internal Audit operates in accordance with an audit plan approved by the Board’s Audit Committee. The unit’s working methods are based on the professional standards laid down by the Institute of Internal Auditors (IIA) and focus on process-oriented engagement, rather than solely entity-based auditing. Internal audit results are reported to audited unit leads and operative management. Finding remediation follow-ups are coordinated by Internal Audit.
All Internal Audit activities are reported to the Board’s Audit Committee on a regular basis. Internal Audit is responsible to the Audit Committee.
Internal control and risk management related to financial reportingInternal control related to financial reporting is designed to provide reasonable assurance concerning the reliability of financial reporting, and the preparation of financial statements for external purposes in accordance with generally accepted accounting principles, applicable laws and regulations, and other requirements covering listed companies. Risk management is considered an integral part of running Konecranes business. Konecranes corporate risk management principles provide a basic framework for risk management, while each Group company or operating unit is
responsible for its own risk management. This principle is also followed in risk management related to financial reporting.
Management of financial risks is described in the Note 33 of Konecranes Financial Statements 2016.
Control environmentIn 2016, Konecranes implemented several orga-nizational changes to reduce fixed costs and to improve operational efficiency.
The number of internally reported regions was reduced from five to three as of March 1, 2016. The new internal regional structure corresponds to the geographical areas reported externally. The regions are Europe, Middle East and Africa (EMEA), Americas (AME), and Asia-Pacific (APAC).
Finance and HR functions were changed to line organizations on April 1, 2016. The aim of the changes was to globally ensure centralized control points of high quality and consistency. In the new operating model, finance and HR functions in different countries report directly to the same regionally or globally responsible functions. Other support functions, such as IT and legal, have already been operating as line organizations.
In the new operating model, management accounting (business controlling) and financial accounting are more segregated. Management accounting employees specialize in supporting the business area management, whereas financial accounting primarily follows legal structure with a close link to Group financial accounting.
Until the end of June 2016, Business Area Equipment operated as a matrix organization where business units formed one dimension and regions the other. As of July 1, 2016, Business Area Equipment has operated as a line organiza-tion built on clear product line profit responsibil-ities, ensuring a flawless order-delivery process and enabling effective decision making.
The operating model in Business Area Service remained unchanged in 2016. It is managed as a line organization according to the regional struc-ture. However, certain small operations within the Business Area Service are managed globally, as they have close ties to the respective operations within the Business Area Equipment.
Financial targets are set and planning/follow-up activities are executed along the business area and business unit structure, in accordance with the overall business targets of the Konecranes
Control environmentMain features of internal control related to financial reporting
Board of Directors Review of financial performance
Audit Committee Overview of financial reporting process
CEO and Group management Business supervision and monitoring
Management teams in Business Areas Business supervision and monitoring
Reporting units
Feedback
Internal Audit
External Audit
Feedback
Business Controlling
Konecranes financial reporting manual (Controller’s Manual)
Function Control activities
50 Konecranes Annual Report 2016 Konecranes Annual Report 2016 51
riSK MAnAgeMent riSK MAnAgeMent
Group. The operations of the Service business are typically monitored based on profit-responsible service branches (210 in 2016), which are further consolidated to country and regional levels. The Equipment business is mainly monitored via busi-ness units (three in 2016), which are divided into business lines and product lines.
Corporate governance and business manage-ment at Konecranes are based on the Company’s values of trust in people, total service commit-ment, and sustained profitability. The control environment is the foundation for all the other components of internal control and for promoting employees’ awareness of key issues. It supports the execution of strategy and regulatory compli-ance. The Board of Directors and Group Manage-ment are responsible for defining the Konecranes Group’s control environment through corporate policies, instructions, and financial reporting frameworks. These include the Konecranes Code of Conduct and the Konecranes Control-ler’s Manual, which constitutes the main tool for accounting and financial reporting principles in respect of providing information, guidelines, and instructions. The interpretation and application of accounting standards is the responsibility of the global finance function. Guidelines and instruc-tions for reporting are updated when necessary and are reviewed at least once a year.
Control activitiesKonecranes Group management has operational responsibility for internal controls. Financial control activities are integrated into the business processes of Konecranes Group, as well as the management’s business supervision and moni-toring procedures. The Group has identified and documented the significant internal controls that relate to its financial processes, either directly or indirectly through other processes. Group companies have the responsiblity to implement the identified and documented internal controls. During 2016, Konecranes enhanced internal controls to cover identified risks more effectively in the processes. All legal entities and business units have their own defined controller functions. Representatives from controller functions partici-pate in planning and evaluating unit performance, and ensure that monthly and quarterly financial reporting follows the Group’s policies and instruc-tions, and that all financial reports are delivered
on time in accordance with schedules set by the Group.
Management follow-up is carried out through monthly management reporting routines and performance review meetings. These meetings are conducted on a business area and business unit level, based on their own management structures, as well as on the Group level. Topics covered in the meetings include a review of the sales funnel, competitive situation, market sentiment, order intake and order book, monthly financial perfor-mance, quarterly and rolling 12-month forecasts, as well as safety, people, and customer topics. The Group management follows up separately the most important development activities. For example, R&D projects are monitored by the Product Board. Product Board convenes typically on a quarterly basis.
MonitoringThe Group conducts an annual self-assessment through its managing directors and controllers to monitor the effectiveness of selected finan-cial internal controls. The Audit Committee receives direct reports from external auditors and discusses and follows up their viewpoints. External auditors are also represented at Audit Committee meetings. The Group’s financial perfor-mance is reviewed at every Board meeting, and the Board of Directors and the Audit Committee review all external financial reports before they are made public.
CommunicationThe Controller’s Manual, together with reporting instructions and policies, are stored in the Konecranes intranet for access by personnel. The Group, business areas, and regions arrange meet-ings to share information on financial processes and practices. Information for the Group’s stakeholders is regularly communicated via the Konecranes Group’s website. To ensure that the information provided is comprehensive and accu-rate, the Group has established a set of external communications guidelines. These define how, by whom, and when information should be issued; and are designed to ensure that Konecranes meets all its information obligations and to further strengthen internal controls related to financial reporting.
During 2016Konecranes continued its IT system project (ERP, CRM and People systems for both the Service and Equipment business areas) to further develop and implement harmonized processes, increase oper-ational visibility and improve decision-making, and reduce the overall number of various IT systems. The SAP ERP system is being taken into use for transaction handling and logistics within both business areas. Whereas the Siebel ERP system is being taken into use to manage the field service operations, as well as to store the data related to the assets under maintenance contracts.
The pilot unit of the SAP ERP system was launched at the end of September 2011. Several new units in North America rolled out SAP during 2013. In 2014, key manufacturing units in Finland implemented SAP in their operations. The SAP rollouts continued in Europe and Asia in 2015. In 2016, SAP was taken into use, or the project was ongoing, in Finland, China, and Singapore. By the end of 2016, the SAP ERP had reached approximately 65 percent coverage of Konecranes business.
Pilot Service units in Europe took the Siebel ERP system into use in 2012–2013. The imple-mentation continued in North America and Australia in 2014–2015. The Siebel ERP system
was rolled out in additional European countries in 2015. In 2016, Siebel ERP was taken into use, or the project was ongoing, in the US, Belgium, France, Sweden, Norway, Switzerland, and Austria. By the end of 2016, the Siebel ERP had reached approximately 50 percent coverage of business within Business Area Service.
The CRM and People systems have reached the targeted global coverage. Their features and func-tionalities are being developed further to maximize the business benefits.
Konecranes continued the implementation and development of the Financial Shared Service Center (FSSC) concept to offer mainly transaction handling services, financial master data mainte-nance, and some financial accounting services from regional centers to individual Konecranes companies.
The internal control environment will be improved using common, unified processes and a common system platform. Monitoring the effectiveness of internal controls will become more transparent following the implementation of the SAP ERP system. Financial Shared Service Centers will create a unified framework for trans-actional processing and provide an enhanced segregation of duties.
52 Konecranes Annual Report 2016 Konecranes Annual Report 2016 53
riSK MAnAgeMent riSK MAnAgeMent
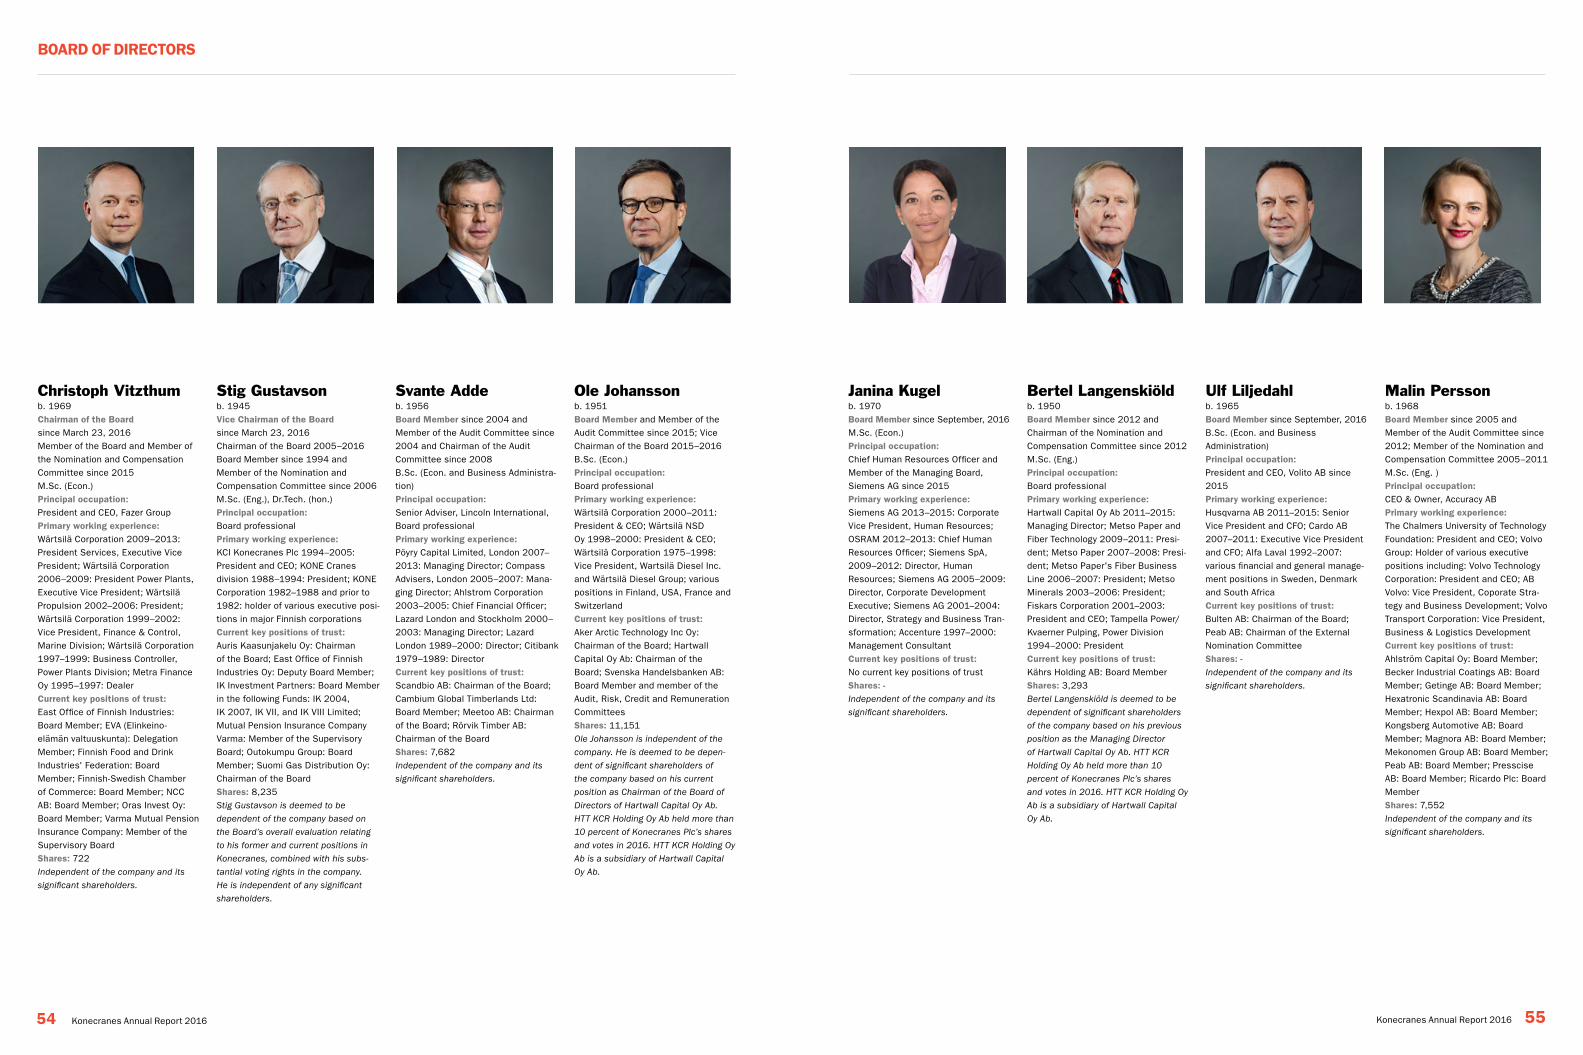
Bertel Langenskiöldb. 1950 Board Member since 2012 and Chairman of the Nomination and Compensation Committee since 2012M.Sc. (Eng.)Principal occupation:Board professional Primary working experience:Hartwall Capital Oy Ab 2011–2015: Managing Director; Metso Paper and Fiber Technology 2009–2011: Presi-dent; Metso Paper 2007–2008: Presi-dent; Metso Paper's Fiber Business Line 2006–2007: President; Metso Minerals 2003–2006: President; Fiskars Corporation 2001–2003: President and CEO; Tampella Power/Kvaerner Pulping, Power Division 1994–2000: Presidentcurrent key positions of trust:Kährs Holding AB: Board MemberShares: 3,293Bertel Langenskiöld is deemed to be
dependent of significant shareholders
of the company based on his previous
position as the Managing Director
of Hartwall Capital Oy Ab. HTT KCR
Holding Oy Ab held more than 10
percent of Konecranes Plc’s shares
and votes in 2016. HTT KCR Holding Oy
Ab is a subsidiary of Hartwall Capital
Oy Ab.
Malin Persson b. 1968 Board Member since 2005 and Member of the Audit Committee since 2012; Member of the Nomination and Compensation Committee 2005–2011M.Sc. (Eng. )Principal occupation:CEO & Owner, Accuracy ABPrimary working experience:The Chalmers University of Technology Foundation: President and CEO; Volvo Group: Holder of various executive positions including: Volvo Technology Corporation: President and CEO; AB Volvo: Vice President, Coporate Stra-tegy and Business Development; Volvo Transport Corporation: Vice President, Business & Logistics Developmentcurrent key positions of trust:Ahlström Capital Oy: Board Member; Becker Industrial Coatings AB: Board Member; Getinge AB: Board Member; Hexatronic Scandinavia AB: Board Member; Hexpol AB: Board Member; Kongsberg Automotive AB: Board Member; Magnora AB: Board Member; Mekonomen Group AB: Board Member; Peab AB: Board Member; Presscise AB: Board Member; Ricardo Plc: Board MemberShares: 7,552Independent of the company and its
significant shareholders.
Janina Kugel b. 1970Board Member since September, 2016M.Sc. (Econ.)Principal occupation: Chief Human Resources Officer and Member of the Managing Board, Siemens AG since 2015Primary working experience:Siemens AG 2013–2015: Corporate Vice President, Human Resources; OSRAM 2012–2013: Chief Human Resources Officer; Siemens SpA, 2009–2012: Director, Human Resources; Siemens AG 2005–2009: Director, Corporate Development Executive; Siemens AG 2001–2004: Director, Strategy and Business Tran-sformation; Accenture 1997–2000: Management Consultantcurrent key positions of trust:No current key positions of trustShares: -Independent of the company and its
significant shareholders.
Ulf Liljedahl b. 1965Board Member since September, 2016B.Sc. (Econ. and Business Administration)Principal occupation:President and CEO, Volito AB since 2015Primary working experience:Husqvarna AB 2011–2015: Senior Vice President and CFO; Cardo AB 2007–2011: Executive Vice President and CFO; Alfa Laval 1992–2007: various financial and general manage-ment positions in Sweden, Denmark and South Africacurrent key positions of trust:Bulten AB: Chairman of the Board; Peab AB: Chairman of the External Nomination CommitteeShares: -Independent of the company and its
significant shareholders.
Christoph Vitzthumb. 1969 chairman of the Board since March 23, 2016Member of the Board and Member of the Nomination and Compensation Committee since 2015M.Sc. (Econ.)Principal occupation: President and CEO, Fazer GroupPrimary working experience:Wärtsilä Corporation 2009–2013: President Services, Executive Vice President; Wärtsilä Corporation 2006–2009: President Power Plants, Executive Vice President; Wärtsilä Propulsion 2002–2006: President; Wärtsilä Corporation 1999–2002: Vice President, Finance & Control, Marine Division; Wärtsilä Corporation 1997–1999: Business Controller, Power Plants Division; Metra Finance Oy 1995–1997: Dealercurrent key positions of trust:East Office of Finnish Industries: Board Member; EVA (Elinkeino-elämän valtuuskunta): Delegation Member; Finnish Food and Drink Industries' Federation: Board Member; Finnish-Swedish Chamber of Commerce: Board Member; NCC AB: Board Member; Oras Invest Oy: Board Member; Varma Mutual Pension Insurance Company: Member of the Supervisory BoardShares: 722Independent of the company and its
significant shareholders.
Stig Gustavson b. 1945 Vice chairman of the Board since March 23, 2016Chairman of the Board 2005–2016Board Member since 1994 and Member of the Nomination and Compensation Committee since 2006M.Sc. (Eng.), Dr.Tech. (hon.)Principal occupation:Board professionalPrimary working experience:KCI Konecranes Plc 1994–2005: President and CEO; KONE Cranes division 1988–1994: President; KONE Corporation 1982–1988 and prior to 1982: holder of various executive posi-tions in major Finnish corporationscurrent key positions of trust:Auris Kaasunjakelu Oy: Chairman of the Board; East Office of Finnish Industries Oy: Deputy Board Member; IK Investment Partners: Board Member in the following Funds: IK 2004, IK 2007, IK VII, and IK VIII Limited; Mutual Pension Insurance Company Varma: Member of the Supervisory Board; Outokumpu Group: Board Member; Suomi Gas Distribution Oy: Chairman of the BoardShares: 8,235Stig Gustavson is deemed to be
dependent of the company based on
the Board’s overall evaluation relating
to his former and current positions in
Konecranes, combined with his subs-
tantial voting rights in the company.
He is independent of any significant
shareholders.
Svante Addeb. 1956 Board Member since 2004 and Member of the Audit Committee since 2004 and Chairman of the Audit Committee since 2008B.Sc. (Econ. and Business Administra-tion)Principal occupation:Senior Adviser, Lincoln International, Board professionalPrimary working experience:Pöyry Capital Limited, London 2007–2013: Managing Director; Compass Advisers, London 2005–2007: Mana-ging Director; Ahlstrom Corporation 2003–2005: Chief Financial Officer; Lazard London and Stockholm 2000–2003: Managing Director; Lazard London 1989–2000: Director; Citibank 1979–1989: Directorcurrent key positions of trust:Scandbio AB: Chairman of the Board; Cambium Global Timberlands Ltd: Board Member; Meetoo AB: Chairman of the Board; Rörvik Timber AB: Chairman of the BoardShares: 7,682Independent of the company and its
significant shareholders.
Ole Johanssonb. 1951 Board Member and Member of the Audit Committee since 2015; Vice Chairman of the Board 2015–2016B.Sc. (Econ.)Principal occupation:Board professionalPrimary working experience:Wärtsilä Corporation 2000–2011: President & CEO; Wärtsilä NSD Oy 1998–2000: President & CEO; Wärtsilä Corporation 1975–1998: Vice President, Wartsilä Diesel Inc. and Wärtsilä Diesel Group; various positions in Finland, USA, France and Switzerlandcurrent key positions of trust:Aker Arctic Technology Inc Oy: Chairman of the Board; Hartwall Capital Oy Ab: Chairman of the Board; Svenska Handelsbanken AB: Board Member and member of the Audit, Risk, Credit and Remuneration CommitteesShares: 11,151Ole Johansson is independent of the
company. He is deemed to be depen-
dent of significant shareholders of
the company based on his current
position as Chairman of the Board of
Directors of Hartwall Capital Oy Ab.
HTT KCR Holding Oy Ab held more than
10 percent of Konecranes Plc’s shares
and votes in 2016. HTT KCR Holding Oy
Ab is a subsidiary of Hartwall Capital
Oy Ab.
Konecranes Annual Report 2016 5554 Konecranes Annual Report 2016
BoArD oF DirectorS
Panu Routilab. 1964President and ceoHead of Business Area EquipmentMember of the Group Executive Board since 2015Employed since 2015M.Sc. (Econ.)Primary working experience:Ahlström Capital Oy 2008–2015: President and CEO; Alteams Oy, Kuusakoski Group 2002–2008: CEO; Outokumpu Group 1997–2002: Dire-ctor, Drawn Copper Products; Outo-kumpu Group 1995–1997: Controller, Drawn Copper products; Partek Group 1986–1995: Various financial mana-gement positions in Finland, France and Belgiumcurrent key positions of trust:Onvest Oy: Board MemberShares: 16
Teo Ottolab. 1968chief Financial officer, Deputy CEOMember of the Executive Board since 2007Employed since 2007M.Sc. (Econ.)Primary working experience:Elcoteq SE 2004–2007: CFO; Elcoteq Network Oyj 1999–2004: Senior Vice President (Business Control and Accounting); Elcoteq Network Oyj 1998–1999: Group Business Cont-roller; Elcoteq Lohja Oy 1996–1998: Business Controller; Rautaruukki Oy 1992–1996: Financial PlannerShares: 28,490
Fabio Fiorinob. 1967executive Vice President, Chief Customer Officer, Business Area ServiceMember of the Executive Board since 2012Employed since 1995B. Eng. P.Eng. MBAPrimary working experience:Konecranes Plc 2011–2012: Executive Vice President, Head of Business Area Service; Konecranes Americas 2010–2011: Vice President, Head of Service, Region Americas; Morris Material Handling, Inc. 2006–2009: President; R&M Materials Handling, Inc. 1999–2006 / Drivecon, Inc. 2002–2006: President; Konecranes Americas 1998–1999: VP Business Develop-ment, Latin America; Konecranes Canada, Inc. 1995–1998: Marketing Manager; AECL 1989–1994: Mecha-nical/Project EngineerShares: 7,792
Mikko Uharib. 1957executive Vice President, Strategy and Technology; Head of Business Unit Industrial Equipment Member of the Group Executive Board since 1997Employed since 1997Lic. Sc. (Eng.)Primary working experience:Konecranes Plc2011-2012: Executive Vice Presi-dent, Head of Market Operations; 2010–2011: Executive Vice President, Head of Business Area Equipment; KCI Konecranes/Konecranes; 2005–2009: President, New Equipment Busi-ness Areas; KCI Konecranes 2004–2005: President, Special Cranes (Heavy Lifting); 1997–2003: President, Harbor and Shipyard Cranes; KONE Corporation 1982–1997: various managerial positions at Wood Hand-ling Division (Andritz as of 1996) in Finland, Sweden and in the USA, inclu-ding: 1996–1997 Group Vice Presi-dent, Marketing; 1992–1996: Group Vice President, Project Business; 1990–1992: Director, Wood Handling Unit, FinlandShares: 102,526
Juha Pankakoskib. 1967chief Digital officerMember of the Group Executive Board since 2015Member of Senior Management 2013–2014Employed since 2004M.Sc. (Eng.), eMBAPrimary working experience:Konecranes 2010–2014: Vice Presi-dent, Head of Business Unit Parts; 2008–2010: Director, Corporate Business Process Development; KCI Konecranes/Konecranes 2004–2008: Director, Supply Operations; Tellabs 2003–2004: Vice President, Supply Chain Operations; 2002–2003: Regional Director, EMEA Operations; 2000–2002: Director, Operations; 1998–2000: Plant Manager; Philips Medical Systems 1997–1998: Opera-tions Manager; FujitsuICL Computers 1993–1997: various management positions in operations and business developmentShares: 506
Timo Leskinenb. 1970Senior Vice President, Human ResourcesMember of the Group Executive Board since 2013Employed since 2013M.Sc. (Psy)Primary working experience:Fiskars 2009–2013: Vice President, Human Resources; Nokia Services 2008–2009: Director HR; Nokia Customer and Market Operations 2006–2007: Director, HR; Nokia Ventures organization 2004–2006: Head of Operations; 2000–2004: HR Manager; MPS 1999–2000: HR ConsultantShares: 1,943
Sirpa Poitsalob. 1963Senior Vice President, General CounselMember of the Group Executive Board since July 2016Member of Senior Management 2013–June 2016Member of the Extended Management team 2009–2013Member of the Executive Board 1999–2009Employed since 1988LL.M.Primary working experience:KCI Konecranes 1997–1998: Assis-tant General Counsel; KCI Konec-ranes/KONE Corporation, 1988–1997: Legal CounselShares: 29,664
Konecranes Annual Report 2016 5756 Konecranes Annual Report 2016
groUP eXecUtiVe BoArD
Scott Gilbeyb. 1962Senior Vice President, Customer Experience and Service OfferingMember of Senior Management since July, 2016Employed since 2004B. Sc. Mech. Eng., P.Eng., MBAPrimary working experience:Konecranes 2012–6.2016: Director of Marketing, Service and Industry; 2009–2014: Director of Marketing and Communications, Region Americas; Morris Material Handling; 2004–2009: various positions, GM Eastern Canada, VP Service Canada, Director of Marketing Americas; 1985–2004: various positions in Canada, Australia, Japan, UK. See LinkedIn.
Anders Gustafssonb. 1964Senior Vice President, Supply OperationsMember of Senior Management since April, 2016Employed since 2016M.Sc. (Eng)Primary working experience:Konecranes 4–6.2016: Chief Supply Chain Officer; Atlas Copco Secoroc 2009–2016: Vice President Global Manufacturing; Tophammer Equip-ment, Atlas Copco Secoroc 2003–2009: Vice President, Global Manufac-turing; ABB 1994–2003: various management and other positions
Lars Fredinb. 1961Vice President, Lift TrucksMember of Senior Management since 2013Employed since 2009B.Sc.Primary working experience:Bromma Conquip AB 2003–2009: Vice President Sales & Marketing; Metget AB 2000–2003: Business Consultant and Sales & Marketing Director (RFID technology); Kalmar 1996–2000: President Kalmar AC, US and Area Manager East Asia. other current key positions of trust: Byggning-Uddemann AB: Chairman of the Board
Mika Mahlbergb. 1963Senior Vice President, PortsMember of Senior Management since 2013Employed since 1997M.Sc. (Eng.)Primary working experience:Konecranes 2008–2014: Vice Presi-dent, Head of Business Unit Port Cranes; KCI Konecranes/Konecranes 2006–2007: Director, VLC CranesKCI Konecranes 2000–2006: Director, STS Cranes; 1990–2000: Various management positions in Finland and Belgium
Ari Kiviniittyb. 1957chief technology officerMember of Senior Management since 2013Member of the Extended Management Team 2012–2013Member of the Executive Board 2005–2012Employed since 1983M.Sc. (Eng.)Primary working experience:Konecranes 2015–6.2016: Senior Vice President, Product Management and Development, Hoists and Compo-nents; KCI Konecranes/Konecranes; 2005–2015: Senior Vice President, Product Management and Engineering, KCI Konecranes 2004–2005: Vice President, Standard Lifting Equipment; 2002–2004: Managing Director, Hoist factory; 1996–2001: various management positions in Finland and Singapore
Mikael Wegmüllerb. 1966Vice President, Marketing and CommunicationsMember of Senior Management since 2013Member of the Extended Management Team 2009–2013Member of the Executive Board 2006–2009Employed since 2006M.Sc. (Mark.)Primary working experience:Publicis Helsinki Oy 2003–2006: Chief Operating Officer; SEK & GREY Oy 2000–2003: Planning Group Director; Publicis Törmä Oy 1997–2000: Plan-ning Group Director; Finelor Oy (now L’Oreal Finland Oy) 1993–1997: Sales and Marketing Manager; Chips Abp 1991–1993: Product Group Manager
Miikka Kinnunenb. 1977Director, Investor RelationsMember of Senior Management since 2013Employed since 2009M.Sc. (Econ.)Primary working experience:Carnegie Investment Bank AB 2001–2009: Financial Analyst
Topi Tiitolab. 1969Director, Business Analysis Head of Integration Management Office since 7.2016 Member of Senior Management since 2013Employed since 1995M.Sc. (Econ)Primary working experience:Konecranes 2013–6.2016: Director, Business Analysis and Support; KCI Konecranes/Konecranes 2005–2013: Group Business Controller; KCI Konec-ranes 2000–2005: Financial Director, Standard Lifting Equipment; 1995–2000: several controller positions
Marko Tulokas b. 1972Senior Vice President, Industrial CranesMember of Senior Management since 2013Employed since 2004M.Sc. (Eng), MBAPrimary working experience:Konecranes 2015–6.2016: Senior Vice President, Product and Applica-tions Management, Industrial Equip-ment; 2011–2015: Vice President, Head of Industrial Crane Solutions; 2010–2011: Director, Head of Busi-ness Process Management; 2008–2010: Director, Delivery Process; 2007–2008: Director, Strategy and Business Development, Process cranes; KCI Konecranes/Konecranes 2004–2007: Leadership positions in sourcing and supply chain mana-gement in China and Finland; Asko Appliances Uponor Plc 1998–2002: Several positions in supply chain management
Tomas Mynttib. 1963Senior Vice President, Industrial Service, Region EMEA (Europe, Middle East and Africa)Member of Senior Management since 2013Member of the Extended Management Team 2011–2013Employed since 2008M.Sc. (Eng.)Primary working experience:Konecranes 3.2016–6.2016: Senior Vice President, Head of Region EMEA; 2012–2016: Senior Vice Presi-dent, Head of Region EUR (Europe); 2011–2012: Senior Vice President, Head of Region NEI (Nordic, Eastern Europe and India); 2010–2011: Vice President, Head of Industrial Cranes, Region NEI; 2009: Director, Market Operations, Head of Global Key Account Management and Sales Development; 2008: Director, Busi-ness Development, Business Area New Equipment; TietoEnator Oyj 2007–2008: Chief Marketing Officer, Business Area Telecom and Media; Hantro Products Oy 2000–2007: Senior Vice President, Sales and Marketing; 1994–2000: various management positions in sales and marketíng;1984–1994: various mana-gement and other positions in IT and consulting
Marko Äkräsb. 1967Senior Vice President, Industrial Service, Region APAC (Asia-Pacific)Member of Senior Management since 2013Member of the Extended Management Team 2012–2013Employed since 1992M.Sc. (Eng.)Primary working experience:Konecranes 2015–6.2016: Senior Vice President, Customer Experience and Service Offering; 2012–2015: Vice President, Customer and Service Technology (Global Service); 2009–2011: Vice President, Service, Region WEMEA (West-Europe, Middle East and Africa); 2007–2009: Director, BU Crane Service (Global Service); KCI Konecranes/Konecranes 2004–2007: Director, Crane Service Nordic; KCI Konecranes 2001–2004: General Manager, Crane Parts Center; KONE Corporation/KCI Konecranes 1993–2001: Various positions in service and equipment business areas
Bernie D’Ambrosib. 1967Senior Vice President, Industrial Service, Region AMEMember of Senior Management since 2015Employed since 2002B.A. (Bachelor of Arts), Political Science Major, Economics Minor, Youngstown State University, J.D. (Juris Doctor), University of Toledo College of LawPrimary working experience:Konecranes 2015–6.2016: Senior Vice President, Head of Region AME;2012–2015: Vice President, Region AME Service; 2009–2012: Vice President, Industrial Crane Solutions, Region AME; KCI Konecranes/Kone-cranes 2002–2009: Senior Legal Counsel, Region AME; Bertin Steel Processing, Inc. 1993–2002: Vice President, General Counsel
Eerikki Mäkinenb. 1974Senior Vice President, Product Mana-gement and EngineeringMember of Senior Management since July, 2016Employed since 2011M.Sc. (Eng.)Primary working experience:Konecranes 2015–6.2016: Director, Light Lifting Product Management; 2012–2015: Director, Engineering (in France 2013–2014); 2011–2012: Engineering Manager; SKF 2010–2011: Team Manager, Application Engineering; 2005–2010: Application Engineer; Metso Paper 2004–2005: Senior Structural Analysis Engineer; 2000–2004: Structural Analysis Engi-neer; 1998–2000: Design Engineer
Andreas Wittkeb. 1967Senior Vice President, ComponentsMember of Senior Management since July, 2016Employed since 2004M.Sc. (Eng)Primary working experience:SWF Krantechnik GmbH 2008–2016: Managing Director; 2004–2008: Sales Director; Kerstner GmbH 1995–2004: Sales Director; ABB Gebäudetechnik AG 1994: Mechanical Engineer
Konecranes Annual Report 2016 5958 Konecranes Annual Report 2016
Senior MAnAgeMent
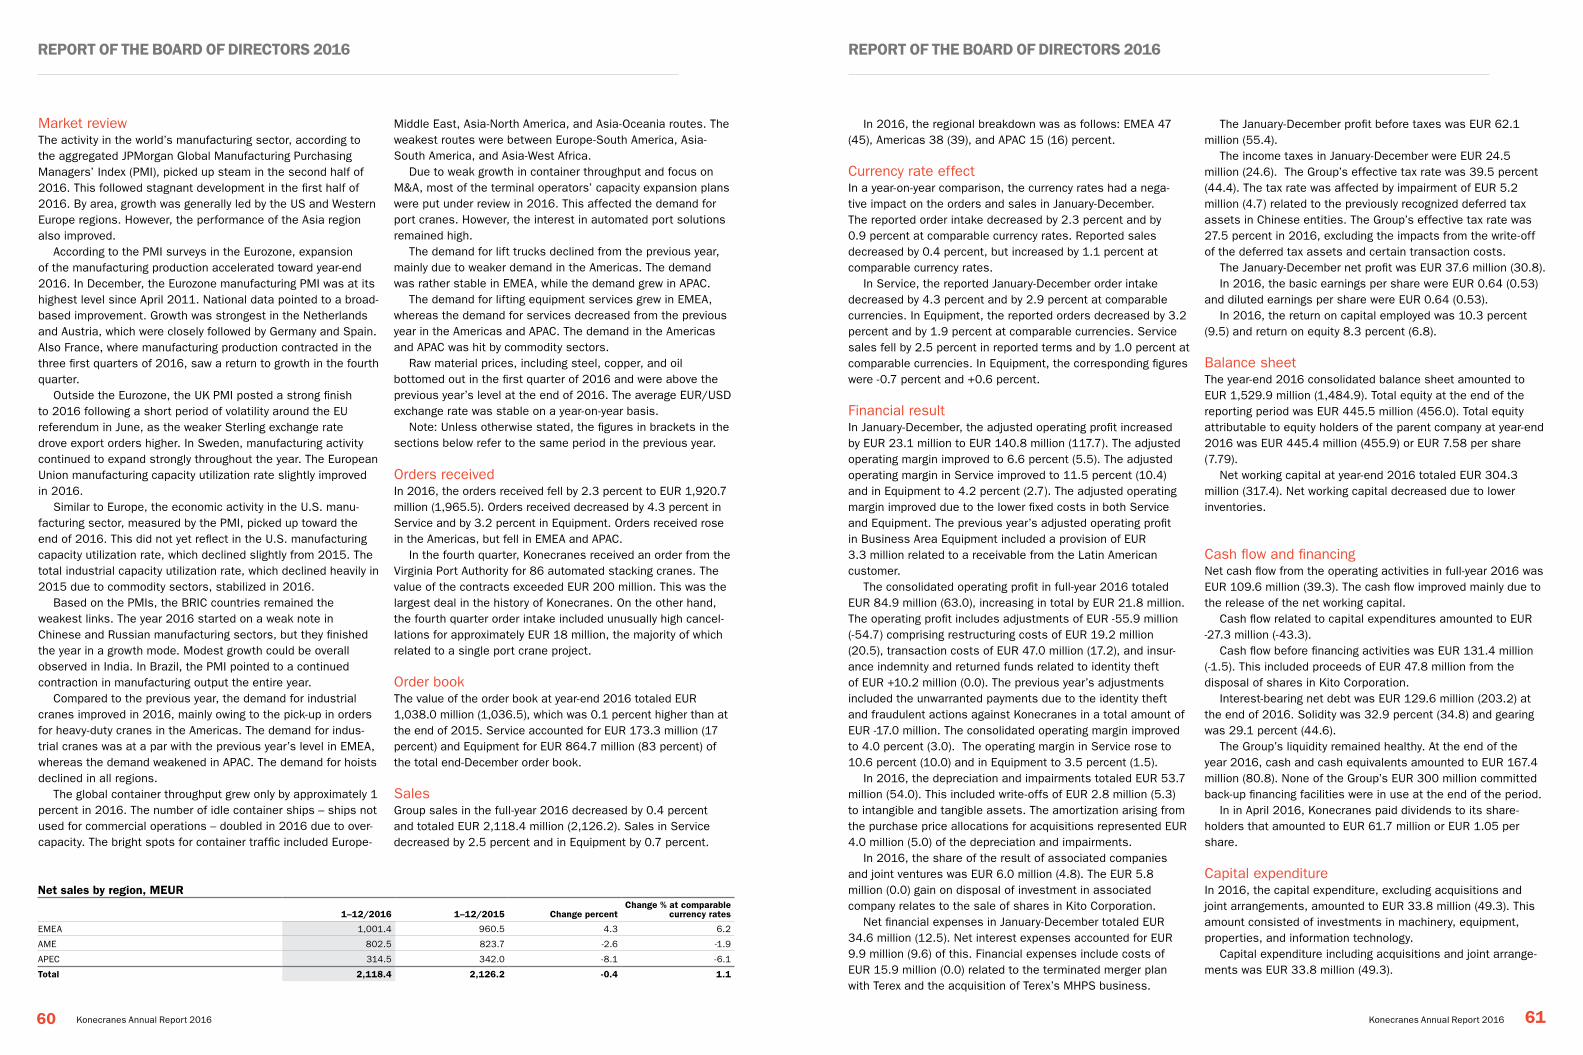
RepoRt of the BoaRd of diRectoRs 2016 RepoRt of the BoaRd of diRectoRs 2016
60 61Konecranes Annual Report 2016 Konecranes Annual Report 2016
Market review The activity in the world’s manufacturing sector, according to the aggregated JPMorgan Global Manufacturing Purchasing Managers’ Index (PMI), picked up steam in the second half of 2016. This followed stagnant development in the first half of 2016. By area, growth was generally led by the US and Western Europe regions. However, the performance of the Asia region also improved.
According to the PMI surveys in the Eurozone, expansion of the manufacturing production accelerated toward year-end 2016. In December, the Eurozone manufacturing PMI was at its highest level since April 2011. National data pointed to a broad-based improvement. Growth was strongest in the Netherlands and Austria, which were closely followed by Germany and Spain. Also France, where manufacturing production contracted in the three first quarters of 2016, saw a return to growth in the fourth quarter.
Outside the Eurozone, the UK PMI posted a strong finish to 2016 following a short period of volatility around the EU referendum in June, as the weaker Sterling exchange rate drove export orders higher. In Sweden, manufacturing activity continued to expand strongly throughout the year. The European Union manufacturing capacity utilization rate slightly improved in 2016.
Similar to Europe, the economic activity in the U.S. manu-facturing sector, measured by the PMI, picked up toward the end of 2016. This did not yet reflect in the U.S. manufacturing capacity utilization rate, which declined slightly from 2015. The total industrial capacity utilization rate, which declined heavily in 2015 due to commodity sectors, stabilized in 2016.
Based on the PMIs, the BRIC countries remained the weakest links. The year 2016 started on a weak note in Chinese and Russian manufacturing sectors, but they finished the year in a growth mode. Modest growth could be overall observed in India. In Brazil, the PMI pointed to a continued contraction in manufacturing output the entire year.
Compared to the previous year, the demand for industrial cranes improved in 2016, mainly owing to the pick-up in orders for heavy-duty cranes in the Americas. The demand for indus-trial cranes was at a par with the previous year’s level in EMEA, whereas the demand weakened in APAC. The demand for hoists declined in all regions.
The global container throughput grew only by approximately 1 percent in 2016. The number of idle container ships – ships not used for commercial operations – doubled in 2016 due to over-capacity. The bright spots for container traffic included Europe-
Middle East, Asia-North America, and Asia-Oceania routes. The weakest routes were between Europe-South America, Asia-South America, and Asia-West Africa.
Due to weak growth in container throughput and focus on M&A, most of the terminal operators’ capacity expansion plans were put under review in 2016. This affected the demand for port cranes. However, the interest in automated port solutions remained high.
The demand for lift trucks declined from the previous year, mainly due to weaker demand in the Americas. The demand was rather stable in EMEA, while the demand grew in APAC.
The demand for lifting equipment services grew in EMEA, whereas the demand for services decreased from the previous year in the Americas and APAC. The demand in the Americas and APAC was hit by commodity sectors.
Raw material prices, including steel, copper, and oil bottomed out in the first quarter of 2016 and were above the previous year’s level at the end of 2016. The average EUR/USD exchange rate was stable on a year-on-year basis.
Note: Unless otherwise stated, the figures in brackets in the sections below refer to the same period in the previous year.
Orders received In 2016, the orders received fell by 2.3 percent to EUR 1,920.7 million (1,965.5). Orders received decreased by 4.3 percent in Service and by 3.2 percent in Equipment. Orders received rose in the Americas, but fell in EMEA and APAC.
In the fourth quarter, Konecranes received an order from the Virginia Port Authority for 86 automated stacking cranes. The value of the contracts exceeded EUR 200 million. This was the largest deal in the history of Konecranes. On the other hand, the fourth quarter order intake included unusually high cancel-lations for approximately EUR 18 million, the majority of which related to a single port crane project.
Order bookThe value of the order book at year-end 2016 totaled EUR 1,038.0 million (1,036.5), which was 0.1 percent higher than at the end of 2015. Service accounted for EUR 173.3 million (17 percent) and Equipment for EUR 864.7 million (83 percent) of the total end-December order book.
SalesGroup sales in the full-year 2016 decreased by 0.4 percent and totaled EUR 2,118.4 million (2,126.2). Sales in Service decreased by 2.5 percent and in Equipment by 0.7 percent.
Net sales by region, MeUR
1–12/2016 1–12/2015 change percent change % at comparable
currency rates
EMEA 1,001.4 960.5 4.3 6.2
AME 802.5 823.7 -2.6 -1.9
APEC 314.5 342.0 -8.1 -6.1
total 2,118.4 2,126.2 -0.4 1.1
The January-December profit before taxes was EUR 62.1 million (55.4).
The income taxes in January-December were EUR 24.5 million (24.6). The Group’s effective tax rate was 39.5 percent (44.4). The tax rate was affected by impairment of EUR 5.2 million (4.7) related to the previously recognized deferred tax assets in Chinese entities. The Group’s effective tax rate was 27.5 percent in 2016, excluding the impacts from the write-off of the deferred tax assets and certain transaction costs.
The January-December net profit was EUR 37.6 million (30.8).In 2016, the basic earnings per share were EUR 0.64 (0.53)
and diluted earnings per share were EUR 0.64 (0.53). In 2016, the return on capital employed was 10.3 percent
(9.5) and return on equity 8.3 percent (6.8).
Balance sheetThe year-end 2016 consolidated balance sheet amounted to EUR 1,529.9 million (1,484.9). Total equity at the end of the reporting period was EUR 445.5 million (456.0). Total equity attributable to equity holders of the parent company at year-end 2016 was EUR 445.4 million (455.9) or EUR 7.58 per share (7.79).
Net working capital at year-end 2016 totaled EUR 304.3 million (317.4). Net working capital decreased due to lower inventories.
Cash flow and financing Net cash flow from the operating activities in full-year 2016 was EUR 109.6 million (39.3). The cash flow improved mainly due to the release of the net working capital.
Cash flow related to capital expenditures amounted to EUR -27.3 million (-43.3).
Cash flow before financing activities was EUR 131.4 million (-1.5). This included proceeds of EUR 47.8 million from the disposal of shares in Kito Corporation.
Interest-bearing net debt was EUR 129.6 million (203.2) at the end of 2016. Solidity was 32.9 percent (34.8) and gearing was 29.1 percent (44.6).
The Group’s liquidity remained healthy. At the end of the year 2016, cash and cash equivalents amounted to EUR 167.4 million (80.8). None of the Group’s EUR 300 million committed back-up financing facilities were in use at the end of the period.
In in April 2016, Konecranes paid dividends to its share-holders that amounted to EUR 61.7 million or EUR 1.05 per share.
Capital expenditureIn 2016, the capital expenditure, excluding acquisitions and joint arrangements, amounted to EUR 33.8 million (49.3). This amount consisted of investments in machinery, equipment, properties, and information technology.
Capital expenditure including acquisitions and joint arrange-ments was EUR 33.8 million (49.3).
In 2016, the regional breakdown was as follows: EMEA 47 (45), Americas 38 (39), and APAC 15 (16) percent.
Currency rate effectIn a year-on-year comparison, the currency rates had a nega-tive impact on the orders and sales in January-December. The reported order intake decreased by 2.3 percent and by 0.9 percent at comparable currency rates. Reported sales decreased by 0.4 percent, but increased by 1.1 percent at comparable currency rates.
In Service, the reported January-December order intake decreased by 4.3 percent and by 2.9 percent at comparable currencies. In Equipment, the reported orders decreased by 3.2 percent and by 1.9 percent at comparable currencies. Service sales fell by 2.5 percent in reported terms and by 1.0 percent at comparable currencies. In Equipment, the corresponding figures were -0.7 percent and +0.6 percent.
Financial result In January-December, the adjusted operating profit increased by EUR 23.1 million to EUR 140.8 million (117.7). The adjusted operating margin improved to 6.6 percent (5.5). The adjusted operating margin in Service improved to 11.5 percent (10.4) and in Equipment to 4.2 percent (2.7). The adjusted operating margin improved due to the lower fixed costs in both Service and Equipment. The previous year’s adjusted operating profit in Business Area Equipment included a provision of EUR 3.3 million related to a receivable from the Latin American customer.
The consolidated operating profit in full-year 2016 totaled EUR 84.9 million (63.0), increasing in total by EUR 21.8 million. The operating profit includes adjustments of EUR -55.9 million (-54.7) comprising restructuring costs of EUR 19.2 million (20.5), transaction costs of EUR 47.0 million (17.2), and insur-ance indemnity and returned funds related to identity theft of EUR +10.2 million (0.0). The previous year’s adjustments included the unwarranted payments due to the identity theft and fraudulent actions against Konecranes in a total amount of EUR -17.0 million. The consolidated operating margin improved to 4.0 percent (3.0). The operating margin in Service rose to 10.6 percent (10.0) and in Equipment to 3.5 percent (1.5).
In 2016, the depreciation and impairments totaled EUR 53.7 million (54.0). This included write-offs of EUR 2.8 million (5.3) to intangible and tangible assets. The amortization arising from the purchase price allocations for acquisitions represented EUR 4.0 million (5.0) of the depreciation and impairments.
In 2016, the share of the result of associated companies and joint ventures was EUR 6.0 million (4.8). The EUR 5.8 million (0.0) gain on disposal of investment in associated company relates to the sale of shares in Kito Corporation.
Net financial expenses in January-December totaled EUR 34.6 million (12.5). Net interest expenses accounted for EUR 9.9 million (9.6) of this. Financial expenses include costs of EUR 15.9 million (0.0) related to the terminated merger plan with Terex and the acquisition of Terex’s MHPS business.
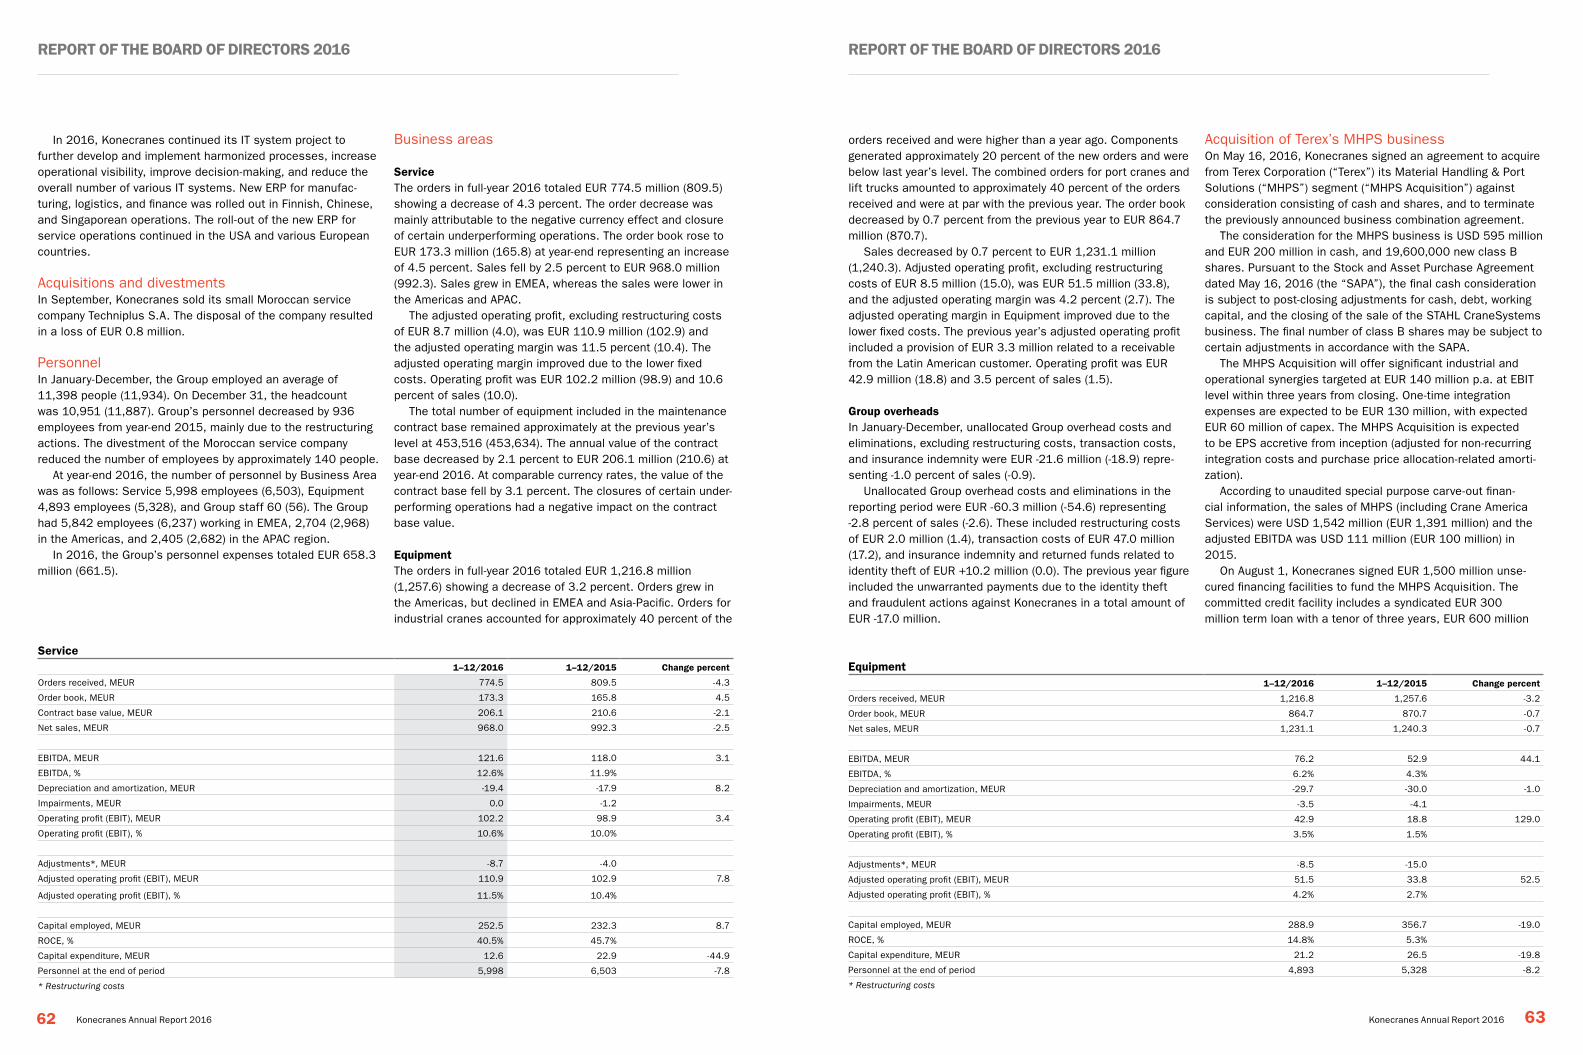
RepoRt of the BoaRd of diRectoRs 2016 RepoRt of the BoaRd of diRectoRs 2016
62 63Konecranes Annual Report 2016 Konecranes Annual Report 2016
In 2016, Konecranes continued its IT system project to further develop and implement harmonized processes, increase operational visibility, improve decision-making, and reduce the overall number of various IT systems. New ERP for manufac-turing, logistics, and finance was rolled out in Finnish, Chinese, and Singaporean operations. The roll-out of the new ERP for service operations continued in the USA and various European countries.
Acquisitions and divestmentsIn September, Konecranes sold its small Moroccan service company Techniplus S.A. The disposal of the company resulted in a loss of EUR 0.8 million.
PersonnelIn January-December, the Group employed an average of 11,398 people (11,934). On December 31, the headcount was 10,951 (11,887). Group’s personnel decreased by 936 employees from year-end 2015, mainly due to the restructuring actions. The divestment of the Moroccan service company reduced the number of employees by approximately 140 people.
At year-end 2016, the number of personnel by Business Area was as follows: Service 5,998 employees (6,503), Equipment 4,893 employees (5,328), and Group staff 60 (56). The Group had 5,842 employees (6,237) working in EMEA, 2,704 (2,968) in the Americas, and 2,405 (2,682) in the APAC region.
In 2016, the Group’s personnel expenses totaled EUR 658.3 million (661.5).
Business areas
serviceThe orders in full-year 2016 totaled EUR 774.5 million (809.5) showing a decrease of 4.3 percent. The order decrease was mainly attributable to the negative currency effect and closure of certain underperforming operations. The order book rose to EUR 173.3 million (165.8) at year-end representing an increase of 4.5 percent. Sales fell by 2.5 percent to EUR 968.0 million (992.3). Sales grew in EMEA, whereas the sales were lower in the Americas and APAC.
The adjusted operating profit, excluding restructuring costs of EUR 8.7 million (4.0), was EUR 110.9 million (102.9) and the adjusted operating margin was 11.5 percent (10.4). The adjusted operating margin improved due to the lower fixed costs. Operating profit was EUR 102.2 million (98.9) and 10.6 percent of sales (10.0).
The total number of equipment included in the maintenance contract base remained approximately at the previous year’s level at 453,516 (453,634). The annual value of the contract base decreased by 2.1 percent to EUR 206.1 million (210.6) at year-end 2016. At comparable currency rates, the value of the contract base fell by 3.1 percent. The closures of certain under-performing operations had a negative impact on the contract base value.
equipmentThe orders in full-year 2016 totaled EUR 1,216.8 million (1,257.6) showing a decrease of 3.2 percent. Orders grew in the Americas, but declined in EMEA and Asia-Pacific. Orders for industrial cranes accounted for approximately 40 percent of the
service1–12/2016 1–12/2015 change percent
Orders received, MEUR 774.5 809.5 -4.3
Order book, MEUR 173.3 165.8 4.5
Contract base value, MEUR 206.1 210.6 -2.1
Net sales, MEUR 968.0 992.3 -2.5
EBITDA, MEUR 121.6 118.0 3.1
EBITDA, % 12.6% 11.9%
Depreciation and amortization, MEUR -19.4 -17.9 8.2
Impairments, MEUR 0.0 -1.2
Operating profit (EBIT), MEUR 102.2 98.9 3.4
Operating profit (EBIT), % 10.6% 10.0%
Adjustments*, MEUR -8.7 -4.0
Adjusted operating profit (EBIT), MEUR 110.9 102.9 7.8
Adjusted operating profit (EBIT), % 11.5% 10.4%
Capital employed, MEUR 252.5 232.3 8.7
ROCE, % 40.5% 45.7%
Capital expenditure, MEUR 12.6 22.9 -44.9
Personnel at the end of period 5,998 6,503 -7.8
* Restructuring costs
orders received and were higher than a year ago. Components generated approximately 20 percent of the new orders and were below last year’s level. The combined orders for port cranes and lift trucks amounted to approximately 40 percent of the orders received and were at par with the previous year. The order book decreased by 0.7 percent from the previous year to EUR 864.7 million (870.7).
Sales decreased by 0.7 percent to EUR 1,231.1 million (1,240.3). Adjusted operating profit, excluding restructuring costs of EUR 8.5 million (15.0), was EUR 51.5 million (33.8), and the adjusted operating margin was 4.2 percent (2.7). The adjusted operating margin in Equipment improved due to the lower fixed costs. The previous year’s adjusted operating profit included a provision of EUR 3.3 million related to a receivable from the Latin American customer. Operating profit was EUR 42.9 million (18.8) and 3.5 percent of sales (1.5).
Group overheadsIn January-December, unallocated Group overhead costs and eliminations, excluding restructuring costs, transaction costs, and insurance indemnity were EUR -21.6 million (-18.9) repre-senting -1.0 percent of sales (-0.9).
Unallocated Group overhead costs and eliminations in the reporting period were EUR -60.3 million (-54.6) representing -2.8 percent of sales (-2.6). These included restructuring costs of EUR 2.0 million (1.4), transaction costs of EUR 47.0 million (17.2), and insurance indemnity and returned funds related to identity theft of EUR +10.2 million (0.0). The previous year figure included the unwarranted payments due to the identity theft and fraudulent actions against Konecranes in a total amount of EUR -17.0 million.
Acquisition of Terex’s MHPS businessOn May 16, 2016, Konecranes signed an agreement to acquire from Terex Corporation (“Terex”) its Material Handling & Port Solutions (“MHPS”) segment (“MHPS Acquisition”) against consideration consisting of cash and shares, and to terminate the previously announced business combination agreement.
The consideration for the MHPS business is USD 595 million and EUR 200 million in cash, and 19,600,000 new class B shares. Pursuant to the Stock and Asset Purchase Agreement dated May 16, 2016 (the “SAPA”), the final cash consideration is subject to post-closing adjustments for cash, debt, working capital, and the closing of the sale of the STAHL CraneSystems business. The final number of class B shares may be subject to certain adjustments in accordance with the SAPA.
The MHPS Acquisition will offer significant industrial and operational synergies targeted at EUR 140 million p.a. at EBIT level within three years from closing. One-time integration expenses are expected to be EUR 130 million, with expected EUR 60 million of capex. The MHPS Acquisition is expected to be EPS accretive from inception (adjusted for non-recurring integration costs and purchase price allocation-related amorti-zation).
According to unaudited special purpose carve-out finan-cial information, the sales of MHPS (including Crane America Services) were USD 1,542 million (EUR 1,391 million) and the adjusted EBITDA was USD 111 million (EUR 100 million) in 2015.
On August 1, Konecranes signed EUR 1,500 million unse-cured financing facilities to fund the MHPS Acquisition. The committed credit facility includes a syndicated EUR 300 million term loan with a tenor of three years, EUR 600 million
equipment1–12/2016 1–12/2015 change percent
Orders received, MEUR 1,216.8 1,257.6 -3.2
Order book, MEUR 864.7 870.7 -0.7
Net sales, MEUR 1,231.1 1,240.3 -0.7
EBITDA, MEUR 76.2 52.9 44.1
EBITDA, % 6.2% 4.3%
Depreciation and amortization, MEUR -29.7 -30.0 -1.0
Impairments, MEUR -3.5 -4.1
Operating profit (EBIT), MEUR 42.9 18.8 129.0
Operating profit (EBIT), % 3.5% 1.5%
Adjustments*, MEUR -8.5 -15.0
Adjusted operating profit (EBIT), MEUR 51.5 33.8 52.5
Adjusted operating profit (EBIT), % 4.2% 2.7%
Capital employed, MEUR 288.9 356.7 -19.0
ROCE, % 14.8% 5.3%
Capital expenditure, MEUR 21.2 26.5 -19.8
Personnel at the end of period 4,893 5,328 -8.2
* Restructuring costs
RepoRt of the BoaRd of diRectoRs 2016 RepoRt of the BoaRd of diRectoRs 2016
64 65Konecranes Annual Report 2016 Konecranes Annual Report 2016
amortizing term loan with a tenor of five years and EUR 400 million revolving credit facility with a tenor of five years along-side a EUR 200 million bridge term loan facility.
On December 29, Konecranes announced that the Board of Directors has decided on a directed share issue of 19,600,000 new class B shares to the Terex’s affiliate Terex Deutschland GmbH. The decision on the share issue was based on the authorization granted to the Board of Directors by the Extraor-dinary General Meeting of Shareholders held on September 15, 2016, to issue a maximum of 24,583,721 new class B shares to Terex or its designated affiliates.
The MHPS Acquisition was completed on January 4, 2017.
Divestment of Stahl Cranesystems businessOn December 7, Konecranes announced that it has signed an agreement with Columbus McKinnon Corporation (“Columbus McKinnon”) regarding the divestment of the STAHL CraneSys-tems business (“STAHL Divestment”). The STAHL Divestment related to the European Commission’s approval of Konecranes’ MHPS Acquisition, which was conditional on Konecranes divesting its STAHL CraneSystems business.
The STAHL Divestment was completed on January 31, 2017. However, the consolidation of STAHL CraneSystems’ operations in Konecranes’ financial statements ended already in the begin-ning of 2017.
The final selling price was EUR 224 million. Additionally, Columbus McKinnon assumed unfunded pension liabilities that were EUR 67 million as of December 31, 2016. Konecranes expects to book an after-tax capital gain of approximately EUR 200 million from the STAHL Divestment in the first quarter of 2017.
STAHL CraneSystems’ sales outside the Konecranes Group totaled approximately EUR 130 million and the EBITDA was approximately EUR 26 million in 2016.
Konecranes will use the proceeds from the STAHL CraneSys-tems divestment to amortize the loans related to the MHPS Acquisition.
Strategic alliance with Kito dissolved, Kito shares soldOn September 26, Konecranes announced that Konecranes and Kito Corporation (“Kito”) have decided to dissolve the strategic alliance signed between the companies on March 23, 2010. On September 27, Konecranes announced that it has sold 5,873,900 Kito shares to Kito. Konecranes sold the remaining 76,100 Kito shares in December. Konecranes received approxi-mately EUR 48 million from the sale of the shares.
Administration
decisions of the annual General MeetingThe Annual General Meeting of Konecranes Plc was held on March 23, 2016. The meeting approved the Company’s annual accounts for the fiscal year 2015 and discharged the members
of the Board of Directors and the Managing Directors from liability. The AGM approved the Board’s proposal to pay a divi-dend of EUR 1.05 per share from the distributable equity of the parent company.
The AGM approved the proposal of the Nomination and Compensation Committee that the number of the members of the Board of Directors shall be six (6). The Board members elected at the AGM in 2016 were Mr. Svante Adde, Mr. Stig Gustavson, Mr. Ole Johansson, Mr. Bertel Langenskiöld, Ms. Malin Persson, and Mr. Christoph Vitzthum.
The AGM confirmed the annual compensation to the Board members as follows:• Chairman of the Board: EUR 105,000• Vice Chairman of the Board: EUR 67,000• Other Board members EUR 42,000
In addition, a compensation of EUR 1,500 per meeting will be paid for attending the meetings of the Board Committee. However, the Chairman of the Audit Committee is entitled to a compensation of EUR 3,000 per attended Audit Committee meeting. Furthermore, the AGM approved that 50 percent of the annual remuneration will be paid in Konecranes shares.
The AGM confirmed that Ernst & Young Oy will continue as the Company’s external auditor.
The AGM authorized the Board of Directors to decide on the repurchase of the Company’s own shares and/or on the accept-ance of the Company’s own shares as a pledge. The amount of own shares to be repurchased and/or accepted as pledge based on this authorization shall not exceed 6,000,000 shares in total, which corresponds to approximately 9.5 percent of all of the shares in the Company. The authorization is effective until the end of the next Annual General Meeting, however, no longer than until September 22, 2017.
The AGM authorized the Board of Directors to decide on the issuance of shares as well as on the issuance of special rights entitling to shares referred to in Section 1 of Chapter 10 of the Finnish Companies Act. The amount of shares to be issued based on this authorization shall not exceed 6,000,000 shares, which corresponds to approximately 9.5 percent of all of the shares in the Company. The authorization can also be used for incentive arrangements, however, not more than 700,000 shares in total together with the authorization in the next paragraph. The authorization is effective until the end of the next Annual General Meeting, however, no longer than until September 22, 2017. However, the authorization for incentive arrangements is valid until March 22, 2021. This authorization revokes the authorization for incentive arrangements given by the Annual General Meeting 2015.
The AGM authorized the Board of Directors to decide on the transfer of the Company’s own shares. The authorization is limited to a maximum of 6,000,000 shares, which corresponds to approximately 9.5 percent of all the shares in the Company. The authorization can also be used for incentive arrangements, however, not more than 700,000 shares in total together with the authorization in the previous paragraph. This authorization
is effective until the next Annual General Meeting of Share-holders, however, no longer than until September 22, 2017. However, the authorization for incentive arrangements is valid until March 22, 2021. This authorization revokes the authori-zation for incentive arrangements given by the Annual General Meeting 2015.
The AGM authorized the Board of Directors to decide on directed share issue without payment needed for the imple-mentation of the Share Savings Plan that the Annual General Meeting 2012 decided to launch.
The AGM authorized the Board of Directors to decide on the issue of new shares or on the transfer of own shares held by the Company to such participants of the Plan who, according to the terms and conditions of the Plan, are entitled to receive free shares, as well as to decide on the share issue without payment also to the Company itself. The number of new shares to be issued or own shares held by the Company to be trans-ferred may in the aggregate amount to a maximum total of 500,000 shares, which corresponds to 0.8 per cent of all of the Company’s shares. The authorization concerning the share issue is valid until March 22, 2021. This authorization is in addi-tion to the authorizations in the previous items. This authoriza-tion replaces the authorization for the Share Savings Plan given by the Annual General Meeting 2015.
Board of directors’ organizing meetingAt its first meeting held after the Annual General Meeting, the Board of Directors elected Mr. Christoph Vitzthum Chairman of the Board and Mr. Stig Gustavson Vice Chairman of the Board. Mr. Svante Adde was elected Chairman of the Audit Committee, and Mr. Ole Johansson and Ms. Malin Persson as Committee members. Mr. Bertel Langenskiöld was elected Chairman of the Nomination and Compensation Committee, and Mr. Stig Gustavson and Mr. Christoph Vitzthum as Committee members.
With the exception of Mr. Stig Gustavson, the Board members are deemed to be independent of the company under the Finnish Corporate Governance Code. Mr. Gustavson is not deemed independent of the company based on the Board’s overall evaluation relating to his former and current positions in Konecranes combined with his substantial voting rights in the Company.
With the exception of Mr. Ole Johansson and Mr. Bertel Langenskiöld, the Board members are independent of signif-icant shareholders of the company. Mr. Ole Johansson is not deemed independent of significant shareholders of the Company based on his current position as the Chairman of the Board of Hartwall Capital Oy Ab. Mr. Langenskiöld is not deemed independent of significant shareholders of the company based on his position as the Managing Director of Hartwall Capital Oy Ab until August 31, 2015. HTT KCR Holding Oy Ab holds more than 10 percent of Konecranes Plc’s shares and votes. HTT KCR Holding Oy Ab is a subsidiary of Hartwall Capital Oy Ab.
decisions of the extraordinary General MeetingThe Extraordinary General Meeting (“General Meeting”) of Kone-cranes was held on September 15. The meeting approved all the proposals of the Board of Directors and made the neces-sary decisions to complete the MHPS Acquisition. In addition, the General Meeting approved the shareholder’s proposal for additional remuneration to members of the Board of Directors.
The General Meeting approved the Board of Directors’ proposal that the Articles of Association of the company be amended. The amendments to the Articles of Association include, inter alia, the creation of a new class of B shares to be issued to Terex in connection with the closing of the MHPS Acquisition, which have the same financial rights as Kone-cranes ordinary shares but are subject to voting and transfer restrictions, and confer upon Terex the right to appoint up to two members to the Board of Directors of Konecranes, as long as Terex’s or its Group companies’ shareholding in Konecranes exceeds certain specified thresholds. As long as Terex or any of its Group companies owns class B shares, any amendment of the Articles of Association relating to class B shares requires the consent of Terex.
Terex has informed the company that its initial Board appoin-tees will be David Sachs and Oren Shaffer, whose term as members of the Board of Directors will begin as of the closing of the MHPS Acquisition.
The General Meeting authorized the Board of Directors to decide on the issuance of a maximum of 24,583,721 new class B shares in deviation from the shareholders’ pre-emptive subscription rights during the effective period of the authoriza-tion. The authorization concerns issuance of B shares to Terex or its designated affiliates as payment of the share consid-eration, including the additional share consideration, if any, payable by Konecranes in the MHPS Acquisition.
The EGM further authorized the Board of Directors to resolve on all other terms and conditions of the issuance of shares. This authorization is effective until December 31, 2017 and it will not revoke the authorizations granted to the Board of Directors to decide on the issuance of shares and special rights entitling to shares by the Annual General Meeting on March 23, 2016.
The General Meeting confirmed the annual remuneration payable to the members of the Board of Directors to be as of the closing of the Acquisition as follows: Chairman of the Board EUR 140,000, Vice Chairman of the Board EUR 100,000, and the other Board members: EUR 70,000.
The amount of annual remuneration payable to the members of the Board of Directors until the closing of the Acquisition is based on the resolution made at the Annual General Meeting on March 23, 2016, and the proposed increased remuneration would be payable pro rata for the term of office between closing of the Acquisition and the Annual General Meeting in 2017.
Otherwise, the annual remuneration for the members of the Board of Directors will be paid as resolved by the Annual General Meeting on March 23, 2016 including the payment of 50 percent of the annual remuneration in Konecranes shares.
RepoRt of the BoaRd of diRectoRs 2016 RepoRt of the BoaRd of diRectoRs 2016
66 67Konecranes Annual Report 2016 Konecranes Annual Report 2016
The General Meeting approved the shareholder’s, HTT KCR Holding Oy Ab, proposal for additional remuneration to the members of Konecranes’ Board of Directors.
All members of the Board of Directors shall be additionally remunerated for attending meetings of the Board of Directors during the period from Konecranes’ Annual General Meeting held on March 23, 2016 until the closing of the Acquisition (or the next Annual General Meeting of Konecranes, unless the Acquisition has been closed prior to that). The compensation paid to each member of the Board of Directors shall be EUR 1,500 for each meeting the relevant member of the Board of Directors has attended.
The members of the negotiation team shall be paid the following additional one-time compensation: EUR 60,000 to Stig Gustavson, Bertel Langenskiöld, and Christoph Vitzthum each, and EUR 30,000 to Svante Adde.
The accrued compensation per attended meeting of the Board of Directors and the one-time compensation payable to the members of the Board of Directors shall be paid in cash. Christoph Vitzthum, the Chairman of the Board of Directors, has informed Konecranes that he will forgo his one-time compensa-tion.
The General Meeting approved the proposal of the Nomi-nation and Compensation Committee that the number of members of the Board of Directors shall be increased to eight (8) as of the closing of the General Meeting.
The General Meeting further approved that the number of the members of the Board of Directors shall be increased to ten (10) as of the closing of the Acquisition when the two members of the Board of Directors appointed by Terex join the Board of Directors.
The EGM elected two new members of the Board of Directors for a term of office ending at the closing of the Annual General Meeting in 2017. The new members are Ms. Janina Kugel and Mr. Ulf Liljedahl.
The Board of Directors elected Janina Kugel as a member of the Nomination and Compensation Committee and Ulf Liljedahl as a member of the Audit Committee.
After the elections, the Nomination and Compensation Committee consists of Bertel Langenskiöld (Chairman), Stig Gustavson, Janina Kugel, and Christoph Vitzthum. The Audit Committee consists of Svante Adde (Chairman), Ole Johansson, Ulf Liljedahl, and Malin Persson.
changes in ManagementOn April 27, 2016, Konecranes announced that Ryan Flynn, Executive Vice President and Head of Business Area Equip-ment, is leaving Konecranes to pursue other interests. Presi-dent and CEO Panu Routila assumed the position of Head of Business Area Equipment, in addition to his existing duties, as of May 1, 2016.
On July 14, 2016, Konecranes announced that Sirpa Poitsalo (b. 1963), Vice President, General Counsel, has been appointed a member of the Konecranes Group Executive Board and will report to Panu Routila, President & CEO.
changes to segment reporting and Group executive BoardOn December 15, 2016, Konecranes announced that its Board of Directors has made decisions on the new reporting segments and new members of the Group Executive Board (“GXB”) subject to the closing of the MHPS Acquisition. As of January 1, 2017, Konecranes will report three business areas: Service, Industrial Equipment and Port Solutions.
Mika Mahlberg was appointed as Executive Vice President, Business Area Port Solutions, and as a member of the Kone-cranes GXB. Susanna Schneeberger was appointed as Exec-utive Vice President, Strategy, and as a member of the Kone-cranes GXB.
As of closing of the MHPS Acquisition, the Konecranes GXB will consist of the following members:
Mr. Panu Routila, President and CEOMr. Teo Ottola, CFO and Deputy CEOMr. Fabio Fiorino, Executive Vice President, Business Area ServiceMr. Mikko Uhari, Executive Vice President, Business Area Indus-trial EquipmentMr. Mika Mahlberg, Executive Vice President, Business Area Port SolutionsMr. Juha Pankakoski, Executive Vice President, TechnologiesMs. Susanna Schneeberger, Executive Vice President, StrategyMr. Timo Leskinen, Senior Vice President, Human ResourcesMs. Sirpa Poitsalo, Senior Vice President, General Counsel
corporate Governance statementKonecranes complies with the Finnish Corporate Governance Code 2015 approved by the Board of the Securities Market Association. Konecranes has issued a Corporate Governance Statement as a separate report, which can be reviewed on the Konecranes corporate website at www.konecranes.com.
Share capital and sharesThe company’s registered share capital totaled EUR 30.1 million on December 31, 2016 and the number of shares including treasury shares was 63,272,342.
On December 31, 2016, Konecranes Plc was in the posses-sion of 4,521,333 own shares, which corresponds to 7.1 percent of the total number of shares having a market value of EUR 152.7 million on that date.
All shares carry one vote per share and equal rights to divi-dends.
Shares subscribed for under stock option rightsThe share subscription period for the stock options 2009C ended on April 30. The stock options 2009C entitled to the subscriptions of a total of 638,500 shares. There were no share subscriptions during the subscription period pursuant to the stock options 2009C.
Market capitalization and trading volume The closing price for Konecranes Plc’s shares on the Nasdaq Helsinki was EUR 33.78 on December 31, 2016. The volume-weighted average share price in January-December was EUR 25.38, the highest price being EUR 36.89 in December and the lowest EUR 17.92 in January. In January–December, the trading volume on the Nasdaq Helsinki totaled 55.6 million of the Konecranes Plc’s shares, corresponding to a turnover of approximately EUR 1,411.3 million. The average daily trading volume was 220,693 shares, representing an average daily turnover of EUR 5.6 million.
In addition, approximately 82.5 million Konecranes’ shares were traded on other trading venues (e.g. multilateral trading facilities and bilateral OTC trades) in 2016 according to Fidessa.
On December 31, 2016, the total market capitalization of the Konecranes Plc’s shares on the Nasdaq Helsinki was EUR 2,137.3 million including treasury shares. The market capitali-zation was EUR 1,984.6 million, excluding the treasury shares.
Flagging notificationsOn February 23, 2016, Konecranes received a disclosure under Chapter 9, Section 5 of the Securities Market Act, according to which the holding of Sanderson Asset Management LLP in Konecranes Plc has decreased below 5 percent. Sanderson Asset Management LLP held 3,161,739 Konecranes Plc’s shares on February 22, 2016, which is 4.99 percent of the Konecranes Plc’s shares and votes.
On July 25, 2016, Konecranes received a disclosure under Chapter 9, Section 5 of the Securities Market Act, according to which the holding of Harris Associates Investment Trust (Oakmark International Small Cap Fund) in Konecranes Plc has decreased below 5 percent. Harris Associates Investment Trust (Oakmark International Small Cap Fund) held 3,106,800 Kone-cranes Plc’s shares on July 22, 2016, which is 4.91 percent of the Konecranes Plc’s shares and votes.
On August 17, 2016, Konecranes received a disclosure under Chapter 9, Section 5 of the Securities Market Act, according to which the holding of Sanderson Asset Manage-ment LLP in Konecranes Plc has exceeded 5 percent. Sanderson Asset Management LLP held 3,230,546 Kone-cranes Plc’s shares on August 16, 2016, which is 5.11 percent of the Konecranes Plc’s shares and votes.
On September 9, 2016, Konecranes received a notifica-tion under Chapter 9, Section 5 of the Securities Market Act, according to which the total holding of BlackRock, Inc. in Konecranes Plc’s shares and votes has exceeded 5 percent. On September 8, 2016, Blackrock Inc.’s total holding through shares and financials instruments amounted to 5.05 percent of the Konecranes Plc’s shares and votes.
On October 5, 2016, Konecranes received a disclosure under Chapter 9, Section 5 of the Securities Market Act, according to which the holding of Harris Associates L.P. in Konecranes Plc has decreased below 5 percent. Harris Associ-ates L.P. held 3,152,800 Konecranes Plc’s shares on October
Performance share planOn June 15, 2016, Konecranes announced that the Board has resolved to establish a new share-based incentive plan directed to the Group key employees. The long-term incentive plan consists of one discretionary period, calendar year 2016. Approximately 200 key employees, including the members of the Group Executive Board and Senior Management, belong to the target group of the plan.
The potential reward from the plan will be based on the continuation of the key employee s employment or service and on the Konecranes Group’s adjusted earnings before interest, taxes, depreciation and amortization (EBITDA). The rewards to be paid on the basis of the plan correspond to an approximate maximum total number of 700,000 Konecranes Plc shares, also including the portion to be paid in cash.
The potential reward from the plan will be paid partly in Kone-cranes shares and partly in cash after the discretionary period, by the end of August 2017. The cash proportion is intended to cover taxes and tax-related costs arising from the reward to a key employee. The shares paid as reward may not be trans-ferred during a restriction period established for the shares. The restriction period shall begin from reward payment and end on December 31, 2018.
The members of the Group Executive Board and Senior Management must retain 50 percent of net shares received on the basis of the plan until such member s share ownership equals his or her annual gross base salary. Such number of shares must be held as long as such member s employment or service at Konecranes continues.
Employee share savings planOn February 23, 2016, the Board of Directors of Konecranes Plc decided on a directed share issue related to the reward payment for the Savings Period 2012-2013 of the Konecranes Employee Share Savings Plan. In the share issue, 18,580 Kone-cranes Plc shares held by the company were conveyed without consideration to the employees participating in the plan in accordance with the terms and conditions of the plan.
On June 15, 2016, Konecranes announced that the Board has decided to launch a new Plan Period. The new plan period will begin on September 1, 2016 and end on June 30, 2017. The maximum savings amount per participant during one month is 5 percent of gross salary and the minimum is EUR 50. Each participant will receive one free matching share for every two acquired savings shares. Matching shares will be delivered to a participant if the participant holds the acquired shares from the plan period until the end of the designated holding period, February 15, 2020, and if his or her employment has not ended before this date for reasons attributable to the employee. The total amount of all savings of the commencing plan period may not exceed EUR 8.5 million. The terms and conditions of the Plan Period 2016–2017 are unchanged from the previous Plan Periods.
Shares will be acquired with the accrued savings at the market price quarterly, after the publication dates of the Kone-cranes interim results, commencing in October 2016.
RepoRt of the BoaRd of diRectoRs 2016 RepoRt of the BoaRd of diRectoRs 2016
68 69Konecranes Annual Report 2016 Konecranes Annual Report 2016
4, 2016, which is 4.98 percent of the Konecranes Plc’s shares and votes.
Research and developmentIn 2016, Konecranes’ research and product development expenditure totaled EUR 22.3 (28.7) million, representing 1.1 (1.3) percent of sales. R&D expenditure includes product devel-opment projects aimed at improving the quality and cost effi-ciency of both products and services.
In 2016, our development work focused on leveraging the connected data our technologies provide to create superior Industrial Internet applications. Preventive maintenance and usage analysis solutions took priority among these, centering upon further development of our TRUCONNECT systems. The remote operation of cranes was another strong focus area.
In February, Konecranes presented its repositioned TRUCON-NECT Remote Service suite and improved functionality of the yourKONECRANES.com customer portal, which became avail-able to customers in more countries. Furthermore, Konecranes and Aalto University agreed on cooperation within the area of Industrial Internet. Moreover, Konecranes hosted its third hack-athon event: the “Maritime Hack – Automated cargo handling.”
In June, Konecranes announced an all-new container weighing system for lift trucks. The system can be retrofitted to existing machines, and allows the reach stacker to measure the weight of the lifted container with one percent full-scale accu-racy in less than five seconds. Our fully embedded weighing solutions enable seamless interchange of data with the custom-er’s TOS/TMS or ERP system.
In addition, in June, 2016 Konecranes introduced the new BOXPORTER rail mounted gantry crane. BOXPORTER offers the clearest view in intermodal container handling, with its new cabin giving the operator superb visibility and comfort. It also gives the operator an extended view to truck and train loading and unloading and container stacking thanks to video and control information displayed on the cabin monitor.
Corporate responsibility2016 was a busy year to our personnel due to M&A activi-ties and organizational changes. The matrix organization was dismantled in favor of direct product line organization. Internal changes continued with rationalization of the management layers and streamlining of the organization.
In June, we undertook an employee survey on the MHPS Acquisition, which included some parts of employee satisfaction surveys in earlier years to offer continuous progress tracking. A comparison to the earlier employee satisfaction surveys showed that the employee satisfaction and engagement had improved since 2015.
We decided to take a common learning management system globally into use and its implementation was completed in the original pilot areas and is progressing to other countries. Moreover, people-centered key performance indicators were developed further and information created by analyzing data
was made visible for the management to support fact-based decision-making.
Konecranes safety policy was renewed in 2016. We continued our serious injury and fatality (“SIF”) prevention program, i.e. focusing on deeper analysis and incident investi-gations of cases with SIF potential, in terms of both incidents and near-misses. During 2016, we also introduced a glob-ally harmonized template and a practice of the dynamic risk assessment at the job site in our service business. The LTA1 indicator for work-related accidents improved to 5.8 (5.9). There were no occupational fatalities.
Similarly to the occupational safety, we issued a completely renewed environmental policy in 2016. Many locations imple-mented energy-efficiency enhancing actions, such as installing improved compressed air systems and solar panels and changing to LED lights.
We continued reporting on our progress to external investor ratings, such as CDP. In the CDP survey, Konecranes achieved result B (98 C), which implies that Konecranes has taken actions to address the environmental issues beyond initial screenings or assessments. During 2016, Konecranes actively took part in creating a Finnish Circular Economy roadmap, moderated by Sitra, a Finland-based future fund.
One key effort during 2016 was the roll out of e-learning to address fraud prevention and to teach employees to recognize the most typical signs of fraud. It also highlighted the impor-tance of our internal controls and promoted our confidential whistleblower channel.
We continued professional management of our suppliers as in the previous years. In addition, we continued piloting deeper corporate responsibility audits by a third party. The first in-depth third-party corporate responsibility audits took place in China at the end of 2015 and the pilot continued in India during 2016. In total, over 20 in-depth audits were conducted.
Risks and uncertaintiesKonecranes operates in the emerging countries that entail polit-ical, economic, and regulatory uncertainties. Adverse changes in the operating environment of these countries may result in currency losses, elevated delivery costs, or loss of assets. Konecranes operates a crane factory in Zaporozhye, Ukraine. On December 31, 2016, the value of the total assets related to the Zaporozhye factory amounted to approximately EUR 7 million.
The operations in emerging countries have had a negative impact on the aging structure of accounts receivable and may increase credit losses or the need for higher provisions for doubtful accounts.
Konecranes has made several acquisitions and expanded organically into new countries. A failure to integrate the acquired businesses, MHPS in particular, or grow newly estab-lished operations may result in a decrease in profitability and impairment of goodwill and other assets.
One of the key strategic initiatives of Konecranes is oneKONECRANES. This initiative involves a major capital expenditure for the information systems. A higher-than-expected development or implementation costs, or a failure to extract business benefits from the new processes and systems may lead to an impairment of assets or decrease in profitability.
Konecranes delivers projects, which involve the risks related to, for example, engineering and project execution including Konecranes’ suppliers. A failure to plan or manage these projects may lead to higher-than-estimated costs or disputes with customers.
Challenges in financing, e.g., due to currency fluctuations, may force customers to postpone projects or even cancel the existing orders. Konecranes intends to avoid incurring costs for major projects under construction in excess of advance payments. However, it is possible that the cost-related commit-ments in some projects temporarily exceed the amount of advance payments.
The Group’s other risks are presented in the Annual Report.
LitigationVarious legal actions, claims, and other proceedings are pending against the Group in different countries. These actions, claims, and other proceedings are typical for this industry and are consistent with the global business offering that encom-passes a wide range of products and services. These matters involve contractual disputes, warranty claims, product liability (including design defects, manufacturing defects, failure to warn, and asbestos legacy), employment, auto liability, and other matters involving general liability claims
Events after the end of the reporting periodOn January 4, 2017, Konecranes announced that it has completed the MHPS Acquisition. On January 5, 2017, Kone-cranes announced that the 19,600,000 new class B shares issued to Terex Deutschland GmbH have been registered with the Finnish Trade Register and Euroclear Finland Ltd. Following entry of the Shares into the Finnish Trade Register, the total number of the Konecranes’ shares equals 82,872,342, which is divided to 63,272,342 class A shares and 19,600,000 class B shares.The new class B shares will entitle to dividends and other rights as from the registration date. The class B shares will not be applied for public trading. Konecranes’ trading code changed in the Nasdaq Helsinki’s trading system from KCR1V to KCR as of January 5, 2017.
As approved by the Extraordinary General Meeting held September 15, 2016, the number of members of the Board of Directors increased to ten (10) after the closing of the MHPS Acquisition as Terex is entitled to elect up to two members to the Board of Directors as long as Terex’s or its Group compa-nies’ shareholding in Konecranes exceeds certain agreed thresholds. On January 5, 2017, Terex nominated David Sachs and Oren Shaffer joined the Board of Directors. The Board of
Directors elected Oren Shaffer a member of the Nomination and Compensation Committee and David Sachs a member of the Audit Committee.
On January 5, 2017, Konecranes received a notification under Chapter 9, Section 5 of the Securities Market Act, according to which the holding of Terex Deutschland GmbH in the Konecranes Plc’s shares and votes has exceeded 20 percent. Terex Deutschland GmbH held 19,600,000 Kone-cranes Plc’s shares on January 5, which is 23.65 percent of the Konecranes Plc’s shares and votes.
On January 5, 2017, Konecranes received a notification under Chapter 9, Section 5 of the Securities Market Act according to which the holding of HTT KCR Holding Ab in the Konecranes Plc’s shares and votes has decreased below 10 percent due to dilution related to the Konecranes Plc’s share issue. HTT KCR Holding Ab held 6,870,568 Konecranes Plc’s shares on January 5, which is 8.29 percent of the Konecranes Plc’s shares and votes.
On January 6, 2017, Konecranes received a notification under Chapter 9, Section 5 of the Securities Market Act, according to which the holding of Polaris Capital Management LLC in the Konecranes Plc’s shares and votes has decreased below 5 percent due to dilution related to the Konecranes Plc’s share issue. Polaris Capital Management LLC held 3,597,639 Konecranes Plc’s shares on January 5, which is 4.34 percent of the Konecranes Plc’s shares and votes.
On January 6, 2017, Konecranes received a notification under Chapter 9, Section 5 of the Securities Market Act according to which the holding of BlackRock, Inc. in the Kone-cranes Plc’s shares and votes has decreased below 5 percent due to dilution related to the Konecranes Plc’s share issue.
On January 9, 2017, Konecranes received a notification under Chapter 9, Section 5 of the Securities Market Act according to which the holding of Sanderson Asset Manage-ment LLP in the Konecranes Plc’s shares and votes has decreased below 5 percent due to dilution related to the Kone-cranes Plc’s share issue. Sanderson Asset Management LLP held 3,201,628 Konecranes Plc’s shares on January 6, which is 3.86 percent of the Konecranes Plc’s shares and votes.
On January 9, 2017, Konecranes received a notification under Chapter 9, Section 5 of the Securities Market Act, according to which the holding of Terex Deutschland GmbH in the Konecranes Plc’s shares and votes has fallen below 5 percent, as a result of an intra-group transfer and the holding of Terex Corporation in the Konecranes Plc’s shares and votes has exceeded 20 percent. Terex Corporation held 19,600,000 Kone-cranes Plc’s shares on January 6, which is 23.65 percent of the Konecranes Plc’s shares and votes.
On January 31, 2017, Konecranes announced that it has completed the STAHL Divestment.
Market outlookCustomers are cautious about investing due to modest volume growth in manufacturing and process industries, as well as
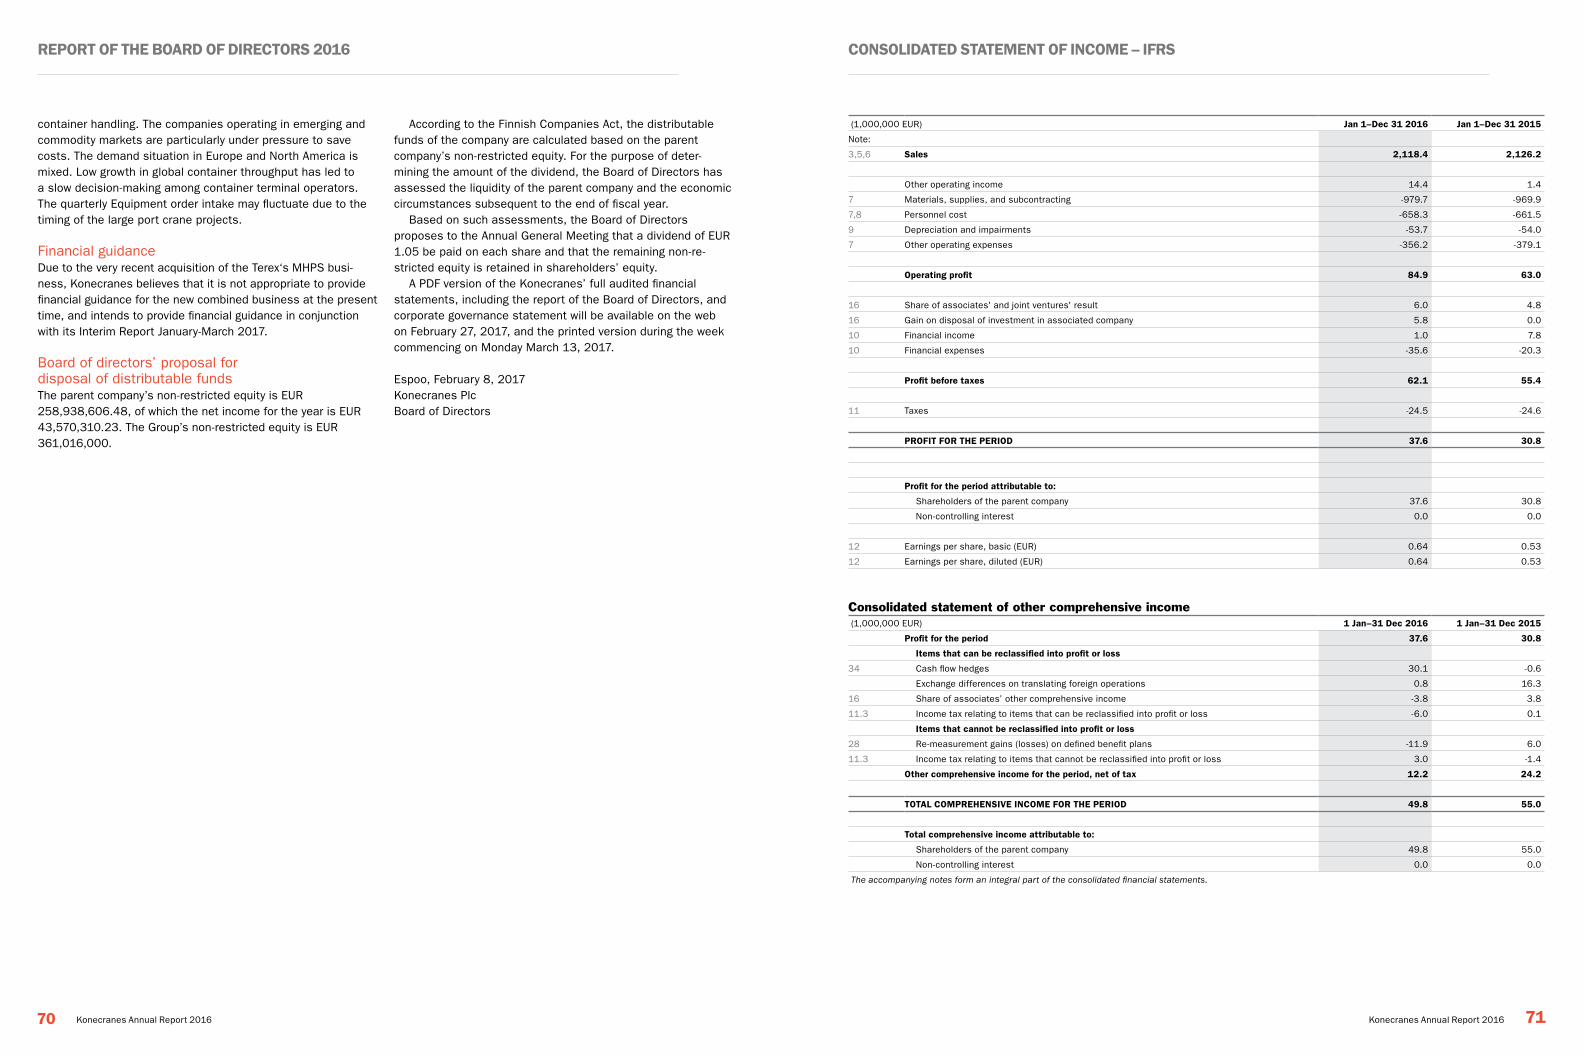
RepoRt of the BoaRd of diRectoRs 2016 coNsolidated stateMeNt of iNcoMe – ifRs
70 71Konecranes Annual Report 2016 Konecranes Annual Report 2016
(1,000,000 EUR) Jan 1–dec 31 2016 Jan 1–dec 31 2015
Note:
3,5,6 sales 2,118.4 2,126.2
Other operating income 14.4 1.4
7 Materials, supplies, and subcontracting -979.7 -969.9
7,8 Personnel cost -658.3 -661.5
9 Depreciation and impairments -53.7 -54.0
7 Other operating expenses -356.2 -379.1
operating profit 84.9 63.0
16 Share of associates' and joint ventures' result 6.0 4.8
16 Gain on disposal of investment in associated company 5.8 0.0
10 Financial income 1.0 7.8
10 Financial expenses -35.6 -20.3
profit before taxes 62.1 55.4
11 Taxes -24.5 -24.6
pRofit foR the peRiod 37.6 30.8
profit for the period attributable to:
Shareholders of the parent company 37.6 30.8
Non-controlling interest 0.0 0.0
12 Earnings per share, basic (EUR) 0.64 0.53
12 Earnings per share, diluted (EUR) 0.64 0.53
Consolidated statement of other comprehensive income (1,000,000 EUR) 1 Jan–31 dec 2016 1 Jan–31 dec 2015
profit for the period 37.6 30.8
items that can be reclassified into profit or loss
34 Cash flow hedges 30.1 -0.6
Exchange differences on translating foreign operations 0.8 16.3
16 Share of associates’ other comprehensive income -3.8 3.8
11.3 Income tax relating to items that can be reclassified into profit or loss -6.0 0.1
items that cannot be reclassified into profit or loss
28 Re-measurement gains (losses) on defined benefit plans -11.9 6.0
11.3 Income tax relating to items that cannot be reclassified into profit or loss 3.0 -1.4
other comprehensive income for the period, net of tax 12.2 24.2
total coMpReheNsiVe iNcoMe foR the peRiod 49.8 55.0
total comprehensive income attributable to:
Shareholders of the parent company 49.8 55.0
Non-controlling interest 0.0 0.0
The accompanying notes form an integral part of the consolidated financial statements.
container handling. The companies operating in emerging and commodity markets are particularly under pressure to save costs. The demand situation in Europe and North America is mixed. Low growth in global container throughput has led to a slow decision-making among container terminal operators. The quarterly Equipment order intake may fluctuate due to the timing of the large port crane projects.
Financial guidanceDue to the very recent acquisition of the Terex‘s MHPS busi-ness, Konecranes believes that it is not appropriate to provide financial guidance for the new combined business at the present time, and intends to provide financial guidance in conjunction with its Interim Report January-March 2017.
Board of directors’ proposal for disposal of distributable fundsThe parent company’s non-restricted equity is EUR 258,938,606.48, of which the net income for the year is EUR 43,570,310.23. The Group’s non-restricted equity is EUR 361,016,000.
According to the Finnish Companies Act, the distributable funds of the company are calculated based on the parent company’s non-restricted equity. For the purpose of deter-mining the amount of the dividend, the Board of Directors has assessed the liquidity of the parent company and the economic circumstances subsequent to the end of fiscal year.
Based on such assessments, the Board of Directors proposes to the Annual General Meeting that a dividend of EUR 1.05 be paid on each share and that the remaining non-re-stricted equity is retained in shareholders’ equity.
A PDF version of the Konecranes’ full audited financial statements, including the report of the Board of Directors, and corporate governance statement will be available on the web on February 27, 2017, and the printed version during the week commencing on Monday March 13, 2017.
Espoo, February 8, 2017Konecranes PlcBoard of Directors
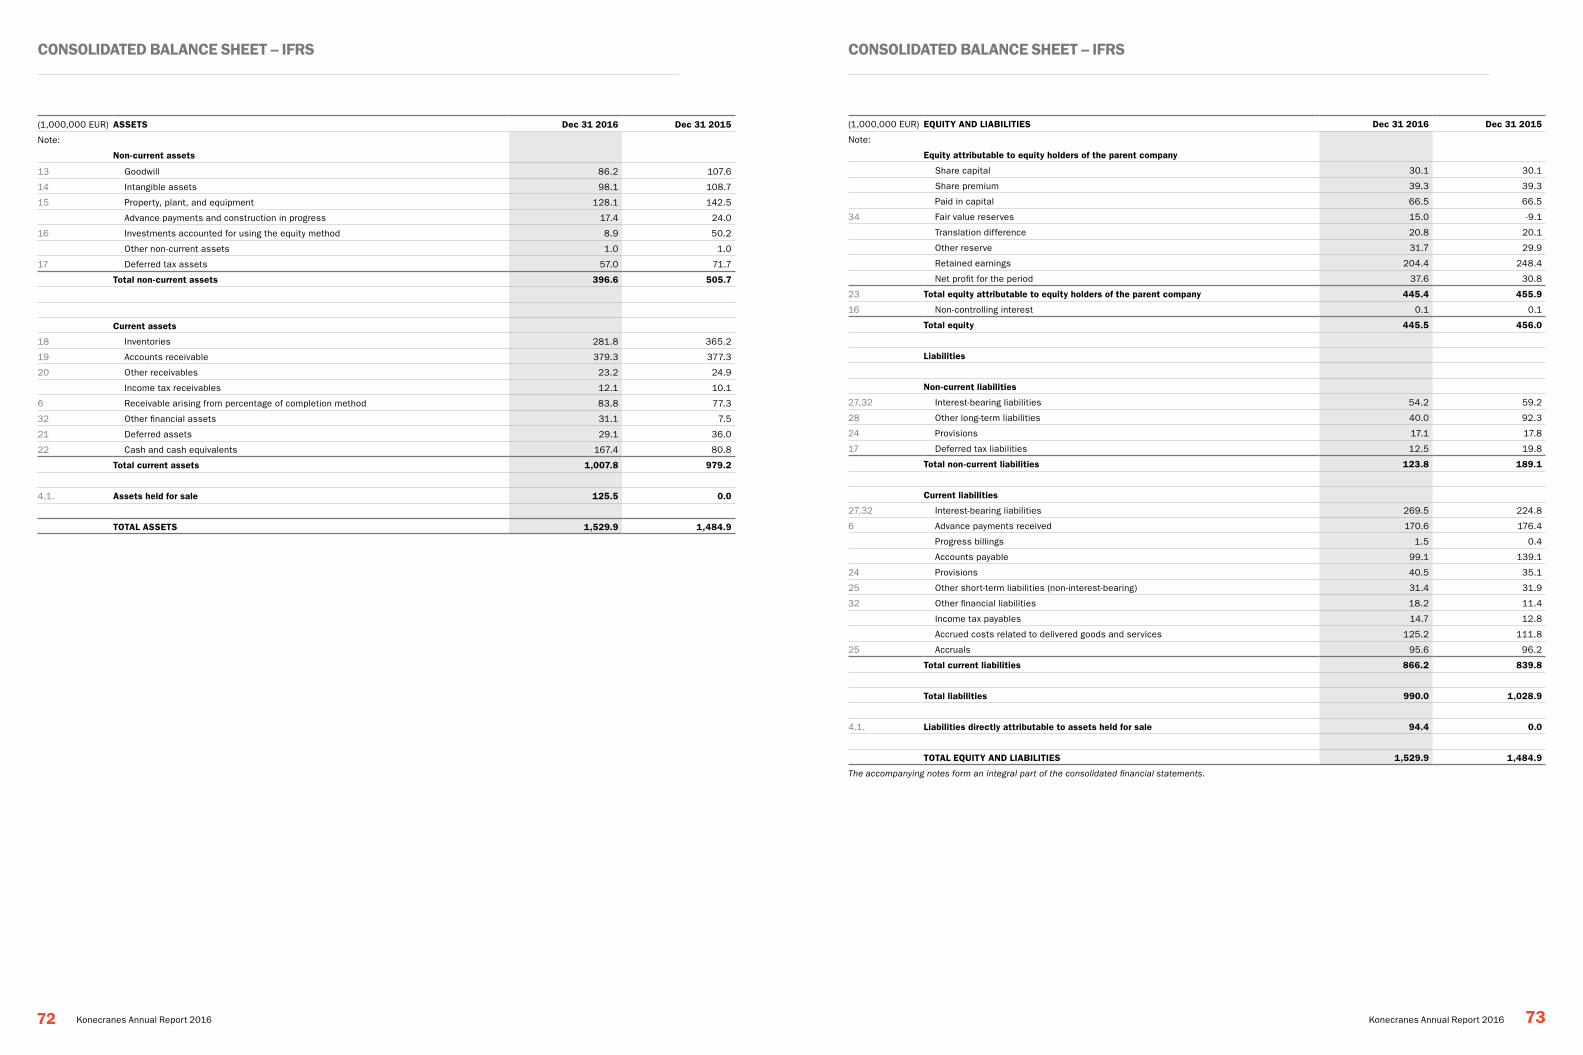
coNsolidated BalaNce sheet – ifRs coNsolidated BalaNce sheet – ifRs
72 73Konecranes Annual Report 2016 Konecranes Annual Report 2016
(1,000,000 EUR) assets dec 31 2016 dec 31 2015
Note:
Non-current assets
13 Goodwill 86.2 107.6
14 Intangible assets 98.1 108.7
15 Property, plant, and equipment 128.1 142.5
Advance payments and construction in progress 17.4 24.0
16 Investments accounted for using the equity method 8.9 50.2
Other non-current assets 1.0 1.0
17 Deferred tax assets 57.0 71.7
total non-current assets 396.6 505.7
current assets
18 Inventories 281.8 365.2
19 Accounts receivable 379.3 377.3
20 Other receivables 23.2 24.9
Income tax receivables 12.1 10.1
6 Receivable arising from percentage of completion method 83.8 77.3
32 Other financial assets 31.1 7.5
21 Deferred assets 29.1 36.0
22 Cash and cash equivalents 167.4 80.8
total current assets 1,007.8 979.2
4.1. assets held for sale 125.5 0.0
total assets 1,529.9 1,484.9
(1,000,000 EUR) eQUitY aNd liaBilities dec 31 2016 dec 31 2015
Note:
equity attributable to equity holders of the parent company
Share capital 30.1 30.1
Share premium 39.3 39.3
Paid in capital 66.5 66.5
34 Fair value reserves 15.0 -9.1
Translation difference 20.8 20.1
Other reserve 31.7 29.9
Retained earnings 204.4 248.4
Net profit for the period 37.6 30.8
23 total equity attributable to equity holders of the parent company 445.4 455.9
16 Non-controlling interest 0.1 0.1
total equity 445.5 456.0
liabilities
Non-current liabilities
27,32 Interest-bearing liabilities 54.2 59.2
28 Other long-term liabilities 40.0 92.3
24 Provisions 17.1 17.8
17 Deferred tax liabilities 12.5 19.8
total non-current liabilities 123.8 189.1
current liabilities
27,32 Interest-bearing liabilities 269.5 224.8
6 Advance payments received 170.6 176.4
Progress billings 1.5 0.4
Accounts payable 99.1 139.1
24 Provisions 40.5 35.1
25 Other short-term liabilities (non-interest-bearing) 31.4 31.9
32 Other financial liabilities 18.2 11.4
Income tax payables 14.7 12.8
Accrued costs related to delivered goods and services 125.2 111.8
25 Accruals 95.6 96.2
total current liabilities 866.2 839.8
total liabilities 990.0 1,028.9
4.1. liabilities directly attributable to assets held for sale 94.4 0.0
total eQUitY aNd liaBilities 1,529.9 1,484.9
The accompanying notes form an integral part of the consolidated financial statements.
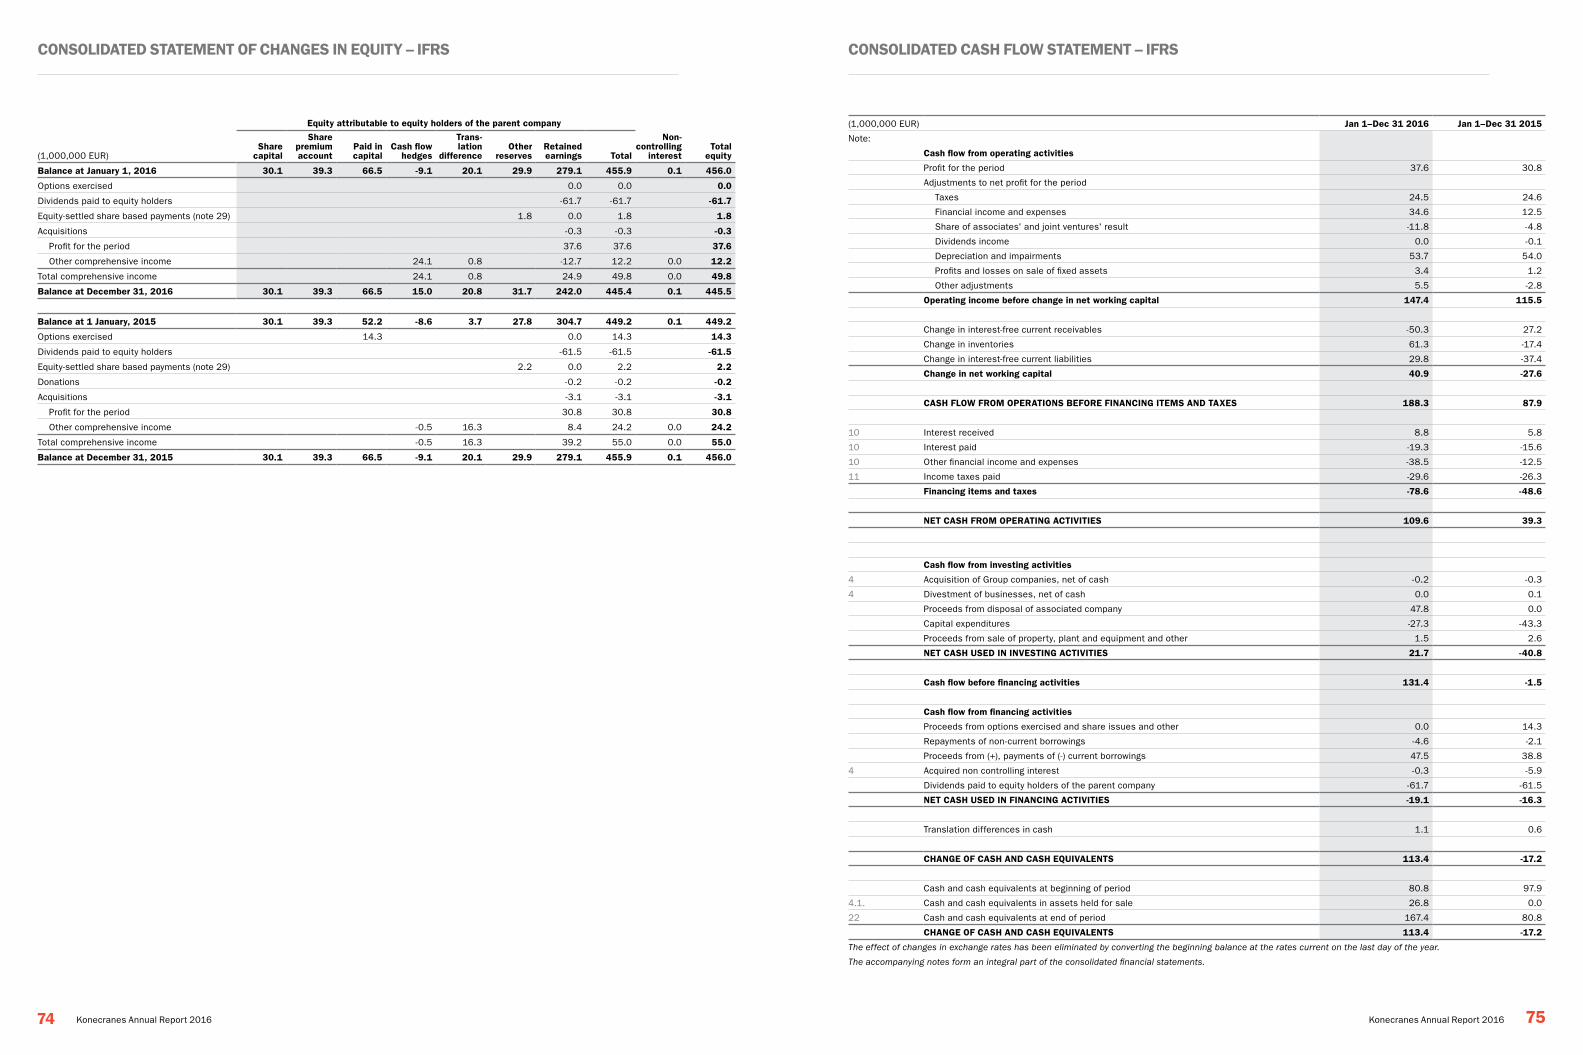
coNsolidated stateMeNt of chaNGes iN eQUitY – ifRs coNsolidated cash flow stateMeNt – ifRs
74 75Konecranes Annual Report 2016 Konecranes Annual Report 2016
equity attributable to equity holders of the parent company
(1,000,000 EUR)share
capital
sharepremiumaccount
paid in capital
cash flowhedges
trans-lation
differenceother
reservesRetainedearnings total
Non- controlling
interesttotal
equity
Balance at January 1, 2016 30.1 39.3 66.5 -9.1 20.1 29.9 279.1 455.9 0.1 456.0
Options exercised 0.0 0.0 0.0
Dividends paid to equity holders -61.7 -61.7 -61.7
Equity-settled share based payments (note 29) 1.8 0.0 1.8 1.8
Acquisitions -0.3 -0.3 -0.3
Profit for the period 37.6 37.6 37.6
Other comprehensive income 24.1 0.8 -12.7 12.2 0.0 12.2
Total comprehensive income 24.1 0.8 24.9 49.8 0.0 49.8
Balance at december 31, 2016 30.1 39.3 66.5 15.0 20.8 31.7 242.0 445.4 0.1 445.5
Balance at 1 January, 2015 30.1 39.3 52.2 -8.6 3.7 27.8 304.7 449.2 0.1 449.2
Options exercised 14.3 0.0 14.3 14.3
Dividends paid to equity holders -61.5 -61.5 -61.5
Equity-settled share based payments (note 29) 2.2 0.0 2.2 2.2
Donations -0.2 -0.2 -0.2
Acquisitions -3.1 -3.1 -3.1
Profit for the period 30.8 30.8 30.8
Other comprehensive income -0.5 16.3 8.4 24.2 0.0 24.2
Total comprehensive income -0.5 16.3 39.2 55.0 0.0 55.0
Balance at december 31, 2015 30.1 39.3 66.5 -9.1 20.1 29.9 279.1 455.9 0.1 456.0
(1,000,000 EUR) Jan 1–dec 31 2016 Jan 1–dec 31 2015
Note:
cash flow from operating activities
Profit for the period 37.6 30.8
Adjustments to net profit for the period
Taxes 24.5 24.6
Financial income and expenses 34.6 12.5
Share of associates' and joint ventures' result -11.8 -4.8
Dividends income 0.0 -0.1
Depreciation and impairments 53.7 54.0
Profits and losses on sale of fixed assets 3.4 1.2
Other adjustments 5.5 -2.8
operating income before change in net working capital 147.4 115.5
Change in interest-free current receivables -50.3 27.2
Change in inventories 61.3 -17.4
Change in interest-free current liabilities 29.8 -37.4
change in net working capital 40.9 -27.6
cash flow fRoM opeRatioNs BefoRe fiNaNciNG iteMs aNd taXes 188.3 87.9
10 Interest received 8.8 5.8
10 Interest paid -19.3 -15.6
10 Other financial income and expenses -38.5 -12.5
11 Income taxes paid -29.6 -26.3
financing items and taxes -78.6 -48.6
Net cash fRoM opeRatiNG actiVities 109.6 39.3
cash flow from investing activities
4 Acquisition of Group companies, net of cash -0.2 -0.3
4 Divestment of businesses, net of cash 0.0 0.1
Proceeds from disposal of associated company 47.8 0.0
Capital expenditures -27.3 -43.3
Proceeds from sale of property, plant and equipment and other 1.5 2.6
Net cash Used iN iNVestiNG actiVities 21.7 -40.8
cash flow before financing activities 131.4 -1.5
cash flow from financing activities
Proceeds from options exercised and share issues and other 0.0 14.3
Repayments of non-current borrowings -4.6 -2.1
Proceeds from (+), payments of (-) current borrowings 47.5 38.8
4 Acquired non controlling interest -0.3 -5.9
Dividends paid to equity holders of the parent company -61.7 -61.5
Net cash Used iN fiNaNciNG actiVities -19.1 -16.3
Translation differences in cash 1.1 0.6
chaNGe of cash aNd cash eQUiValeNts 113.4 -17.2
Cash and cash equivalents at beginning of period 80.8 97.9
4.1. Cash and cash equivalents in assets held for sale 26.8 0.0
22 Cash and cash equivalents at end of period 167.4 80.8
chaNGe of cash aNd cash eQUiValeNts 113.4 -17.2
The effect of changes in exchange rates has been eliminated by converting the beginning balance at the rates current on the last day of the year.
The accompanying notes form an integral part of the consolidated financial statements.
Notes to the coNsolidated fiNaNcial stateMeNts Notes to the coNsolidated fiNaNcial stateMeNts
76 77Konecranes Annual Report 2016 Konecranes Annual Report 2016
1. Corporate information Konecranes Plc (“Konecranes Group” or “the Group”) is a Finnish public limited company organized under the laws of Finland and domiciled with its principal place of business in Hyvinkää. The company is listed on the NASDAQ Helsinki.
Konecranes is a world-leading manufacturer and servicer of cranes, lifting equipment and machine tools, serving a broad range of customers, including manufacturing and process indus-tries, shipyards, ports and terminals. Konecranes operates internationally, with its products being manufactured in North and South America, Europe, Africa, the Middle East, and Asia and sold worldwide. Konecranes has two reportable segments, which it calls Business Areas: Business Area Service and Busi-ness Area Equipment.
2. Accounting principles
2.1 Basis of preparationThe consolidated financial statements of Konecranes Plc have been prepared in accordance with International Financial Reporting Standards (IFRS) as adopted by the EU.
The consolidated financial statements have been prepared on a historical cost basis, except for items that are required by IFRS to be measured at fair value, principally certain financial instruments.
The consolidated financial statements including notes thereto are presented in millions of euros and all values are rounded to the nearest million (€000,000) except when other-wise indicated.
Due to the rounding some totals might differ from the sum of individual figures as calculations are done originally in thou-sands of euros.
The financial statements were approved for issuance by the Board of Directors on February 8, 2017.
principles of consolidationThe consolidated financial statements comprise the conso-lidated balance sheet of Konecranes Plc and its subsidiaries as at December 31, 2016 and 2015 and the consolidated statements of income and cash flows for the periods ended December 31, 2016 and 2015. Control is achieved when the Group is exposed, or has rights, to variable returns from its involvement with the investee and has the ability to affect those returns through its power over the investee. Specifically, the Group controls an investee if, and only if, the Group has:• Power over the investee (i.e., existing rights that give it the
current ability to direct the relevant activities of the investee);• Exposure, or rights, to variable returns from its involvement
with the investee;• The ability to use its power over the investee to affect its
returns.
Generally, there is a presumption that a majority of voting rights result in control. To support this presumption, and when the Group has less than a majority of the voting or similar rights of
an investee, the Group considers all relevant facts and circum-stances in assessing whether it has power over an investee, including:• The contractual arrangement with the other vote holders of
the investee;• Rights arising from other contractual arrangements;• The Group’s voting rights and potential voting rights.
The Group re-assesses whether or not it controls an investee if facts and circumstances indicate that there are changes to one or more of the three elements of control. Consolidation of a subsidiary begins when the Group obtains control over the subsidiary and ceases when the Group loses control of the subsidiary. Assets, liabilities, income and expenses of a subsid-iary acquired or disposed of during the year are included in the consolidated financial statements from the date the Group gains control until the date the Group ceases to control the subsidiary.
Profit or loss and each component of other comprehensive income (OCI) are attributed to the equity holders of the parent of the Group and to the non-controlling interests, even if this results in the non-controlling interests having a deficit balance. When necessary, adjustments are made to the financial state-ments of subsidiaries to bring their accounting policies into line with the Group’s accounting policies. All intra-group assets and liabilities, equity, income, expenses, and cash flows relating to transactions between members of the Group are eliminated in full on consolidation.
A change in the ownership interest of a subsidiary, without a loss of control, is accounted for as an equity transaction.
If the Group loses control over a subsidiary, it derecognizes the related assets (including goodwill), liabilities, non-controlling interest, and other components of equity while any resultant gain or loss is recognized in profit or loss. Any investment retained is recognized at fair value.
investment in associates and joint ventures An associate is an entity over which the Group has significant influence. Significant influence is the power to participate in the financial and operating policy decisions of the investee, but is not control or joint control over those policies.
A joint venture is a type of joint arrangement whereby the parties that have joint control of the arrangement have rights to the net assets of the joint venture. Joint control is the contrac-tually agreed sharing of control of an arrangement, which exists only when decisions about the relevant activities require unani-mous consent of the parties sharing control.
The Group’s investments in its associates and joint ventures are accounted for using the equity method. Under this method, the consolidated financial statements show the Group’s investment in, and share of, net assets of the associate or joint venture. Any premium over net assets paid to acquire an interest in an associate or joint venture is recognized as goodwill within the same line as the underlying investment. The statement of profit or loss reflects the Group’s share of the results of operations of the associate or joint venture. Any
change in OCI of those investees is presented as part of the Group’s OCI. In addition, when there has been a change recog-nized directly in the equity of the associate or joint venture, the Group recognizes its share of any changes, when applicable, in the statement of changes in equity. Unrealized gains and losses resulting from transactions between the Group and the asso-ciate or joint venture are eliminated to the extent of the interest in the associate or joint venture.
After application of the equity method, the Group determines whether it is necessary to recognize an impairment loss on its investment in its associate or joint venture. At each reporting date, the Group determines whether there is objective evidence that the investment in the associate or joint venture is impaired. If there is such evidence, the Group calculates the amount of impairment as the difference between the recoverable amount of the associate or joint venture and its carrying value, and then recognizes the loss as Share of profit of an associate and a joint venture in the statement of profit or loss.
2.2 Use of estimates and judgments
estimatesThe preparation of the financial statements in accordance with IFRS requires management to make estimates and judgments that affect the valuation of reported assets and liabilities and other information, such as contingent liabilities and recognition of income and expenses in the statement of income. These assumptions, estimates and judgments are based on manage-ment’s historical experience, best knowledge about the events and other factors, such as expectations on future events, which the Company assess to be reasonable in the given circum-stances. Although these estimates and judgments are based on the management’s best understanding of current events and circumstances, actual results may differ from the estimates. Changes in estimates and assumptions are recognized in the financial period the estimate or assumption is changed.
The most important items in the consolidated financial state-ments, which require management’s estimates and that involve complex and subjective judgments and the use of assumptions, some of which may be for matters that are inherently uncertain and susceptible to change are impairment testing, recognition of deferred taxes, measurement of the fair value of assets and actuarial assumptions in defined benefit plans, and percentage of completion revenue recognition in long term projects.
impairment testingThe recoverable amount for goodwill has been determined based on value in use of the relevant cash generating unit, to which the goodwill is allocated. The recoverable amounts of all material intangible assets and property, plant, and equipment have also been based on their value in use. The impairment testing of goodwill is based on numerous judgmental estimates of the present value of the cash flows which effect the valuation of the cash generating units (CGU) pertaining to the goodwill. Cash flow forecasts are made based on CGU specific historical
data, order book, the current market situation, and industry specific information of the future growth possibilities. These assumptions are reviewed annually as part of management’s budgeting and strategic planning cycles, and can be subject to significant adjustment as arising from the development of the global economy, pressure from competitors’ products as well as changes in raw material prices and operating expenses. The value of the benefits and savings from the efficiency improve-ment programs already announced and included in certain cash flow estimates are also subjective and based on management’s best estimate of the impact. The fair value of the CGUs is determined using a derived weighted average cost of capital as the rate to discount estimated future cash flows. The discount rate used may not be indicative of actual rates obtained in the markets in the future. See note 13.
Recognition of deferred taxesThe ultimate realization of deferred tax assets is dependent upon the generation of future taxable income during the periods in which those temporary differences become deductible or in which tax losses can be utilized. The tax effect of unused tax losses is recognized as a deferred tax asset when it becomes probable that the tax losses will be utilized. In making assess-ments regarding deferred tax assets, management considers the scheduled reversal of deferred tax liabilities, projected future taxable income and tax planning strategies. The actual current tax exposure is estimated together with assessing temporary differences resulting from differing treatment of items, such as depreciation, provisions and accruals, for tax and accounting purposes. When recording the deferred tax assets judgment have been based on the estimates of the taxable income in each subsidiary and country in which Konecranes operates, and the period over which the deferred tax assets will be recoverable based on the estimated future taxable income and planned tax strategies to utilize these assets. The amount of deferred tax assets considered real-izable could however be reduced in subsequent years if esti-mates of future taxable income during their carry forward periods are reduced, or rulings by the tax authorities are unfa-vourable. Estimates are therefore subject to change due to both market related and tax authorities related uncertainties, as well as Konecranes’ own future decision matters such as restruc-turing. Konecranes is unable to accurately quantify the future adjustments to deferred income tax expense that may occur as a result of these uncertainties. See note 17.
actuarial assumptions in defined benefit plansThe net pension liability and expense for defined benefit plans is based on various actuarial assumptions such as the assumed discount rate, expected development of salaries and pensions, and mortality rates. Significant differences between assumptions and actual experience, or significant changes in assumptions, may materially affect the pension obligations. The effects of actual results differing from assumptions and the changing of assumptions are included in Remeasurement
Notes to the coNsolidated fiNaNcial stateMeNts Notes to the coNsolidated fiNaNcial stateMeNts
78 79Konecranes Annual Report 2016 Konecranes Annual Report 2016
gains/loss on defined benefit plans in other comprehensive income. Discount rates are determined annually based on changes in long-term, high quality corporate bond yields.
Decreases in the discount rates results in an increase in the defined benefit obligation and in pension costs. Conversely, an increase in the discount rate results in a decrease in the defined benefit obligation and in pension costs. Increases and decreases in mortality rates have an inverse impact on the defined benefit obligation and pension costs. Increases and decreases in salary and pension growth rates have a direct correlating impact on the defined benefit obligation and pension costs.
The assumed discount rate, which is based on rates observed at the end of the preceding financial year may not be indicative of actual rates realized. The actual development for salaries and pensions may not reflect the estimated future development due to the uncertainty of the global economy and various other factors. Konecranes uses generational mortality tables to estimate probable future mortality improvements. These tables assume that the trend of increasing life expec-tancy will continue, resulting in pension benefit payments to younger members being likely to be paid for longer time periods than older members’ pensions, given that assumed retirement ages are those defined in the rules of each plan.
The funded status, which can increase or decrease based on the performance of the financial markets or changes in our assumptions, does not represent a mandatory short-term cash obligation. Instead, the funded status of a defined benefit pension plan is the difference between the defined benefit obli-gation and the fair value of the plan assets. See note 28.
percentage of completion revenue recognition in long term projectsKonecranes applies the percentage of completion method (cost to cost) for recognizing revenue from long term large crane projects in accordance with IAS11 Construction Contracts. The percentage of completion is based on the cost-to-cost method. Under this method, progress of contracts is measured by actual costs incurred in relation to management’s best estimate of total estimated costs at completion, which are reviewed and updated routinely for contracts in progress. The cumulative effect of any change in estimate is recorded in the period in which the change in estimate is determined.
The percentage-of-completion method of accounting involves the use of assumptions and projections, principally relating to future material, labor, and project-related overhead costs. As a consequence, there is a risk that total contract costs will exceed those originally estimated and the margin will decrease or the contract may become unprofitable. This risk increases as the duration of a contract increases, because there is a higher probability that the circumstances upon the estimates were originally based will change, resulting in increased costs that may not be recoverable. Factors that could cause costs to increase include: unanticipated technical problems with equip-ment supplied or developed by us which may require us to incur additional costs to remedy, changes in the cost of components,
materials or labor, project modifications creating unanticipated costs, suppliers’ or subcontractors’ failure to perform, and delays caused by unexpected conditions or events. By recog-nizing changes in estimates cumulatively, recorded revenue and costs to date reflect the current estimates at the stage of completion for each project. Additionally, losses on long-term contracts are recognized in the period when they are identified and are based upon the anticipated excess of contract costs over the related contract revenues.
JudgmentsThere have been no changes in judgments throughout the years 2016 and 2015.
2.3 summary of significant accounting policies
Revenue recognitionRevenue is recognized to the extent that it is probable that the economic benefits will flow to the Company, that revenue can be reliably measured, and that collectability is reasonably assured. Revenue is measured at the fair value of the consider-ation received or receivable. The creditworthiness of the buyer is assessed before engaging into a sale. However, if a risk of non-payment arises after revenue recognition, a provision for non- collectability is established. The specific recognition criteria described below must also be met before revenue for the sale of goods is recognized:
a) The entity has transferred to the buyer the significant risks and rewards of ownership of the goods;b) The entity retains neither continuing managerial involvement to the degree usually associated with ownership nor effective control over the goods sold;c) The amount of revenue can be measured reliably;d) It is probable that the economic benefits associated with the transaction will flow to the entity; ande) The costs incurred or to be incurred in respect of the transac-tion can be measured reliably.
The transfer of risk takes place either when goods are shipped or made available to the buyer for shipment, depending on the terms of the contract.
Revenue from services is recognized when the outcome of the transaction can be estimated reliably and by reference to the stage of completion based on services performed at the end of the reporting period. The assessment of the stage of completion is dependent on the nature of the contract, but will generally be based on costs incurred to the extent these relate to services performed up to the reporting date or by written customer acknowledgement.
The outcome can be estimated reliably when all of the following criteria are satisfied:a) The amount of revenue can be measured reliably;b) It is probable that the economic benefits associated with the transaction will flow to the entity;
c) The stage of completion of the transaction at the end of the reporting period can be measured reliably; and d) The costs incurred for the transaction and the costs to complete the transaction can be measured reliably.
Revenue from large crane construction contracts is recognized according to the percentage of the completion (POC) method described in IAS11 as those contracts are specifically negotiated for the construction of an asset or a combination of assets that are closely interrelated or interdependent in terms of their design, technology and function or their ultimate purpose or use. The stage of completion of a contract is determined by the proportion that the contract costs incurred for the work performed to date bear to the estimated total contract costs (cost-to-cost method) at completion. When the final outcome of a project cannot be reli-ably determined, the costs arising from the project are expensed in the same reporting period in which they occur, but the revenue from the project is recorded only to the extent that the Group will receive an amount corresponding to actual costs. An expected loss on a contract is recognized immediately in statement of income. Revenue in respect of variations to the contract scope and claims is recognized when it is probable that it will be received and is capable of being measured reliably.
Research and development costsResearch costs are expensed as incurred. Development expenditures on an individual project are recognized as an intangible asset when the Group can demonstrate:• The technical feasibility of completing the intangible asset so
that it will be available for use or sale.• Its intention to complete and its ability to use or sell the
asset.• How the asset will generate future economic benefits.• The availability of resources to complete the asset.• The ability to reliably measure the expenditure during development.
Amortization of capitalized development costs begins when development is complete and the asset is available for use.
adjusted operating profitAdjusted operating profit (a non-GAAP measure) represents earnings from continuing operations before income taxes (a GAAP measure), excluding restructuring, transaction and related asset impairment costs as well as other adjusting items, and financial income and expense. See also note 3.
earnings per shareBasic earnings per share are computed by dividing income from continuing operations, income from discontinued operations and net income, all attributable to ordinary shareholders by the weighted average number of shares outstanding during the year. Diluted earnings per share are calculated by assuming conversion or exercise of all potentially dilutive share-based payment plans.
dividend distributionThe company recognizes a liability to make dividend distribu-tions to equity holders when the distribution is approved by the shareholders. A corresponding amount is recognized directly in equity.
employee benefits Konecranes companies have various pension plans in accord-ance with local conditions and practices. Pensions are generally managed for the Group companies by outside pension insur-ance companies or by similar arrangements. These pension plans are classified either as defined contribution or defined benefit plans. Under defined contribution plans, expenses are recognized for the period the contribution relates to. The Group has no legal or constructive obligation to pay further contributions if the fund does not hold sufficient assets to pay employee benefits. The Konecranes Group accounts for the Finnish system under the Employees’ Pensions Act (TyEL) within insurance system as a defined contribution plan.
Under defined benefit plans, a liability recognized in the balance sheet equal to the net of the present value of the defined benefit obligation (calculated using the Projected Unit Credit Method) less the fair value of the plan assets at the balance sheet date. Actuarial gains and losses are recognized in the consolidated statement of other comprehensive income as remeasurement items when they occur. Remeasurement recorded in other comprehensive income is not recycled. Past service cost is recognized in the statement of profit or loss in the period of plan amendment. Net-interest is calculated by applying the discount rate to the net defined liability or asset. Independent actuaries calculate the defined benefit obliga-tion by applying the Projected Unit Credit Method. The Group presents service cost, past-service cost, gains and losses on curtailments and settlements and net interest expense or income as Personnel cost – Pension costs: Defined benefit plans in the statement of income (see Note 8).
A liability for termination benefit is recognized at the earlier of when the entity can no longer withdraw the offer of the termination benefit and when the entity recognizes any related restructuring costs.
share based paymentsEmployees (including senior executives) of the Group and its subsidiaries receive remuneration in the form of share-based payments, whereby employees render services as consideration for equity instruments (equity-settled transactions) or receive settlement in cash (cash-settled transactions).
equity-settled transactions The cost of equity-settled transactions is determined by the fair value at the date when the grant is made using an appropriate valuation model.
That cost is recognized, together with a corresponding increase in other reserves in equity, over the period in which the performance and/or service conditions are fulfilled in Personnel
Notes to the coNsolidated fiNaNcial stateMeNts Notes to the coNsolidated fiNaNcial stateMeNts
80 81Konecranes Annual Report 2016 Konecranes Annual Report 2016
cost – Other personnel expense in the statement of income. The cumulative expense recognized for equity-settled transac-tions at each reporting date until the vesting date, reflects the extent to which the vesting period has expired and the Group’s best estimate of the number of equity instruments that will ulti-mately vest. The expense or credit recorded in the statement of income for a period represents the movement in cumulative expense recognized as at the beginning and end of that period.
No expense is recognized for awards that do not ultimately vest, except for equity-settled transactions for which vesting is conditional upon a market or non-vesting condition. These are treated as vesting irrespective of whether or not the market or non-vesting condition is satisfied, provided that all other perfor-mance and/or service conditions are satisfied.
When the terms of an equity-settled award are modified, the minimum expense recognized is the expense had the terms not been modified, if the original terms of the award are met. An additional expense is recognized for any modification that increases the total fair value of the share-based payment trans-action, or is otherwise beneficial to the employee as measured at the date of modification.
The dilutive effect of outstanding options is reflected as addi-tional share dilution in the computation of diluted earnings per share (see Note 12).
cash-settled transactions The cost of cash-settled transactions is measured initially at fair value at the grant date using a binomial model. This fair value is expensed over the period until the vesting date with recognition of a corresponding liability. The liability is remea-sured to fair value at each reporting date up to, and including the settlement date, with changes in fair value recognized in Personnel cost – Other personnel expenses in the statement of income (see Note 8).
foreign currency translationThe Group’s consolidated financial statements are reported in euros, which is the Group’s presentation currency. Each entity in the Group determines its own functional currency and items included in the financial statements of each entity are meas-ured using that functional currency.
transactions and balancesTransactions in currencies other than the entity’s functional currency (foreign currencies) are recognized by the Group enti-ties at their respective functional currency rates prevailing at the date of the transaction. At the end of each reporting period, foreign currency monetary items are retranslated at the func-tional currency spot exchange rate in effect at the reporting date. The resulting foreign currency exchange differences are recorded in the statement of income, with the exception of differences that arise on monetary items that provide an effec-tive hedge for a net investment in a foreign operation (such as intragroup loans where settlement is neither planned nor likely to occur in the foreseeable future). These are recognized
in other comprehensive income until the disposal of the net investment, at which time they are recognized in the income statement. Tax charges and credits attributable to exchange differences on those monetary items are also recorded in other comprehensive income.
Non-monetary items that are measured in terms of historical cost in a foreign currency are translated using the exchange rates as of the date of the initial transaction. Non-monetary items measured at fair value in a foreign currency are trans-lated using the exchange rates at the date when the fair value is determined.
foreign operationsThe assets and liabilities of foreign operations are translated into euros at the rate of exchange prevailing at the reporting date and their income statements are translated at average exchange rates for the period. The exchange differences arising on the translation are recognized in other comprehensive income. On disposal of a foreign operation, the component of other comprehensive income relating to that particular foreign operation is recognized in the income statement.
Any goodwill arising on the acquisition of a foreign opera-tion and any fair value adjustments to the carrying amounts of assets and liabilities arising on the acquisition are treated as assets and liabilities of the foreign operation and translated at the closing rate.
income taxTaxes shown in the consolidated statement of income include income taxes to be paid on the basis of local tax legislations, tax adjustments from previous years, as well as the effect of the annual change in the deferred tax liability and deferred tax balances. Taxes are calculated using rates enacted or substan-tively enacted at the balance sheet date.
Deferred tax liabilities and deferred tax assets are calculated on all temporary differences arising between the tax basis and the book value of assets and liabilities. Deferred tax is not recognized for non-deductible goodwill on initial recognition and temporary differences in investments in subsidiaries to the extent that they probably will not reverse in the foreseeable future. The main temporary differences arise from unused tax losses, depreciation differences, provisions, defined benefit pension plans, inter-company inventory margin, and derivative financial instruments. In connection with an acquisition, the Group records provisions for deferred taxes on the difference between the fair values of the net assets acquired and their tax bases. A deferred tax asset is recognized to the extent that it is probable that it can be utilized.
Business combinationsAcquisitions of subsidiaries are accounted for using the acqui-sition method according to which the acquired company’s identifiable assets, liabilities and contingent liabilities are measured at fair value on the date of acquisition. The excess of the consideration transferred for the business combination
over the acquirer’s interest in the net fair value of the identifi-able assets, liabilities, and contingent liabilities is recorded as goodwill. For each acquisition the non-controlling interest in the acquiree, if any, can be recognized either at fair value or at the non-controlling interest’s proportionate share of the acquiree’s net assets. If the purchase consideration is less than the fair value of the Group’s share of the net assets acquired, the differ-ence is recognized directly through the profit and loss. Direct acquisition transaction costs are expensed as incurred.
asset held for saleThe Group classifies non-current assets and disposal groups as held for sale if their carrying amounts will be recovered prin-cipally thorough a disposal rather than through the continuing use. Such non-current assets and disposal groups classified as held for sale are measured at the lower of their carrying amount and fair value less costs to sell.
The criteria for held for sale classification is regarded as met only when the sales are highly probable and the asset or disposal group is available for immediate disposal in its present condition. Actions required to complete the disposal should indi-cate that it is unlikely that significant changes to the disposal will be made or that the decision to dispose will be withdrawn. Management must be committed to the disposal expected within one year from the date of the classification.
Property, plant, and equipment and intangible assets are not depreciated or amortized once classified as held for sale. Addi-tional disclosures are provided in Note 4.1.
intangible assetsIntangible assets include service contracts, patents, and trade-marks as well as software licenses and implementation costs. Intangible assets acquired separately are measured on initial recognition at cost. The cost of intangible assets acquired in a business combination is their fair value at the date of acqui-sition. Intangible assets with definite useful life are amortized on the straight-line basis over expected useful lives, which may vary from 5 to 20 years with service contracts and patents and trademarks and from 4 to 7 years with software licenses. They are assessed for impairment whenever there is an indication that the intangible asset may be impaired.
Intangible assets with indefinite useful life are not amortized, but they are tested annually for impairment in a manner equiv-alent to that for testing goodwill. The assessment of indefinite life is reviewed annually to determine whether the indefinite life continues to be supportable. If not, the change in useful life from indefinite to finite is made on a prospective basis.
impairment testing of goodwillGoodwill acquired in a business combination is tested for impairment annually or whenever events or changes in circum-stances indicate that the carrying amount may not be recover-able. For the purpose of impairment testing, goodwill acquired in a business combination is, from the acquisition date, allocated to each of the Group’s cash generating units that
are expected to benefit from the combination, irrespective of whether other assets or liabilities of the acquire are assigned to those units. If the carrying amount for a CGU exceeds its recov-erable amount, an impairment loss equal to the difference is recognized. Konecranes uses a discounted cash flow analyses to assess the fair value of goodwill. In assessing value-in-use, the estimated future cash flows are discounted to their present value using a pre-tax discount rate that reflects current market assessments of the time value of money and the risks specific to the asset. The Group bases its impairment calculation on detailed budgets and forecast calculations, which are prepared separately for each of the Group’s CGUs to which the individual assets are allocated. These budgets and forecast calculations cover a period of five years. A previously recognized impairment loss on goodwill is not reversed even if there is a significant improvement in circumstances having initially caused the impairment.
property, plant, and equipmentProperty, plant, and equipment are stated at cost less accu-mulated depreciation and any impairment losses. Depreciation is recorded on a straight-line basis over the estimated useful economic life of the assets as follows:• Buildings 10–40 years• Machinery and equipment 3–10 years
No depreciation is recorded for land. Expectations made for existing property, plant, and equip-
ment that will provide future economic benefit are capitalized and depreciated over the remaining useful life of the asset.
impairment of assets subject to amortization and depreciationThe carrying values of intangible assets subject to amortization, property, plant, and equipment and investments in associates and joint ventures, are reviewed for impairment whenever events and changes in circumstances indicate that the carrying amount of an asset may not be recoverable. If such an indica-tion exists, the recoverable amount of the assets will be esti-mated.
The recoverable amount is the higher of the assets fair value less selling costs and value in use which is the present value of the cash flows expected from the asset’s use and eventual disposal. An impairment loss is recognized in the statement of income when the recoverable amount of an asset is less than its carrying amount. Impairment losses on these assets are reversed if their recoverable amounts subsequently increase.
Valuation of inventoriesRaw materials and supplies are valued at the acquisition cost or, if lower, at the net realizable value. Net realizable value is the estimated selling price in the ordinary course of business, less estimated costs of completion and the estimated costs necessary to make the sale. Semi-manufactured goods are valued at variable production costs including a share of produc-tion overheads based on normal capacity. Work in progress of
Notes to the coNsolidated fiNaNcial stateMeNts Notes to the coNsolidated fiNaNcial stateMeNts
82 83Konecranes Annual Report 2016 Konecranes Annual Report 2016
uncompleted orders includes direct labor and material costs, as well as a proportion of overhead costs related to production and installation. Raw materials and supplies are valued using the first-in, first-out (FIFO) basis or weighted average cost. The inventory stock obsolescence provision is based on the best estimate of slow-moving and obsolete inventory at the balance sheet date. The estimates are based on frequent review and evaluation of inventory ageing and composition.
account and other receivablesAccount and other receivables are initially recorded at fair value after which they are subsequently measured at amortised cost. Provisions are made for doubtful receivables on individual assessment of potential risks. The effect is recognized in the statement of income.
cash and cash equivalentsCash and cash equivalents comprise cash balances and call deposits with banks and other liquid investments with orig-inal maturities of three months or less. Bank overdrafts are included in current interest-bearing liabilities.
fair value measurementFair value is the price that would be received to sell an asset or paid to transfer a liability in an orderly transaction between market participants. The Group categorizes assets and liabili-ties measured at fair value into one of three levels depending on the ability to observe inputs employed in their measure-ment. Level 1 inputs are quoted prices in active markets for identical assets or liabilities. Level 2 inputs are inputs that are observable, either directly or indirectly, other than quoted prices included within level 1 for the asset or liability. Level 3 inputs are unobservable inputs for the asset or liability reflecting significant modifications to observable related market data or Konecranes’ assumptions about pricing by market participants.
derivative financial instruments and hedge accounting The Group’s global operations expose it to currency risk and to a lesser extent interest rate risk.
The Group uses derivative financial instruments, primarily forward contracts and interest rate swaps, to hedge its risks associated with foreign currency fluctuations relating to certain commitments and forecasted transactions and interest rate risks. Derivative financial instruments are used for hedging purposes in accordance with the Group’s hedging policy and not for speculative purposes. These instruments are initially recognized at fair value at the derivative contract date, and are re-measured to fair value at subsequent reporting dates. Derivatives are presented as financial assets when the fair value is positive and as financial liabilities when the fair value is negative.
For certain large crane projects, the Group applies hedge accounting. The Group applied also hedge accounting to the USD denominated purchase price of MHPS acquisition. The Group designates hedges of the foreign currency risk of a firm
commitments and highly probable forecasted transactions to a cash flow hedge. Changes in the fair value of derivative financial instruments that are designated as effective hedges of future cash flows are recognized directly in other comprehensive income, while the ineffective portion is recognized immediately in the income statement. See note 34.
Amounts recognized as OCI are transferred to profit or loss when the hedged transaction affects profit or loss, such as when the hedged financial income or financial expense is recog-nized or when a forecast sale occurs. When the hedged item is the cost of a non-financial asset or non-financial liability, the amounts recognized as OCI are transferred to the initial carrying amount of the non-financial asset or liability.
If the hedging instrument expires or is sold, terminated, or exercised without replacement or rollover (as part of the hedging strategy), or if its designation as a hedge is revoked, or when the hedge no longer meets the criteria for hedge accounting, any cumulative gain or loss previously recognized in OCI remains separately in equity until the forecast transac-tion occurs or the foreign currency firm commitment is met. If a hedged transaction is no longer expected to occur, the net cumulative gain or loss recognized in the other comprehensive income is transferred to profit or loss for the period.
Changes in the fair value of derivative financial instruments that do not qualify for hedge accounting are recognized in the statement of income as they arise.
The Group does not apply fair value hedging.
financial liabilitiesFinancial liabilities are classified as financial liabilities at fair value through profit or loss; derivatives designated as hedging instruments in an effective hedge; or as financial liabilities measured at amortized cost, as appropriate. Financial liabilities include trade and other payables, finance debt and derivative financial instruments. The Group determines the classification of its financial liabilities at initial recognition. The measurement of financial liabilities depends on their classification, as follows:
financial liabilities at fair value through profit or lossFinancial liabilities at fair value through profit or loss are carried on the balance sheet at fair value with gains or losses recog-nized in the income statement. Derivatives, other than those designated as effective hedging instruments, are classified as held for trading and are included in this category.
derivatives designated as hedging instruments in an effective hedgeThese derivatives are carried on the balance sheet at fair value. The treatment of gains and losses arising from revaluation is described above in the accounting policy for derivative financial instruments and hedging accounting.
financial liabilities measured at amortized costAll other financial liabilities are initially recognized at fair value. For interest-bearing loans and borrowings this is the fair value
of the proceeds received net of issue costs associated with the borrowing. After initial recognition, other financial liabilities are subsequently measured at amortized cost using the effec-tive interest method. Amortized cost is calculated by taking into account any issue costs, and any discount or premium on settlement. Gains and losses arising on the repurchase, settle-ment, or cancellation of liabilities are recognized respectively in interest and other income and finance costs. This category of financial liabilities includes accounts payables and interest bearing liabilities.
offsetting of financial instrumentsFinancial assets and financial liabilities are offset and the net amount reported in the consolidated statement of financial posi-tion if, and only if, there is a currently existing, legally enforce-able, unconditional right of offset that applies to all counterpar-ties of the financial instruments in all situations, including both normal operations and insolvency.
provisionsProvisions are recognized in the balance sheet when the Group has a present legal or constructive obligation as a result of a past event and it is considered probable that an outflow of resources embodying economic benefits will be required to settle the obligation and a reliable estimate can be made of the amount of the obligation. Provisions may arise from restruc-turing plans, onerous contracts, guarantees, and warranties, among other events. Obligations arising from restructuring plans are recognized when the detailed and formal restructuring plans have been established, the personnel concerned have been informed, and when there is a valid expectation that the plan will be implemented. The warranty provision is based on the history of past warranty costs and claims on delivered prod-ucts under warranty. Additionally, warranty provisions can be established on a case by case basis to take into consideration the potentially increased risks.
When the Group expects some or all of a provision to be reimbursed, for example, under an insurance contract, the reim-bursement is recognized as a separate asset, but only when the reimbursement is virtually certain.
leasesLease contracts, in which the Group assumes substantially all risks and rewards of ownership, are classified as finance leases. In finance leases, the assets are recognized in property, plant and equipment at the lower of fair value or the present value of the minimum lease payments as determined at the inception of the lease. The value capitalized is amortized on a straight-line basis over the shorter of the lease period or the useful economic life of the asset. The corresponding lease obli-gations are included in interest-bearing liabilities.
Other lease contracts are classified as operating leases where the lease payments of these leases are recognized as rental expenses in the statement of income on a straight line basis over the lease term.
cash flow statementThe cash flow statement has been prepared in accordance with the indirect method. In the cash flow statement a distinction is made between cash flows from operating, investing and financing activities. Currency differences on cash and cash equivalents are recognized separately in the cash flow state-ment. Revenue and expenses for income tax are recognized under Cash flows from operating activities. Interest costs and interest revenues are recognized under Cash flows from oper-ating activities. Cash flows as a result of the acquisition or disposal of financial interests (subsidiaries and interests) are recognized under Cash flows from investing activities, taking into account the cash, cash equivalents, and repaid third party debts present in these interests. Dividends paid out, as well as obtained loans, are recognized under Cash flows from financing activities.
2.4 application of new and amended ifRs standards and ifRic interpretations Konecranes has adopted following new or revised IFRSs from January 1, 2016. They did not have any impact on the current or the comparative periods.
Accounting for Acquisitions of Interests in Joint Operations Amendments to IFRS 11 clarifies that the acquisition accounting and disclosure requirements of IFRS 3 Business Combinations, must be applied to the acquisitions of an interest in a joint operation that constitutes a business. Konecranes applies this standard prospectively from January 1, 2016 on acquisitions of joint operations.
The relevant new or revised IFRSs that Konecranes has not yet adopted are the following:
Sale or Contribution of Assets between an Investor and its Associate or Joint Venture, Amendments to IFRS 10 and IAS 28 requires Konecranes to recognize gains and losses on such sales or contributions only to the extent they relate to the interest in the Associate or Joint Venture that does not constitute a business, and that is held by investors other than Konecranes. The gain or loss resulting from the sale or contribution to an Associate or a Joint Venture of assets that constitute a business as defined in IFRS 3 is recognised in full. The standard has been effective from January 1, 2016 but not endorsed by EU yet.
IFRS 9 Financial Instruments introduces a single approach for the classification and measurement of financial assets according to their cash flow characteristics and the business model they are managed in, and provides a new impairment model based on expected credit losses. IFRS 9 also includes new regulations regarding the application of hedge accounting to better reflect an entity’s risk management activities espe-cially with regard to managing non-financial risks. The new standard is effective for annual reporting periods beginning on or after January 1, 2018, while early application is permitted. Konecranes is not using the early application option.
The new hedging model may lead to more economic hedging strategies meeting the requirement for hedge accounting.
Notes to the coNsolidated fiNaNcial stateMeNts Notes to the coNsolidated fiNaNcial stateMeNts
84 85Konecranes Annual Report 2016 Konecranes Annual Report 2016
Konecranes believes that all existing hedge relationships that are currently designated in effective hedging relationships will still qualify for hedge accounting under IFRS 9. The Group expects to continue measuring at fair value all financial assets currently measured at fair value. Accounts receivables are held to collect contractual cash flows and are expected to rise from cash flows representing solely payments of principal and interest. Thus the Group expects that these will continue to be initially recorded at fair value through profit or loss, after which they are subsequently measured at amortised cost under IFRS9. The Group expects to apply the simplified approach to record expected credit losses on its accounts receivable. The Group will estimate credit losses in the future by using a provi-sion matrix where account receivables are grouped based on different customer bases and different historical loss patterns. Under the simplified model, companies could adjust the histor-ical provision rates, which are an average of historical outcomes of credit losses, for their account receivables to reflect rele-vant information about current conditions and reasonable and supportable forecasts about the future. The Group does not believe that applying IFRS 9 will have a material impact on its consolidated financial statements regarding recognition and measurement of financial instruments but IFRS 9 is estimated to increase the amount of disclosures.
IFRS 15 Revenue from Contracts with Customers recognizes revenue to depict the transfer of promised goods or services to a customer in an amount that reflects the consideration to which the Group expects to be entitled in exchange for those goods or services. Revenue is recognized when, or as, the customer obtains control of the goods or services. IFRS 15 also includes guidance on the presentation of contract balances, that is, assets and liabilities arising from contracts with customers, depending on the relationship between the entity’s performance and the customer’s payment. In addition, the new standard requires a set of quantitative and qualitative disclosures to enable users of the Group’s consolidated finan-cial statements to understand the nature, amount, timing, and uncertainty of revenue and cash flows arising from contracts with customers. IFRS 15 supersedes IAS 11, Construction Contracts and IAS 18, Revenue as well as related interpreta-tions. The standard is effective for annual periods beginning on or after January 1, 2018; early application is permitted. Kone-cranes is not using the early application option and is expecting to apply the full retrospective approach in transition.
Revenue recognition from contracts with customers, in which sale of equipment is generally expected to be the only perfor-mance obligation, is not expected to have any impact on the Group’s profit and loss. The Group expects the revenue recog-nition to occur at a point in time when control of the asset is transferred to the customer. Goods sold as installed are consid-ered to be one performance obligation and the revenue recog-nition takes place once the commissioning has been done and approved by the customer. This standard may impact revenue recognition of long term projects as the criteria for recognizing
the revenue over time (percentage of completion method) will change and be based on the fact that at any time during the contract term, Konecranes must be entitled to an amount that at least compensates the Group for performance completed to date, even if the customer can terminate the contract for reasons other than our failure to perform as promised.
The Group provides installation and maintenance services within the service segment. These services are sold either on their own service contracts or bundled together with the sale of equipment to a customer. Currently the Group accounts for the equipment and service as separate deliverables, and recognizes the revenue separately according to the stand-alone selling prices, and continues to recognize the service revenue when the outcome of the transaction can be estimated reliably and by reference to the stage of completion, based on services performed at the end of the reporting period. The assessment of the stage of completion is dependent on the nature of the contract, but will generally be based on costs incurred to the extent these relate to services performed up to the reporting date or by written customer acknowledgement. It is expected that IFRS 15 does not have any material impact on the Group’s profit and loss statement for revenue recognition of installation and maintenance services.
Sales contracts could give customers the option to purchase additional goods, which may be priced at a discount. These kind of options are considered to be separate performance obliga-tions and the revenue can be recognized if it provides a material right to the customers. The right is material if it results in a discount that the customer would not receive without entering to into the contract. If the discounted price in the option reflects the stand alone selling price, it is deemed to be more a marketing offer than a material right. According to analyses there might be few these kind of options in the contracts that will have some effect on the timing of the revenue recognition. Current practise is to recognise the revenue when the customer is utilizing the option.
Currently Group recognizes revenue from the sale of goods measured at the fair value of the consideration received or receivable, net of estimated probable returns and allowances, trade discounts and volume rebates. Such provisions give rise to variable consideration in IFRS 15 and will be required to be estimated at contract inception. Contracts with customers that provide right of return, trade discounts or volume rebates are rarely used by the Group, thus their effect to the revenue recog-nition is assessed to be immaterial.
In project business the contracts usually have clauses for penalties of late deliveries or penalties if the delivery cannot take place in time due to the customer reason. The penalties for late deliveries are currently accounted as provisions for cost when their probability is more likely than not to occur. The penalty payments received from customers have been recog-nized as sales when the penalty clauses in the contract have been satisfied. Such penalties will be treated as a variable consideration in IFRS 15 and will be required to be estimated
at contract inception. According to analyses this will reduce the Group’s recognized revenue to some extent when the penalties accounted for costs are to be deducted from sales according to IFRS 15.
The Group provides warranties related to general repairs and product liability. According to the preliminary analyses prepared, some contracts might include extended warranties over the normal industry standard warranty period, as well as service-type warranties, and thus can effect on the timing of the revenue recognition. Current practise has been to make a provi-sion for this warranty liability. Most of the warranties will still be assurance type warranties which will continue to be accounted for under IAS37 consistent with Group’s current practice.
The disclosure requirements in IFRS 15 will be more exten-sive than in the present IFRS standards.
IFRS 2 Classification and Measurement of Share-based Payment Transactions - Amendment to IFRS2 address three main areas: the effects of vesting conditions on the meas-urement of a cash-settled share-based payment transaction; the classification of a share-based payment transaction with net settlement features for withholding tax obligations; and accounting where a modification to the terms and conditions of a share-based payment transaction changes its classification form cash settled to equity settled.
On adoption, entities are required to apply the amendments without restating prior periods. The amendments are effective for annual periods beginning on or after 1 January, 2018. The Group has performance share plans in which the share-based payment transaction with net settlement features for with-holding tax obligations. According to IFRS 2 amendment, the existing plans at 1 January, 2018 are not divided anymore into two components (cash-settled and equity-settled) but are clas-sified in their entirety as equity-settled share-based payment transactions.
IFRS 16 Leases replaces IAS 17 Leases, IFRIC 4 Determining whether an Arrangement contains a Lease, SIC-15 Operating Leases – Incentives and SIC -27 Evaluating the Substance of Transactions Involving the Legal form of a Lease. IFRS 16 sets out the principles for the recognition, measurement, presenta-tion, and disclosure of leases and requires lessees to account for all leases under a single on-balance sheet model similar to the accounting for finance lease under IAS17. The standard includes two recognition exemptions for lessees – leases of low-value assets and short-term leases (with a lease term of 12 months or less). At the commencement date of a lease, a lessee will recognize a liability to make lease payments and an asset representing the right to use the underlying asset during the lease terms. Lessees will be required to separately recog-nize the interest expense on the lease liability and the depre-ciation expense on the right-of-use asset. Lessees will be also required to remeasure the lease liability upon the occurrence of certain events (for example, a change in lease term or a change in future lease payments resulting from a change in an index or rate used to determine those payments). The lessee will
generally recognize the amount of the remeasurement of the lease liability as an adjustment to the right-of-use asset.
Lessor accounting under IFRS 16 is substantially unchanged from today’s accounting under IAS 17. IFRS 16 also requires lessees and lessors to make more extensive disclosures than under IAS 17. The standard is effective for annual periods begin-ning on or after 1 January, 2019. A lessee can choose to apply the standard using either a full retrospective or a modified retro-spective approach. The standard’s transition provisions permit certain reliefs. The Group plans to assess the potential effect of IFRS 16 on its consolidated financial statements during 2017 and 2018. It is however expected that the right of use assets and corresponding liabilities will be increased significantly after the standard is implemented.
3. Segment informationFor management purposes, the Group is organized into busi-ness units based on its products and services and had two reportable segments in 2016:• Service business, which provides services on installation and
maintenance of production cranes and lift trucks.• Equipment business, which produces lifting equipments.
Cranes and Lift trucks operating segments have been aggre-gated to form the above Equipment business reportable oper-ating segment, due to the similar economic characteristics with respect to the nature of the production process, product type and class of customers for their products.
The above reportable segments are based on the Group’s management reporting and organizational structure. Kone-cranes Group’s chief operating decision maker is the Board of Directors.
Segment performance is evaluated based on profit or loss and is measured consistently with profit or loss in the consol-idated financial statements. However, the performance of the investees accounted for using the equity method is evaluated using proportionate consolidation.
The assets and liabilities of the reportable segments include only items directly connected with the business as well as the goodwill related to them. Also the Group Headquarters’ tax and financial income and expenses are managed on Group level and are not allocated to segments.
Konecranes reports also three geographical areas, which are the main market areas: EMEA (Europe, Middle East and Africa), AME (Americas), and APAC (Asia-Pacific). Sales are reported by the customer location and assets and capital expenditure by the location of the assets.
Intercorporate transfer prices between operating segments are primarily based on the market prices, which are considered to reflect the arm’s length basis.
Capital expenditure consists of additions of property, plant, and equipment and intangible assets. Inter-segment revenues are eliminated on consolidation.
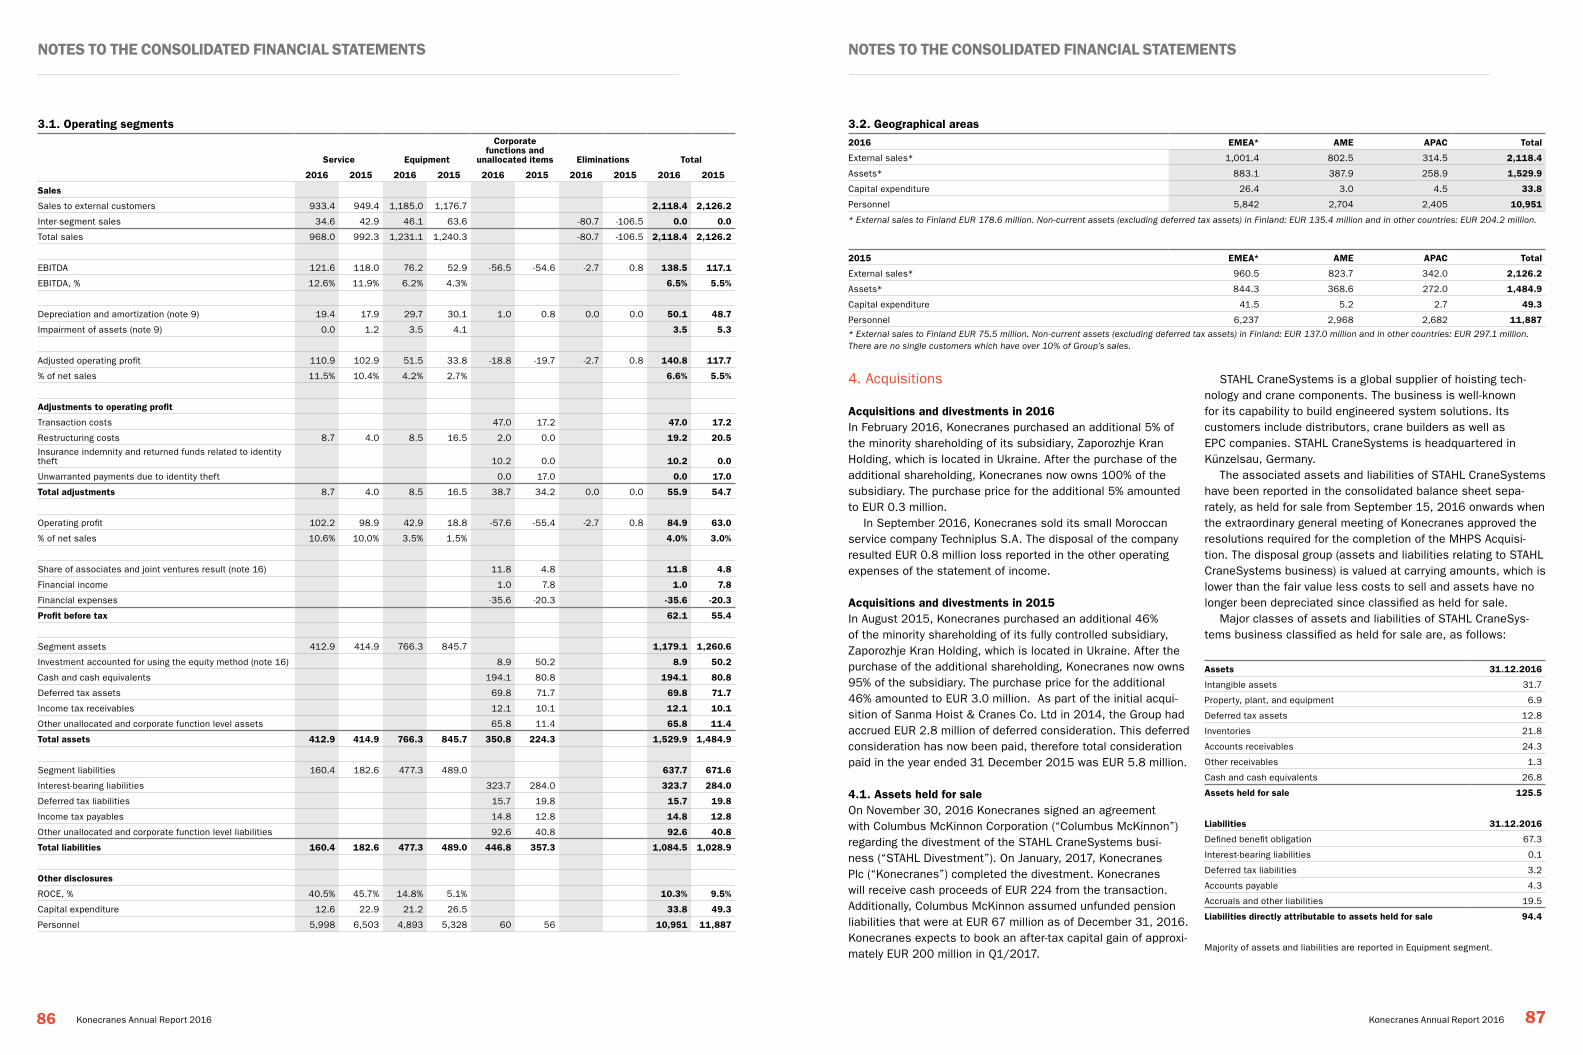
Notes to the coNsolidated fiNaNcial stateMeNts Notes to the coNsolidated fiNaNcial stateMeNts
86 87Konecranes Annual Report 2016 Konecranes Annual Report 2016
3.1. operating segments
service equipment
corporate functions and
unallocated items eliminations total
2016 2015 2016 2015 2016 2015 2016 2015 2016 2015
sales
Sales to external customers 933.4 949.4 1,185.0 1,176.7 2,118.4 2,126.2
Inter-segment sales 34.6 42.9 46.1 63.6 -80.7 -106.5 0.0 0.0
Total sales 968.0 992.3 1,231.1 1,240.3 -80.7 -106.5 2,118.4 2,126.2
EBITDA 121.6 118.0 76.2 52.9 -56.5 -54.6 -2.7 0.8 138.5 117.1
EBITDA, % 12.6% 11.9% 6.2% 4.3% 6.5% 5.5%
Depreciation and amortization (note 9) 19.4 17.9 29.7 30.1 1.0 0.8 0.0 0.0 50.1 48.7
Impairment of assets (note 9) 0.0 1.2 3.5 4.1 3.5 5.3
Adjusted operating profit 110.9 102.9 51.5 33.8 -18.8 -19.7 -2.7 0.8 140.8 117.7
% of net sales 11.5% 10.4% 4.2% 2.7% 6.6% 5.5%
adjustments to operating profit
Transaction costs 47.0 17.2 47.0 17.2
Restructuring costs 8.7 4.0 8.5 16.5 2.0 0.0 19.2 20.5
Insurance indemnity and returned funds related to identity theft 10.2 0.0 10.2 0.0
Unwarranted payments due to identity theft 0.0 17.0 0.0 17.0
total adjustments 8.7 4.0 8.5 16.5 38.7 34.2 0.0 0.0 55.9 54.7
Operating profit 102.2 98.9 42.9 18.8 -57.6 -55.4 -2.7 0.8 84.9 63.0
% of net sales 10.6% 10.0% 3.5% 1.5% 4.0% 3.0%
Share of associates and joint ventures result (note 16) 11.8 4.8 11.8 4.8
Financial income 1.0 7.8 1.0 7.8
Financial expenses -35.6 -20.3 -35.6 -20.3
profit before tax 62.1 55.4
Segment assets 412.9 414.9 766.3 845.7 1,179.1 1,260.6
Investment accounted for using the equity method (note 16) 8.9 50.2 8.9 50.2
Cash and cash equivalents 194.1 80.8 194.1 80.8
Deferred tax assets 69.8 71.7 69.8 71.7
Income tax receivables 12.1 10.1 12.1 10.1
Other unallocated and corporate function level assets 65.8 11.4 65.8 11.4
total assets 412.9 414.9 766.3 845.7 350.8 224.3 1,529.9 1,484.9
Segment liabilities 160.4 182.6 477.3 489.0 637.7 671.6
Interest-bearing liabilities 323.7 284.0 323.7 284.0
Deferred tax liabilities 15.7 19.8 15.7 19.8
Income tax payables 14.8 12.8 14.8 12.8
Other unallocated and corporate function level liabilities 92.6 40.8 92.6 40.8
total liabilities 160.4 182.6 477.3 489.0 446.8 357.3 1,084.5 1,028.9
other disclosures
ROCE, % 40.5% 45.7% 14.8% 5.1% 10.3% 9.5%
Capital expenditure 12.6 22.9 21.2 26.5 33.8 49.3
Personnel 5,998 6,503 4,893 5,328 60 56 10,951 11,887
3.2. Geographical areas2016 eMea* aMe apac total
External sales* 1,001.4 802.5 314.5 2,118.4
Assets* 883.1 387.9 258.9 1,529.9
Capital expenditure 26.4 3.0 4.5 33.8
Personnel 5,842 2,704 2,405 10,951
* External sales to Finland EUR 178.6 million. Non-current assets (excluding deferred tax assets) in Finland: EUR 135.4 million and in other countries: EUR 204.2 million.
2015 eMea* aMe apac total
External sales* 960.5 823.7 342.0 2,126.2
Assets* 844.3 368.6 272.0 1,484.9
Capital expenditure 41.5 5.2 2.7 49.3
Personnel 6,237 2,968 2,682 11,887
* External sales to Finland EUR 75.5 million. Non-current assets (excluding deferred tax assets) in Finland: EUR 137.0 million and in other countries: EUR 297.1 million.There are no single customers which have over 10% of Group’s sales.
4. Acquisitions
acquisitions and divestments in 2016In February 2016, Konecranes purchased an additional 5% of the minority shareholding of its subsidiary, Zaporozhje Kran Holding, which is located in Ukraine. After the purchase of the additional shareholding, Konecranes now owns 100% of the subsidiary. The purchase price for the additional 5% amounted to EUR 0.3 million.
In September 2016, Konecranes sold its small Moroccan service company Techniplus S.A. The disposal of the company resulted EUR 0.8 million loss reported in the other operating expenses of the statement of income.
acquisitions and divestments in 2015In August 2015, Konecranes purchased an additional 46% of the minority shareholding of its fully controlled subsidiary, Zaporozhje Kran Holding, which is located in Ukraine. After the purchase of the additional shareholding, Konecranes now owns 95% of the subsidiary. The purchase price for the additional 46% amounted to EUR 3.0 million. As part of the initial acqui-sition of Sanma Hoist & Cranes Co. Ltd in 2014, the Group had accrued EUR 2.8 million of deferred consideration. This deferred consideration has now been paid, therefore total consideration paid in the year ended 31 December 2015 was EUR 5.8 million.
4.1. assets held for saleOn November 30, 2016 Konecranes signed an agreement with Columbus McKinnon Corporation (“Columbus McKinnon”) regarding the divestment of the STAHL CraneSystems busi-ness (“STAHL Divestment”). On January, 2017, Konecranes Plc (“Konecranes”) completed the divestment. Konecranes will receive cash proceeds of EUR 224 from the transaction. Additionally, Columbus McKinnon assumed unfunded pension liabilities that were at EUR 67 million as of December 31, 2016. Konecranes expects to book an after-tax capital gain of approxi-mately EUR 200 million in Q1/2017.
STAHL CraneSystems is a global supplier of hoisting tech-nology and crane components. The business is well-known for its capability to build engineered system solutions. Its customers include distributors, crane builders as well as EPC companies. STAHL CraneSystems is headquartered in Künzelsau, Germany.
The associated assets and liabilities of STAHL CraneSystems have been reported in the consolidated balance sheet sepa-rately, as held for sale from September 15, 2016 onwards when the extraordinary general meeting of Konecranes approved the resolutions required for the completion of the MHPS Acquisi-tion. The disposal group (assets and liabilities relating to STAHL CraneSystems business) is valued at carrying amounts, which is lower than the fair value less costs to sell and assets have no longer been depreciated since classified as held for sale.
Major classes of assets and liabilities of STAHL CraneSys-tems business classified as held for sale are, as follows:
assets 31.12.2016
Intangible assets 31.7
Property, plant, and equipment 6.9
Deferred tax assets 12.8
Inventories 21.8
Accounts receivables 24.3
Other receivables 1.3
Cash and cash equivalents 26.8
assets held for sale 125.5
liabilities 31.12.2016
Defined benefit obligation 67.3
Interest-bearing liabilities 0.1
Deferred tax liabilities 3.2
Accounts payable 4.3
Accruals and other liabilities 19.5
liabilities directly attributable to assets held for sale 94.4
Majority of assets and liabilities are reported in Equipment segment.

Notes to the coNsolidated fiNaNcial stateMeNts Notes to the coNsolidated fiNaNcial stateMeNts
88 89Konecranes Annual Report 2016 Konecranes Annual Report 2016
amounts included in accumulated other comprehensive income 31.12.2016
Translation difference 2.3
Re-measurement losses on defined benefit plans -21.8
Deferred taxes relating to re-measurement losses on defined benefit plans 6.4
total -13.1
5. Specification of sales2016 2015
Sale of goods 1,466.9 1,411.1
Rendering of services 649.5 714.7
Leasing of own products 1.7 0.1
Royalties 0.3 0.3
total 2,118.4 2,126.2
6. Percentage of completion method and advances received
6.1 percentage of completion method2016 2015
The cumulative revenues of non-delivered projects 376.7 297.5
Advances received netted 290.3 216.9
Progress billings netted 2.6 3.3
Receivable arising from percentage of completion method, net 83.8 77.3
Gross advance received from percentage of completion method 323.5 221.1
Advances received netted 290.3 216.9
advances received from percentage of completion method (netted) 33.2 4.2
Net sales recognized under the percentage of completion method amounted EUR 268.9 million in 2016 (EUR 291.2 in 2015).
Receivable arising from percentage of completion method relate to construction contracts. Net asset balances are balances where the sum of contract costs, recognized profits, and recognized losses exceed progress billings. Construc-tion contracts, here and as follows, include service contracts accounted for under the percentage of completion method. Where progress billings exceed the sum of contract costs, recognized profits, and recognized losses, these liabilities are included in the line item Advance received from percentage of completion method (netted).
6.2. advance payments received
2016 2015
Advance received from percentage of completion method (netted) 33.2 4.2
Other advance received from customers 137.4 172.2
total 170.6 176.4
7. Operating expenses2016 2015
Change in work in progress 40.1 -37.0
Production for own use -1.5 -0.9
Material and supplies 742.5 792.7
Subcontracting 198.5 215.1
Materials, supplies and subcontracting 979.7 969.9
Wages and salaries 513.6 527.1
Pension costs 55.7 52.8
Other personnel expenses 89.1 81.6
Personnel cost 658.3 661.5
Other operating expenses 356.2 379.1
total operating expenses 1,994.2 2,010.5
Research and development costs recognized as an expense in other operating expenses amount to EUR 22.3 million in the year 2016 (EUR 28.7 million in 2015).
8. Personnel expenses and number of personnel
8.1. personnel expenses2016 2015
Wages and salaries 513.6 527.1
Pension costs: Defined benefit plans 5.1 5.5
Pension costs: Defined contribution plans 50.6 47.3
Other personnel expenses 89.1 81.6
total 658.3 661.5
8.2. average personnel2016 2015
Average number of personnel 11,398 11,934
Number of personnel as at December 31 10,951 11,887
Number of personnel as at December 31 in Finland 1,780 1,954
8.3. personnel by Reportable segment at end of period2016 2015
Service 5,998 6,503
Equipment 4,893 5,328
Group Staff 60 56
total 10,951 11,887
9. Depreciation, amortization, and impairments
9.1. depreciation and amortization2016 2015
Intangible assets 25.2 21.9
Buildings 3.5 3.7
Machinery and equipment 21.4 23.2
total 50.1 48.7
9.2. impairments2016 2015
Property, plant, and equipment 2.8 2.4
Intangible assets 0.7 2,9
total 3.5 5.3
The nature of the impairments is described in the disclosures of goodwill, intangible assets and property, plant and equipment (see notes 14 and 15).
10. Financial income and expenses
10.1. financial income2016 2015
Interest income on bank deposits and loans 0.8 1.1
Exchange rate gains 0.0 6.5
Other financial income 0.1 0.2
total 0.9 7.8
10.2. financial expenses2016 2015
Interest expenses on liabilities 10.9 11.2
Net loss on financial instruments at fair value through profit or loss 14.6 0.0
Exchange rate loss 3.3 5.4
Other financial expenses 6.7 3.7
total 35.6 20.3
financial income and expenses net -34.6 -12.5
The company applies hedge accounting on derivatives used to hedge cash flows in certain large crane projects as well as to the USD nominated purchase price of MHPS acquisition. The cash flow hedges of the expected future cash flows are assessed to be highly effective and a net unrealized effect of EUR 15.0 million (2015: EUR -9.1 million) with deferred taxes of EUR -3.8 million (2015: EUR 2.3 million) relating to the hedging instru-ments is included in equity. The hedged operative cash flows are expected to occur during the next 3–18 months while the hedged cash flow for the MHPS acquisition occurred in January 2017. The realized and recycled currency differences from these hedges recorded in the statement of income were EUR -10.3 million in 2016 (EUR -15.1 million in 2015).
11. Income taxes
11.1. taxes in statement of income2016 2015
Local income taxes of group companies 31.9 24.6
Taxes from previous years -2.3 -1.1
Change in deferred taxes -5.1 1.1
total 24.5 24.6
11.2. Reconciliation of income before taxes with total income taxes
2016 2015
Profit before taxes 62.1 55.4
Tax calculated at the domestic corporation tax rate of 20.0% (2015: 20.0%) 12.4 11.1
Effect of different tax rates of foreign subsidiaries 1.2 0.7
Taxes from previous years -2.3 -1.1
Tax effect of non-deductible expenses and tax-exempt income 0.0 1.1
Tax effect of unrecognized tax losses of the current year 6.9 9.5
Tax effect of utilization of previously unrecognized tax losses -0.7 -0.4
Tax effect of recognition of previously unrecognized tax losses -0.9 -2.3
Tax effect of impairment of previously recognized deferred tax assets 5.3 6.4
Tax effect of recognizing the controlled temporary difference from investment in subsidiaries 1.2 -0.9
Tax effect of tax rate change 0.3 0.0
Other items 1.1 0.5
total 24.5 24.6
effective tax rate % 39.5% 44.4%
The Company evaluates regularly the net realizable value of its deferred tax assets. Current year effective tax rate was affected by impairment of previously recognized deferred tax assets in certain Chinese group companies. 2015 effective tax rate includes impairment made for deferred tax assets previously recognized for Indian tax losses carry forwards.
Uncertain tax positionsKonecranes estimates and accrues taxes that will ultimately be payable when reviews or audits by tax authorities of tax returns are completed. On August 14, 2015 Konecranes announced that one of its foreign subsidiaries had become the victim of a fraud. The perpetrators had through identity theft and other fraudulent actions managed to induce the subsidiary to make unwarranted payments for a total amount of EUR 17.0 million. Konecranes has received insurance indemnity of EUR 10 million relating to the fraud. Konecranes has been recorded net of these items as tax deductible based on the information available about the position expected to be taken by the tax authority. However the outcome of the tax assessment is not yet certain.
11.3. tax effects of components in other comprehensive income
2016 2015
Cash flow hedges -6.0 -0.1
Re-measurement gains (losses) on defined benefit plans 3.0 1.4
total -3.0 1.3
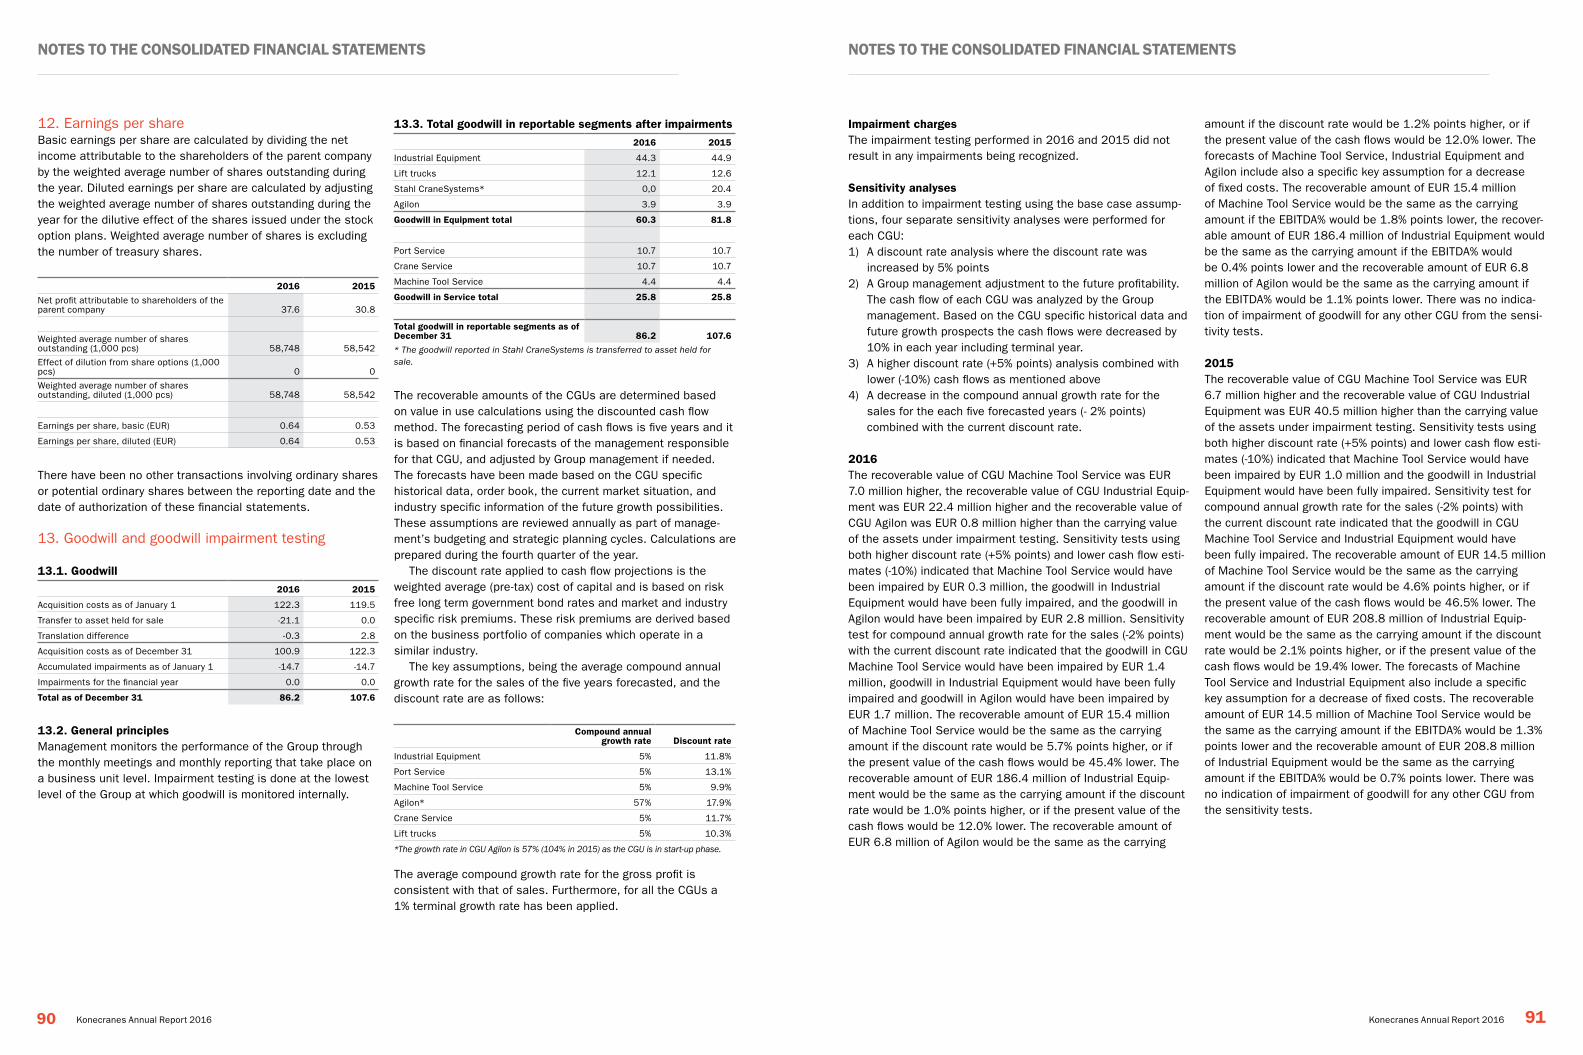
Notes to the coNsolidated fiNaNcial stateMeNts Notes to the coNsolidated fiNaNcial stateMeNts
90 91Konecranes Annual Report 2016 Konecranes Annual Report 2016
12. Earnings per shareBasic earnings per share are calculated by dividing the net income attributable to the shareholders of the parent company by the weighted average number of shares outstanding during the year. Diluted earnings per share are calculated by adjusting the weighted average number of shares outstanding during the year for the dilutive effect of the shares issued under the stock option plans. Weighted average number of shares is excluding the number of treasury shares.
2016 2015
Net profit attributable to shareholders of the parent company 37.6 30.8
Weighted average number of shares outstanding (1,000 pcs) 58,748 58,542
Effect of dilution from share options (1,000 pcs) 0 0
Weighted average number of shares outstanding, diluted (1,000 pcs) 58,748 58,542
Earnings per share, basic (EUR) 0.64 0.53
Earnings per share, diluted (EUR) 0.64 0.53
There have been no other transactions involving ordinary shares or potential ordinary shares between the reporting date and the date of authorization of these financial statements.
13. Goodwill and goodwill impairment testing
13.1. Goodwill2016 2015
Acquisition costs as of January 1 122.3 119.5
Transfer to asset held for sale -21.1 0.0
Translation difference -0.3 2.8
Acquisition costs as of December 31 100.9 122.3
Accumulated impairments as of January 1 -14.7 -14.7
Impairments for the financial year 0.0 0.0
total as of december 31 86.2 107.6
13.2. General principlesManagement monitors the performance of the Group through the monthly meetings and monthly reporting that take place on a business unit level. Impairment testing is done at the lowest level of the Group at which goodwill is monitored internally.
13.3. total goodwill in reportable segments after impairments 2016 2015
Industrial Equipment 44.3 44.9
Lift trucks 12.1 12.6
Stahl CraneSystems* 0,0 20.4
Agilon 3.9 3.9
Goodwill in equipment total 60.3 81.8
Port Service 10.7 10.7
Crane Service 10.7 10.7
Machine Tool Service 4.4 4.4
Goodwill in service total 25.8 25.8
total goodwill in reportable segments as of december 31 86.2 107.6
* The goodwill reported in Stahl CraneSystems is transferred to asset held for sale.
The recoverable amounts of the CGUs are determined based on value in use calculations using the discounted cash flow method. The forecasting period of cash flows is five years and it is based on financial forecasts of the management responsible for that CGU, and adjusted by Group management if needed. The forecasts have been made based on the CGU specific historical data, order book, the current market situation, and industry specific information of the future growth possibilities. These assumptions are reviewed annually as part of manage-ment’s budgeting and strategic planning cycles. Calculations are prepared during the fourth quarter of the year.
The discount rate applied to cash flow projections is the weighted average (pre-tax) cost of capital and is based on risk free long term government bond rates and market and industry specific risk premiums. These risk premiums are derived based on the business portfolio of companies which operate in a similar industry.
The key assumptions, being the average compound annual growth rate for the sales of the five years forecasted, and the discount rate are as follows:
compound annual growth rate discount rate
Industrial Equipment 5% 11.8%
Port Service 5% 13.1%
Machine Tool Service 5% 9.9%
Agilon* 57% 17.9%
Crane Service 5% 11.7%
Lift trucks 5% 10.3%
*The growth rate in CGU Agilon is 57% (104% in 2015) as the CGU is in start-up phase.
The average compound growth rate for the gross profit is consistent with that of sales. Furthermore, for all the CGUs a 1% terminal growth rate has been applied.
impairment chargesThe impairment testing performed in 2016 and 2015 did not result in any impairments being recognized.
sensitivity analysesIn addition to impairment testing using the base case assump-tions, four separate sensitivity analyses were performed for each CGU:1) A discount rate analysis where the discount rate was
increased by 5% points2) A Group management adjustment to the future profitability.
The cash flow of each CGU was analyzed by the Group management. Based on the CGU specific historical data and future growth prospects the cash flows were decreased by 10% in each year including terminal year.
3) A higher discount rate (+5% points) analysis combined with lower (-10%) cash flows as mentioned above
4) A decrease in the compound annual growth rate for the sales for the each five forecasted years (- 2% points) combined with the current discount rate.
2016The recoverable value of CGU Machine Tool Service was EUR 7.0 million higher, the recoverable value of CGU Industrial Equip-ment was EUR 22.4 million higher and the recoverable value of CGU Agilon was EUR 0.8 million higher than the carrying value of the assets under impairment testing. Sensitivity tests using both higher discount rate (+5% points) and lower cash flow esti-mates (-10%) indicated that Machine Tool Service would have been impaired by EUR 0.3 million, the goodwill in Industrial Equipment would have been fully impaired, and the goodwill in Agilon would have been impaired by EUR 2.8 million. Sensitivity test for compound annual growth rate for the sales (-2% points) with the current discount rate indicated that the goodwill in CGU Machine Tool Service would have been impaired by EUR 1.4 million, goodwill in Industrial Equipment would have been fully impaired and goodwill in Agilon would have been impaired by EUR 1.7 million. The recoverable amount of EUR 15.4 million of Machine Tool Service would be the same as the carrying amount if the discount rate would be 5.7% points higher, or if the present value of the cash flows would be 45.4% lower. The recoverable amount of EUR 186.4 million of Industrial Equip-ment would be the same as the carrying amount if the discount rate would be 1.0% points higher, or if the present value of the cash flows would be 12.0% lower. The recoverable amount of EUR 6.8 million of Agilon would be the same as the carrying
amount if the discount rate would be 1.2% points higher, or if the present value of the cash flows would be 12.0% lower. The forecasts of Machine Tool Service, Industrial Equipment and Agilon include also a specific key assumption for a decrease of fixed costs. The recoverable amount of EUR 15.4 million of Machine Tool Service would be the same as the carrying amount if the EBITDA% would be 1.8% points lower, the recover-able amount of EUR 186.4 million of Industrial Equipment would be the same as the carrying amount if the EBITDA% would be 0.4% points lower and the recoverable amount of EUR 6.8 million of Agilon would be the same as the carrying amount if the EBITDA% would be 1.1% points lower. There was no indica-tion of impairment of goodwill for any other CGU from the sensi-tivity tests.
2015The recoverable value of CGU Machine Tool Service was EUR 6.7 million higher and the recoverable value of CGU Industrial Equipment was EUR 40.5 million higher than the carrying value of the assets under impairment testing. Sensitivity tests using both higher discount rate (+5% points) and lower cash flow esti-mates (-10%) indicated that Machine Tool Service would have been impaired by EUR 1.0 million and the goodwill in Industrial Equipment would have been fully impaired. Sensitivity test for compound annual growth rate for the sales (-2% points) with the current discount rate indicated that the goodwill in CGU Machine Tool Service and Industrial Equipment would have been fully impaired. The recoverable amount of EUR 14.5 million of Machine Tool Service would be the same as the carrying amount if the discount rate would be 4.6% points higher, or if the present value of the cash flows would be 46.5% lower. The recoverable amount of EUR 208.8 million of Industrial Equip-ment would be the same as the carrying amount if the discount rate would be 2.1% points higher, or if the present value of the cash flows would be 19.4% lower. The forecasts of Machine Tool Service and Industrial Equipment also include a specific key assumption for a decrease of fixed costs. The recoverable amount of EUR 14.5 million of Machine Tool Service would be the same as the carrying amount if the EBITDA% would be 1.3% points lower and the recoverable amount of EUR 208.8 million of Industrial Equipment would be the same as the carrying amount if the EBITDA% would be 0.7% points lower. There was no indication of impairment of goodwill for any other CGU from the sensitivity tests.
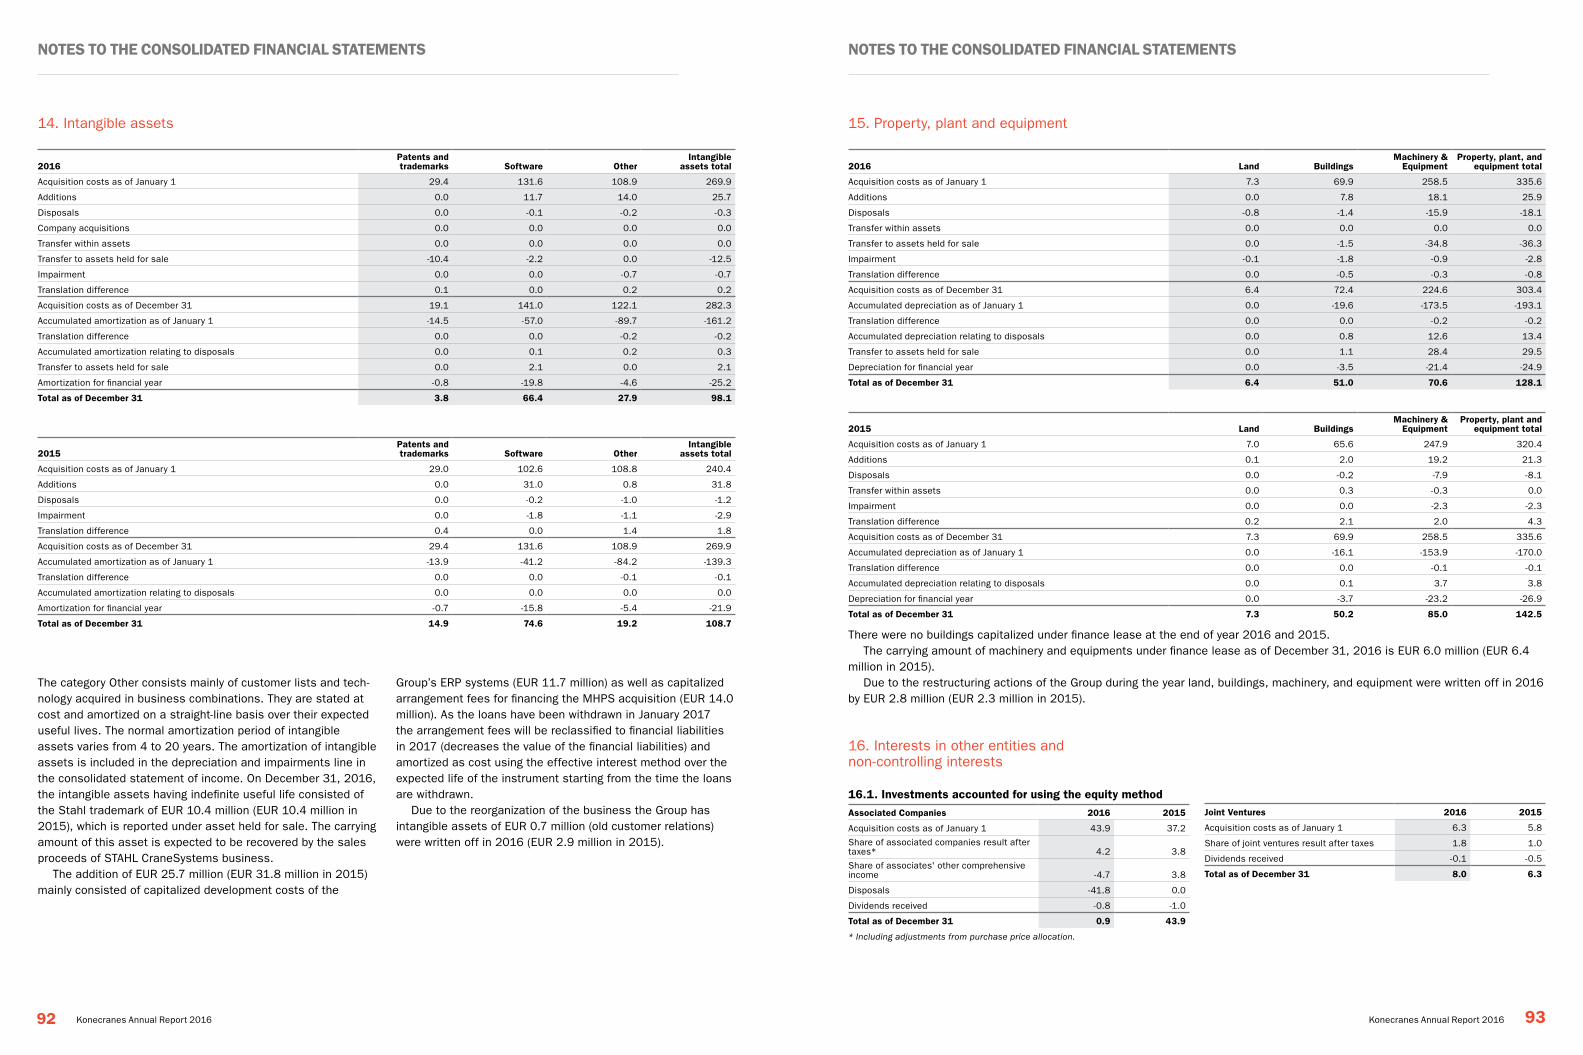
Notes to the coNsolidated fiNaNcial stateMeNts Notes to the coNsolidated fiNaNcial stateMeNts
92 93Konecranes Annual Report 2016 Konecranes Annual Report 2016
14. Intangible assets
2016patents and trademarks software other
intangible assets total
Acquisition costs as of January 1 29.4 131.6 108.9 269.9
Additions 0.0 11.7 14.0 25.7
Disposals 0.0 -0.1 -0.2 -0.3
Company acquisitions 0.0 0.0 0.0 0.0
Transfer within assets 0.0 0.0 0.0 0.0
Transfer to assets held for sale -10.4 -2.2 0.0 -12.5
Impairment 0.0 0.0 -0.7 -0.7
Translation difference 0.1 0.0 0.2 0.2
Acquisition costs as of December 31 19.1 141.0 122.1 282.3
Accumulated amortization as of January 1 -14.5 -57.0 -89.7 -161.2
Translation difference 0.0 0.0 -0.2 -0.2
Accumulated amortization relating to disposals 0.0 0.1 0.2 0.3
Transfer to assets held for sale 0.0 2.1 0.0 2.1
Amortization for financial year -0.8 -19.8 -4.6 -25.2
total as of december 31 3.8 66.4 27.9 98.1
2015patents and trademarks software other
intangible assets total
Acquisition costs as of January 1 29.0 102.6 108.8 240.4
Additions 0.0 31.0 0.8 31.8
Disposals 0.0 -0.2 -1.0 -1.2
Impairment 0.0 -1.8 -1.1 -2.9
Translation difference 0.4 0.0 1.4 1.8
Acquisition costs as of December 31 29.4 131.6 108.9 269.9
Accumulated amortization as of January 1 -13.9 -41.2 -84.2 -139.3
Translation difference 0.0 0.0 -0.1 -0.1
Accumulated amortization relating to disposals 0.0 0.0 0.0 0.0
Amortization for financial year -0.7 -15.8 -5.4 -21.9
total as of december 31 14.9 74.6 19.2 108.7
The category Other consists mainly of customer lists and tech-nology acquired in business combinations. They are stated at cost and amortized on a straight-line basis over their expected useful lives. The normal amortization period of intangible assets varies from 4 to 20 years. The amortization of intangible assets is included in the depreciation and impairments line in the consolidated statement of income. On December 31, 2016, the intangible assets having indefinite useful life consisted of the Stahl trademark of EUR 10.4 million (EUR 10.4 million in 2015), which is reported under asset held for sale. The carrying amount of this asset is expected to be recovered by the sales proceeds of STAHL CraneSystems business.
The addition of EUR 25.7 million (EUR 31.8 million in 2015) mainly consisted of capitalized development costs of the
Group’s ERP systems (EUR 11.7 million) as well as capitalized arrangement fees for financing the MHPS acquisition (EUR 14.0 million). As the loans have been withdrawn in January 2017 the arrangement fees will be reclassified to financial liabilities in 2017 (decreases the value of the financial liabilities) and amortized as cost using the effective interest method over the expected life of the instrument starting from the time the loans are withdrawn.
Due to the reorganization of the business the Group has intangible assets of EUR 0.7 million (old customer relations) were written off in 2016 (EUR 2.9 million in 2015).
15. Property, plant and equipment
2016 land Buildings Machinery &
equipment property, plant, and
equipment total
Acquisition costs as of January 1 7.3 69.9 258.5 335.6
Additions 0.0 7.8 18.1 25.9
Disposals -0.8 -1.4 -15.9 -18.1
Transfer within assets 0.0 0.0 0.0 0.0
Transfer to assets held for sale 0.0 -1.5 -34.8 -36.3
Impairment -0.1 -1.8 -0.9 -2.8
Translation difference 0.0 -0.5 -0.3 -0.8
Acquisition costs as of December 31 6.4 72.4 224.6 303.4
Accumulated depreciation as of January 1 0.0 -19.6 -173.5 -193.1
Translation difference 0.0 0.0 -0.2 -0.2
Accumulated depreciation relating to disposals 0.0 0.8 12.6 13.4
Transfer to assets held for sale 0.0 1.1 28.4 29.5
Depreciation for financial year 0.0 -3.5 -21.4 -24.9
total as of december 31 6.4 51.0 70.6 128.1
2015 land Buildings Machinery &
equipment property, plant and
equipment total
Acquisition costs as of January 1 7.0 65.6 247.9 320.4
Additions 0.1 2.0 19.2 21.3
Disposals 0.0 -0.2 -7.9 -8.1
Transfer within assets 0.0 0.3 -0.3 0.0
Impairment 0.0 0.0 -2.3 -2.3
Translation difference 0.2 2.1 2.0 4.3
Acquisition costs as of December 31 7.3 69.9 258.5 335.6
Accumulated depreciation as of January 1 0.0 -16.1 -153.9 -170.0
Translation difference 0.0 0.0 -0.1 -0.1
Accumulated depreciation relating to disposals 0.0 0.1 3.7 3.8
Depreciation for financial year 0.0 -3.7 -23.2 -26.9
total as of december 31 7.3 50.2 85.0 142.5
There were no buildings capitalized under finance lease at the end of year 2016 and 2015.The carrying amount of machinery and equipments under finance lease as of December 31, 2016 is EUR 6.0 million (EUR 6.4
million in 2015).Due to the restructuring actions of the Group during the year land, buildings, machinery, and equipment were written off in 2016
by EUR 2.8 million (EUR 2.3 million in 2015).
16. Interests in other entities and non-controlling interests
16.1. investments accounted for using the equity methodassociated companies 2016 2015
Acquisition costs as of January 1 43.9 37.2
Share of associated companies result after taxes* 4.2 3.8
Share of associates' other comprehensive income -4.7 3.8
Disposals -41.8 0.0
Dividends received -0.8 -1.0
total as of december 31 0.9 43.9
* Including adjustments from purchase price allocation.
Joint Ventures 2016 2015
Acquisition costs as of January 1 6.3 5.8
Share of joint ventures result after taxes 1.8 1.0
Dividends received -0.1 -0.5
total as of december 31 8.0 6.3
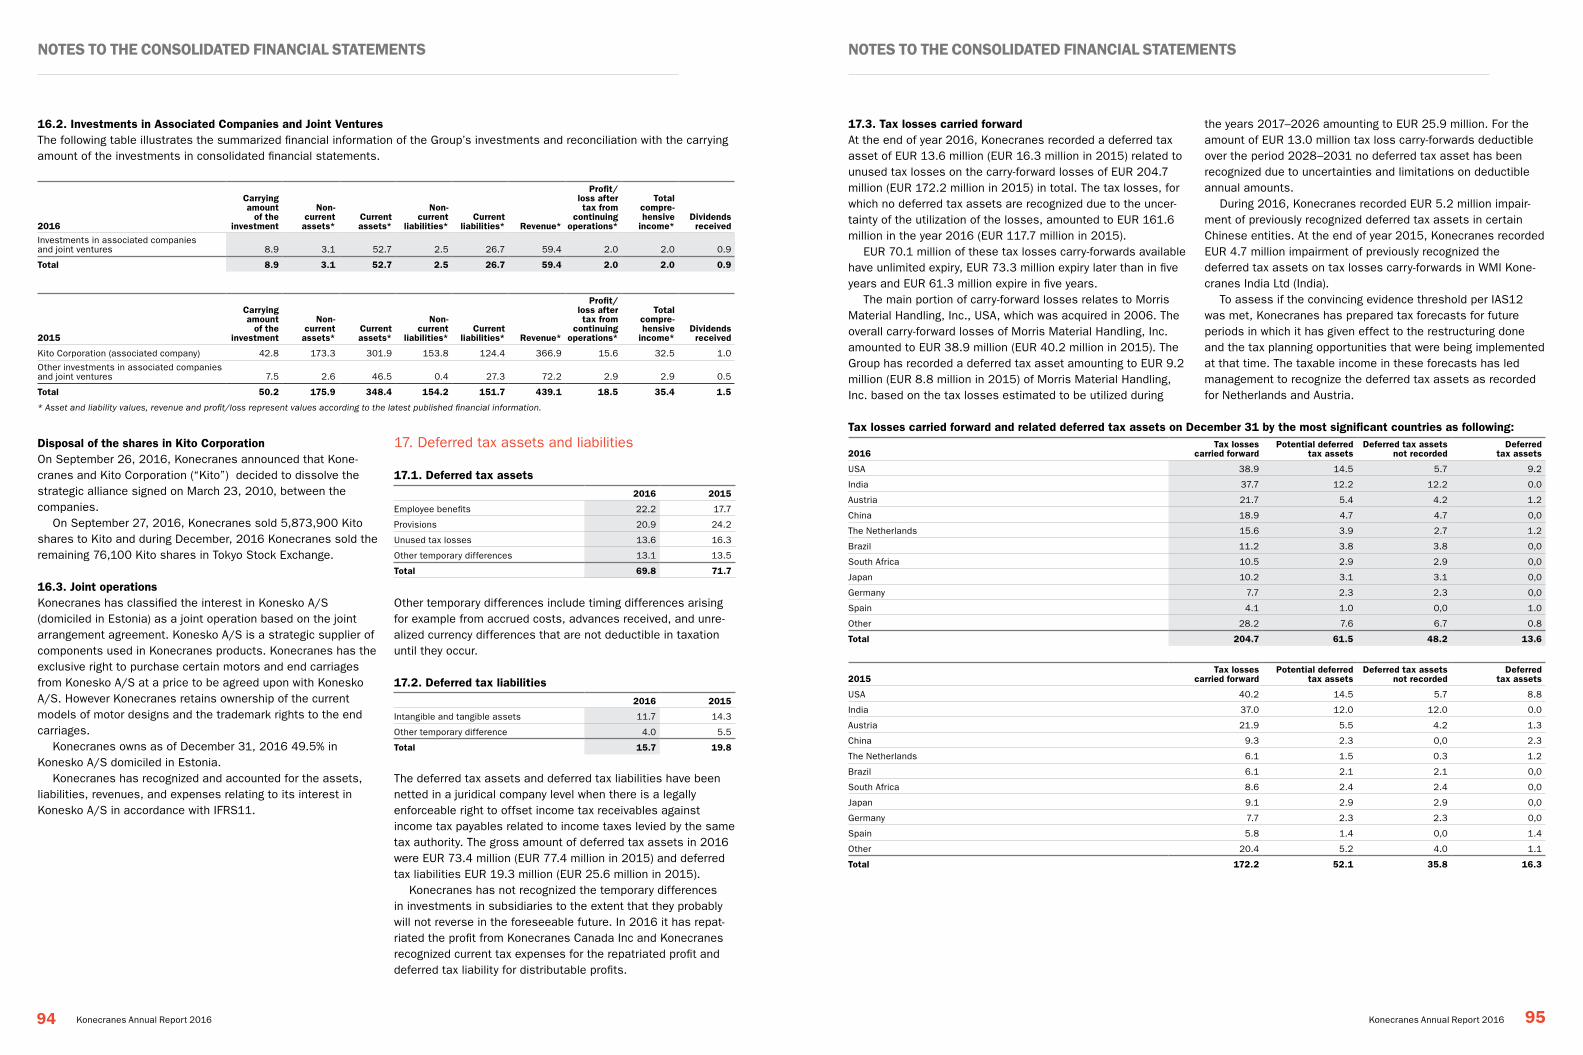
Notes to the coNsolidated fiNaNcial stateMeNts Notes to the coNsolidated fiNaNcial stateMeNts
94 95Konecranes Annual Report 2016 Konecranes Annual Report 2016
16.2. investments in associated companies and Joint VenturesThe following table illustrates the summarized financial information of the Group’s investments and reconciliation with the carrying amount of the investments in consolidated financial statements.
2016
carrying amount
of the investment
Non- current
assets* current assets*
Non- current
liabilities* current
liabilities* Revenue*
profit/ loss after tax from
continuing operations*
total compre-hensive
income* dividends
received
Investments in associated companies and joint ventures 8.9 3.1 52.7 2.5 26.7 59.4 2.0 2.0 0.9
total 8.9 3.1 52.7 2.5 26.7 59.4 2.0 2.0 0.9
2015
carrying amount
of the investment
Non- current
assets* current assets*
Non- current
liabilities* current
liabilities* Revenue*
profit/ loss after tax from
continuing operations*
total compre-hensive
income* dividends
received
Kito Corporation (associated company) 42.8 173.3 301.9 153.8 124.4 366.9 15.6 32.5 1.0
Other investments in associated companies and joint ventures 7.5 2.6 46.5 0.4 27.3 72.2 2.9 2.9 0.5
total 50.2 175.9 348.4 154.2 151.7 439.1 18.5 35.4 1.5
* Asset and liability values, revenue and profit/loss represent values according to the latest published financial information.
disposal of the shares in Kito corporationOn September 26, 2016, Konecranes announced that Kone-cranes and Kito Corporation (“Kito”) decided to dissolve the strategic alliance signed on March 23, 2010, between the companies.
On September 27, 2016, Konecranes sold 5,873,900 Kito shares to Kito and during December, 2016 Konecranes sold the remaining 76,100 Kito shares in Tokyo Stock Exchange.
16.3. Joint operationsKonecranes has classified the interest in Konesko A/S (domiciled in Estonia) as a joint operation based on the joint arrangement agreement. Konesko A/S is a strategic supplier of components used in Konecranes products. Konecranes has the exclusive right to purchase certain motors and end carriages from Konesko A/S at a price to be agreed upon with Konesko A/S. However Konecranes retains ownership of the current models of motor designs and the trademark rights to the end carriages.
Konecranes owns as of December 31, 2016 49.5% in Konesko A/S domiciled in Estonia.
Konecranes has recognized and accounted for the assets, liabilities, revenues, and expenses relating to its interest in Konesko A/S in accordance with IFRS11.
17. Deferred tax assets and liabilities
17.1. deferred tax assets2016 2015
Employee benefits 22.2 17.7
Provisions 20.9 24.2
Unused tax losses 13.6 16.3
Other temporary differences 13.1 13.5
total 69.8 71.7
Other temporary differences include timing differences arising for example from accrued costs, advances received, and unre-alized currency differences that are not deductible in taxation until they occur.
17.2. deferred tax liabilities2016 2015
Intangible and tangible assets 11.7 14.3
Other temporary difference 4.0 5.5
total 15.7 19.8
The deferred tax assets and deferred tax liabilities have been netted in a juridical company level when there is a legally enforceable right to offset income tax receivables against income tax payables related to income taxes levied by the same tax authority. The gross amount of deferred tax assets in 2016 were EUR 73.4 million (EUR 77.4 million in 2015) and deferred tax liabilities EUR 19.3 million (EUR 25.6 million in 2015).
Konecranes has not recognized the temporary differences in investments in subsidiaries to the extent that they probably will not reverse in the foreseeable future. In 2016 it has repat-riated the profit from Konecranes Canada Inc and Konecranes recognized current tax expenses for the repatriated profit and deferred tax liability for distributable profits.
17.3. tax losses carried forwardAt the end of year 2016, Konecranes recorded a deferred tax asset of EUR 13.6 million (EUR 16.3 million in 2015) related to unused tax losses on the carry-forward losses of EUR 204.7 million (EUR 172.2 million in 2015) in total. The tax losses, for which no deferred tax assets are recognized due to the uncer-tainty of the utilization of the losses, amounted to EUR 161.6 million in the year 2016 (EUR 117.7 million in 2015).
EUR 70.1 million of these tax losses carry-forwards available have unlimited expiry, EUR 73.3 million expiry later than in five years and EUR 61.3 million expire in five years.
The main portion of carry-forward losses relates to Morris Material Handling, Inc., USA, which was acquired in 2006. The overall carry-forward losses of Morris Material Handling, Inc. amounted to EUR 38.9 million (EUR 40.2 million in 2015). The Group has recorded a deferred tax asset amounting to EUR 9.2 million (EUR 8.8 million in 2015) of Morris Material Handling, Inc. based on the tax losses estimated to be utilized during
the years 2017–2026 amounting to EUR 25.9 million. For the amount of EUR 13.0 million tax loss carry-forwards deductible over the period 2028–2031 no deferred tax asset has been recognized due to uncertainties and limitations on deductible annual amounts.
During 2016, Konecranes recorded EUR 5.2 million impair-ment of previously recognized deferred tax assets in certain Chinese entities. At the end of year 2015, Konecranes recorded EUR 4.7 million impairment of previously recognized the deferred tax assets on tax losses carry-forwards in WMI Kone-cranes India Ltd (India).
To assess if the convincing evidence threshold per IAS12 was met, Konecranes has prepared tax forecasts for future periods in which it has given effect to the restructuring done and the tax planning opportunities that were being implemented at that time. The taxable income in these forecasts has led management to recognize the deferred tax assets as recorded for Netherlands and Austria.
tax losses carried forward and related deferred tax assets on december 31 by the most significant countries as following:
2016 tax losses
carried forward potential deferred
tax assets deferred tax assets
not recorded deferred
tax assets
USA 38.9 14.5 5.7 9.2
India 37.7 12.2 12.2 0.0
Austria 21.7 5.4 4.2 1.2
China 18.9 4.7 4.7 0,0
The Netherlands 15.6 3.9 2.7 1.2
Brazil 11.2 3.8 3.8 0,0
South Africa 10.5 2.9 2.9 0,0
Japan 10.2 3.1 3.1 0,0
Germany 7.7 2.3 2.3 0,0
Spain 4.1 1.0 0,0 1.0
Other 28.2 7.6 6.7 0.8
total 204.7 61.5 48.2 13.6
2015 tax losses
carried forward potential deferred
tax assets deferred tax assets
not recorded deferred
tax assets
USA 40.2 14.5 5.7 8.8
India 37.0 12.0 12.0 0.0
Austria 21.9 5.5 4.2 1.3
China 9.3 2.3 0,0 2.3
The Netherlands 6.1 1.5 0.3 1.2
Brazil 6.1 2.1 2.1 0,0
South Africa 8.6 2.4 2.4 0,0
Japan 9.1 2.9 2.9 0,0
Germany 7.7 2.3 2.3 0,0
Spain 5.8 1.4 0,0 1.4
Other 20.4 5.2 4.0 1.1
total 172.2 52.1 35.8 16.3
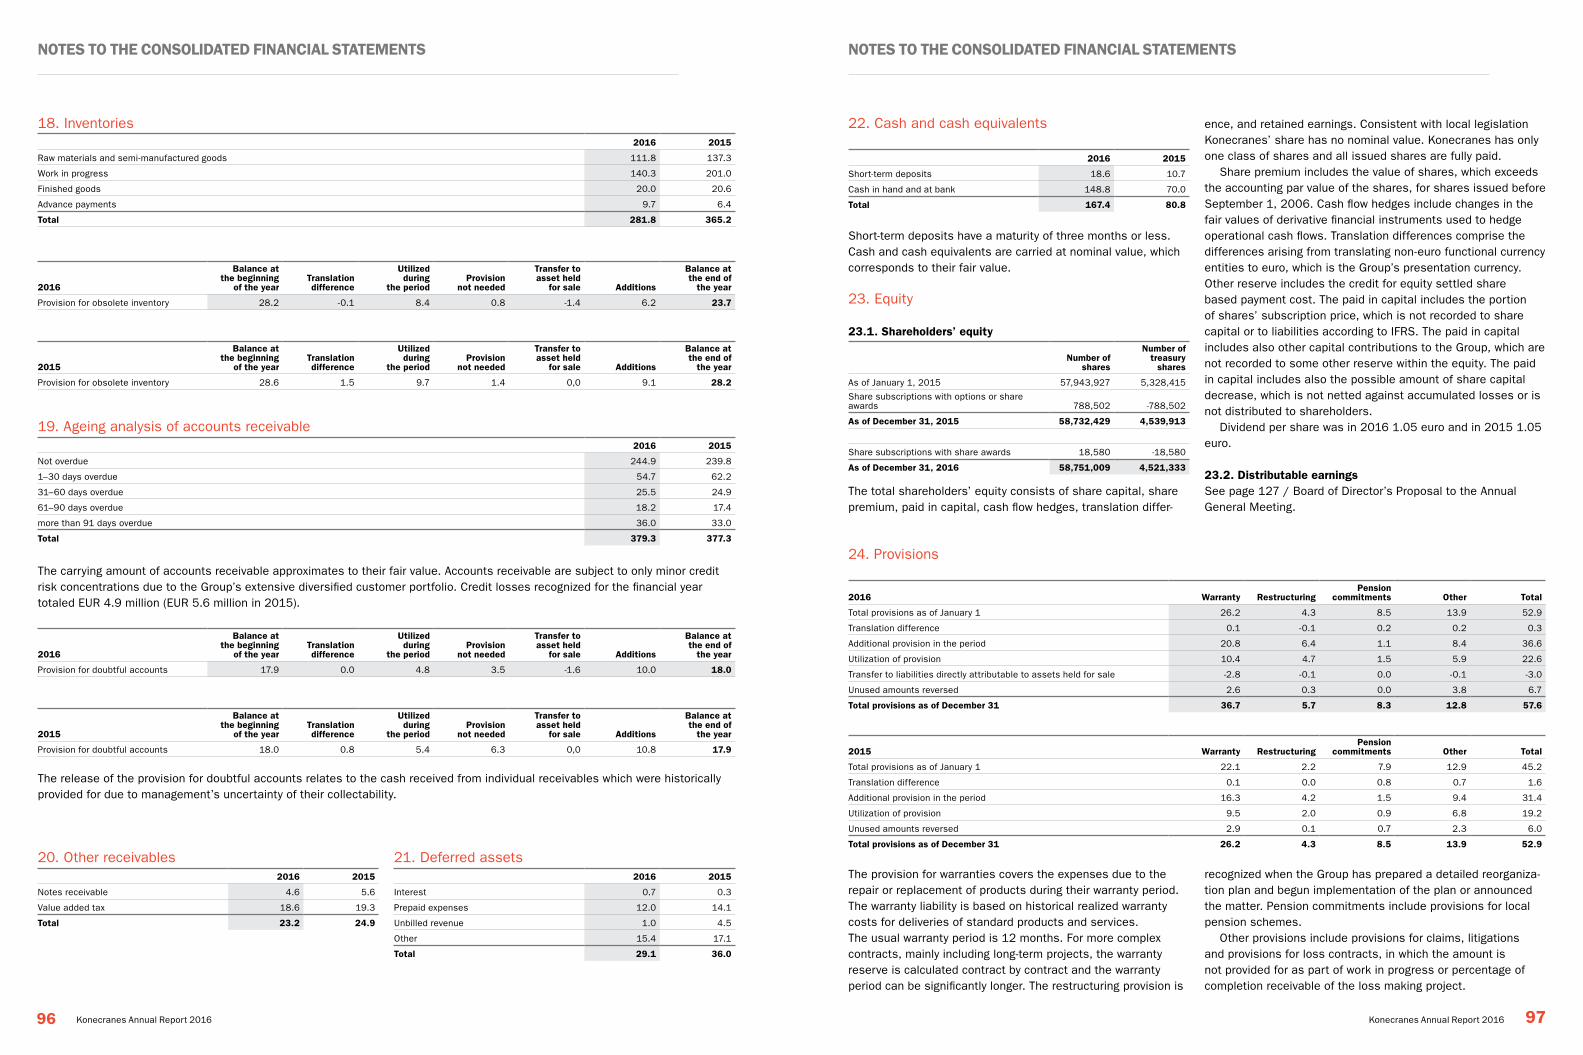
Notes to the coNsolidated fiNaNcial stateMeNts Notes to the coNsolidated fiNaNcial stateMeNts
96 97Konecranes Annual Report 2016 Konecranes Annual Report 2016
18. Inventories2016 2015
Raw materials and semi-manufactured goods 111.8 137.3
Work in progress 140.3 201.0
Finished goods 20.0 20.6
Advance payments 9.7 6.4
total 281.8 365.2
2016
Balance at the beginning
of the year translation
difference
Utilized during
the period provision
not needed
transfer to asset held
for sale additions
Balance at the end of
the year
Provision for obsolete inventory 28.2 -0.1 8.4 0.8 -1.4 6.2 23.7
2015
Balance at the beginning
of the year translation
difference
Utilized during
the period provision
not needed
transfer to asset held
for sale additions
Balance at the end of
the year
Provision for obsolete inventory 28.6 1.5 9.7 1.4 0,0 9.1 28.2
19. Ageing analysis of accounts receivable 2016 2015
Not overdue 244.9 239.8
1–30 days overdue 54.7 62.2
31–60 days overdue 25.5 24.9
61–90 days overdue 18.2 17.4
more than 91 days overdue 36.0 33.0
total 379.3 377.3
The carrying amount of accounts receivable approximates to their fair value. Accounts receivable are subject to only minor credit risk concentrations due to the Group’s extensive diversified customer portfolio. Credit losses recognized for the financial year totaled EUR 4.9 million (EUR 5.6 million in 2015).
2016
Balance at the beginning
of the year translation
difference
Utilized during
the period provision
not needed
transfer to asset held
for sale additions
Balance at the end of
the year
Provision for doubtful accounts 17.9 0.0 4.8 3.5 -1.6 10.0 18.0
2015
Balance at the beginning
of the year translation
difference
Utilized during
the period provision
not needed
transfer to asset held
for sale additions
Balance at the end of
the year
Provision for doubtful accounts 18.0 0.8 5.4 6.3 0,0 10.8 17.9
The release of the provision for doubtful accounts relates to the cash received from individual receivables which were historically provided for due to management’s uncertainty of their collectability.
20. Other receivables2016 2015
Notes receivable 4.6 5.6
Value added tax 18.6 19.3
total 23.2 24.9
21. Deferred assets2016 2015
Interest 0.7 0.3
Prepaid expenses 12.0 14.1
Unbilled revenue 1.0 4.5
Other 15.4 17.1
total 29.1 36.0
22. Cash and cash equivalents
2016 2015
Short-term deposits 18.6 10.7
Cash in hand and at bank 148.8 70.0
total 167.4 80.8
Short-term deposits have a maturity of three months or less. Cash and cash equivalents are carried at nominal value, which corresponds to their fair value.
23. Equity
23.1. shareholders’ equity
Number of shares
Number of treasury shares
As of January 1, 2015 57,943,927 5,328,415
Share subscriptions with options or share awards 788,502 -788,502
as of december 31, 2015 58,732,429 4,539,913
Share subscriptions with share awards 18,580 -18,580
as of december 31, 2016 58,751,009 4,521,333
The total shareholders’ equity consists of share capital, share premium, paid in capital, cash flow hedges, translation differ-
ence, and retained earnings. Consistent with local legislation Konecranes’ share has no nominal value. Konecranes has only one class of shares and all issued shares are fully paid.
Share premium includes the value of shares, which exceeds the accounting par value of the shares, for shares issued before September 1, 2006. Cash flow hedges include changes in the fair values of derivative financial instruments used to hedge operational cash flows. Translation differences comprise the differences arising from translating non-euro functional currency entities to euro, which is the Group’s presentation currency. Other reserve includes the credit for equity settled share based payment cost. The paid in capital includes the portion of shares’ subscription price, which is not recorded to share capital or to liabilities according to IFRS. The paid in capital includes also other capital contributions to the Group, which are not recorded to some other reserve within the equity. The paid in capital includes also the possible amount of share capital decrease, which is not netted against accumulated losses or is not distributed to shareholders.
Dividend per share was in 2016 1.05 euro and in 2015 1.05 euro.
23.2. distributable earnings See page 127 / Board of Director’s Proposal to the Annual General Meeting.
24. Provisions
2016 warranty Restructuring pension
commitments other total
Total provisions as of January 1 26.2 4.3 8.5 13.9 52.9
Translation difference 0.1 -0.1 0.2 0.2 0.3
Additional provision in the period 20.8 6.4 1.1 8.4 36.6
Utilization of provision 10.4 4.7 1.5 5.9 22.6
Transfer to liabilities directly attributable to assets held for sale -2.8 -0.1 0.0 -0.1 -3.0
Unused amounts reversed 2.6 0.3 0.0 3.8 6.7
total provisions as of december 31 36.7 5.7 8.3 12.8 57.6
2015 warranty Restructuring pension
commitments other total
Total provisions as of January 1 22.1 2.2 7.9 12.9 45.2
Translation difference 0.1 0.0 0.8 0.7 1.6
Additional provision in the period 16.3 4.2 1.5 9.4 31.4
Utilization of provision 9.5 2.0 0.9 6.8 19.2
Unused amounts reversed 2.9 0.1 0.7 2.3 6.0
total provisions as of december 31 26.2 4.3 8.5 13.9 52.9
The provision for warranties covers the expenses due to the repair or replacement of products during their warranty period. The warranty liability is based on historical realized warranty costs for deliveries of standard products and services. The usual warranty period is 12 months. For more complex contracts, mainly including long-term projects, the warranty reserve is calculated contract by contract and the warranty period can be significantly longer. The restructuring provision is
recognized when the Group has prepared a detailed reorganiza-tion plan and begun implementation of the plan or announced the matter. Pension commitments include provisions for local pension schemes.
Other provisions include provisions for claims, litigations and provisions for loss contracts, in which the amount is not provided for as part of work in progress or percentage of completion receivable of the loss making project.
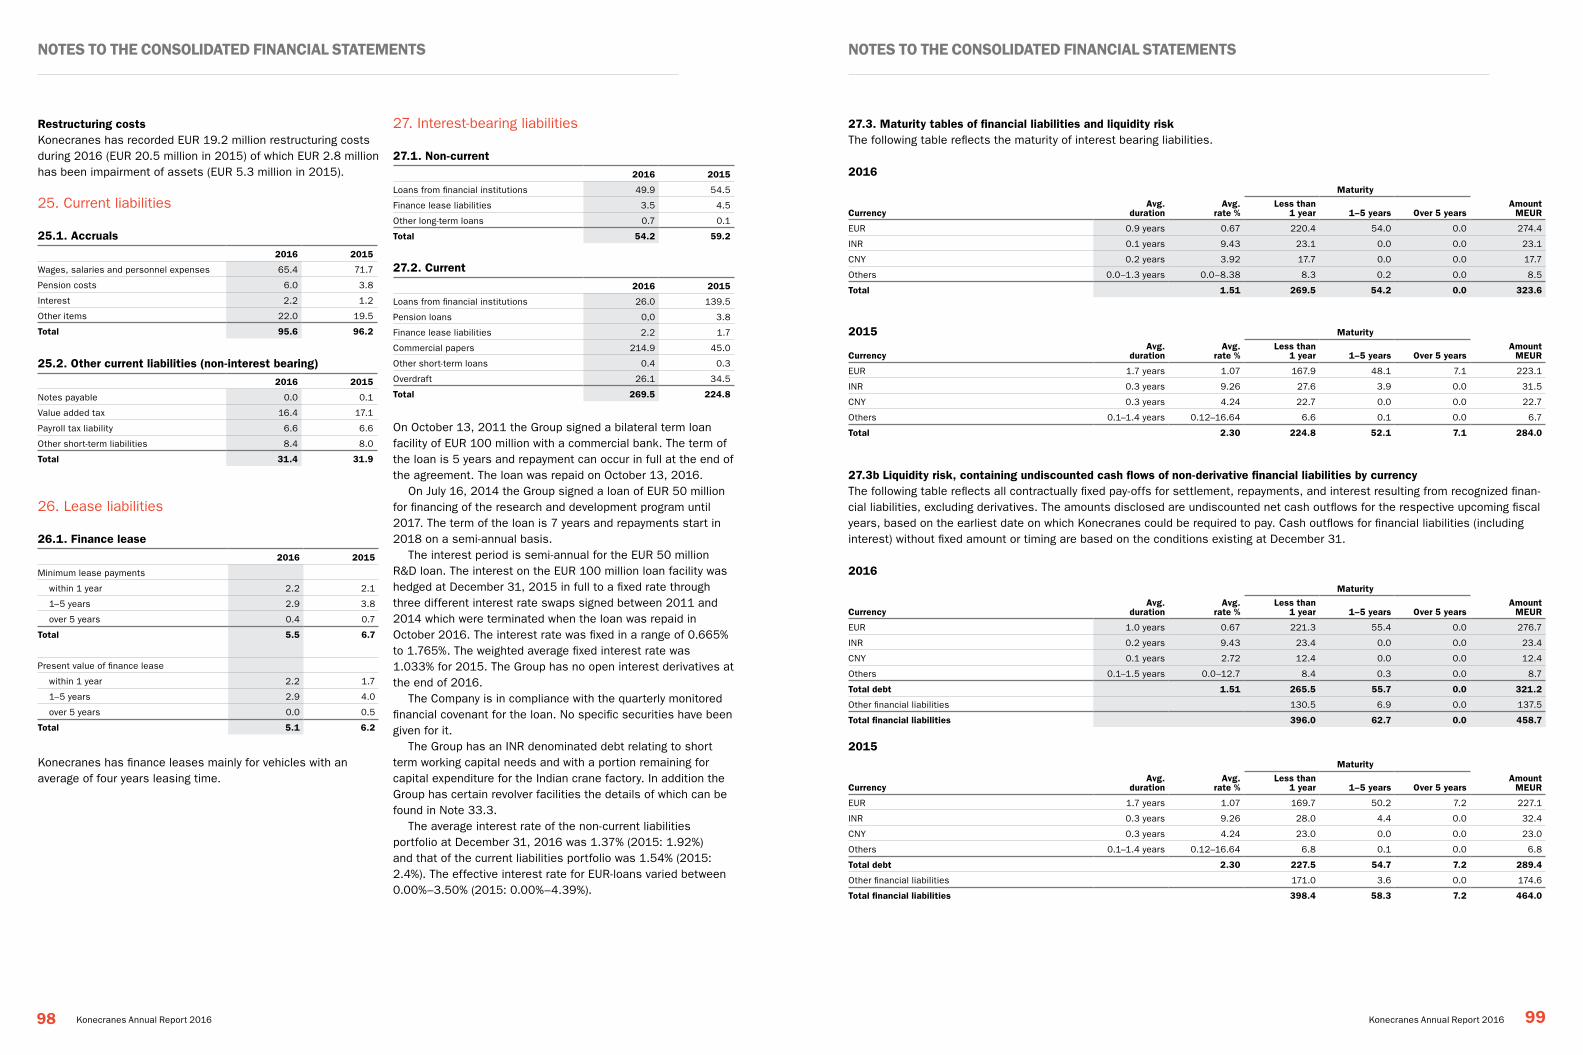
Notes to the coNsolidated fiNaNcial stateMeNts Notes to the coNsolidated fiNaNcial stateMeNts
98 99Konecranes Annual Report 2016 Konecranes Annual Report 2016
Restructuring costsKonecranes has recorded EUR 19.2 million restructuring costs during 2016 (EUR 20.5 million in 2015) of which EUR 2.8 million has been impairment of assets (EUR 5.3 million in 2015).
25. Current liabilities
25.1. accruals2016 2015
Wages, salaries and personnel expenses 65.4 71.7
Pension costs 6.0 3.8
Interest 2.2 1.2
Other items 22.0 19.5
total 95.6 96.2
25.2. other current liabilities (non-interest bearing)2016 2015
Notes payable 0.0 0.1
Value added tax 16.4 17.1
Payroll tax liability 6.6 6.6
Other short-term liabilities 8.4 8.0
total 31.4 31.9
26. Lease liabilities
26.1. finance lease2016 2015
Minimum lease payments
within 1 year 2.2 2.1
1–5 years 2.9 3.8
over 5 years 0.4 0.7
total 5.5 6.7
Present value of finance lease
within 1 year 2.2 1.7
1–5 years 2.9 4.0
over 5 years 0.0 0.5
total 5.1 6.2
Konecranes has finance leases mainly for vehicles with an average of four years leasing time.
27. Interest-bearing liabilities
27.1. Non-current2016 2015
Loans from financial institutions 49.9 54.5
Finance lease liabilities 3.5 4.5
Other long-term loans 0.7 0.1
total 54.2 59.2
27.2. current2016 2015
Loans from financial institutions 26.0 139.5
Pension loans 0,0 3.8
Finance lease liabilities 2.2 1.7
Commercial papers 214.9 45.0
Other short-term loans 0.4 0.3
Overdraft 26.1 34.5
total 269.5 224.8
On October 13, 2011 the Group signed a bilateral term loan facility of EUR 100 million with a commercial bank. The term of the loan is 5 years and repayment can occur in full at the end of the agreement. The loan was repaid on October 13, 2016.
On July 16, 2014 the Group signed a loan of EUR 50 million for financing of the research and development program until 2017. The term of the loan is 7 years and repayments start in 2018 on a semi-annual basis.
The interest period is semi-annual for the EUR 50 million R&D loan. The interest on the EUR 100 million loan facility was hedged at December 31, 2015 in full to a fixed rate through three different interest rate swaps signed between 2011 and 2014 which were terminated when the loan was repaid in October 2016. The interest rate was fixed in a range of 0.665% to 1.765%. The weighted average fixed interest rate was 1.033% for 2015. The Group has no open interest derivatives at the end of 2016.
The Company is in compliance with the quarterly monitored financial covenant for the loan. No specific securities have been given for it.
The Group has an INR denominated debt relating to short term working capital needs and with a portion remaining for capital expenditure for the Indian crane factory. In addition the Group has certain revolver facilities the details of which can be found in Note 33.3.
The average interest rate of the non-current liabilities portfolio at December 31, 2016 was 1.37% (2015: 1.92%) and that of the current liabilities portfolio was 1.54% (2015: 2.4%). The effective interest rate for EUR-loans varied between 0.00%–3.50% (2015: 0.00%–4.39%).
27.3. Maturity tables of financial liabilities and liquidity riskThe following table reflects the maturity of interest bearing liabilities.
2016Maturity
currencyavg.
duration avg.
rate % less than
1 year 1–5 years over 5 years amount
MeUR
EUR 0.9 years 0.67 220.4 54.0 0.0 274.4
INR 0.1 years 9.43 23.1 0.0 0.0 23.1
CNY 0.2 years 3.92 17.7 0.0 0.0 17.7
Others 0.0–1.3 years 0.0–8.38 8.3 0.2 0.0 8.5
total 1.51 269.5 54.2 0.0 323.6
2015 Maturity
currencyavg.
duration avg.
rate % less than
1 year 1–5 years over 5 years amount
MeUR
EUR 1.7 years 1.07 167.9 48.1 7.1 223.1
INR 0.3 years 9.26 27.6 3.9 0.0 31.5
CNY 0.3 years 4.24 22.7 0.0 0.0 22.7
Others 0.1–1.4 years 0.12–16.64 6.6 0.1 0.0 6.7
total 2.30 224.8 52.1 7.1 284.0
27.3b liquidity risk, containing undiscounted cash flows of non-derivative financial liabilities by currencyThe following table reflects all contractually fixed pay-offs for settlement, repayments, and interest resulting from recognized finan-cial liabilities, excluding derivatives. The amounts disclosed are undiscounted net cash outflows for the respective upcoming fiscal years, based on the earliest date on which Konecranes could be required to pay. Cash outflows for financial liabilities (including interest) without fixed amount or timing are based on the conditions existing at December 31.
2016Maturity
currencyavg.
duration avg.
rate % less than
1 year 1–5 years over 5 years amount
MeUR
EUR 1.0 years 0.67 221.3 55.4 0.0 276.7
INR 0.2 years 9.43 23.4 0.0 0.0 23.4
CNY 0.1 years 2.72 12.4 0.0 0.0 12.4
Others 0.1–1.5 years 0.0–12.7 8.4 0.3 0.0 8.7
total debt 1.51 265.5 55.7 0.0 321.2
Other financial liabilities 130.5 6.9 0.0 137.5
total financial liabilities 396.0 62.7 0.0 458.7
2015Maturity
currencyavg.
duration avg.
rate % less than
1 year 1–5 years over 5 years amount
MeUR
EUR 1.7 years 1.07 169.7 50.2 7.2 227.1
INR 0.3 years 9.26 28.0 4.4 0.0 32.4
CNY 0.3 years 4.24 23.0 0.0 0.0 23.0
Others 0.1–1.4 years 0.12–16.64 6.8 0.1 0.0 6.8
total debt 2.30 227.5 54.7 7.2 289.4
Other financial liabilities 171.0 3.6 0.0 174.6
total financial liabilities 398.4 58.3 7.2 464.0
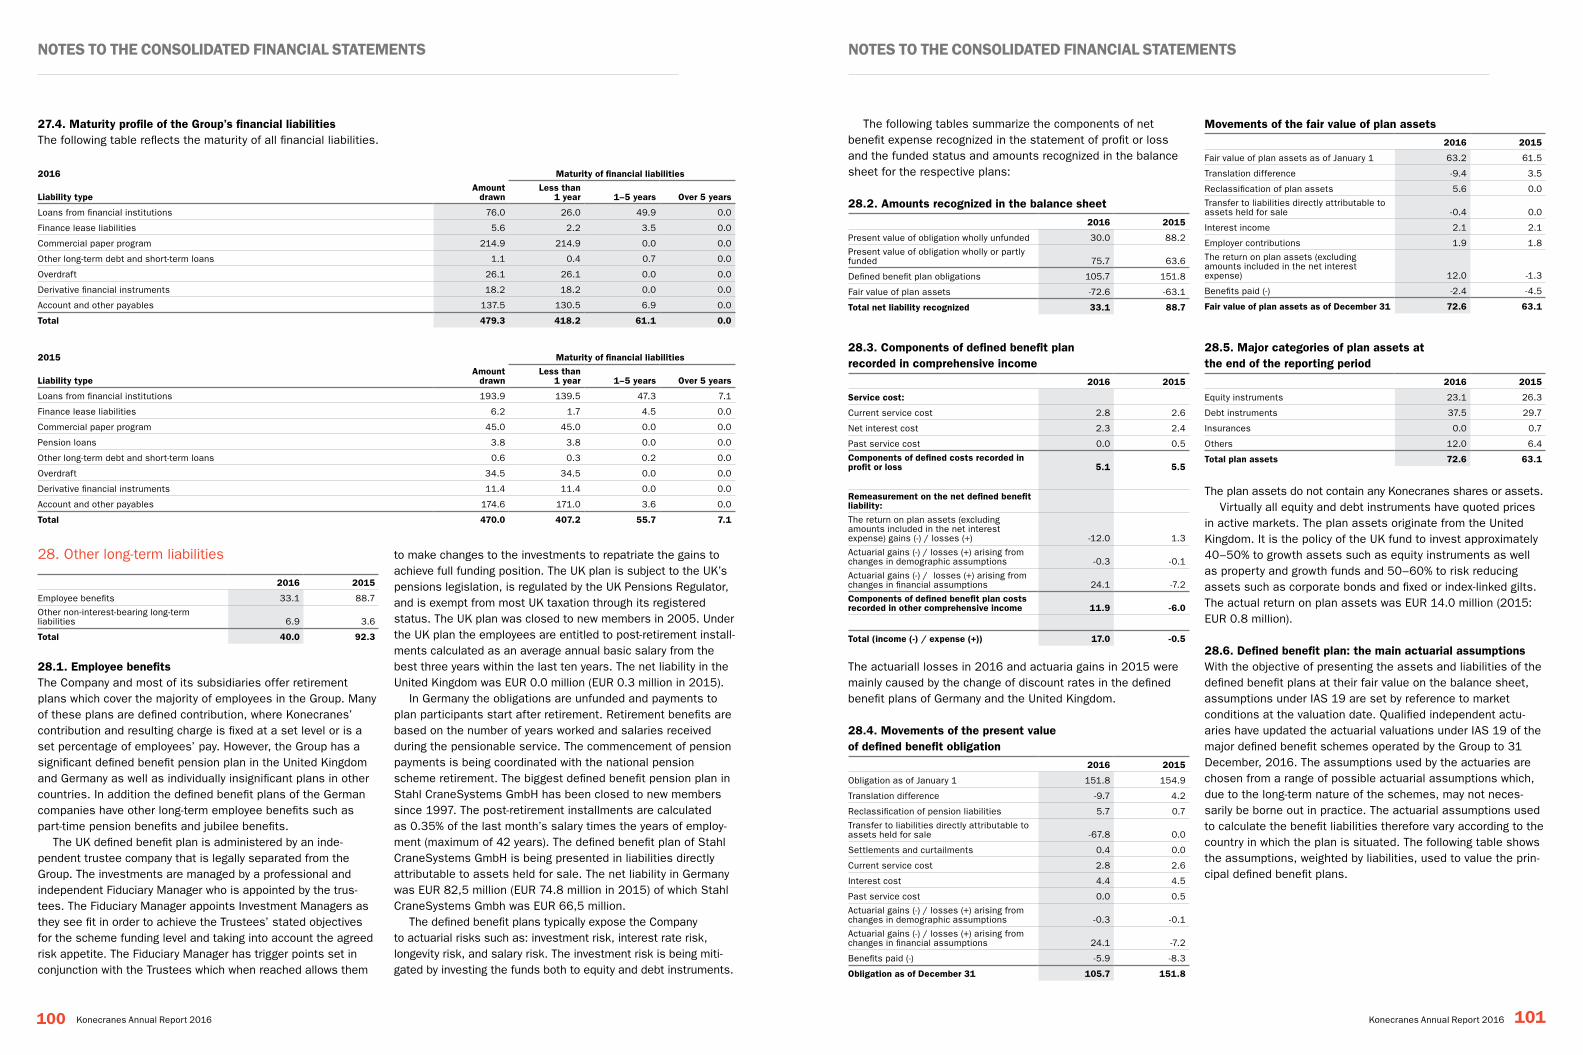
Notes to the coNsolidated fiNaNcial stateMeNts Notes to the coNsolidated fiNaNcial stateMeNts
100 101Konecranes Annual Report 2016 Konecranes Annual Report 2016
27.4. Maturity profile of the Group’s financial liabilitiesThe following table reflects the maturity of all financial liabilities.
2016 Maturity of financial liabilities
liability typeamount
drawn less than
1 year 1–5 years over 5 years
Loans from financial institutions 76.0 26.0 49.9 0.0
Finance lease liabilities 5.6 2.2 3.5 0.0
Commercial paper program 214.9 214.9 0.0 0.0
Other long-term debt and short-term loans 1.1 0.4 0.7 0.0
Overdraft 26.1 26.1 0.0 0.0
Derivative financial instruments 18.2 18.2 0.0 0.0
Account and other payables 137.5 130.5 6.9 0.0
total 479.3 418.2 61.1 0.0
2015 Maturity of financial liabilities
liability typeamount
drawn less than
1 year 1–5 years over 5 years
Loans from financial institutions 193.9 139.5 47.3 7.1
Finance lease liabilities 6.2 1.7 4.5 0.0
Commercial paper program 45.0 45.0 0.0 0.0
Pension loans 3.8 3.8 0.0 0.0
Other long-term debt and short-term loans 0.6 0.3 0.2 0.0
Overdraft 34.5 34.5 0.0 0.0
Derivative financial instruments 11.4 11.4 0.0 0.0
Account and other payables 174.6 171.0 3.6 0.0
total 470.0 407.2 55.7 7.1
28. Other long-term liabilities
2016 2015
Employee benefits 33.1 88.7
Other non-interest-bearing long-term liabilities 6.9 3.6
total 40.0 92.3
28.1. employee benefitsThe Company and most of its subsidiaries offer retirement plans which cover the majority of employees in the Group. Many of these plans are defined contribution, where Konecranes’ contribution and resulting charge is fixed at a set level or is a set percentage of employees’ pay. However, the Group has a significant defined benefit pension plan in the United Kingdom and Germany as well as individually insignificant plans in other countries. In addition the defined benefit plans of the German companies have other long-term employee benefits such as part-time pension benefits and jubilee benefits.
The UK defined benefit plan is administered by an inde-pendent trustee company that is legally separated from the Group. The investments are managed by a professional and independent Fiduciary Manager who is appointed by the trus-tees. The Fiduciary Manager appoints Investment Managers as they see fit in order to achieve the Trustees’ stated objectives for the scheme funding level and taking into account the agreed risk appetite. The Fiduciary Manager has trigger points set in conjunction with the Trustees which when reached allows them
to make changes to the investments to repatriate the gains to achieve full funding position. The UK plan is subject to the UK’s pensions legislation, is regulated by the UK Pensions Regulator, and is exempt from most UK taxation through its registered status. The UK plan was closed to new members in 2005. Under the UK plan the employees are entitled to post-retirement install-ments calculated as an average annual basic salary from the best three years within the last ten years. The net liability in the United Kingdom was EUR 0.0 million (EUR 0.3 million in 2015).
In Germany the obligations are unfunded and payments to plan participants start after retirement. Retirement benefits are based on the number of years worked and salaries received during the pensionable service. The commencement of pension payments is being coordinated with the national pension scheme retirement. The biggest defined benefit pension plan in Stahl CraneSystems GmbH has been closed to new members since 1997. The post-retirement installments are calculated as 0.35% of the last month’s salary times the years of employ-ment (maximum of 42 years). The defined benefit plan of Stahl CraneSystems GmbH is being presented in liabilities directly attributable to assets held for sale. The net liability in Germany was EUR 82,5 million (EUR 74.8 million in 2015) of which Stahl CraneSystems Gmbh was EUR 66,5 million.
The defined benefit plans typically expose the Company to actuarial risks such as: investment risk, interest rate risk, longevity risk, and salary risk. The investment risk is being miti-gated by investing the funds both to equity and debt instruments.
The following tables summarize the components of net benefit expense recognized in the statement of profit or loss and the funded status and amounts recognized in the balance sheet for the respective plans:
28.2. amounts recognized in the balance sheet
2016 2015
Present value of obligation wholly unfunded 30.0 88.2
Present value of obligation wholly or partly funded 75.7 63.6
Defined benefit plan obligations 105.7 151.8
Fair value of plan assets -72.6 -63.1
total net liability recognized 33.1 88.7
28.3. components of defined benefit plan recorded in comprehensive income
2016 2015
service cost:
Current service cost 2.8 2.6
Net interest cost 2.3 2.4
Past service cost 0.0 0.5
components of defined costs recorded in profit or loss 5.1 5.5
Remeasurement on the net defined benefit liability:
The return on plan assets (excluding amounts included in the net interest expense) gains (-) / losses (+) -12.0 1.3
Actuarial gains (-) / losses (+) arising from changes in demographic assumptions -0.3 -0.1
Actuarial gains (-) / losses (+) arising from changes in financial assumptions 24.1 -7.2
components of defined benefit plan costs recorded in other comprehensive income 11.9 -6.0
total (income (-) / expense (+)) 17.0 -0.5
The actuariall losses in 2016 and actuaria gains in 2015 were mainly caused by the change of discount rates in the defined benefit plans of Germany and the United Kingdom.
28.4. Movements of the present value of defined benefit obligation
2016 2015
Obligation as of January 1 151.8 154.9
Translation difference -9.7 4.2
Reclassification of pension liabilities 5.7 0.7
Transfer to liabilities directly attributable to assets held for sale -67.8 0.0
Settlements and curtailments 0.4 0.0
Current service cost 2.8 2.6
Interest cost 4.4 4.5
Past service cost 0.0 0.5
Actuarial gains (-) / losses (+) arising from changes in demographic assumptions -0.3 -0.1
Actuarial gains (-) / losses (+) arising from changes in financial assumptions 24.1 -7.2
Benefits paid (-) -5.9 -8.3
obligation as of december 31 105.7 151.8
Movements of the fair value of plan assets2016 2015
Fair value of plan assets as of January 1 63.2 61.5
Translation difference -9.4 3.5
Reclassification of plan assets 5.6 0.0
Transfer to liabilities directly attributable to assets held for sale -0.4 0.0
Interest income 2.1 2.1
Employer contributions 1.9 1.8
The return on plan assets (excluding amounts included in the net interest expense) 12.0 -1.3
Benefits paid (-) -2.4 -4.5
fair value of plan assets as of december 31 72.6 63.1
28.5. Major categories of plan assets at the end of the reporting period
2016 2015
Equity instruments 23.1 26.3
Debt instruments 37.5 29.7
Insurances 0.0 0.7
Others 12.0 6.4
total plan assets 72.6 63.1
The plan assets do not contain any Konecranes shares or assets.Virtually all equity and debt instruments have quoted prices
in active markets. The plan assets originate from the United Kingdom. It is the policy of the UK fund to invest approximately 40–50% to growth assets such as equity instruments as well as property and growth funds and 50–60% to risk reducing assets such as corporate bonds and fixed or index-linked gilts. The actual return on plan assets was EUR 14.0 million (2015: EUR 0.8 million).
28.6. defined benefit plan: the main actuarial assumptionsWith the objective of presenting the assets and liabilities of the defined benefit plans at their fair value on the balance sheet, assumptions under IAS 19 are set by reference to market conditions at the valuation date. Qualified independent actu-aries have updated the actuarial valuations under IAS 19 of the major defined benefit schemes operated by the Group to 31 December, 2016. The assumptions used by the actuaries are chosen from a range of possible actuarial assumptions which, due to the long-term nature of the schemes, may not neces-sarily be borne out in practice. The actuarial assumptions used to calculate the benefit liabilities therefore vary according to the country in which the plan is situated. The following table shows the assumptions, weighted by liabilities, used to value the prin-cipal defined benefit plans.
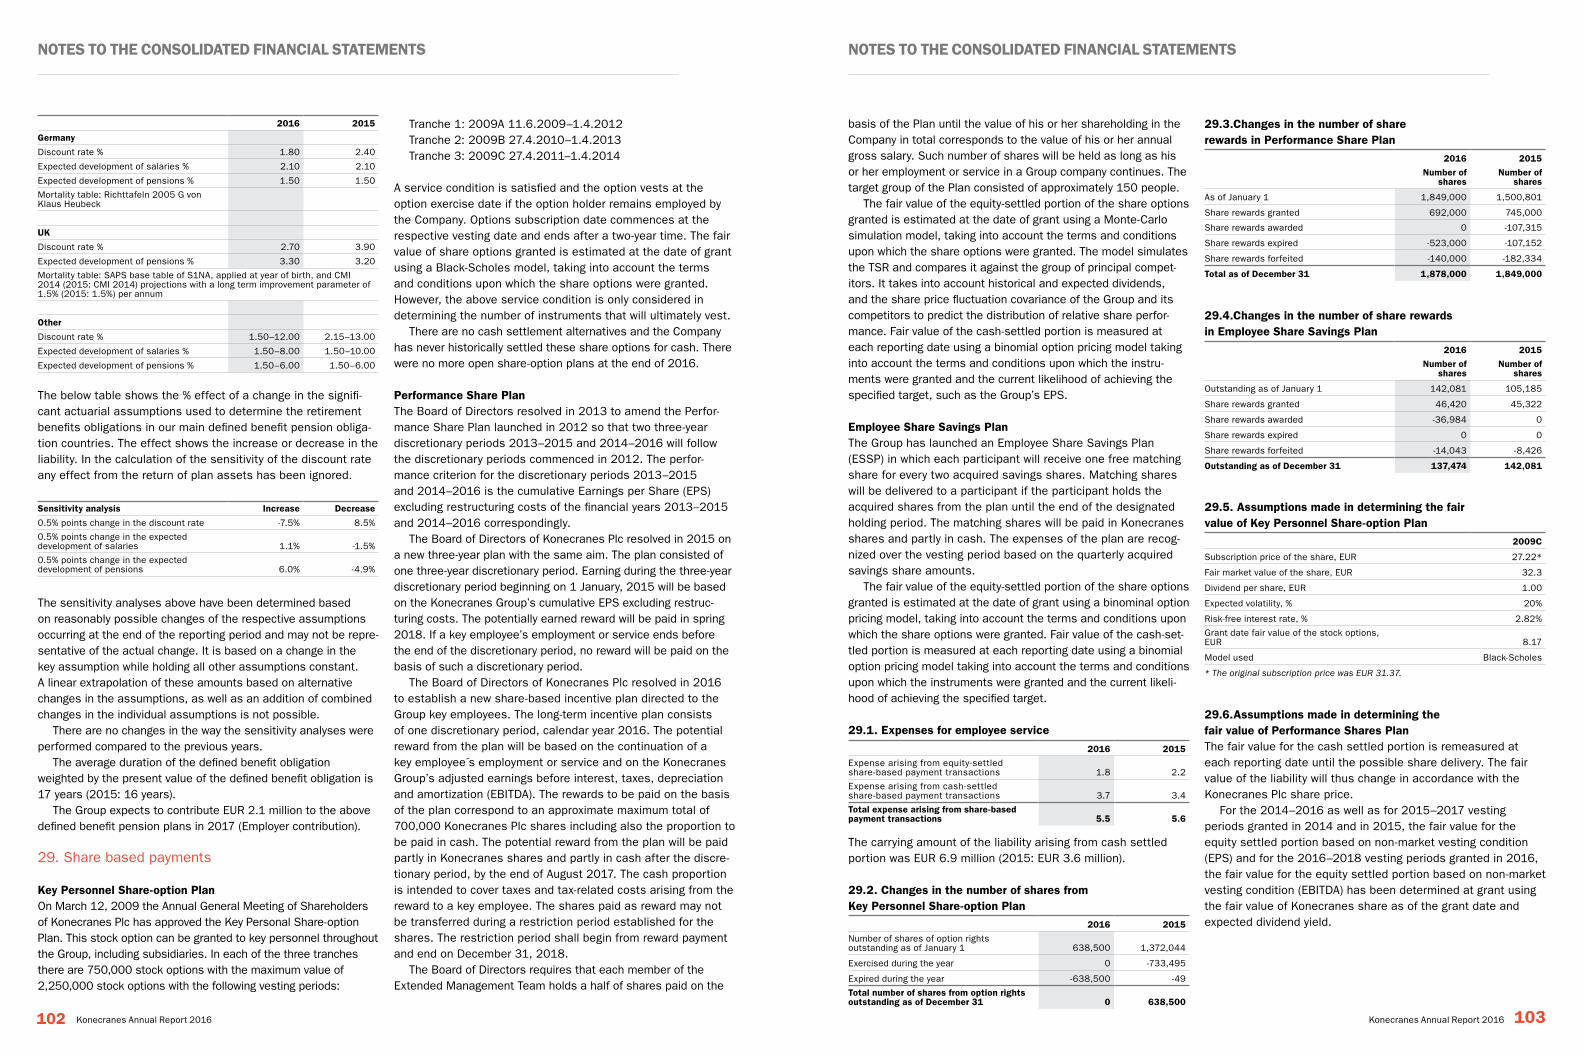
Notes to the coNsolidated fiNaNcial stateMeNts Notes to the coNsolidated fiNaNcial stateMeNts
102 103Konecranes Annual Report 2016 Konecranes Annual Report 2016
2016 2015
Germany
Discount rate % 1.80 2.40
Expected development of salaries % 2.10 2.10
Expected development of pensions % 1.50 1.50
Mortality table: Richttafeln 2005 G von Klaus Heubeck
UK
Discount rate % 2.70 3.90
Expected development of pensions % 3.30 3.20
Mortality table: SAPS base table of S1NA, applied at year of birth, and CMI 2014 (2015: CMI 2014) projections with a long term improvement parameter of 1.5% (2015: 1.5%) per annum
other
Discount rate % 1.50–12.00 2.15–13.00
Expected development of salaries % 1.50–8.00 1.50–10.00
Expected development of pensions % 1.50–6.00 1.50–6.00
The below table shows the % effect of a change in the signifi-cant actuarial assumptions used to determine the retirement benefits obligations in our main defined benefit pension obliga-tion countries. The effect shows the increase or decrease in the liability. In the calculation of the sensitivity of the discount rate any effect from the return of plan assets has been ignored.
sensitivity analysis increase decrease
0.5% points change in the discount rate -7.5% 8.5%
0.5% points change in the expected development of salaries 1.1% -1.5%
0.5% points change in the expected development of pensions 6.0% -4.9%
The sensitivity analyses above have been determined based on reasonably possible changes of the respective assumptions occurring at the end of the reporting period and may not be repre-sentative of the actual change. It is based on a change in the key assumption while holding all other assumptions constant. A linear extrapolation of these amounts based on alternative changes in the assumptions, as well as an addition of combined changes in the individual assumptions is not possible.
There are no changes in the way the sensitivity analyses were performed compared to the previous years.
The average duration of the defined benefit obligation weighted by the present value of the defined benefit obligation is 17 years (2015: 16 years).
The Group expects to contribute EUR 2.1 million to the above defined benefit pension plans in 2017 (Employer contribution).
29. Share based payments
Key personnel share-option planOn March 12, 2009 the Annual General Meeting of Shareholders of Konecranes Plc has approved the Key Personal Share-option Plan. This stock option can be granted to key personnel throughout the Group, including subsidiaries. In each of the three tranches there are 750,000 stock options with the maximum value of 2,250,000 stock options with the following vesting periods:
Tranche 1: 2009A 11.6.2009–1.4.2012 Tranche 2: 2009B 27.4.2010–1.4.2013Tranche 3: 2009C 27.4.2011–1.4.2014
A service condition is satisfied and the option vests at the option exercise date if the option holder remains employed by the Company. Options subscription date commences at the respective vesting date and ends after a two-year time. The fair value of share options granted is estimated at the date of grant using a Black-Scholes model, taking into account the terms and conditions upon which the share options were granted. However, the above service condition is only considered in determining the number of instruments that will ultimately vest.
There are no cash settlement alternatives and the Company has never historically settled these share options for cash. There were no more open share-option plans at the end of 2016.
performance share plan The Board of Directors resolved in 2013 to amend the Perfor-mance Share Plan launched in 2012 so that two three-year discretionary periods 2013–2015 and 2014–2016 will follow the discretionary periods commenced in 2012. The perfor-mance criterion for the discretionary periods 2013–2015 and 2014–2016 is the cumulative Earnings per Share (EPS) excluding restructuring costs of the financial years 2013–2015 and 2014–2016 correspondingly.
The Board of Directors of Konecranes Plc resolved in 2015 on a new three-year plan with the same aim. The plan consisted of one three-year discretionary period. Earning during the three-year discretionary period beginning on 1 January, 2015 will be based on the Konecranes Group’s cumulative EPS excluding restruc-turing costs. The potentially earned reward will be paid in spring 2018. If a key employee’s employment or service ends before the end of the discretionary period, no reward will be paid on the basis of such a discretionary period.
The Board of Directors of Konecranes Plc resolved in 2016 to establish a new share-based incentive plan directed to the Group key employees. The long-term incentive plan consists of one discretionary period, calendar year 2016. The potential reward from the plan will be based on the continuation of a key employee s employment or service and on the Konecranes Group’s adjusted earnings before interest, taxes, depreciation and amortization (EBITDA). The rewards to be paid on the basis of the plan correspond to an approximate maximum total of 700,000 Konecranes Plc shares including also the proportion to be paid in cash. The potential reward from the plan will be paid partly in Konecranes shares and partly in cash after the discre-tionary period, by the end of August 2017. The cash proportion is intended to cover taxes and tax-related costs arising from the reward to a key employee. The shares paid as reward may not be transferred during a restriction period established for the shares. The restriction period shall begin from reward payment and end on December 31, 2018.
The Board of Directors requires that each member of the Extended Management Team holds a half of shares paid on the
basis of the Plan until the value of his or her shareholding in the Company in total corresponds to the value of his or her annual gross salary. Such number of shares will be held as long as his or her employment or service in a Group company continues. The target group of the Plan consisted of approximately 150 people.
The fair value of the equity-settled portion of the share options granted is estimated at the date of grant using a Monte-Carlo simulation model, taking into account the terms and conditions upon which the share options were granted. The model simulates the TSR and compares it against the group of principal compet-itors. It takes into account historical and expected dividends, and the share price fluctuation covariance of the Group and its competitors to predict the distribution of relative share perfor-mance. Fair value of the cash-settled portion is measured at each reporting date using a binomial option pricing model taking into account the terms and conditions upon which the instru-ments were granted and the current likelihood of achieving the specified target, such as the Group’s EPS.
employee share savings planThe Group has launched an Employee Share Savings Plan (ESSP) in which each participant will receive one free matching share for every two acquired savings shares. Matching shares will be delivered to a participant if the participant holds the acquired shares from the plan until the end of the designated holding period. The matching shares will be paid in Konecranes shares and partly in cash. The expenses of the plan are recog-nized over the vesting period based on the quarterly acquired savings share amounts.
The fair value of the equity-settled portion of the share options granted is estimated at the date of grant using a binominal option pricing model, taking into account the terms and conditions upon which the share options were granted. Fair value of the cash-set-tled portion is measured at each reporting date using a binomial option pricing model taking into account the terms and conditions upon which the instruments were granted and the current likeli-hood of achieving the specified target.
29.1. expenses for employee service
2016 2015
Expense arising from equity-settled share-based payment transactions 1.8 2.2
Expense arising from cash-settled share-based payment transactions 3.7 3.4
total expense arising from share-based payment transactions 5.5 5.6
The carrying amount of the liability arising from cash settled portion was EUR 6.9 million (2015: EUR 3.6 million).
29.2. changes in the number of shares from Key personnel share-option plan
2016 2015
Number of shares of option rights outstanding as of January 1 638,500 1,372,044
Exercised during the year 0 -733,495
Expired during the year -638,500 -49
total number of shares from option rights outstanding as of december 31 0 638,500
29.3.changes in the number of share rewards in performance share plan
2016 2015
Number of shares
Number of shares
As of January 1 1,849,000 1,500,801
Share rewards granted 692,000 745,000
Share rewards awarded 0 -107,315
Share rewards expired -523,000 -107,152
Share rewards forfeited -140,000 -182,334
total as of december 31 1,878,000 1,849,000
29.4.changes in the number of share rewards in employee share savings plan
2016 2015
Number of shares
Number of shares
Outstanding as of January 1 142,081 105,185
Share rewards granted 46,420 45,322
Share rewards awarded -36,984 0
Share rewards expired 0 0
Share rewards forfeited -14,043 -8,426
outstanding as of december 31 137,474 142,081
29.5. assumptions made in determining the fair value of Key personnel share-option plan
2009c
Subscription price of the share, EUR 27.22*
Fair market value of the share, EUR 32.3
Dividend per share, EUR 1.00
Expected volatility, % 20%
Risk-free interest rate, % 2.82%
Grant date fair value of the stock options, EUR 8.17
Model used Black-Scholes
* The original subscription price was EUR 31.37.
29.6.assumptions made in determining the fair value of performance shares planThe fair value for the cash settled portion is remeasured at each reporting date until the possible share delivery. The fair value of the liability will thus change in accordance with the Konecranes Plc share price.
For the 2014–2016 as well as for 2015–2017 vesting periods granted in 2014 and in 2015, the fair value for the equity settled portion based on non-market vesting condition (EPS) and for the 2016–2018 vesting periods granted in 2016, the fair value for the equity settled portion based on non-market vesting condition (EBITDA) has been determined at grant using the fair value of Konecranes share as of the grant date and expected dividend yield.
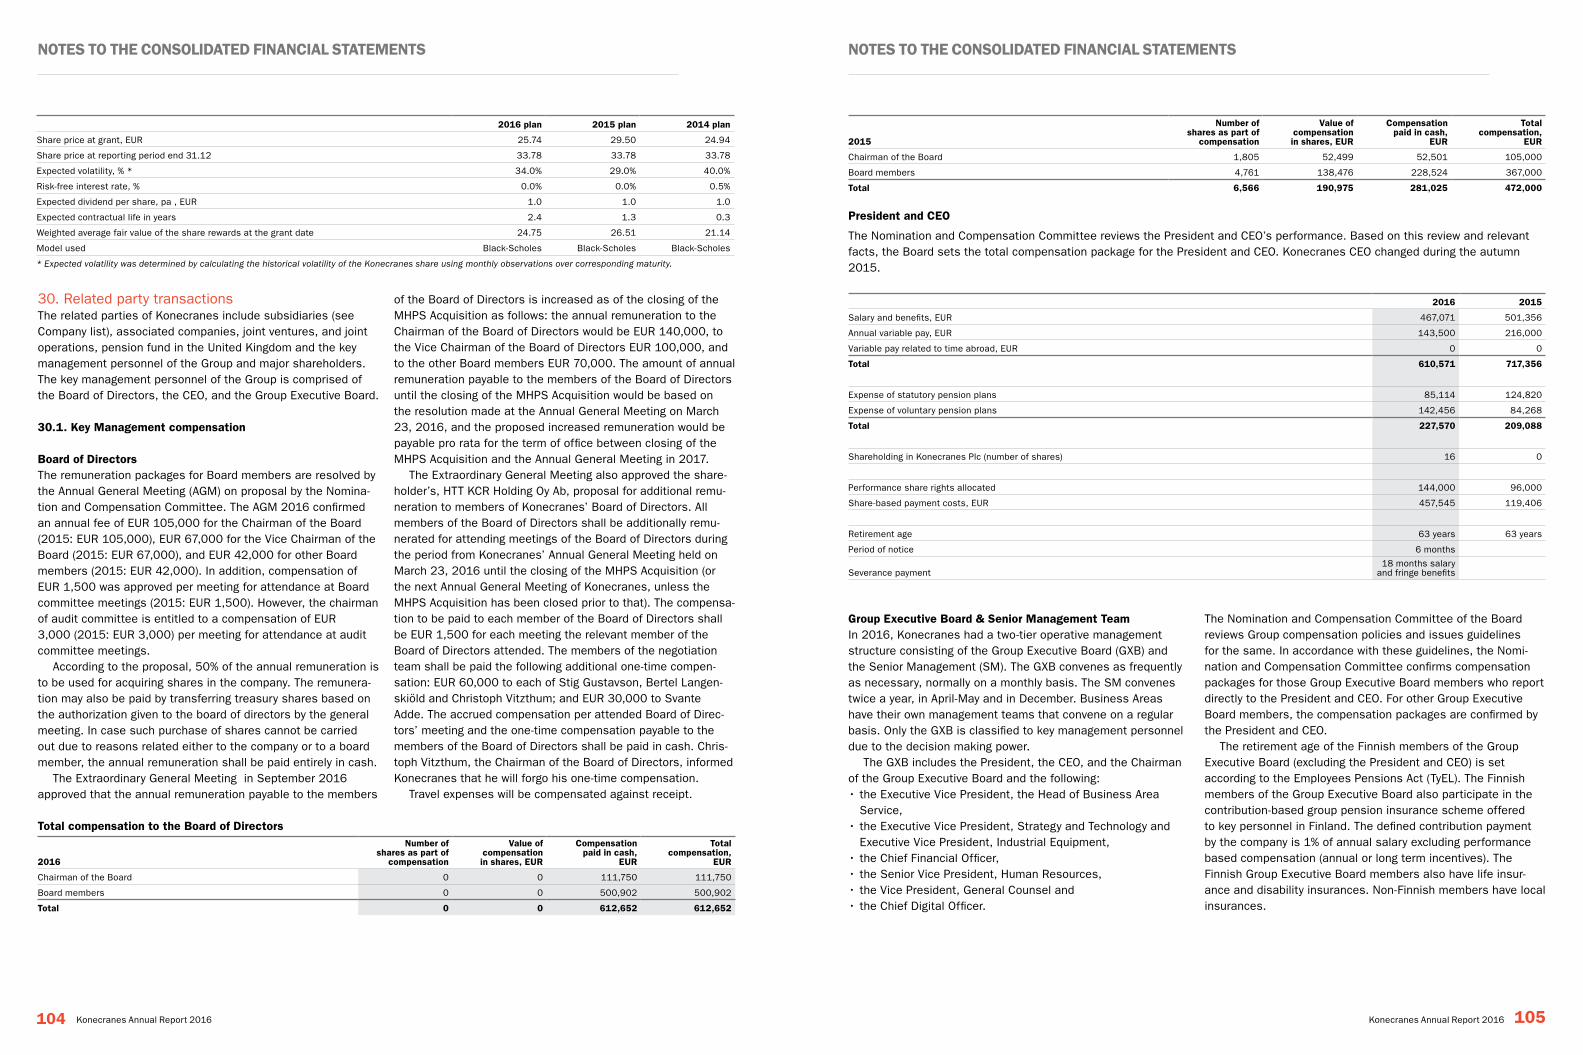
Notes to the coNsolidated fiNaNcial stateMeNts Notes to the coNsolidated fiNaNcial stateMeNts
104 105Konecranes Annual Report 2016 Konecranes Annual Report 2016
2016 plan 2015 plan 2014 plan
Share price at grant, EUR 25.74 29.50 24.94
Share price at reporting period end 31.12 33.78 33.78 33.78
Expected volatility, % * 34.0% 29.0% 40.0%
Risk-free interest rate, % 0.0% 0.0% 0.5%
Expected dividend per share, pa , EUR 1.0 1.0 1.0
Expected contractual life in years 2.4 1.3 0.3
Weighted average fair value of the share rewards at the grant date 24.75 26.51 21.14
Model used Black-Scholes Black-Scholes Black-Scholes
* Expected volatility was determined by calculating the historical volatility of the Konecranes share using monthly observations over corresponding maturity.
30. Related party transactionsThe related parties of Konecranes include subsidiaries (see Company list), associated companies, joint ventures, and joint operations, pension fund in the United Kingdom and the key management personnel of the Group and major shareholders. The key management personnel of the Group is comprised of the Board of Directors, the CEO, and the Group Executive Board.
30.1. Key Management compensation
Board of directorsThe remuneration packages for Board members are resolved by the Annual General Meeting (AGM) on proposal by the Nomina-tion and Compensation Committee. The AGM 2016 confirmed an annual fee of EUR 105,000 for the Chairman of the Board (2015: EUR 105,000), EUR 67,000 for the Vice Chairman of the Board (2015: EUR 67,000), and EUR 42,000 for other Board members (2015: EUR 42,000). In addition, compensation of EUR 1,500 was approved per meeting for attendance at Board committee meetings (2015: EUR 1,500). However, the chairman of audit committee is entitled to a compensation of EUR 3,000 (2015: EUR 3,000) per meeting for attendance at audit committee meetings.
According to the proposal, 50% of the annual remuneration is to be used for acquiring shares in the company. The remunera-tion may also be paid by transferring treasury shares based on the authorization given to the board of directors by the general meeting. In case such purchase of shares cannot be carried out due to reasons related either to the company or to a board member, the annual remuneration shall be paid entirely in cash.
The Extraordinary General Meeting in September 2016 approved that the annual remuneration payable to the members
of the Board of Directors is increased as of the closing of the MHPS Acquisition as follows: the annual remuneration to the Chairman of the Board of Directors would be EUR 140,000, to the Vice Chairman of the Board of Directors EUR 100,000, and to the other Board members EUR 70,000. The amount of annual remuneration payable to the members of the Board of Directors until the closing of the MHPS Acquisition would be based on the resolution made at the Annual General Meeting on March 23, 2016, and the proposed increased remuneration would be payable pro rata for the term of office between closing of the MHPS Acquisition and the Annual General Meeting in 2017.
The Extraordinary General Meeting also approved the share-holder’s, HTT KCR Holding Oy Ab, proposal for additional remu-neration to members of Konecranes’ Board of Directors. All members of the Board of Directors shall be additionally remu-nerated for attending meetings of the Board of Directors during the period from Konecranes’ Annual General Meeting held on March 23, 2016 until the closing of the MHPS Acquisition (or the next Annual General Meeting of Konecranes, unless the MHPS Acquisition has been closed prior to that). The compensa-tion to be paid to each member of the Board of Directors shall be EUR 1,500 for each meeting the relevant member of the Board of Directors attended. The members of the negotiation team shall be paid the following additional one-time compen-sation: EUR 60,000 to each of Stig Gustavson, Bertel Langen-skiöld and Christoph Vitzthum; and EUR 30,000 to Svante Adde. The accrued compensation per attended Board of Direc-tors’ meeting and the one-time compensation payable to the members of the Board of Directors shall be paid in cash. Chris-toph Vitzthum, the Chairman of the Board of Directors, informed Konecranes that he will forgo his one-time compensation.
Travel expenses will be compensated against receipt.
total compensation to the Board of directors
2016
Number of shares as part of
compensation
Value of compensation in shares, eUR
compensation paid in cash,
eUR
total compensation,
eUR
Chairman of the Board 0 0 111,750 111,750
Board members 0 0 500,902 500,902
total 0 0 612,652 612,652
2015
Number of shares as part of
compensation
Value of compensation in shares, eUR
compensation paid in cash,
eUR
total compensation,
eUR
Chairman of the Board 1,805 52,499 52,501 105,000
Board members 4,761 138,476 228,524 367,000
total 6,566 190,975 281,025 472,000
president and ceo
The Nomination and Compensation Committee reviews the President and CEO’s performance. Based on this review and relevant facts, the Board sets the total compensation package for the President and CEO. Konecranes CEO changed during the autumn 2015.
2016 2015
Salary and benefits, EUR 467,071 501,356
Annual variable pay, EUR 143,500 216,000
Variable pay related to time abroad, EUR 0 0
total 610,571 717,356
Expense of statutory pension plans 85,114 124,820
Expense of voluntary pension plans 142,456 84,268
total 227,570 209,088
Shareholding in Konecranes Plc (number of shares) 16 0
Performance share rights allocated 144,000 96,000
Share-based payment costs, EUR 457,545 119,406
Retirement age 63 years 63 years
Period of notice 6 months
Severance payment 18 months salary and fringe benefits
Group executive Board & senior Management teamIn 2016, Konecranes had a two-tier operative management structure consisting of the Group Executive Board (GXB) and the Senior Management (SM). The GXB convenes as frequently as necessary, normally on a monthly basis. The SM convenes twice a year, in April-May and in December. Business Areas have their own management teams that convene on a regular basis. Only the GXB is classified to key management personnel due to the decision making power.
The GXB includes the President, the CEO, and the Chairman of the Group Executive Board and the following: • the Executive Vice President, the Head of Business Area
Service,• the Executive Vice President, Strategy and Technology and
Executive Vice President, Industrial Equipment,• the Chief Financial Officer,• the Senior Vice President, Human Resources,• the Vice President, General Counsel and • the Chief Digital Officer.
The Nomination and Compensation Committee of the Board reviews Group compensation policies and issues guidelines for the same. In accordance with these guidelines, the Nomi-nation and Compensation Committee confirms compensation packages for those Group Executive Board members who report directly to the President and CEO. For other Group Executive Board members, the compensation packages are confirmed by the President and CEO.
The retirement age of the Finnish members of the Group Executive Board (excluding the President and CEO) is set according to the Employees Pensions Act (TyEL). The Finnish members of the Group Executive Board also participate in the contribution-based group pension insurance scheme offered to key personnel in Finland. The defined contribution payment by the company is 1% of annual salary excluding performance based compensation (annual or long term incentives). The Finnish Group Executive Board members also have life insur-ance and disability insurances. Non-Finnish members have local insurances.
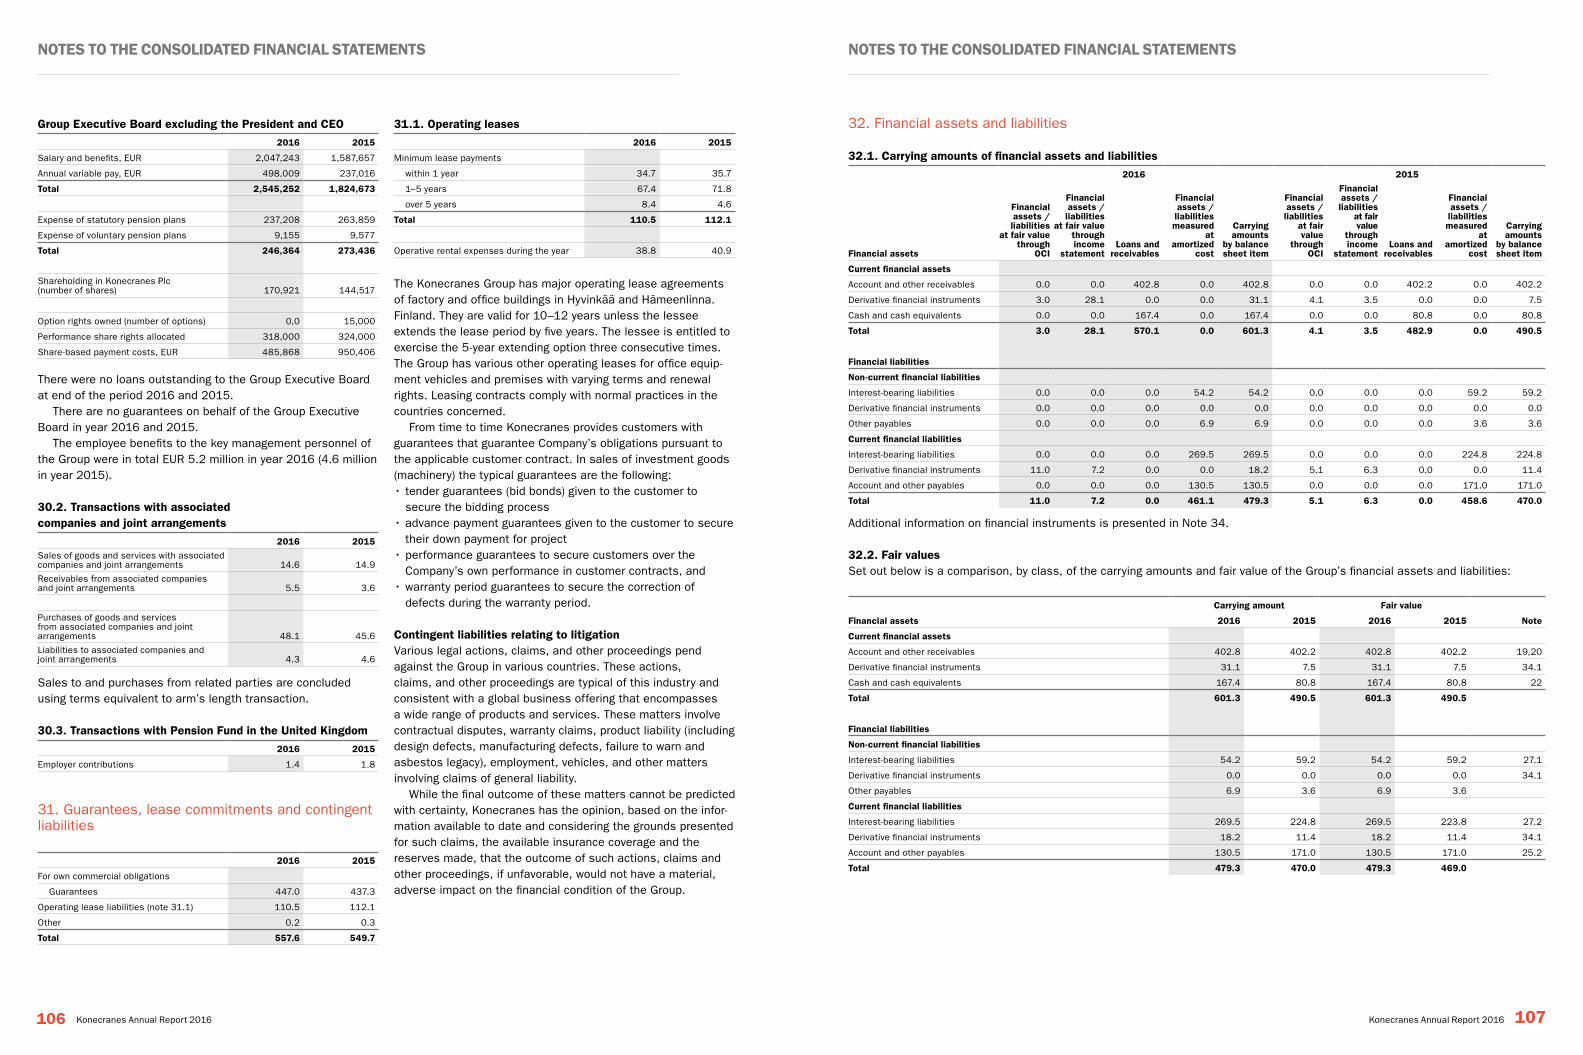
Notes to the coNsolidated fiNaNcial stateMeNts Notes to the coNsolidated fiNaNcial stateMeNts
106 107Konecranes Annual Report 2016 Konecranes Annual Report 2016
Group executive Board excluding the president and ceo2016 2015
Salary and benefits, EUR 2,047,243 1,587,657
Annual variable pay, EUR 498,009 237,016
total 2,545,252 1,824,673
Expense of statutory pension plans 237,208 263,859
Expense of voluntary pension plans 9,155 9,577
total 246,364 273,436
Shareholding in Konecranes Plc (number of shares) 170,921 144,517
Option rights owned (number of options) 0,0 15,000
Performance share rights allocated 318,000 324,000
Share-based payment costs, EUR 485,868 950,406
There were no loans outstanding to the Group Executive Board at end of the period 2016 and 2015.
There are no guarantees on behalf of the Group Executive Board in year 2016 and 2015.
The employee benefits to the key management personnel of the Group were in total EUR 5.2 million in year 2016 (4.6 million in year 2015).
30.2. transactions with associated companies and joint arrangements
2016 2015
Sales of goods and services with associated companies and joint arrangements 14.6 14.9
Receivables from associated companies and joint arrangements 5.5 3.6
Purchases of goods and services from associated companies and joint arrangements 48.1 45.6
Liabilities to associated companies and joint arrangements 4.3 4.6
Sales to and purchases from related parties are concluded using terms equivalent to arm’s length transaction.
30.3. transactions with pension fund in the United Kingdom2016 2015
Employer contributions 1.4 1.8
31. Guarantees, lease commitments and contingent liabilities
2016 2015
For own commercial obligations
Guarantees 447.0 437.3
Operating lease liabilities (note 31.1) 110.5 112.1
Other 0.2 0.3
total 557.6 549.7
31.1. operating leases2016 2015
Minimum lease payments
within 1 year 34.7 35.7
1–5 years 67.4 71.8
over 5 years 8.4 4.6
total 110.5 112.1
Operative rental expenses during the year 38.8 40.9
The Konecranes Group has major operating lease agreements of factory and office buildings in Hyvinkää and Hämeenlinna. Finland. They are valid for 10–12 years unless the lessee extends the lease period by five years. The lessee is entitled to exercise the 5-year extending option three consecutive times. The Group has various other operating leases for office equip-ment vehicles and premises with varying terms and renewal rights. Leasing contracts comply with normal practices in the countries concerned.
From time to time Konecranes provides customers with guarantees that guarantee Company’s obligations pursuant to the applicable customer contract. In sales of investment goods (machinery) the typical guarantees are the following:• tender guarantees (bid bonds) given to the customer to
secure the bidding process• advance payment guarantees given to the customer to secure
their down payment for project • performance guarantees to secure customers over the
Company’s own performance in customer contracts, and • warranty period guarantees to secure the correction of
defects during the warranty period.
contingent liabilities relating to litigationVarious legal actions, claims, and other proceedings pend against the Group in various countries. These actions, claims, and other proceedings are typical of this industry and consistent with a global business offering that encompasses a wide range of products and services. These matters involve contractual disputes, warranty claims, product liability (including design defects, manufacturing defects, failure to warn and asbestos legacy), employment, vehicles, and other matters involving claims of general liability.
While the final outcome of these matters cannot be predicted with certainty, Konecranes has the opinion, based on the infor-mation available to date and considering the grounds presented for such claims, the available insurance coverage and the reserves made, that the outcome of such actions, claims and other proceedings, if unfavorable, would not have a material, adverse impact on the financial condition of the Group.
32. Financial assets and liabilities
32.1. carrying amounts of financial assets and liabilities2016 2015
financial assets
financial assets /liabilities
at fair value through
oci
financial assets /liabilities
at fair value through income
statementloans and
receivables
financial assets /liabilities measured
at amortized
cost
carrying amounts
by balance sheet item
financial assets /liabilities
at fair value
through oci
financial assets /liabilities
at fair value
through income
statementloans and
receivables
financial assets /liabilities measured
at amortized
cost
carrying amounts
by balance sheet item
current financial assets
Account and other receivables 0.0 0.0 402.8 0.0 402.8 0.0 0.0 402.2 0.0 402.2
Derivative financial instruments 3.0 28.1 0.0 0.0 31.1 4.1 3.5 0.0 0.0 7.5
Cash and cash equivalents 0.0 0.0 167.4 0.0 167.4 0.0 0.0 80.8 0.0 80.8
total 3.0 28.1 570.1 0.0 601.3 4.1 3.5 482.9 0.0 490.5
financial liabilities
Non-current financial liabilities
Interest-bearing liabilities 0.0 0.0 0.0 54.2 54.2 0.0 0.0 0.0 59.2 59.2
Derivative financial instruments 0.0 0.0 0.0 0.0 0.0 0.0 0.0 0.0 0.0 0.0
Other payables 0.0 0.0 0.0 6.9 6.9 0.0 0.0 0.0 3.6 3.6
current financial liabilities
Interest-bearing liabilities 0.0 0.0 0.0 269.5 269.5 0.0 0.0 0.0 224.8 224.8
Derivative financial instruments 11.0 7.2 0.0 0.0 18.2 5.1 6.3 0.0 0.0 11.4
Account and other payables 0.0 0.0 0.0 130.5 130.5 0.0 0.0 0.0 171.0 171.0
total 11.0 7.2 0.0 461.1 479.3 5.1 6.3 0.0 458.6 470.0
Additional information on financial instruments is presented in Note 34.
32.2. fair valuesSet out below is a comparison, by class, of the carrying amounts and fair value of the Group’s financial assets and liabilities:
carrying amount fair value
financial assets 2016 2015 2016 2015 Note
current financial assets
Account and other receivables 402.8 402.2 402.8 402.2 19,20
Derivative financial instruments 31.1 7.5 31.1 7.5 34.1
Cash and cash equivalents 167.4 80.8 167.4 80.8 22
total 601.3 490.5 601.3 490.5
financial liabilities
Non-current financial liabilities
Interest-bearing liabilities 54.2 59.2 54.2 59.2 27.1
Derivative financial instruments 0.0 0.0 0.0 0.0 34.1
Other payables 6.9 3.6 6.9 3.6
current financial liabilities
Interest-bearing liabilities 269.5 224.8 269.5 223.8 27.2
Derivative financial instruments 18.2 11.4 18.2 11.4 34.1
Account and other payables 130.5 171.0 130.5 171.0 25.2
total 479.3 470.0 479.3 469.0
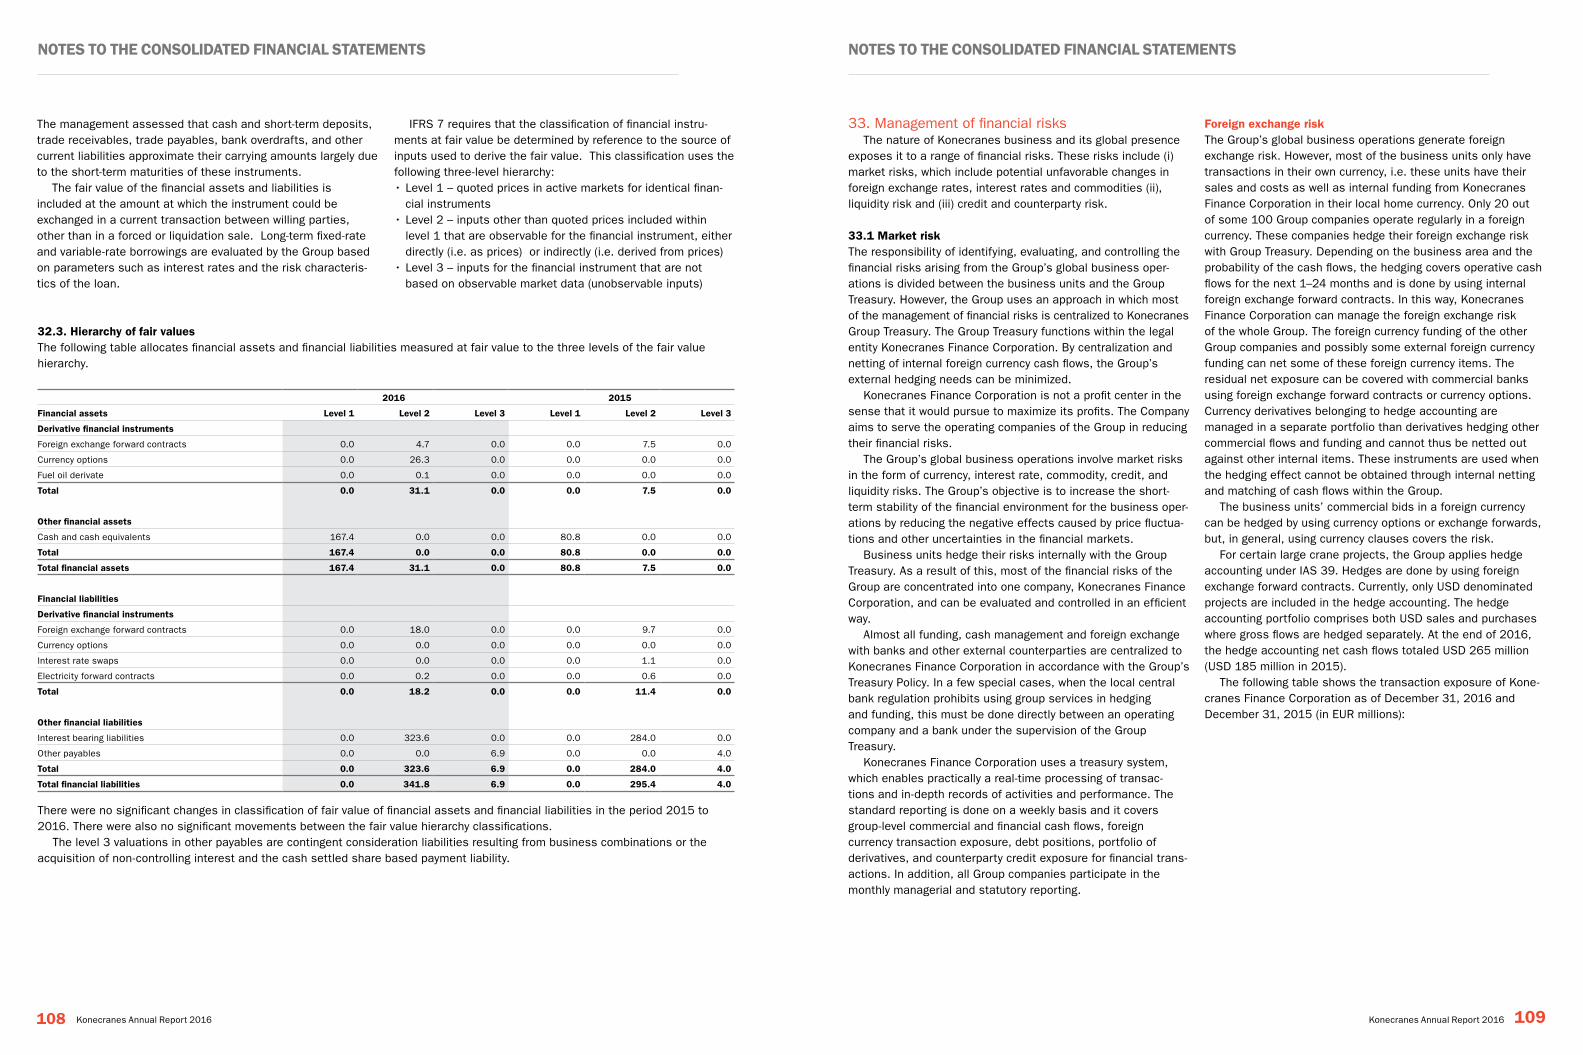
Notes to the coNsolidated fiNaNcial stateMeNts Notes to the coNsolidated fiNaNcial stateMeNts
108 109Konecranes Annual Report 2016 Konecranes Annual Report 2016
The management assessed that cash and short-term deposits, trade receivables, trade payables, bank overdrafts, and other current liabilities approximate their carrying amounts largely due to the short-term maturities of these instruments.
The fair value of the financial assets and liabilities is included at the amount at which the instrument could be exchanged in a current transaction between willing parties, other than in a forced or liquidation sale. Long-term fixed-rate and variable-rate borrowings are evaluated by the Group based on parameters such as interest rates and the risk characteris-tics of the loan.
32.3. hierarchy of fair valuesThe following table allocates financial assets and financial liabilities measured at fair value to the three levels of the fair value hierarchy.
2016 2015
financial assets level 1 level 2 level 3 level 1 level 2 level 3
derivative financial instruments
Foreign exchange forward contracts 0.0 4.7 0.0 0.0 7.5 0.0
Currency options 0.0 26.3 0.0 0.0 0.0 0.0
Fuel oil derivate 0.0 0.1 0.0 0.0 0.0 0.0
total 0.0 31.1 0.0 0.0 7.5 0.0
other financial assets
Cash and cash equivalents 167.4 0.0 0.0 80.8 0.0 0.0
total 167.4 0.0 0.0 80.8 0.0 0.0
total financial assets 167.4 31.1 0.0 80.8 7.5 0.0
financial liabilities
derivative financial instruments
Foreign exchange forward contracts 0.0 18.0 0.0 0.0 9.7 0.0
Currency options 0.0 0.0 0.0 0.0 0.0 0.0
Interest rate swaps 0.0 0.0 0.0 0.0 1.1 0.0
Electricity forward contracts 0.0 0.2 0.0 0.0 0.6 0.0
total 0.0 18.2 0.0 0.0 11.4 0.0
other financial liabilities
Interest bearing liabilities 0.0 323.6 0.0 0.0 284.0 0.0
Other payables 0.0 0.0 6.9 0.0 0.0 4.0
total 0.0 323.6 6.9 0.0 284.0 4.0
total financial liabilities 0.0 341.8 6.9 0.0 295.4 4.0
There were no significant changes in classification of fair value of financial assets and financial liabilities in the period 2015 to 2016. There were also no significant movements between the fair value hierarchy classifications.
The level 3 valuations in other payables are contingent consideration liabilities resulting from business combinations or the acquisition of non-controlling interest and the cash settled share based payment liability.
IFRS 7 requires that the classification of financial instru-ments at fair value be determined by reference to the source of inputs used to derive the fair value. This classification uses the following three-level hierarchy:• Level 1 – quoted prices in active markets for identical finan-
cial instruments• Level 2 – inputs other than quoted prices included within
level 1 that are observable for the financial instrument, either directly (i.e. as prices) or indirectly (i.e. derived from prices)
• Level 3 – inputs for the financial instrument that are not based on observable market data (unobservable inputs)
33. Management of financial risks The nature of Konecranes business and its global presence
exposes it to a range of financial risks. These risks include (i) market risks, which include potential unfavorable changes in foreign exchange rates, interest rates and commodities (ii), liquidity risk and (iii) credit and counterparty risk.
33.1 Market riskThe responsibility of identifying, evaluating, and controlling the financial risks arising from the Group’s global business oper-ations is divided between the business units and the Group Treasury. However, the Group uses an approach in which most of the management of financial risks is centralized to Konecranes Group Treasury. The Group Treasury functions within the legal entity Konecranes Finance Corporation. By centralization and netting of internal foreign currency cash flows, the Group’s external hedging needs can be minimized.
Konecranes Finance Corporation is not a profit center in the sense that it would pursue to maximize its profits. The Company aims to serve the operating companies of the Group in reducing their financial risks.
The Group’s global business operations involve market risks in the form of currency, interest rate, commodity, credit, and liquidity risks. The Group’s objective is to increase the short-term stability of the financial environment for the business oper-ations by reducing the negative effects caused by price fluctua-tions and other uncertainties in the financial markets.
Business units hedge their risks internally with the Group Treasury. As a result of this, most of the financial risks of the Group are concentrated into one company, Konecranes Finance Corporation, and can be evaluated and controlled in an efficient way.
Almost all funding, cash management and foreign exchange with banks and other external counterparties are centralized to Konecranes Finance Corporation in accordance with the Group’s Treasury Policy. In a few special cases, when the local central bank regulation prohibits using group services in hedging and funding, this must be done directly between an operating company and a bank under the supervision of the Group Treasury.
Konecranes Finance Corporation uses a treasury system, which enables practically a real-time processing of transac-tions and in-depth records of activities and performance. The standard reporting is done on a weekly basis and it covers group-level commercial and financial cash flows, foreign currency transaction exposure, debt positions, portfolio of derivatives, and counterparty credit exposure for financial trans-actions. In addition, all Group companies participate in the monthly managerial and statutory reporting.
foreign exchange riskThe Group’s global business operations generate foreign exchange risk. However, most of the business units only have transactions in their own currency, i.e. these units have their sales and costs as well as internal funding from Konecranes Finance Corporation in their local home currency. Only 20 out of some 100 Group companies operate regularly in a foreign currency. These companies hedge their foreign exchange risk with Group Treasury. Depending on the business area and the probability of the cash flows, the hedging covers operative cash flows for the next 1–24 months and is done by using internal foreign exchange forward contracts. In this way, Konecranes Finance Corporation can manage the foreign exchange risk of the whole Group. The foreign currency funding of the other Group companies and possibly some external foreign currency funding can net some of these foreign currency items. The residual net exposure can be covered with commercial banks using foreign exchange forward contracts or currency options. Currency derivatives belonging to hedge accounting are managed in a separate portfolio than derivatives hedging other commercial flows and funding and cannot thus be netted out against other internal items. These instruments are used when the hedging effect cannot be obtained through internal netting and matching of cash flows within the Group.
The business units’ commercial bids in a foreign currency can be hedged by using currency options or exchange forwards, but, in general, using currency clauses covers the risk.
For certain large crane projects, the Group applies hedge accounting under IAS 39. Hedges are done by using foreign exchange forward contracts. Currently, only USD denominated projects are included in the hedge accounting. The hedge accounting portfolio comprises both USD sales and purchases where gross flows are hedged separately. At the end of 2016, the hedge accounting net cash flows totaled USD 265 million (USD 185 million in 2015).
The following table shows the transaction exposure of Kone-cranes Finance Corporation as of December 31, 2016 and December 31, 2015 (in EUR millions):
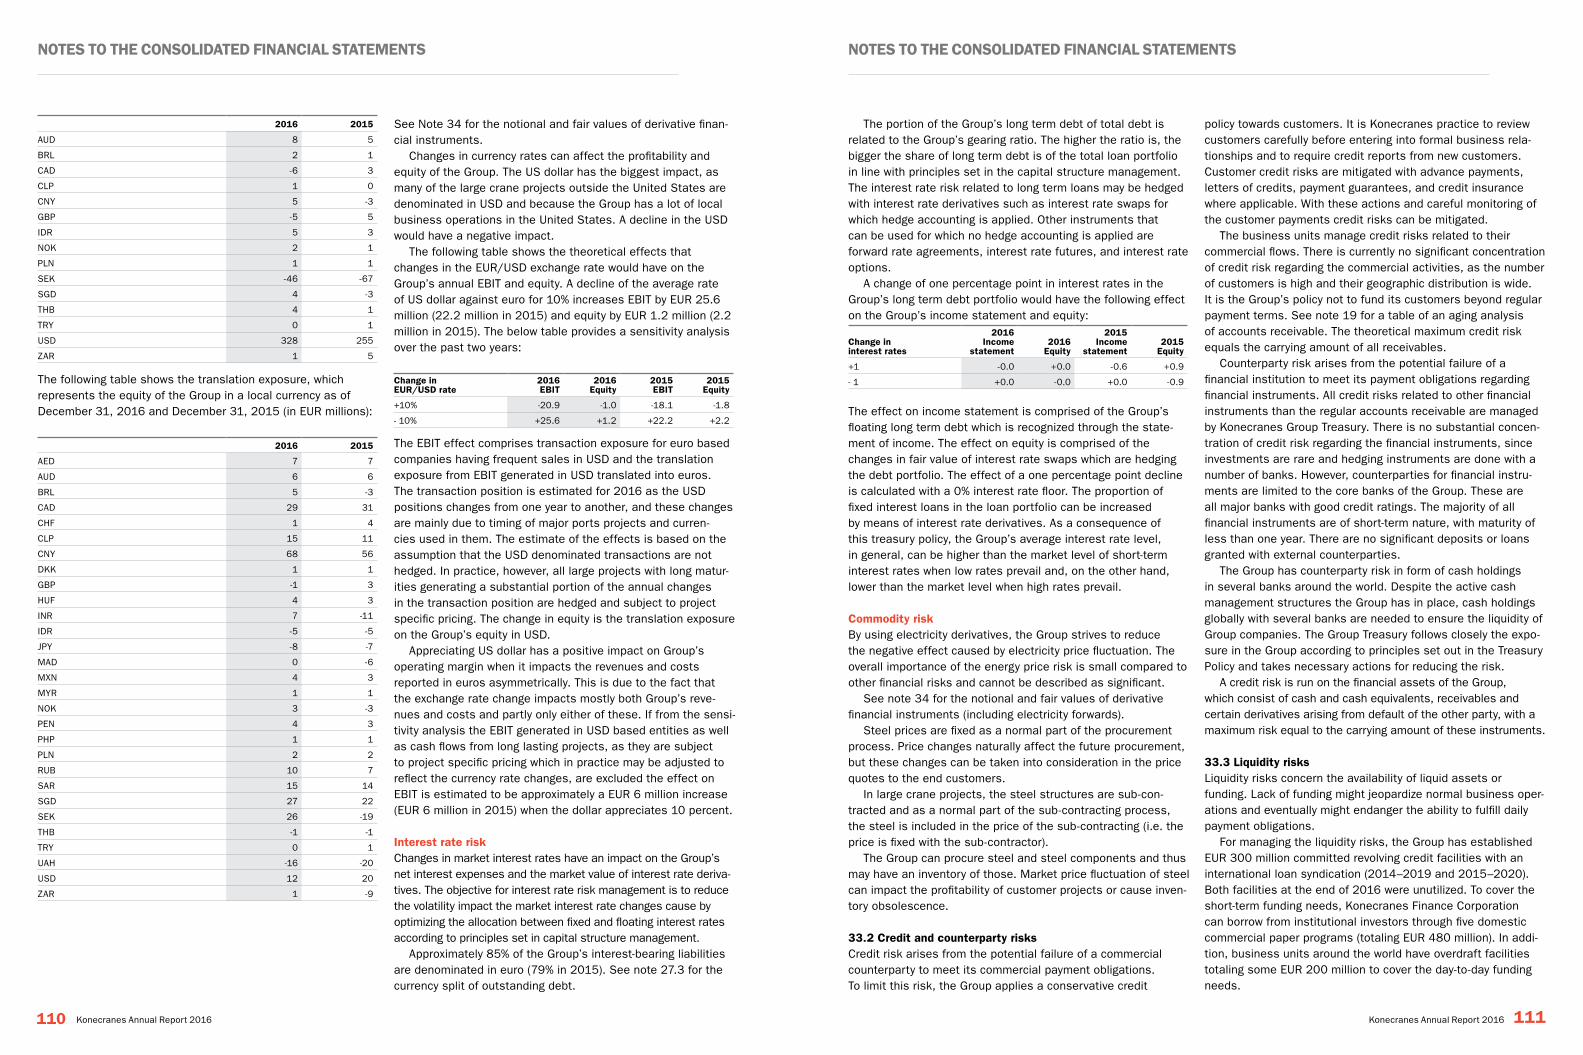
Notes to the coNsolidated fiNaNcial stateMeNts Notes to the coNsolidated fiNaNcial stateMeNts
110 111Konecranes Annual Report 2016 Konecranes Annual Report 2016
2016 2015
AUD 8 5
BRL 2 1
CAD -6 3
CLP 1 0
CNY 5 -3
GBP -5 5
IDR 5 3
NOK 2 1
PLN 1 1
SEK -46 -67
SGD 4 -3
THB 4 1
TRY 0 1
USD 328 255
ZAR 1 5
The following table shows the translation exposure, which represents the equity of the Group in a local currency as of December 31, 2016 and December 31, 2015 (in EUR millions):
2016 2015
AED 7 7
AUD 6 6
BRL 5 -3
CAD 29 31
CHF 1 4
CLP 15 11
CNY 68 56
DKK 1 1
GBP -1 3
HUF 4 3
INR 7 -11
IDR -5 -5
JPY -8 -7
MAD 0 -6
MXN 4 3
MYR 1 1
NOK 3 -3
PEN 4 3
PHP 1 1
PLN 2 2
RUB 10 7
SAR 15 14
SGD 27 22
SEK 26 -19
THB -1 -1
TRY 0 1
UAH -16 -20
USD 12 20
ZAR 1 -9
See Note 34 for the notional and fair values of derivative finan-cial instruments.
Changes in currency rates can affect the profitability and equity of the Group. The US dollar has the biggest impact, as many of the large crane projects outside the United States are denominated in USD and because the Group has a lot of local business operations in the United States. A decline in the USD would have a negative impact.
The following table shows the theoretical effects that changes in the EUR/USD exchange rate would have on the Group’s annual EBIT and equity. A decline of the average rate of US dollar against euro for 10% increases EBIT by EUR 25.6 million (22.2 million in 2015) and equity by EUR 1.2 million (2.2 million in 2015). The below table provides a sensitivity analysis over the past two years:
change ineUR/Usd rate
2016eBit
2016equity
2015eBit
2015equity
+10% -20.9 -1.0 -18.1 -1.8
- 10% +25.6 +1.2 +22.2 +2.2
The EBIT effect comprises transaction exposure for euro based companies having frequent sales in USD and the translation exposure from EBIT generated in USD translated into euros. The transaction position is estimated for 2016 as the USD positions changes from one year to another, and these changes are mainly due to timing of major ports projects and curren-cies used in them. The estimate of the effects is based on the assumption that the USD denominated transactions are not hedged. In practice, however, all large projects with long matur-ities generating a substantial portion of the annual changes in the transaction position are hedged and subject to project specific pricing. The change in equity is the translation exposure on the Group’s equity in USD.
Appreciating US dollar has a positive impact on Group’s operating margin when it impacts the revenues and costs reported in euros asymmetrically. This is due to the fact that the exchange rate change impacts mostly both Group’s reve-nues and costs and partly only either of these. If from the sensi-tivity analysis the EBIT generated in USD based entities as well as cash flows from long lasting projects, as they are subject to project specific pricing which in practice may be adjusted to reflect the currency rate changes, are excluded the effect on EBIT is estimated to be approximately a EUR 6 million increase (EUR 6 million in 2015) when the dollar appreciates 10 percent.
interest rate riskChanges in market interest rates have an impact on the Group’s net interest expenses and the market value of interest rate deriva-tives. The objective for interest rate risk management is to reduce the volatility impact the market interest rate changes cause by optimizing the allocation between fixed and floating interest rates according to principles set in capital structure management.
Approximately 85% of the Group’s interest-bearing liabilities are denominated in euro (79% in 2015). See note 27.3 for the currency split of outstanding debt.
The portion of the Group’s long term debt of total debt is related to the Group’s gearing ratio. The higher the ratio is, the bigger the share of long term debt is of the total loan portfolio in line with principles set in the capital structure management. The interest rate risk related to long term loans may be hedged with interest rate derivatives such as interest rate swaps for which hedge accounting is applied. Other instruments that can be used for which no hedge accounting is applied are forward rate agreements, interest rate futures, and interest rate options.
A change of one percentage point in interest rates in the Group’s long term debt portfolio would have the following effect on the Group’s income statement and equity:
change in interest rates
2016income
statement2016
equity
2015income
statement2015
equity
+1 -0.0 +0.0 -0.6 +0.9
- 1 +0.0 -0.0 +0.0 -0.9
The effect on income statement is comprised of the Group’s floating long term debt which is recognized through the state-ment of income. The effect on equity is comprised of the changes in fair value of interest rate swaps which are hedging the debt portfolio. The effect of a one percentage point decline is calculated with a 0% interest rate floor. The proportion of fixed interest loans in the loan portfolio can be increased by means of interest rate derivatives. As a consequence of this treasury policy, the Group’s average interest rate level, in general, can be higher than the market level of short-term interest rates when low rates prevail and, on the other hand, lower than the market level when high rates prevail.
commodity riskBy using electricity derivatives, the Group strives to reduce the negative effect caused by electricity price fluctuation. The overall importance of the energy price risk is small compared to other financial risks and cannot be described as significant.
See note 34 for the notional and fair values of derivative financial instruments (including electricity forwards).
Steel prices are fixed as a normal part of the procurement process. Price changes naturally affect the future procurement, but these changes can be taken into consideration in the price quotes to the end customers.
In large crane projects, the steel structures are sub-con-tracted and as a normal part of the sub-contracting process, the steel is included in the price of the sub-contracting (i.e. the price is fixed with the sub-contractor).
The Group can procure steel and steel components and thus may have an inventory of those. Market price fluctuation of steel can impact the profitability of customer projects or cause inven-tory obsolescence.
33.2 credit and counterparty risksCredit risk arises from the potential failure of a commercial counterparty to meet its commercial payment obligations. To limit this risk, the Group applies a conservative credit
policy towards customers. It is Konecranes practice to review customers carefully before entering into formal business rela-tionships and to require credit reports from new customers. Customer credit risks are mitigated with advance payments, letters of credits, payment guarantees, and credit insurance where applicable. With these actions and careful monitoring of the customer payments credit risks can be mitigated.
The business units manage credit risks related to their commercial flows. There is currently no significant concentration of credit risk regarding the commercial activities, as the number of customers is high and their geographic distribution is wide. It is the Group’s policy not to fund its customers beyond regular payment terms. See note 19 for a table of an aging analysis of accounts receivable. The theoretical maximum credit risk equals the carrying amount of all receivables.
Counterparty risk arises from the potential failure of a financial institution to meet its payment obligations regarding financial instruments. All credit risks related to other financial instruments than the regular accounts receivable are managed by Konecranes Group Treasury. There is no substantial concen-tration of credit risk regarding the financial instruments, since investments are rare and hedging instruments are done with a number of banks. However, counterparties for financial instru-ments are limited to the core banks of the Group. These are all major banks with good credit ratings. The majority of all financial instruments are of short-term nature, with maturity of less than one year. There are no significant deposits or loans granted with external counterparties.
The Group has counterparty risk in form of cash holdings in several banks around the world. Despite the active cash management structures the Group has in place, cash holdings globally with several banks are needed to ensure the liquidity of Group companies. The Group Treasury follows closely the expo-sure in the Group according to principles set out in the Treasury Policy and takes necessary actions for reducing the risk.
A credit risk is run on the financial assets of the Group, which consist of cash and cash equivalents, receivables and certain derivatives arising from default of the other party, with a maximum risk equal to the carrying amount of these instruments.
33.3 liquidity risksLiquidity risks concern the availability of liquid assets or funding. Lack of funding might jeopardize normal business oper-ations and eventually might endanger the ability to fulfill daily payment obligations.
For managing the liquidity risks, the Group has established EUR 300 million committed revolving credit facilities with an international loan syndication (2014–2019 and 2015–2020). Both facilities at the end of 2016 were unutilized. To cover the short-term funding needs, Konecranes Finance Corporation can borrow from institutional investors through five domestic commercial paper programs (totaling EUR 480 million). In addi-tion, business units around the world have overdraft facilities totaling some EUR 200 million to cover the day-to-day funding needs.
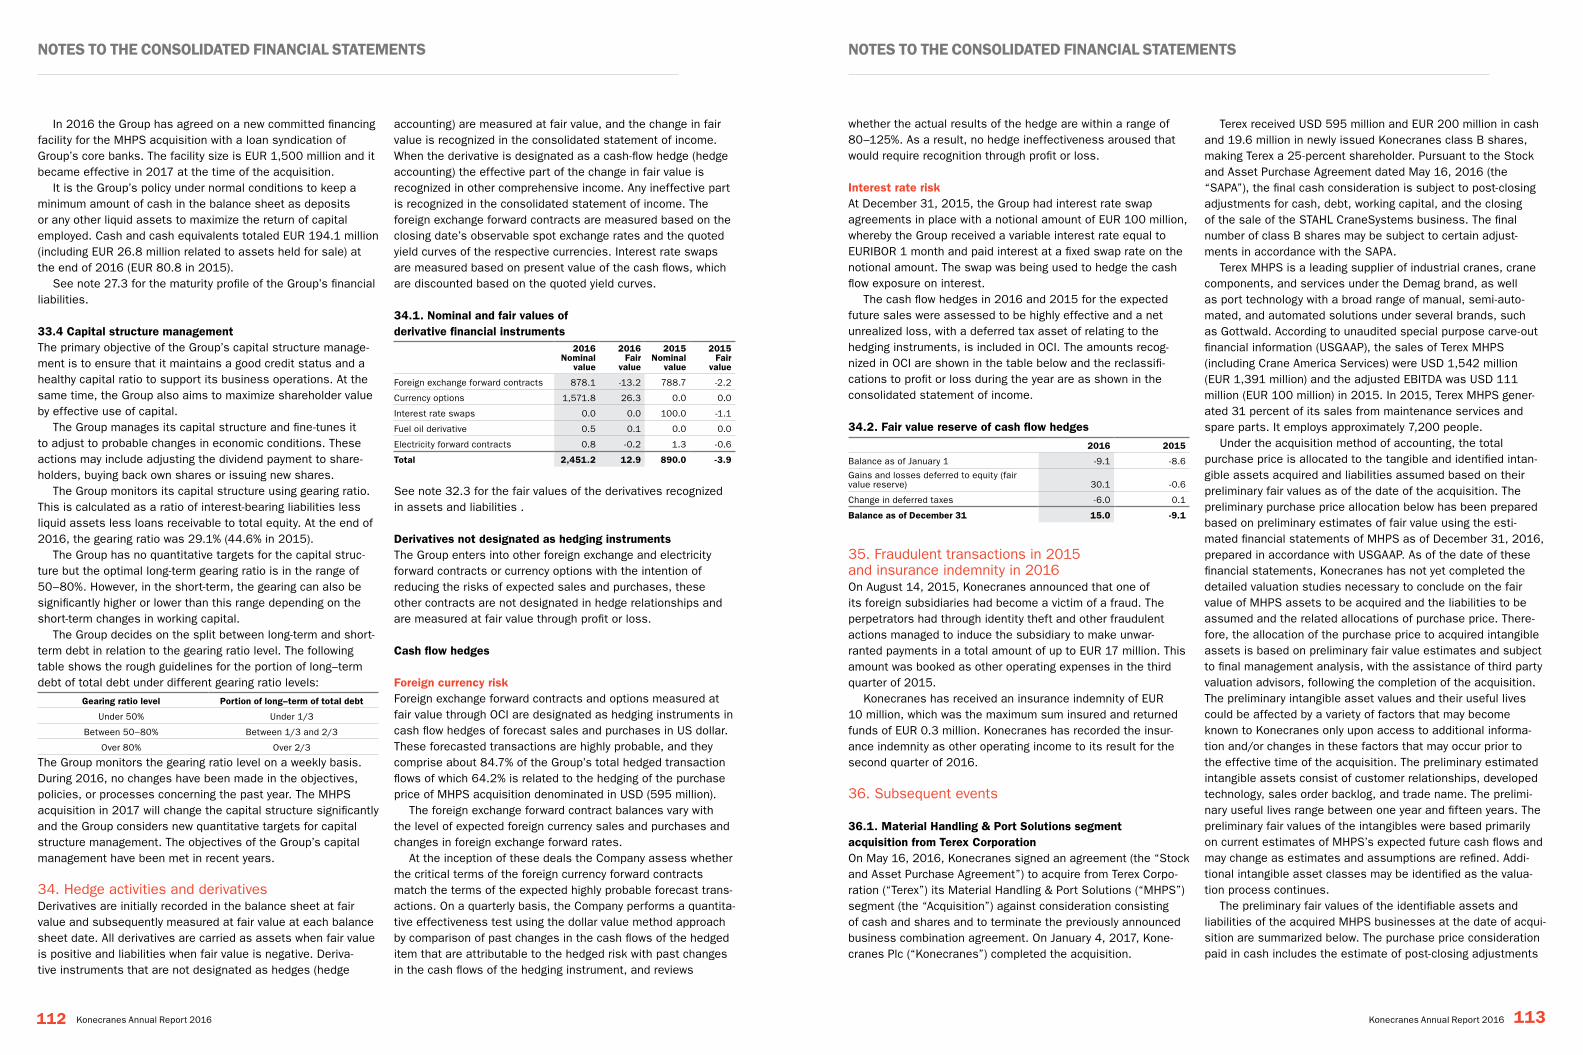
Notes to the coNsolidated fiNaNcial stateMeNts Notes to the coNsolidated fiNaNcial stateMeNts
112 113Konecranes Annual Report 2016 Konecranes Annual Report 2016
In 2016 the Group has agreed on a new committed financing facility for the MHPS acquisition with a loan syndication of Group’s core banks. The facility size is EUR 1,500 million and it became effective in 2017 at the time of the acquisition.
It is the Group’s policy under normal conditions to keep a minimum amount of cash in the balance sheet as deposits or any other liquid assets to maximize the return of capital employed. Cash and cash equivalents totaled EUR 194.1 million (including EUR 26.8 million related to assets held for sale) at the end of 2016 (EUR 80.8 in 2015).
See note 27.3 for the maturity profile of the Group’s financial liabilities.
33.4 capital structure managementThe primary objective of the Group’s capital structure manage-ment is to ensure that it maintains a good credit status and a healthy capital ratio to support its business operations. At the same time, the Group also aims to maximize shareholder value by effective use of capital.
The Group manages its capital structure and fine-tunes it to adjust to probable changes in economic conditions. These actions may include adjusting the dividend payment to share-holders, buying back own shares or issuing new shares.
The Group monitors its capital structure using gearing ratio. This is calculated as a ratio of interest-bearing liabilities less liquid assets less loans receivable to total equity. At the end of 2016, the gearing ratio was 29.1% (44.6% in 2015).
The Group has no quantitative targets for the capital struc-ture but the optimal long-term gearing ratio is in the range of 50–80%. However, in the short-term, the gearing can also be significantly higher or lower than this range depending on the short-term changes in working capital.
The Group decides on the split between long-term and short-term debt in relation to the gearing ratio level. The following table shows the rough guidelines for the portion of long–term debt of total debt under different gearing ratio levels:
Gearing ratio level portion of long–term of total debt
Under 50% Under 1/3
Between 50–80% Between 1/3 and 2/3
Over 80% Over 2/3
The Group monitors the gearing ratio level on a weekly basis. During 2016, no changes have been made in the objectives, policies, or processes concerning the past year. The MHPS acquisition in 2017 will change the capital structure significantly and the Group considers new quantitative targets for capital structure management. The objectives of the Group’s capital management have been met in recent years.
34. Hedge activities and derivativesDerivatives are initially recorded in the balance sheet at fair value and subsequently measured at fair value at each balance sheet date. All derivatives are carried as assets when fair value is positive and liabilities when fair value is negative. Deriva-tive instruments that are not designated as hedges (hedge
accounting) are measured at fair value, and the change in fair value is recognized in the consolidated statement of income. When the derivative is designated as a cash-flow hedge (hedge accounting) the effective part of the change in fair value is recognized in other comprehensive income. Any ineffective part is recognized in the consolidated statement of income. The foreign exchange forward contracts are measured based on the closing date’s observable spot exchange rates and the quoted yield curves of the respective currencies. Interest rate swaps are measured based on present value of the cash flows, which are discounted based on the quoted yield curves.
34.1. Nominal and fair values of derivative financial instruments
2016 Nominal
value
2016 fair
value
2015 Nominal
value
2015 fair
value
Foreign exchange forward contracts 878.1 -13.2 788.7 -2.2
Currency options 1,571.8 26.3 0.0 0.0
Interest rate swaps 0.0 0.0 100.0 -1.1
Fuel oil derivative 0.5 0.1 0.0 0.0
Electricity forward contracts 0.8 -0.2 1.3 -0.6
total 2,451.2 12.9 890.0 -3.9
See note 32.3 for the fair values of the derivatives recognized in assets and liabilities .
derivatives not designated as hedging instrumentsThe Group enters into other foreign exchange and electricity forward contracts or currency options with the intention of reducing the risks of expected sales and purchases, these other contracts are not designated in hedge relationships and are measured at fair value through profit or loss.
cash flow hedges
foreign currency riskForeign exchange forward contracts and options measured at fair value through OCI are designated as hedging instruments in cash flow hedges of forecast sales and purchases in US dollar. These forecasted transactions are highly probable, and they comprise about 84.7% of the Group’s total hedged transaction flows of which 64.2% is related to the hedging of the purchase price of MHPS acquisition denominated in USD (595 million).
The foreign exchange forward contract balances vary with the level of expected foreign currency sales and purchases and changes in foreign exchange forward rates.
At the inception of these deals the Company assess whether the critical terms of the foreign currency forward contracts match the terms of the expected highly probable forecast trans-actions. On a quarterly basis, the Company performs a quantita-tive effectiveness test using the dollar value method approach by comparison of past changes in the cash flows of the hedged item that are attributable to the hedged risk with past changes in the cash flows of the hedging instrument, and reviews
Terex received USD 595 million and EUR 200 million in cash and 19.6 million in newly issued Konecranes class B shares, making Terex a 25-percent shareholder. Pursuant to the Stock and Asset Purchase Agreement dated May 16, 2016 (the “SAPA”), the final cash consideration is subject to post-closing adjustments for cash, debt, working capital, and the closing of the sale of the STAHL CraneSystems business. The final number of class B shares may be subject to certain adjust-ments in accordance with the SAPA.
Terex MHPS is a leading supplier of industrial cranes, crane components, and services under the Demag brand, as well as port technology with a broad range of manual, semi-auto-mated, and automated solutions under several brands, such as Gottwald. According to unaudited special purpose carve-out financial information (USGAAP), the sales of Terex MHPS (including Crane America Services) were USD 1,542 million (EUR 1,391 million) and the adjusted EBITDA was USD 111 million (EUR 100 million) in 2015. In 2015, Terex MHPS gener-ated 31 percent of its sales from maintenance services and spare parts. It employs approximately 7,200 people.
Under the acquisition method of accounting, the total purchase price is allocated to the tangible and identified intan-gible assets acquired and liabilities assumed based on their preliminary fair values as of the date of the acquisition. The preliminary purchase price allocation below has been prepared based on preliminary estimates of fair value using the esti-mated financial statements of MHPS as of December 31, 2016, prepared in accordance with USGAAP. As of the date of these financial statements, Konecranes has not yet completed the detailed valuation studies necessary to conclude on the fair value of MHPS assets to be acquired and the liabilities to be assumed and the related allocations of purchase price. There-fore, the allocation of the purchase price to acquired intangible assets is based on preliminary fair value estimates and subject to final management analysis, with the assistance of third party valuation advisors, following the completion of the acquisition. The preliminary intangible asset values and their useful lives could be affected by a variety of factors that may become known to Konecranes only upon access to additional informa-tion and/or changes in these factors that may occur prior to the effective time of the acquisition. The preliminary estimated intangible assets consist of customer relationships, developed technology, sales order backlog, and trade name. The prelimi-nary useful lives range between one year and fifteen years. The preliminary fair values of the intangibles were based primarily on current estimates of MHPS’s expected future cash flows and may change as estimates and assumptions are refined. Addi-tional intangible asset classes may be identified as the valua-tion process continues.
The preliminary fair values of the identifiable assets and liabilities of the acquired MHPS businesses at the date of acqui-sition are summarized below. The purchase price consideration paid in cash includes the estimate of post-closing adjustments
whether the actual results of the hedge are within a range of 80–125%. As a result, no hedge ineffectiveness aroused that would require recognition through profit or loss.
interest rate riskAt December 31, 2015, the Group had interest rate swap agreements in place with a notional amount of EUR 100 million, whereby the Group received a variable interest rate equal to EURIBOR 1 month and paid interest at a fixed swap rate on the notional amount. The swap was being used to hedge the cash flow exposure on interest.
The cash flow hedges in 2016 and 2015 for the expected future sales were assessed to be highly effective and a net unrealized loss, with a deferred tax asset of relating to the hedging instruments, is included in OCI. The amounts recog-nized in OCI are shown in the table below and the reclassifi-cations to profit or loss during the year are as shown in the consolidated statement of income.
34.2. fair value reserve of cash flow hedges
2016 2015
Balance as of January 1 -9.1 -8.6
Gains and losses deferred to equity (fair value reserve) 30.1 -0.6
Change in deferred taxes -6.0 0.1
Balance as of december 31 15.0 -9.1
35. Fraudulent transactions in 2015 and insurance indemnity in 2016On August 14, 2015, Konecranes announced that one of its foreign subsidiaries had become a victim of a fraud. The perpetrators had through identity theft and other fraudulent actions managed to induce the subsidiary to make unwar-ranted payments in a total amount of up to EUR 17 million. This amount was booked as other operating expenses in the third quarter of 2015.
Konecranes has received an insurance indemnity of EUR 10 million, which was the maximum sum insured and returned funds of EUR 0.3 million. Konecranes has recorded the insur-ance indemnity as other operating income to its result for the second quarter of 2016.
36. Subsequent events
36.1. Material handling & port solutions segment acquisition from terex corporationOn May 16, 2016, Konecranes signed an agreement (the “Stock and Asset Purchase Agreement”) to acquire from Terex Corpo-ration (“Terex”) its Material Handling & Port Solutions (“MHPS”) segment (the “Acquisition”) against consideration consisting of cash and shares and to terminate the previously announced business combination agreement. On January 4, 2017, Kone-cranes Plc (“Konecranes”) completed the acquisition.
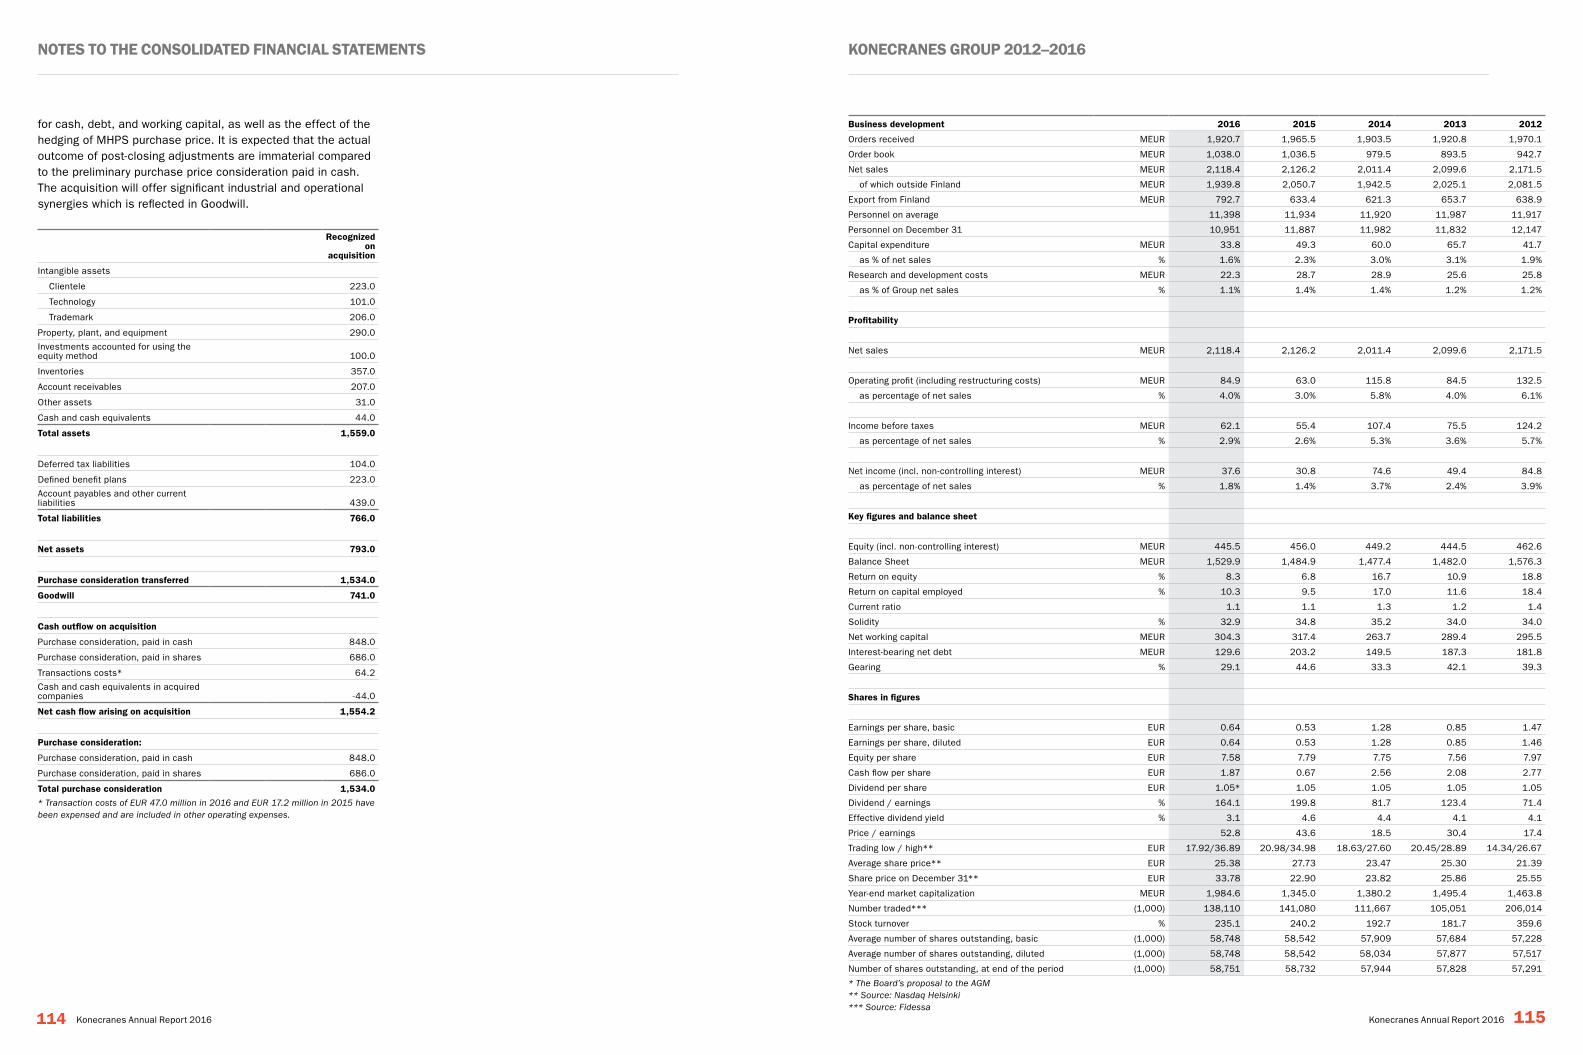
Notes to the coNsolidated fiNaNcial stateMeNts KoNecRaNes GRoUp 2012–2016
114 115Konecranes Annual Report 2016 Konecranes Annual Report 2016
for cash, debt, and working capital, as well as the effect of the hedging of MHPS purchase price. It is expected that the actual outcome of post-closing adjustments are immaterial compared to the preliminary purchase price consideration paid in cash. The acquisition will offer significant industrial and operational synergies which is reflected in Goodwill.
Recognized on
acquisition
Intangible assets
Clientele 223.0
Technology 101.0
Trademark 206.0
Property, plant, and equipment 290.0
Investments accounted for using the equity method 100.0
Inventories 357.0
Account receivables 207.0
Other assets 31.0
Cash and cash equivalents 44.0
total assets 1,559.0
Deferred tax liabilities 104.0
Defined benefit plans 223.0
Account payables and other current liabilities 439.0
total liabilities 766.0
Net assets 793.0
purchase consideration transferred 1,534.0
Goodwill 741.0
cash outflow on acquisition
Purchase consideration, paid in cash 848.0
Purchase consideration, paid in shares 686.0
Transactions costs* 64.2
Cash and cash equivalents in acquired companies -44.0
Net cash flow arising on acquisition 1,554.2
purchase consideration:
Purchase consideration, paid in cash 848.0
Purchase consideration, paid in shares 686.0
total purchase consideration 1,534.0
* Transaction costs of EUR 47.0 million in 2016 and EUR 17.2 million in 2015 have been expensed and are included in other operating expenses.
Business development 2016 2015 2014 2013 2012
Orders received MEUR 1,920.7 1,965.5 1,903.5 1,920.8 1,970.1
Order book MEUR 1,038.0 1,036.5 979.5 893.5 942.7
Net sales MEUR 2,118.4 2,126.2 2,011.4 2,099.6 2,171.5
of which outside Finland MEUR 1,939.8 2,050.7 1,942.5 2,025.1 2,081.5
Export from Finland MEUR 792.7 633.4 621.3 653.7 638.9
Personnel on average 11,398 11,934 11,920 11,987 11,917
Personnel on December 31 10,951 11,887 11,982 11,832 12,147
Capital expenditure MEUR 33.8 49.3 60.0 65.7 41.7
as % of net sales % 1.6% 2.3% 3.0% 3.1% 1.9%
Research and development costs MEUR 22.3 28.7 28.9 25.6 25.8
as % of Group net sales % 1.1% 1.4% 1.4% 1.2% 1.2%
profitability
Net sales MEUR 2,118.4 2,126.2 2,011.4 2,099.6 2,171.5
Operating profit (including restructuring costs) MEUR 84.9 63.0 115.8 84.5 132.5
as percentage of net sales % 4.0% 3.0% 5.8% 4.0% 6.1%
Income before taxes MEUR 62.1 55.4 107.4 75.5 124.2
as percentage of net sales % 2.9% 2.6% 5.3% 3.6% 5.7%
Net income (incl. non-controlling interest) MEUR 37.6 30.8 74.6 49.4 84.8
as percentage of net sales % 1.8% 1.4% 3.7% 2.4% 3.9%
Key figures and balance sheet
Equity (incl. non-controlling interest) MEUR 445.5 456.0 449.2 444.5 462.6
Balance Sheet MEUR 1,529.9 1,484.9 1,477.4 1,482.0 1,576.3
Return on equity % 8.3 6.8 16.7 10.9 18.8
Return on capital employed % 10.3 9.5 17.0 11.6 18.4
Current ratio 1.1 1.1 1.3 1.2 1.4
Solidity % 32.9 34.8 35.2 34.0 34.0
Net working capital MEUR 304.3 317.4 263.7 289.4 295.5
Interest-bearing net debt MEUR 129.6 203.2 149.5 187.3 181.8
Gearing % 29.1 44.6 33.3 42.1 39.3
shares in figures
Earnings per share, basic EUR 0.64 0.53 1.28 0.85 1.47
Earnings per share, diluted EUR 0.64 0.53 1.28 0.85 1.46
Equity per share EUR 7.58 7.79 7.75 7.56 7.97
Cash flow per share EUR 1.87 0.67 2.56 2.08 2.77
Dividend per share EUR 1.05* 1.05 1.05 1.05 1.05
Dividend / earnings % 164.1 199.8 81.7 123.4 71.4
Effective dividend yield % 3.1 4.6 4.4 4.1 4.1
Price / earnings 52.8 43.6 18.5 30.4 17.4
Trading low / high** EUR 17.92/36.89 20.98/34.98 18.63/27.60 20.45/28.89 14.34/26.67
Average share price** EUR 25.38 27.73 23.47 25.30 21.39
Share price on December 31** EUR 33.78 22.90 23.82 25.86 25.55
Year-end market capitalization MEUR 1,984.6 1,345.0 1,380.2 1,495.4 1,463.8
Number traded*** (1,000) 138,110 141,080 111,667 105,051 206,014
Stock turnover % 235.1 240.2 192.7 181.7 359.6
Average number of shares outstanding, basic (1,000) 58,748 58,542 57,909 57,684 57,228
Average number of shares outstanding, diluted (1,000) 58,748 58,542 58,034 57,877 57,517
Number of shares outstanding, at end of the period (1,000) 58,751 58,732 57,944 57,828 57,291
* The Board’s proposal to the AGM** Source: Nasdaq Helsinki*** Source: Fidessa
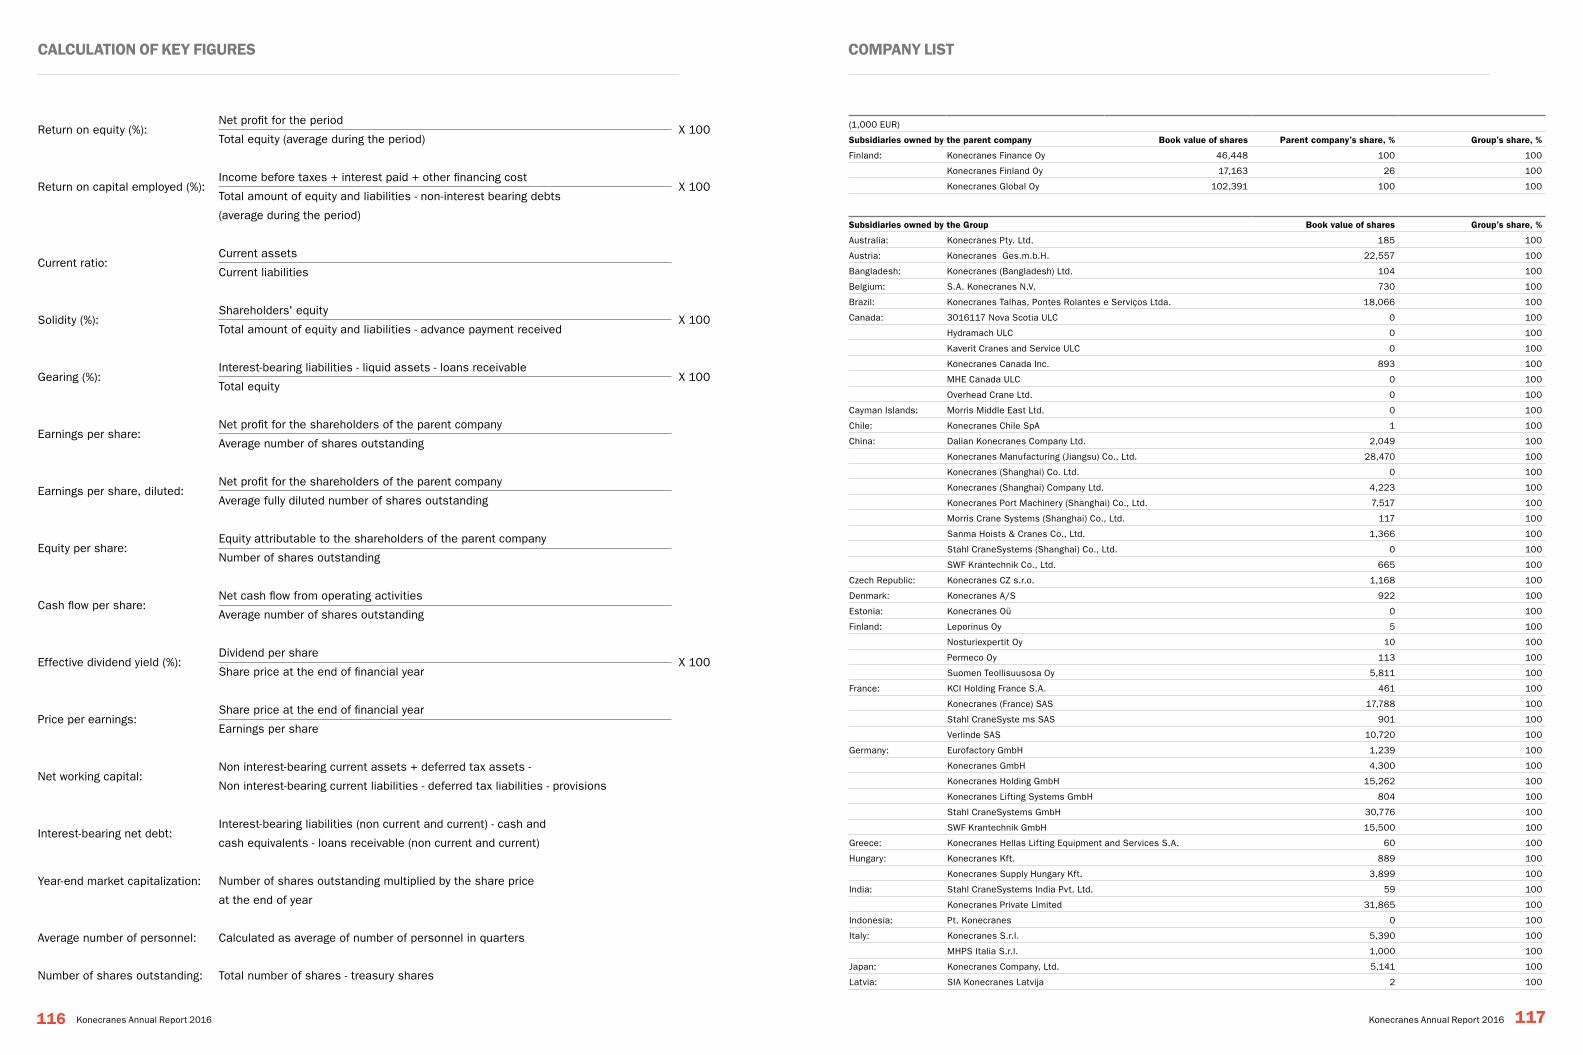
calcUlatioN of KeY fiGURes coMpaNY list
116 117Konecranes Annual Report 2016 Konecranes Annual Report 2016
Return on equity (%):Net profit for the period
X 100Total equity (average during the period)
Return on capital employed (%):Income before taxes + interest paid + other financing cost
X 100Total amount of equity and liabilities - non-interest bearing debts
(average during the period)
Current ratio:Current assets
Current liabilities
Solidity (%):Shareholders' equity
X 100Total amount of equity and liabilities - advance payment received
Gearing (%):Interest-bearing liabilities - liquid assets - loans receivable
X 100Total equity
Earnings per share:Net profit for the shareholders of the parent company
Average number of shares outstanding
Earnings per share, diluted:Net profit for the shareholders of the parent company
Average fully diluted number of shares outstanding
Equity per share:Equity attributable to the shareholders of the parent company
Number of shares outstanding
Cash flow per share:Net cash flow from operating activities
Average number of shares outstanding
Effective dividend yield (%):Dividend per share
X 100Share price at the end of financial year
Price per earnings:Share price at the end of financial year
Earnings per share
Net working capital:Non interest-bearing current assets + deferred tax assets -
Non interest-bearing current liabilities - deferred tax liabilities - provisions
Interest-bearing net debt:Interest-bearing liabilities (non current and current) - cash and
cash equivalents - loans receivable (non current and current)
Year-end market capitalization: Number of shares outstanding multiplied by the share price
at the end of year
Average number of personnel: Calculated as average of number of personnel in quarters
Number of shares outstanding: Total number of shares - treasury shares
(1,000 EUR)
subsidiaries owned by the parent company Book value of shares parent company’s share, % Group’s share, %
Finland: Konecranes Finance Oy 46,448 100 100
Konecranes Finland Oy 17,163 26 100
Konecranes Global Oy 102,391 100 100
subsidiaries owned by the Group Book value of shares Group’s share, %
Australia: Konecranes Pty. Ltd. 185 100
Austria: Konecranes Ges.m.b.H. 22,557 100
Bangladesh: Konecranes (Bangladesh) Ltd. 104 100
Belgium: S.A. Konecranes N.V. 730 100
Brazil: Konecranes Talhas, Pontes Rolantes e Serviços Ltda. 18,066 100
Canada: 3016117 Nova Scotia ULC 0 100
Hydramach ULC 0 100
Kaverit Cranes and Service ULC 0 100
Konecranes Canada Inc. 893 100
MHE Canada ULC 0 100
Overhead Crane Ltd. 0 100
Cayman Islands: Morris Middle East Ltd. 0 100
Chile: Konecranes Chile SpA 1 100
China: Dalian Konecranes Company Ltd. 2,049 100
Konecranes Manufacturing (Jiangsu) Co., Ltd. 28,470 100
Konecranes (Shanghai) Co. Ltd. 0 100
Konecranes (Shanghai) Company Ltd. 4,223 100
Konecranes Port Machinery (Shanghai) Co., Ltd. 7,517 100
Morris Crane Systems (Shanghai) Co., Ltd. 117 100
Sanma Hoists & Cranes Co., Ltd. 1,366 100
Stahl CraneSystems (Shanghai) Co., Ltd. 0 100
SWF Krantechnik Co., Ltd. 665 100
Czech Republic: Konecranes CZ s.r.o. 1,168 100
Denmark: Konecranes A/S 922 100
Estonia: Konecranes Oü 0 100
Finland: Leporinus Oy 5 100
Nosturiexpertit Oy 10 100
Permeco Oy 113 100
Suomen Teollisuusosa Oy 5,811 100
France: KCI Holding France S.A. 461 100
Konecranes (France) SAS 17,788 100
Stahl CraneSyste ms SAS 901 100
Verlinde SAS 10,720 100
Germany: Eurofactory GmbH 1,239 100
Konecranes GmbH 4,300 100
Konecranes Holding GmbH 15,262 100
Konecranes Lifting Systems GmbH 804 100
Stahl CraneSystems GmbH 30,776 100
SWF Krantechnik GmbH 15,500 100
Greece: Konecranes Hellas Lifting Equipment and Services S.A. 60 100
Hungary: Konecranes Kft. 889 100
Konecranes Supply Hungary Kft. 3,899 100
India: Stahl CraneSystems India Pvt. Ltd. 59 100
Konecranes Private Limited 31,865 100
Indonesia: Pt. Konecranes 0 100
Italy: Konecranes S.r.l. 5,390 100
MHPS Italia S.r.l. 1,000 100
Japan: Konecranes Company, Ltd. 5,141 100
Latvia: SIA Konecranes Latvija 2 100
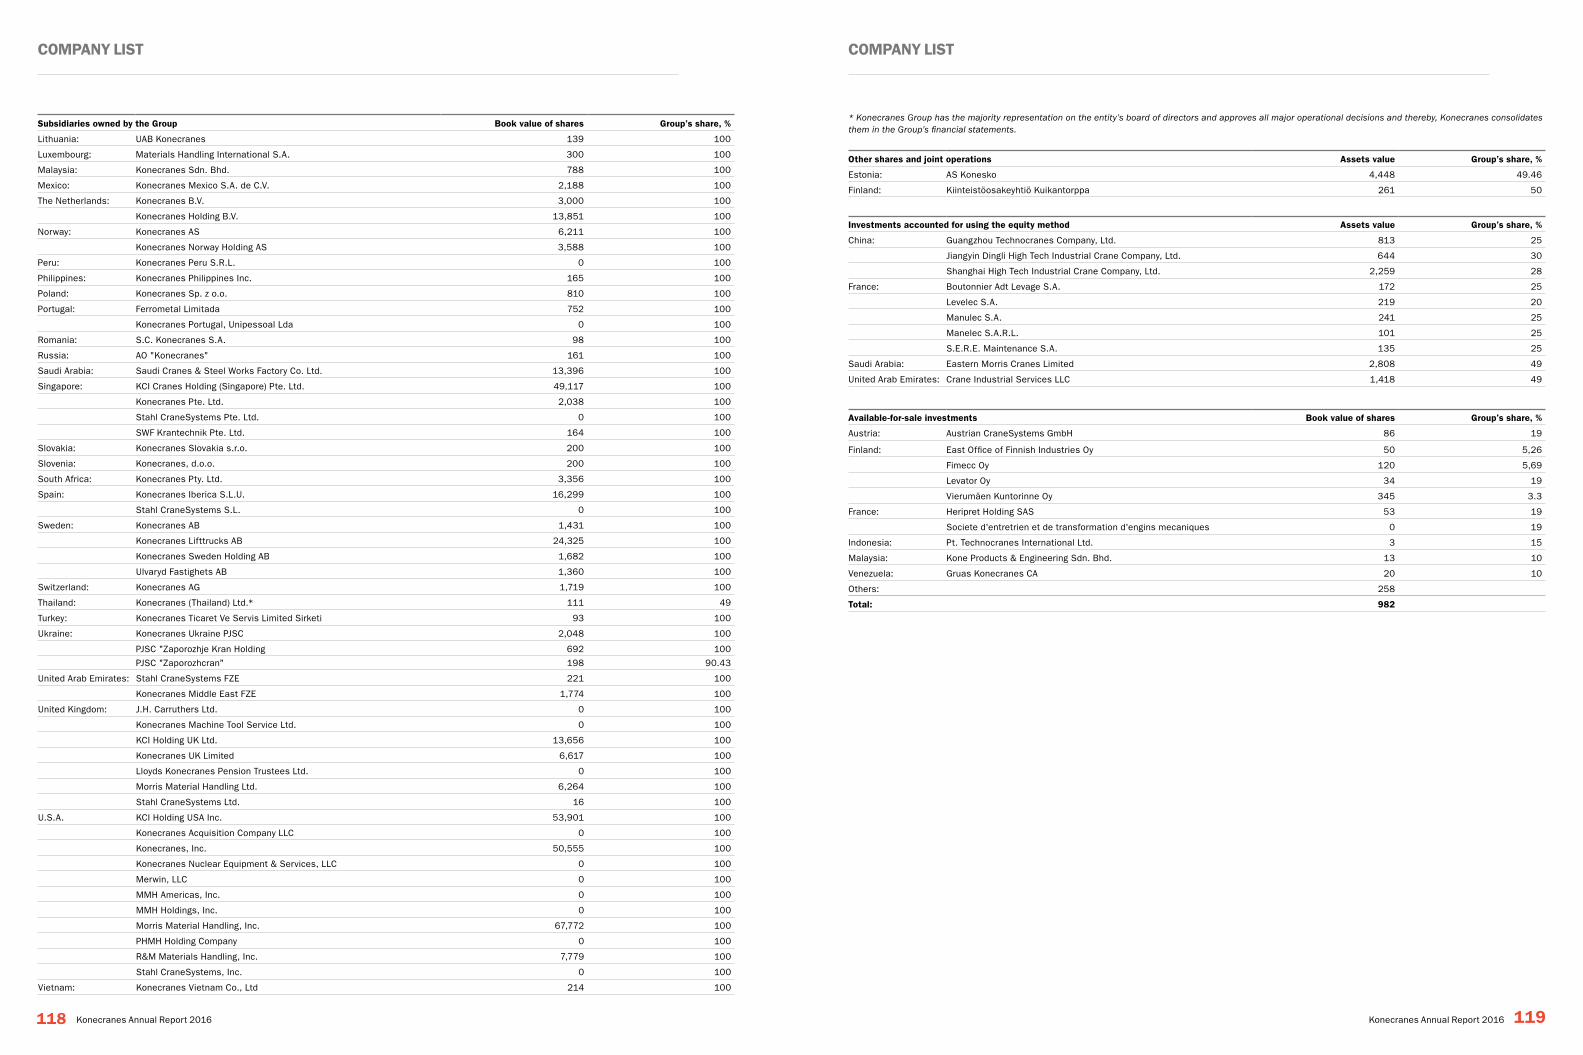
coMpaNY list coMpaNY list
118 119Konecranes Annual Report 2016 Konecranes Annual Report 2016
subsidiaries owned by the Group Book value of shares Group’s share, %
Lithuania: UAB Konecranes 139 100
Luxembourg: Materials Handling International S.A. 300 100
Malaysia: Konecranes Sdn. Bhd. 788 100
Mexico: Konecranes Mexico S.A. de C.V. 2,188 100
The Netherlands: Konecranes B.V. 3,000 100
Konecranes Holding B.V. 13,851 100
Norway: Konecranes AS 6,211 100
Konecranes Norway Holding AS 3,588 100
Peru: Konecranes Peru S.R.L. 0 100
Philippines: Konecranes Philippines Inc. 165 100
Poland: Konecranes Sp. z o.o. 810 100
Portugal: Ferrometal Limitada 752 100
Konecranes Portugal, Unipessoal Lda 0 100
Romania: S.C. Konecranes S.A. 98 100
Russia: AO "Konecranes" 161 100
Saudi Arabia: Saudi Cranes & Steel Works Factory Co. Ltd. 13,396 100
Singapore: KCI Cranes Holding (Singapore) Pte. Ltd. 49,117 100
Konecranes Pte. Ltd. 2,038 100
Stahl CraneSystems Pte. Ltd. 0 100
SWF Krantechnik Pte. Ltd. 164 100
Slovakia: Konecranes Slovakia s.r.o. 200 100
Slovenia: Konecranes, d.o.o. 200 100
South Africa: Konecranes Pty. Ltd. 3,356 100
Spain: Konecranes Iberica S.L.U. 16,299 100
Stahl CraneSystems S.L. 0 100
Sweden: Konecranes AB 1,431 100
Konecranes Lifttrucks AB 24,325 100
Konecranes Sweden Holding AB 1,682 100
Ulvaryd Fastighets AB 1,360 100
Switzerland: Konecranes AG 1,719 100
Thailand: Konecranes (Thailand) Ltd.* 111 49
Turkey: Konecranes Ticaret Ve Servis Limited Sirketi 93 100
Ukraine: Konecranes Ukraine PJSC 2,048 100
PJSC "Zaporozhje Kran Holding 692 100
PJSC "Zaporozhcran" 198 90.43
United Arab Emirates: Stahl CraneSystems FZE 221 100
Konecranes Middle East FZE 1,774 100
United Kingdom: J.H. Carruthers Ltd. 0 100
Konecranes Machine Tool Service Ltd. 0 100
KCI Holding UK Ltd. 13,656 100
Konecranes UK Limited 6,617 100
Lloyds Konecranes Pension Trustees Ltd. 0 100
Morris Material Handling Ltd. 6,264 100
Stahl CraneSystems Ltd. 16 100
U.S.A. KCI Holding USA Inc. 53,901 100
Konecranes Acquisition Company LLC 0 100
Konecranes, Inc. 50,555 100
Konecranes Nuclear Equipment & Services, LLC 0 100
Merwin, LLC 0 100
MMH Americas, Inc. 0 100
MMH Holdings, Inc. 0 100
Morris Material Handling, Inc. 67,772 100
PHMH Holding Company 0 100
R&M Materials Handling, Inc. 7,779 100
Stahl CraneSystems, Inc. 0 100
Vietnam: Konecranes Vietnam Co., Ltd 214 100
* Konecranes Group has the majority representation on the entity’s board of directors and approves all major operational decisions and thereby, Konecranes consolidates them in the Group’s financial statements.
other shares and joint operations assets value Group’s share, %
Estonia: AS Konesko 4,448 49.46
Finland: Kiinteistöosakeyhtiö Kuikantorppa 261 50
investments accounted for using the equity method assets value Group’s share, %
China: Guangzhou Technocranes Company, Ltd. 813 25
Jiangyin Dingli High Tech Industrial Crane Company, Ltd. 644 30
Shanghai High Tech Industrial Crane Company, Ltd. 2,259 28
France: Boutonnier Adt Levage S.A. 172 25
Levelec S.A. 219 20
Manulec S.A. 241 25
Manelec S.A.R.L. 101 25
S.E.R.E. Maintenance S.A. 135 25
Saudi Arabia: Eastern Morris Cranes Limited 2,808 49
United Arab Emirates: Crane Industrial Services LLC 1,418 49
available-for-sale investments Book value of shares Group’s share, %
Austria: Austrian CraneSystems GmbH 86 19
Finland: East Office of Finnish Industries Oy 50 5,26
Fimecc Oy 120 5,69
Levator Oy 34 19
Vierumäen Kuntorinne Oy 345 3.3
France: Heripret Holding SAS 53 19
Societe d'entretrien et de transformation d'engins mecaniques 0 19
Indonesia: Pt. Technocranes International Ltd. 3 15
Malaysia: Kone Products & Engineering Sdn. Bhd. 13 10
Venezuela: Gruas Konecranes CA 20 10
Others: 258
total: 982
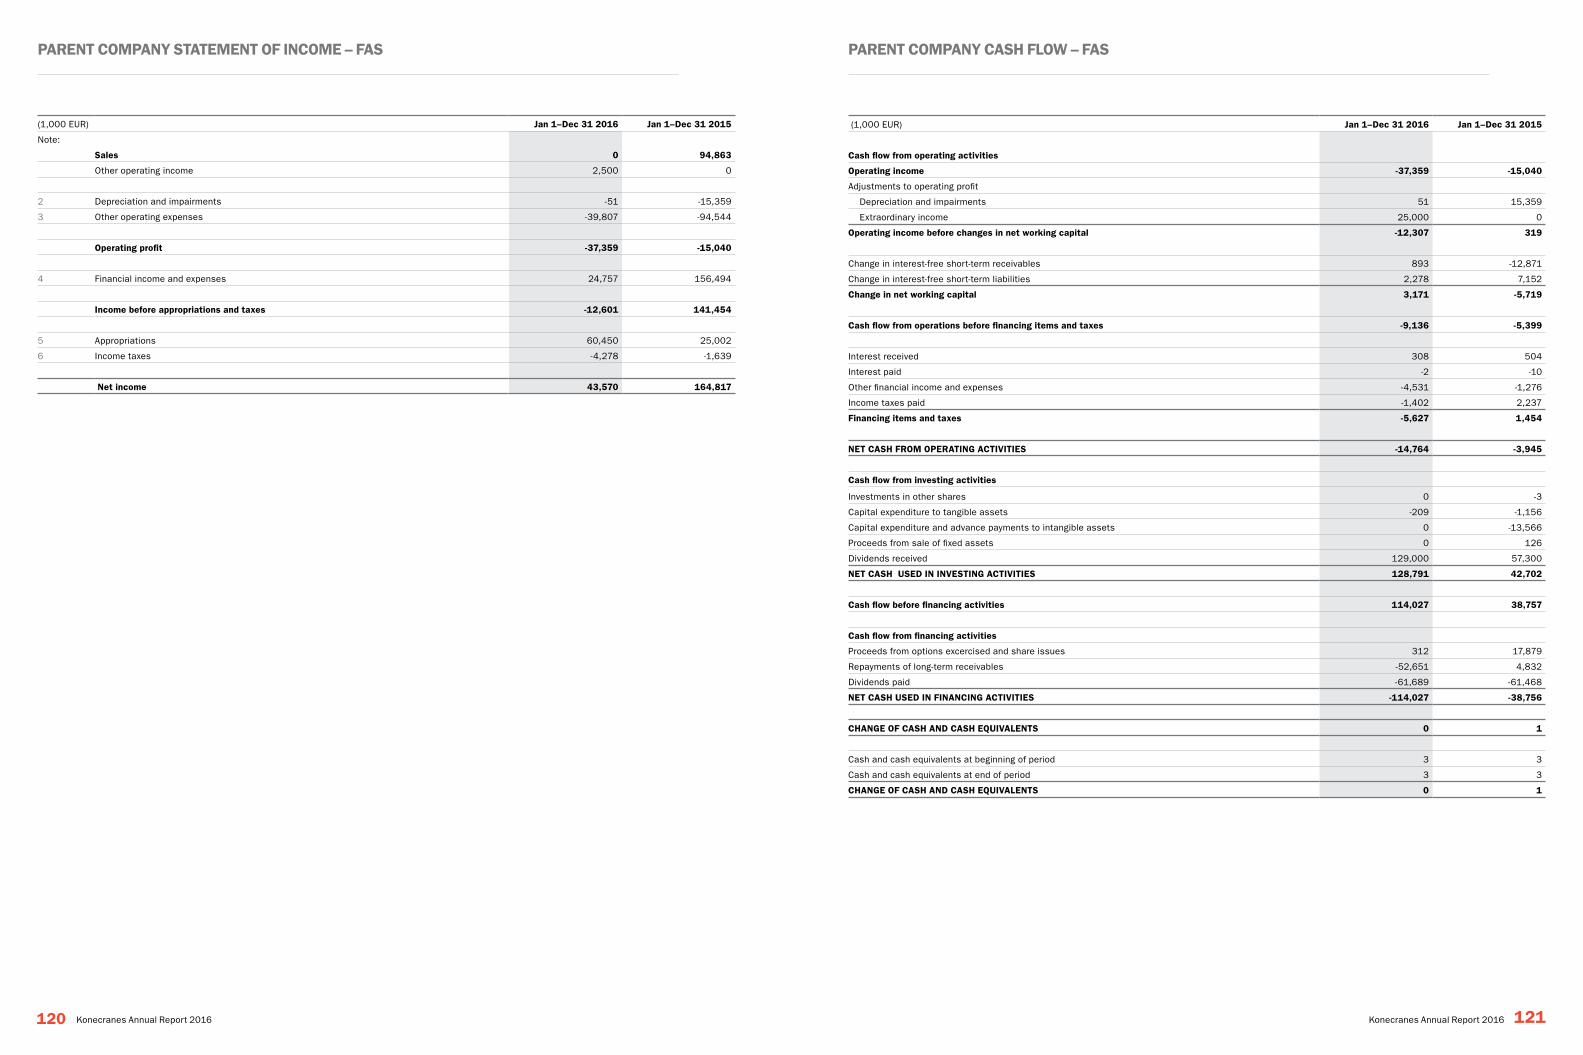
paReNt coMpaNY stateMeNt of iNcoMe – fas paReNt coMpaNY cash flow – fas
120 121Konecranes Annual Report 2016 Konecranes Annual Report 2016
(1,000 EUR) Jan 1–dec 31 2016 Jan 1–dec 31 2015
Note:
sales 0 94,863
Other operating income 2,500 0
2 Depreciation and impairments -51 -15,359
3 Other operating expenses -39,807 -94,544
operating profit -37,359 -15,040
4 Financial income and expenses 24,757 156,494
income before appropriations and taxes -12,601 141,454
5 Appropriations 60,450 25,002
6 Income taxes -4,278 -1,639
Net income 43,570 164,817
(1,000 EUR) Jan 1–dec 31 2016 Jan 1–dec 31 2015
cash flow from operating activities
operating income -37,359 -15,040
Adjustments to operating profit
Depreciation and impairments 51 15,359
Extraordinary income 25,000 0
operating income before changes in net working capital -12,307 319
Change in interest-free short-term receivables 893 -12,871
Change in interest-free short-term liabilities 2,278 7,152
change in net working capital 3,171 -5,719
cash flow from operations before financing items and taxes -9,136 -5,399
Interest received 308 504
Interest paid -2 -10
Other financial income and expenses -4,531 -1,276
Income taxes paid -1,402 2,237
financing items and taxes -5,627 1,454
Net cash fRoM opeRatiNG actiVities -14,764 -3,945
cash flow from investing activities
Investments in other shares 0 -3
Capital expenditure to tangible assets -209 -1,156
Capital expenditure and advance payments to intangible assets 0 -13,566
Proceeds from sale of fixed assets 0 126
Dividends received 129,000 57,300
Net cash Used iN iNVestiNG actiVities 128,791 42,702
cash flow before financing activities 114,027 38,757
cash flow from financing activities
Proceeds from options excercised and share issues 312 17,879
Repayments of long-term receivables -52,651 4,832
Dividends paid -61,689 -61,468
Net cash Used iN fiNaNciNG actiVities -114,027 -38,756
chaNGe of cash aNd cash eQUiValeNts 0 1
Cash and cash equivalents at beginning of period 3 3
Cash and cash equivalents at end of period 3 3
chaNGe of cash aNd cash eQUiValeNts 0 1
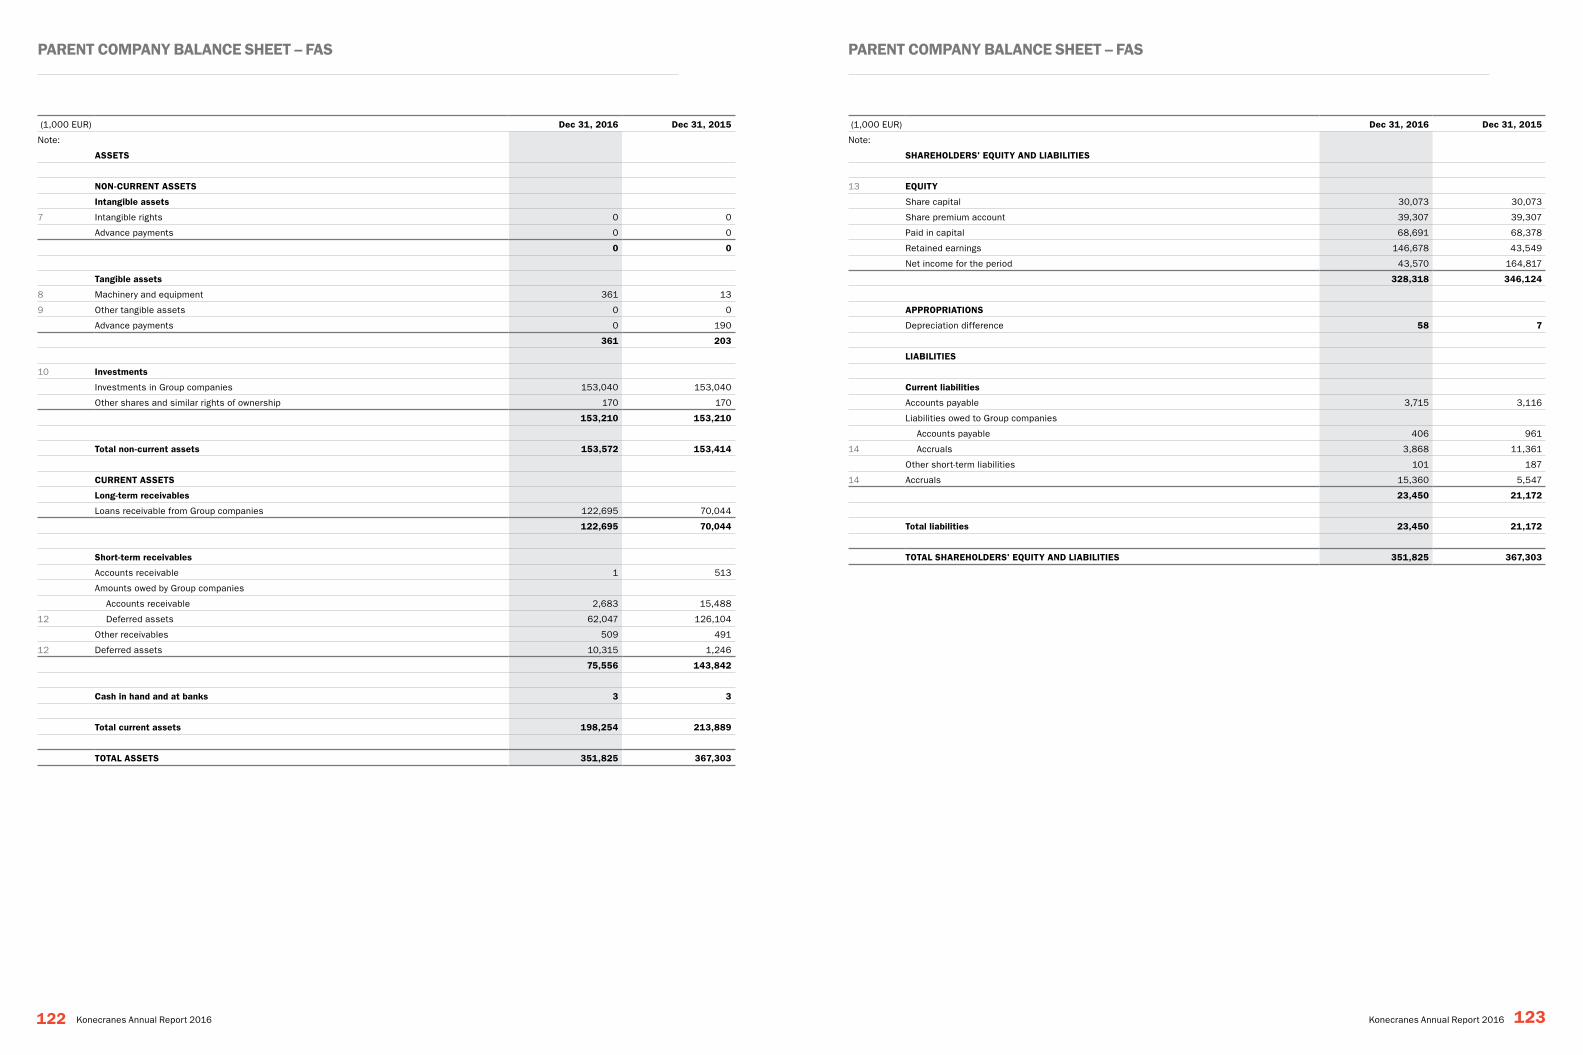
paReNt coMpaNY BalaNce sheet – fas paReNt coMpaNY BalaNce sheet – fas
122 123Konecranes Annual Report 2016 Konecranes Annual Report 2016
(1,000 EUR) dec 31, 2016 dec 31, 2015
Note:
assets
NoN-cURReNt assets
intangible assets
7 Intangible rights 0 0
Advance payments 0 0
0 0
tangible assets
8 Machinery and equipment 361 13
9 Other tangible assets 0 0
Advance payments 0 190
361 203
10 investments
Investments in Group companies 153,040 153,040
Other shares and similar rights of ownership 170 170
153,210 153,210
total non-current assets 153,572 153,414
cURReNt assets
long-term receivables
Loans receivable from Group companies 122,695 70,044
122,695 70,044
short-term receivables
Accounts receivable 1 513
Amounts owed by Group companies
Accounts receivable 2,683 15,488
12 Deferred assets 62,047 126,104
Other receivables 509 491
12 Deferred assets 10,315 1,246
75,556 143,842
cash in hand and at banks 3 3
total current assets 198,254 213,889
total assets 351,825 367,303
(1,000 EUR) dec 31, 2016 dec 31, 2015
Note:
shaReholdeRs' eQUitY aNd liaBilities
13 eQUitY
Share capital 30,073 30,073
Share premium account 39,307 39,307
Paid in capital 68,691 68,378
Retained earnings 146,678 43,549
Net income for the period 43,570 164,817
328,318 346,124
appRopRiatioNs
Depreciation difference 58 7
liaBilities
current liabilities
Accounts payable 3,715 3,116
Liabilities owed to Group companies
Accounts payable 406 961
14 Accruals 3,868 11,361
Other short-term liabilities 101 187
14 Accruals 15,360 5,547
23,450 21,172
total liabilities 23,450 21,172
total shaReholdeRs' eQUitY aNd liaBilities 351,825 367,303
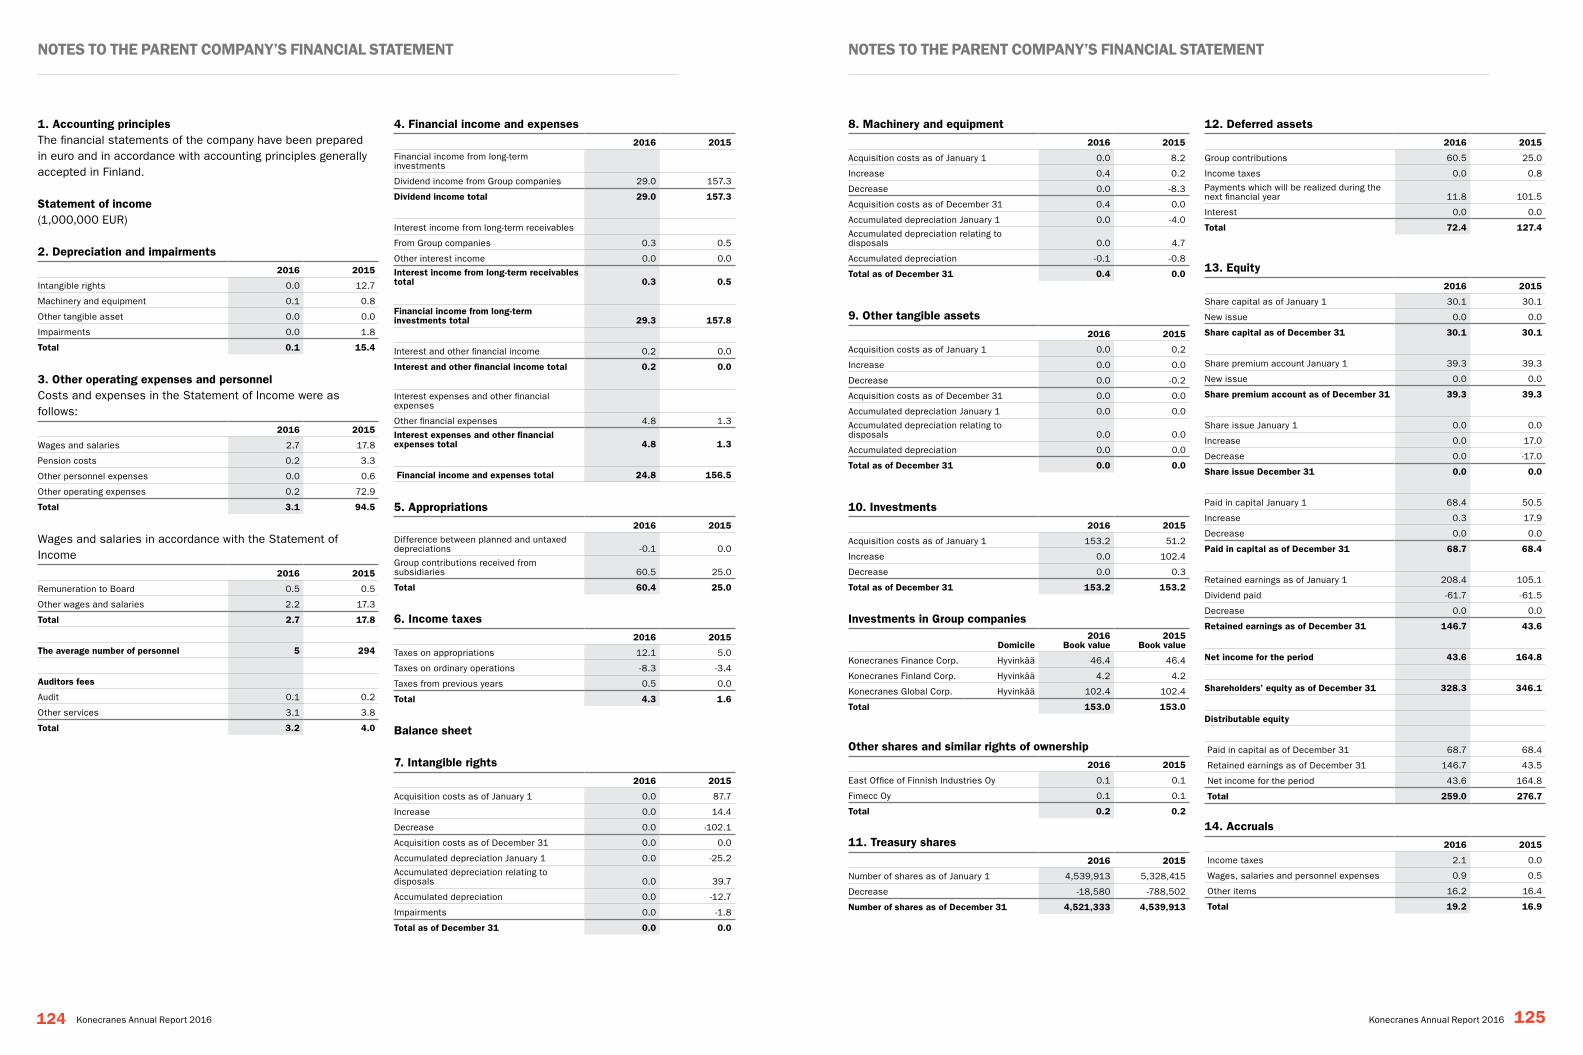
Notes to the paReNt coMpaNY’s fiNaNcial stateMeNt Notes to the paReNt coMpaNY’s fiNaNcial stateMeNt
124 125Konecranes Annual Report 2016 Konecranes Annual Report 2016
1. accounting principles The financial statements of the company have been prepared in euro and in accordance with accounting principles generally accepted in Finland.
statement of income (1,000,000 EUR)
2. depreciation and impairments 2016 2015
Intangible rights 0.0 12.7
Machinery and equipment 0.1 0.8
Other tangible asset 0.0 0.0
Impairments 0.0 1.8
total 0.1 15.4
3. other operating expenses and personnel Costs and expenses in the Statement of Income were as follows:
2016 2015
Wages and salaries 2.7 17.8
Pension costs 0.2 3.3
Other personnel expenses 0.0 0.6
Other operating expenses 0.2 72.9
total 3.1 94.5
Wages and salaries in accordance with the Statement of Income
2016 2015
Remuneration to Board 0.5 0.5
Other wages and salaries 2.2 17.3
total 2.7 17.8
the average number of personnel 5 294
auditors fees
Audit 0.1 0.2
Other services 3.1 3.8
total 3.2 4.0
4. financial income and expenses 2016 2015
Financial income from long-term investments
Dividend income from Group companies 29.0 157.3
dividend income total 29.0 157.3
Interest income from long-term receivables
From Group companies 0.3 0.5
Other interest income 0.0 0.0
interest income from long-term receivables total 0.3 0.5
financial income from long-term investments total 29.3 157.8
Interest and other financial income 0.2 0.0
interest and other financial income total 0.2 0.0
Interest expenses and other financial expenses
Other financial expenses 4.8 1.3
interest expenses and other financial expenses total 4.8 1.3
financial income and expenses total 24.8 156.5
5. appropriations 2016 2015
Difference between planned and untaxed depreciations -0.1 0.0
Group contributions received from subsidiaries 60.5 25.0
total 60.4 25.0
6. income taxes 2016 2015
Taxes on appropriations 12.1 5.0
Taxes on ordinary operations -8.3 -3.4
Taxes from previous years 0.5 0.0
total 4.3 1.6
Balance sheet
7. intangible rights 2016 2015
Acquisition costs as of January 1 0.0 87.7
Increase 0.0 14.4
Decrease 0.0 -102.1
Acquisition costs as of December 31 0.0 0.0
Accumulated depreciation January 1 0.0 -25.2
Accumulated depreciation relating to disposals 0.0 39.7
Accumulated depreciation 0.0 -12.7
Impairments 0.0 -1.8
total as of december 31 0.0 0.0
8. Machinery and equipment 2016 2015
Acquisition costs as of January 1 0.0 8.2
Increase 0.4 0.2
Decrease 0.0 -8.3
Acquisition costs as of December 31 0.4 0.0
Accumulated depreciation January 1 0.0 -4.0
Accumulated depreciation relating to disposals 0.0 4.7
Accumulated depreciation -0.1 -0.8
total as of december 31 0.4 0.0
9. other tangible assets 2016 2015
Acquisition costs as of January 1 0.0 0.2
Increase 0.0 0.0
Decrease 0.0 -0.2
Acquisition costs as of December 31 0.0 0.0
Accumulated depreciation January 1 0.0 0.0
Accumulated depreciation relating to disposals 0.0 0.0
Accumulated depreciation 0.0 0.0
total as of december 31 0.0 0.0
10. investments 2016 2015
Acquisition costs as of January 1 153.2 51.2
Increase 0.0 102.4
Decrease 0.0 0.3
total as of december 31 153.2 153.2
investments in Group companies
domicile 2016
Book value 2015
Book value
Konecranes Finance Corp. Hyvinkää 46.4 46.4
Konecranes Finland Corp. Hyvinkää 4.2 4.2
Konecranes Global Corp. Hyvinkää 102.4 102.4
total 153.0 153.0
other shares and similar rights of ownership 2016 2015
East Office of Finnish Industries Oy 0.1 0.1
Fimecc Oy 0.1 0.1
total 0.2 0.2
11. treasury shares 2016 2015
Number of shares as of January 1 4,539,913 5,328,415
Decrease -18,580 -788,502
Number of shares as of december 31 4,521,333 4,539,913
12. deferred assets 2016 2015
Group contributions 60.5 25.0
Income taxes 0.0 0.8
Payments which will be realized during the next financial year 11.8 101.5
Interest 0.0 0.0
total 72.4 127.4
13. equity 2016 2015
Share capital as of January 1 30.1 30.1
New issue 0.0 0.0
share capital as of december 31 30.1 30.1
Share premium account January 1 39.3 39.3
New issue 0.0 0.0
share premium account as of december 31 39.3 39.3
Share issue January 1 0.0 0.0
Increase 0.0 17.0
Decrease 0.0 -17.0
share issue december 31 0.0 0.0
Paid in capital January 1 68.4 50.5
Increase 0.3 17.9
Decrease 0.0 0.0
paid in capital as of december 31 68.7 68.4
Retained earnings as of January 1 208.4 105.1
Dividend paid -61.7 -61.5
Decrease 0.0 0.0
Retained earnings as of december 31 146.7 43.6
Net income for the period 43.6 164.8
shareholders' equity as of december 31 328.3 346.1
distributable equity
Paid in capital as of December 31 68.7 68.4
Retained earnings as of December 31 146.7 43.5
Net income for the period 43.6 164.8
total 259.0 276.7
14. accruals 2016 2015
Income taxes 2.1 0.0
Wages, salaries and personnel expenses 0.9 0.5
Other items 16.2 16.4
total 19.2 16.9
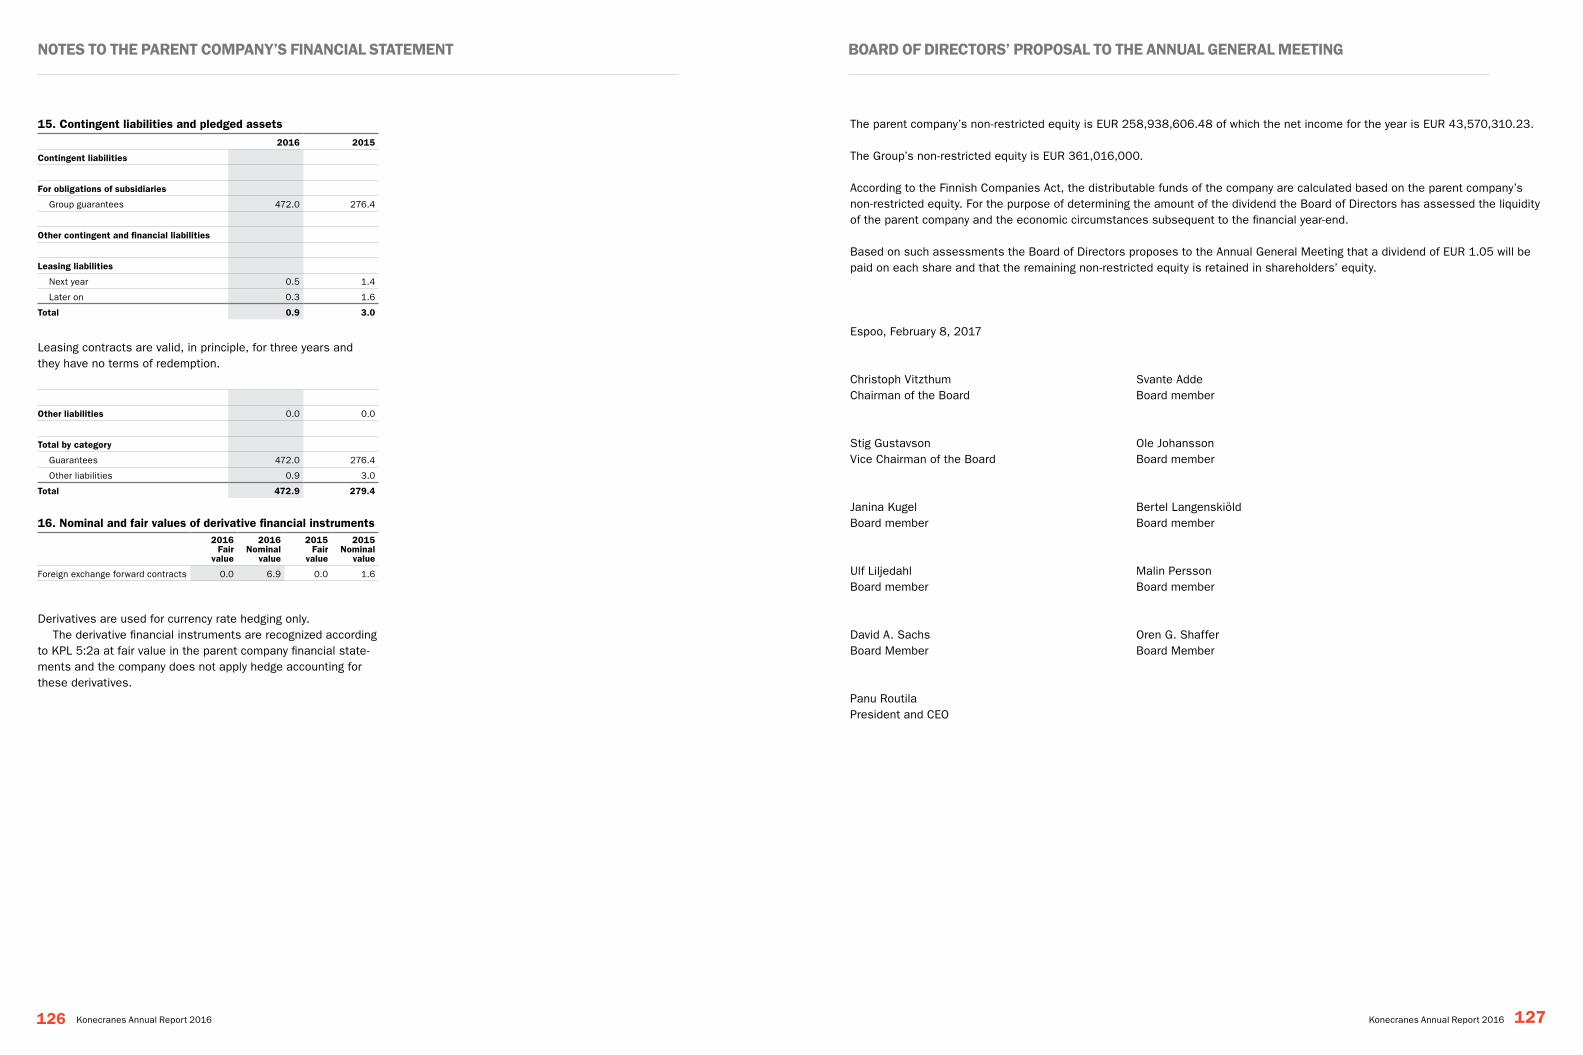
Notes to the paReNt coMpaNY’s fiNaNcial stateMeNt BoaRd of diRectoRs’ pRoposal to the aNNUal GeNeRal MeetiNG
126 127Konecranes Annual Report 2016 Konecranes Annual Report 2016
15. contingent liabilities and pledged assets 2016 2015
contingent liabilities
for obligations of subsidiaries
Group guarantees 472.0 276.4
other contingent and financial liabilities
leasing liabilities
Next year 0.5 1.4
Later on 0.3 1.6
total 0.9 3.0
Leasing contracts are valid, in principle, for three years and they have no terms of redemption.
other liabilities 0.0 0.0
total by category
Guarantees 472.0 276.4
Other liabilities 0.9 3.0
total 472.9 279.4
16. Nominal and fair values of derivative financial instruments 2016
fair value
2016 Nominal
value
2015 fair
value
2015 Nominal
value
Foreign exchange forward contracts 0.0 6.9 0.0 1.6
Derivatives are used for currency rate hedging only.The derivative financial instruments are recognized according
to KPL 5:2a at fair value in the parent company financial state-ments and the company does not apply hedge accounting for these derivatives.
The parent company’s non-restricted equity is EUR 258,938,606.48 of which the net income for the year is EUR 43,570,310.23.
The Group’s non-restricted equity is EUR 361,016,000.
According to the Finnish Companies Act, the distributable funds of the company are calculated based on the parent company’s non-restricted equity. For the purpose of determining the amount of the dividend the Board of Directors has assessed the liquidity of the parent company and the economic circumstances subsequent to the financial year-end.
Based on such assessments the Board of Directors proposes to the Annual General Meeting that a dividend of EUR 1.05 will be paid on each share and that the remaining non-restricted equity is retained in shareholders’ equity.
Espoo, February 8, 2017
Christoph Vitzthum Svante AddeChairman of the Board Board member
Stig Gustavson Ole JohanssonVice Chairman of the Board Board member
Janina Kugel Bertel LangenskiöldBoard member Board member
Ulf Liljedahl Malin PerssonBoard member Board member
David A. Sachs Oren G. ShafferBoard Member Board Member
Panu RoutilaPresident and CEO
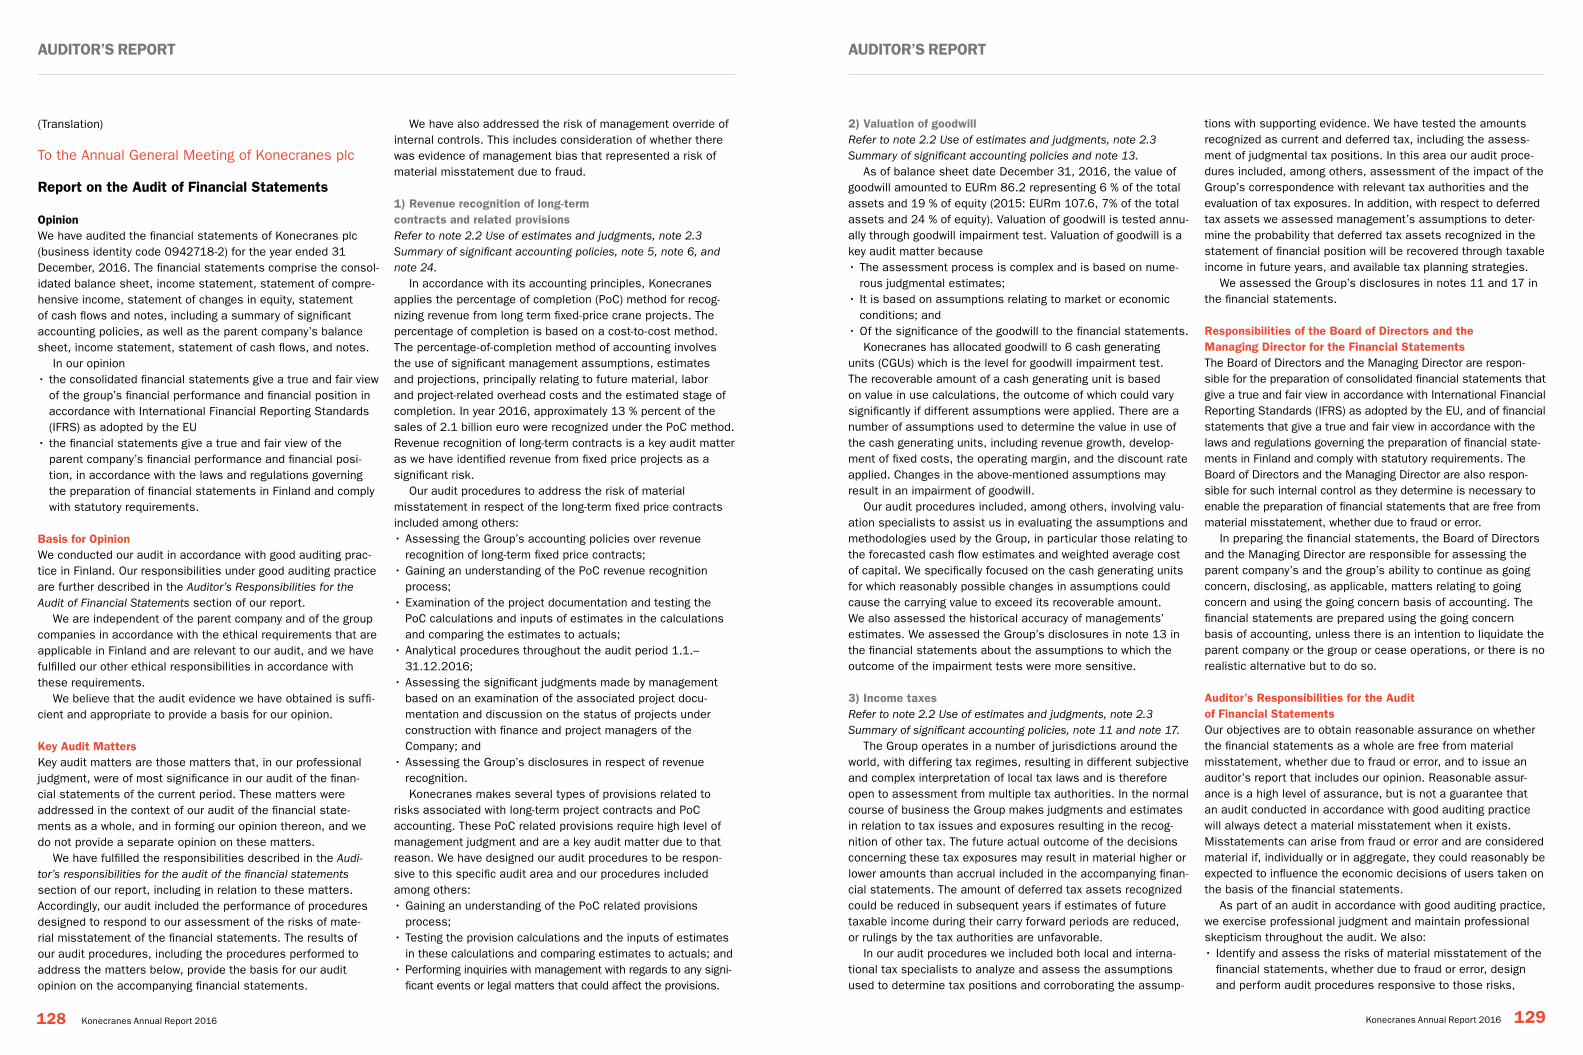
(Translation)
To the Annual General Meeting of Konecranes plc
report on the Audit of Financial Statements
opinion We have audited the financial statements of Konecranes plc (business identity code 0942718-2) for the year ended 31 December, 2016. The financial statements comprise the consol-idated balance sheet, income statement, statement of compre-hensive income, statement of changes in equity, statement of cash flows and notes, including a summary of significant accounting policies, as well as the parent company’s balance sheet, income statement, statement of cash flows, and notes.
In our opinion• the consolidated financial statements give a true and fair view
of the group’s financial performance and financial position in accordance with International Financial Reporting Standards (IFRS) as adopted by the EU
• the financial statements give a true and fair view of the parent company’s financial performance and financial posi-tion, in accordance with the laws and regulations governing the preparation of financial statements in Finland and comply with statutory requirements.
Basis for opinion We conducted our audit in accordance with good auditing prac-tice in Finland. Our responsibilities under good auditing practice are further described in the Auditor’s Responsibilities for the Audit of Financial Statements section of our report.
We are independent of the parent company and of the group companies in accordance with the ethical requirements that are applicable in Finland and are relevant to our audit, and we have fulfilled our other ethical responsibilities in accordance with these requirements.
We believe that the audit evidence we have obtained is suffi-cient and appropriate to provide a basis for our opinion.
Key Audit MattersKey audit matters are those matters that, in our professional judgment, were of most significance in our audit of the finan-cial statements of the current period. These matters were addressed in the context of our audit of the financial state-ments as a whole, and in forming our opinion thereon, and we do not provide a separate opinion on these matters.
We have fulfilled the responsibilities described in the Audi-tor’s responsibilities for the audit of the financial statements section of our report, including in relation to these matters. Accordingly, our audit included the performance of procedures designed to respond to our assessment of the risks of mate-rial misstatement of the financial statements. The results of our audit procedures, including the procedures performed to address the matters below, provide the basis for our audit opinion on the accompanying financial statements.
We have also addressed the risk of management override of internal controls. This includes consideration of whether there was evidence of management bias that represented a risk of material misstatement due to fraud.
1) revenue recognition of long-term contracts and related provisionsRefer to note 2.2 Use of estimates and judgments, note 2.3 Summary of significant accounting policies, note 5, note 6, and note 24.
In accordance with its accounting principles, Konecranes applies the percentage of completion (PoC) method for recog-nizing revenue from long term fixed-price crane projects. The percentage of completion is based on a cost-to-cost method. The percentage-of-completion method of accounting involves the use of significant management assumptions, estimates and projections, principally relating to future material, labor and project-related overhead costs and the estimated stage of completion. In year 2016, approximately 13 % percent of the sales of 2.1 billion euro were recognized under the PoC method. Revenue recognition of long-term contracts is a key audit matter as we have identified revenue from fixed price projects as a significant risk.
Our audit procedures to address the risk of material misstatement in respect of the long-term fixed price contracts included among others: • Assessing the Group’s accounting policies over revenue
recognition of long-term fixed price contracts;• Gaining an understanding of the PoC revenue recognition
process;• Examination of the project documentation and testing the
PoC calculations and inputs of estimates in the calculations and comparing the estimates to actuals;
• Analytical procedures throughout the audit period 1.1.–31.12.2016;
• Assessing the significant judgments made by management based on an examination of the associated project docu-mentation and discussion on the status of projects under construction with finance and project managers of the Company; and
• Assessing the Group’s disclosures in respect of revenue recognition.Konecranes makes several types of provisions related to
risks associated with long-term project contracts and PoC accounting. These PoC related provisions require high level of management judgment and are a key audit matter due to that reason. We have designed our audit procedures to be respon-sive to this specific audit area and our procedures included among others:• Gaining an understanding of the PoC related provisions
process; • Testing the provision calculations and the inputs of estimates
in these calculations and comparing estimates to actuals; and• Performing inquiries with management with regards to any signi-
ficant events or legal matters that could affect the provisions.
2) Valuation of goodwill Refer to note 2.2 Use of estimates and judgments, note 2.3 Summary of significant accounting policies and note 13.
As of balance sheet date December 31, 2016, the value of goodwill amounted to EURm 86.2 representing 6 % of the total assets and 19 % of equity (2015: EURm 107.6, 7% of the total assets and 24 % of equity). Valuation of goodwill is tested annu-ally through goodwill impairment test. Valuation of goodwill is a key audit matter because • The assessment process is complex and is based on nume-
rous judgmental estimates;• It is based on assumptions relating to market or economic
conditions; and• Of the significance of the goodwill to the financial statements.
Konecranes has allocated goodwill to 6 cash generating units (CGUs) which is the level for goodwill impairment test. The recoverable amount of a cash generating unit is based on value in use calculations, the outcome of which could vary significantly if different assumptions were applied. There are a number of assumptions used to determine the value in use of the cash generating units, including revenue growth, develop-ment of fixed costs, the operating margin, and the discount rate applied. Changes in the above-mentioned assumptions may result in an impairment of goodwill.
Our audit procedures included, among others, involving valu-ation specialists to assist us in evaluating the assumptions and methodologies used by the Group, in particular those relating to the forecasted cash flow estimates and weighted average cost of capital. We specifically focused on the cash generating units for which reasonably possible changes in assumptions could cause the carrying value to exceed its recoverable amount. We also assessed the historical accuracy of managements’ estimates. We assessed the Group’s disclosures in note 13 in the financial statements about the assumptions to which the outcome of the impairment tests were more sensitive.
3) income taxesRefer to note 2.2 Use of estimates and judgments, note 2.3 Summary of significant accounting policies, note 11 and note 17.
The Group operates in a number of jurisdictions around the world, with differing tax regimes, resulting in different subjective and complex interpretation of local tax laws and is therefore open to assessment from multiple tax authorities. In the normal course of business the Group makes judgments and estimates in relation to tax issues and exposures resulting in the recog-nition of other tax. The future actual outcome of the decisions concerning these tax exposures may result in material higher or lower amounts than accrual included in the accompanying finan-cial statements. The amount of deferred tax assets recognized could be reduced in subsequent years if estimates of future taxable income during their carry forward periods are reduced, or rulings by the tax authorities are unfavorable.
In our audit procedures we included both local and interna-tional tax specialists to analyze and assess the assumptions used to determine tax positions and corroborating the assump-
tions with supporting evidence. We have tested the amounts recognized as current and deferred tax, including the assess-ment of judgmental tax positions. In this area our audit proce-dures included, among others, assessment of the impact of the Group’s correspondence with relevant tax authorities and the evaluation of tax exposures. In addition, with respect to deferred tax assets we assessed management’s assumptions to deter-mine the probability that deferred tax assets recognized in the statement of financial position will be recovered through taxable income in future years, and available tax planning strategies.
We assessed the Group’s disclosures in notes 11 and 17 in the financial statements.
responsibilities of the Board of Directors and the Managing Director for the Financial Statements The Board of Directors and the Managing Director are respon-sible for the preparation of consolidated financial statements that give a true and fair view in accordance with International Financial Reporting Standards (IFRS) as adopted by the EU, and of financial statements that give a true and fair view in accordance with the laws and regulations governing the preparation of financial state-ments in Finland and comply with statutory requirements. The Board of Directors and the Managing Director are also respon-sible for such internal control as they determine is necessary to enable the preparation of financial statements that are free from material misstatement, whether due to fraud or error.
In preparing the financial statements, the Board of Directors and the Managing Director are responsible for assessing the parent company’s and the group’s ability to continue as going concern, disclosing, as applicable, matters relating to going concern and using the going concern basis of accounting. The financial statements are prepared using the going concern basis of accounting, unless there is an intention to liquidate the parent company or the group or cease operations, or there is no realistic alternative but to do so.
Auditor’s responsibilities for the Audit of Financial Statements Our objectives are to obtain reasonable assurance on whether the financial statements as a whole are free from material misstatement, whether due to fraud or error, and to issue an auditor’s report that includes our opinion. Reasonable assur-ance is a high level of assurance, but is not a guarantee that an audit conducted in accordance with good auditing practice will always detect a material misstatement when it exists. Misstatements can arise from fraud or error and are considered material if, individually or in aggregate, they could reasonably be expected to influence the economic decisions of users taken on the basis of the financial statements.
As part of an audit in accordance with good auditing practice, we exercise professional judgment and maintain professional skepticism throughout the audit. We also:• Identify and assess the risks of material misstatement of the
financial statements, whether due to fraud or error, design and perform audit procedures responsive to those risks,
AUDitor’S rePort AUDitor’S rePort
128 Konecranes Annual Report 2016 Konecranes Annual Report 2016 129
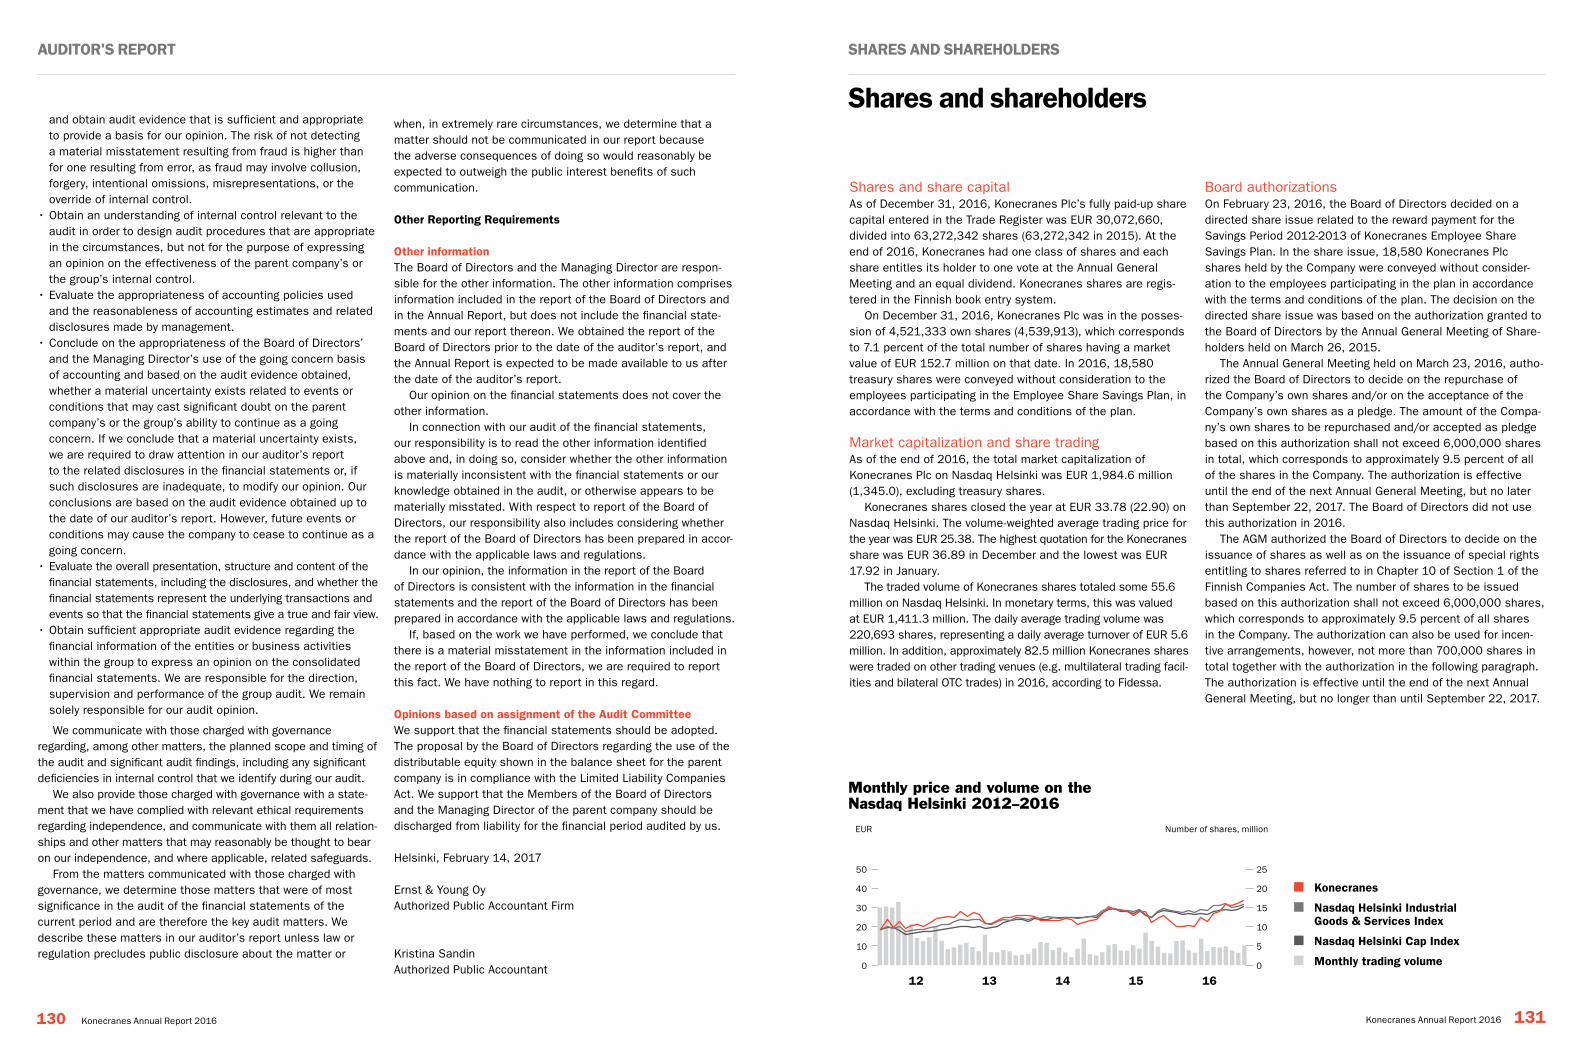
Shares and share capitalAs of December 31, 2016, Konecranes Plc’s fully paid-up share capital entered in the Trade Register was EUR 30,072,660, divided into 63,272,342 shares (63,272,342 in 2015). At the end of 2016, Konecranes had one class of shares and each share entitles its holder to one vote at the Annual General Meeting and an equal dividend. Konecranes shares are regis-tered in the Finnish book entry system.
On December 31, 2016, Konecranes Plc was in the posses-sion of 4,521,333 own shares (4,539,913), which corresponds to 7.1 percent of the total number of shares having a market value of EUR 152.7 million on that date. In 2016, 18,580 treasury shares were conveyed without consideration to the employees participating in the Employee Share Savings Plan, in accordance with the terms and conditions of the plan.
Market capitalization and share tradingAs of the end of 2016, the total market capitalization of Konecranes Plc on Nasdaq Helsinki was EUR 1,984.6 million (1,345.0), excluding treasury shares.
Konecranes shares closed the year at EUR 33.78 (22.90) on Nasdaq Helsinki. The volume-weighted average trading price for the year was EUR 25.38. The highest quotation for the Konecranes share was EUR 36.89 in December and the lowest was EUR 17.92 in January.
The traded volume of Konecranes shares totaled some 55.6 million on Nasdaq Helsinki. In monetary terms, this was valued at EUR 1,411.3 million. The daily average trading volume was 220,693 shares, representing a daily average turnover of EUR 5.6 million. In addition, approximately 82.5 million Konecranes shares were traded on other trading venues (e.g. multilateral trading facil-ities and bilateral OTC trades) in 2016, according to Fidessa.
Board authorizationsOn February 23, 2016, the Board of Directors decided on a directed share issue related to the reward payment for the Savings Period 2012-2013 of Konecranes Employee Share Savings Plan. In the share issue, 18,580 Konecranes Plc shares held by the Company were conveyed without consider-ation to the employees participating in the plan in accordance with the terms and conditions of the plan. The decision on the directed share issue was based on the authorization granted to the Board of Directors by the Annual General Meeting of Share-holders held on March 26, 2015.
The Annual General Meeting held on March 23, 2016, autho-rized the Board of Directors to decide on the repurchase of the Company’s own shares and/or on the acceptance of the Company’s own shares as a pledge. The amount of the Compa-ny’s own shares to be repurchased and/or accepted as pledge based on this authorization shall not exceed 6,000,000 shares in total, which corresponds to approximately 9.5 percent of all of the shares in the Company. The authorization is effective until the end of the next Annual General Meeting, but no later than September 22, 2017. The Board of Directors did not use this authorization in 2016.
The AGM authorized the Board of Directors to decide on the issuance of shares as well as on the issuance of special rights entitling to shares referred to in Chapter 10 of Section 1 of the Finnish Companies Act. The number of shares to be issued based on this authorization shall not exceed 6,000,000 shares, which corresponds to approximately 9.5 percent of all shares in the Company. The authorization can also be used for incen-tive arrangements, however, not more than 700,000 shares in total together with the authorization in the following paragraph. The authorization is effective until the end of the next Annual General Meeting, but no longer than until September 22, 2017.
12 13 14 15 16
50
40
30
20
10
0
25
20
15
10
5
0
Monthly price and volume on the Nasdaq Helsinki 2012–2016
Konecranes
Nasdaq Helsinki Industrial Goods & Services Index
Nasdaq Helsinki Cap Index
Monthly trading volume
EUR Number of shares, million
Shares and shareholdersand obtain audit evidence that is sufficient and appropriate to provide a basis for our opinion. The risk of not detecting a material misstatement resulting from fraud is higher than for one resulting from error, as fraud may involve collusion, forgery, intentional omissions, misrepresentations, or the override of internal control.
• Obtain an understanding of internal control relevant to the audit in order to design audit procedures that are appropriate in the circumstances, but not for the purpose of expressing an opinion on the effectiveness of the parent company’s or the group’s internal control.
• Evaluate the appropriateness of accounting policies used and the reasonableness of accounting estimates and related disclosures made by management.
• Conclude on the appropriateness of the Board of Directors’ and the Managing Director’s use of the going concern basis of accounting and based on the audit evidence obtained, whether a material uncertainty exists related to events or conditions that may cast significant doubt on the parent company’s or the group’s ability to continue as a going concern. If we conclude that a material uncertainty exists, we are required to draw attention in our auditor’s report to the related disclosures in the financial statements or, if such disclosures are inadequate, to modify our opinion. Our conclusions are based on the audit evidence obtained up to the date of our auditor’s report. However, future events or conditions may cause the company to cease to continue as a going concern.
• Evaluate the overall presentation, structure and content of the financial statements, including the disclosures, and whether the financial statements represent the underlying transactions and events so that the financial statements give a true and fair view.
• Obtain sufficient appropriate audit evidence regarding the financial information of the entities or business activities within the group to express an opinion on the consolidated financial statements. We are responsible for the direction, supervision and performance of the group audit. We remain solely responsible for our audit opinion.
We communicate with those charged with governance regarding, among other matters, the planned scope and timing of the audit and significant audit findings, including any significant deficiencies in internal control that we identify during our audit.
We also provide those charged with governance with a state-ment that we have complied with relevant ethical requirements regarding independence, and communicate with them all relation-ships and other matters that may reasonably be thought to bear on our independence, and where applicable, related safeguards.
From the matters communicated with those charged with governance, we determine those matters that were of most significance in the audit of the financial statements of the current period and are therefore the key audit matters. We describe these matters in our auditor’s report unless law or regulation precludes public disclosure about the matter or
when, in extremely rare circumstances, we determine that a matter should not be communicated in our report because the adverse consequences of doing so would reasonably be expected to outweigh the public interest benefits of such communication.
other reporting requirements
other informationThe Board of Directors and the Managing Director are respon-sible for the other information. The other information comprises information included in the report of the Board of Directors and in the Annual Report, but does not include the financial state-ments and our report thereon. We obtained the report of the Board of Directors prior to the date of the auditor’s report, and the Annual Report is expected to be made available to us after the date of the auditor’s report.
Our opinion on the financial statements does not cover the other information.
In connection with our audit of the financial statements, our responsibility is to read the other information identified above and, in doing so, consider whether the other information is materially inconsistent with the financial statements or our knowledge obtained in the audit, or otherwise appears to be materially misstated. With respect to report of the Board of Directors, our responsibility also includes considering whether the report of the Board of Directors has been prepared in accor-dance with the applicable laws and regulations.
In our opinion, the information in the report of the Board of Directors is consistent with the information in the financial statements and the report of the Board of Directors has been prepared in accordance with the applicable laws and regulations.
If, based on the work we have performed, we conclude that there is a material misstatement in the information included in the report of the Board of Directors, we are required to report this fact. We have nothing to report in this regard.
opinions based on assignment of the Audit committeeWe support that the financial statements should be adopted. The proposal by the Board of Directors regarding the use of the distributable equity shown in the balance sheet for the parent company is in compliance with the Limited Liability Companies Act. We support that the Members of the Board of Directors and the Managing Director of the parent company should be discharged from liability for the financial period audited by us.
Helsinki, February 14, 2017
Ernst & Young OyAuthorized Public Accountant Firm
Kristina SandinAuthorized Public Accountant
AUDitor'S rePort SHAreS AnD SHAreHoLDerS
130 Konecranes Annual Report 2016 Konecranes Annual Report 2016 131
However, the authorization for incentive arrangements is valid until March 22, 2021. The Board of Directors did not use this authorization in 2016.
The AGM authorized the Board of Directors to decide on the transfer of the Company’s own shares. The authorization is limited to a maximum of 6,000,000 shares, which corresponds to approximately 9.5 percent of all the shares in the Company. The authorization can also be used for incentive arrangements, however, not more than 700,000 shares in total together with the authorization in the previous paragraph. This authorization is effective until the next Annual General Meeting of Shareholders, but no later than September 22, 2017. However, the authoriza-tion for incentive arrangements is valid until March 22, 2021. The Board of Directors did not use this authorization in 2016.
The AGM authorized the Board of Directors to decide on a directed share issue without payment, needed for the continua-tion of the Share Savings Plan that the Annual General Meeting 2012 decided to launch. The number of new shares to be issued, or own shares held by the Company to be transferred, may in the aggregate amount to a maximum total of 500,000 shares, which corresponds to 0.8 percent of all the Company’s shares. The authorization concerning the share issue is valid until March 22, 2021. The Board of Directors did not use this authorization in 2016.
Based on the authorization granted by the Extraordinary General Meeting held on September 15, 2016, the Board of
changes in the share capital and the number of shares
change in number of shares
total numberof shares
change inshare capital
Share capitaleUr
1999 March 11, Conversion of share capital into EUR 15,000,000 30,000,000
2002 December 20, invalidation of shares held by the company and reduction of share capital -691,370 14,308,630 -1,382,740 28,617,260
2004 New shares subscribed for with the 1997 stock options 1,400 14,310,030 2,800 28,620,060
2005 New shares subscribed for with the 1997, 1999A, 1999B, 2001A, and 2003A stock options
176,000 14,486,030 352,000 28,972,060
2006 pre-split
New shares subscribed for with 1997, 1999B, 2001A, and 2003A stock options 286,700 14,772,730 573,400 29,545,460
2006 March 17, 2006 Share split 1:4 44,318,190 59,090,920 0 29,545,460
2006 post-split
New shares subscribed for with 1997, 1999B, 2001A, 2003A, and 2003B series stock options
986,800 60,077,720 493,400 30,038,860
2007 February, new shares subscribed for with 2003B stock options 67,600 60,145,320 33,800 30,072,660
2007 March–December, new shares subscribed for with 1997, 1999B, 2001A, 2001B, 2003B, and 2003C stock options
833,460 60,978,780 0 30,072,660
2008 February–December, new shares subscribed for with 1997, 1999B, 2001B, 2003B, and 2003C stock options
633,540 61,612,320 0 30,072,660
2009 February–December, new shares subscribed for with 2001B and 2003C stock options 260,600 61,872,920 0 30,072,660
2010 February–May, new shares subscribed for with 2001B stock options 129,200 62,002,120 0 30,072,660
2011 January, share issue directed to the shareholders of KCR Management Oy 281,007 62,283,127 0 30,072,660
2011 February–May, new shares subscribed for with 2007A and 2007B stock options 958,300 63,241,427 0 30,072,660
2012 May–June, new shares subscribed for with 2009A stock options 30,915 63,272,342 0 30,072,660
Directors of Konecranes decided on December 29, 2016, on a directed share issue of 19,600,000 new class B shares to Terex Deutschland GmbH. The shares were issued to Terex as share consideration in addition to the cash consideration payable to Terex for the purchase of Terex's MHPS business under the Stock and Asset Purchase Agreement between Konecranes and Terex dated May 16, 2016.
Stock option plansThe share subscription period for the stock options 2009C ended on April 30, 2016. The stock options 2009C entitled to the subscriptions of a total of 638,500 shares. There were no share subscriptions during the subscription period pursuant to the stock options 2009C.
Performance Share PlansIn 2012 and 2015, the Board of Directors resolved to imple-ment a performance share plan according to which earning reward is based on attainment of targets determined by the Board of Directors. The performance criterion for the discre-tionary periods 2014–2016 and 2015–2017 is the cumulative Earnings per Share (EPS) excluding restructuring costs for the respective years. The target group of the plans consists of approximately 190 people. The rewards to be paid on the basis of each discretionary period correspond to the value of an approximate maximum of 700,000 Konecranes Plc shares,
which corresponds to 1.1 percent of all of the Company’s shares. If the targets determined by the Board of Directors are attained, the reward payout may be a half of the maximum reward. The maximum reward payout requires that the targets are clearly exceeded.
In 2016, the Board resolved to establish a new share-based incentive plan directed to the Group’s key employees. The long-term incentive plan consists of one discretionary period, calendar year 2016. Approximately 200 key employees, including the members of the Group Executive Board and Senior Management, belong to the target group of the plan. The poten-tial reward from the plan will be based on the continuation of a key employee's employment or service and on the Konecranes Group’s adjusted EBITDA. The rewards to be paid on the basis of the plan correspond to an approximate maximum total of 700,000 Konecranes Plc shares, including the proportion to be paid in cash. The potential reward from the plan will be paid partly in Konecranes shares and partly in cash after the discre-tionary period, by the end of August 2017. The shares paid as reward may not be transferred during a restriction period estab-lished for the shares. The restriction period shall begin from the payment of the reward and end on December 31, 2018. The members of the Group Executive Board and Senior Manage-ment must retain 50 percent of net shares received on the basis of the plan until such members' share ownership equals his or her annual gross base salary. Such number of shares must be held as long as such member's employment or service at Konecranes continues.
For a more detailed description of the performance share plan, see Note 29 on Page 102 of the Financial Statements.
Employee Share Savings PlanKonecranes Plc’s AGM 2012 approved the Konecranes Employee Share Savings Plan. The second plan period began on July 1, 2013 and ended on June 30, 2014. Each participant will receive one free matching share for every two acquired savings shares. Matching shares will be delivered to a participant if the participant holds the acquired shares from the plan period until the end of the designated holding period, February 15, 2017, and if his or her employment has not ended before this date for the reasons related to the employee. Approximately 1,338 Konecranes employees signed up for the plan that commenced on July 1, 2013. The number of new shares to be issued or own shares held by the Company to be transferred under the terms and conditions of the plan may be a maximum total of 42,189 shares, which corresponds to 0.1 percent of all of the Compa-ny’s shares.
The third plan period began on July 1, 2014 and ended on June 30, 2015. Each participant will receive one free matching share for every two acquired savings shares. Matching shares
will be delivered to a participant if the participant holds the acquired shares from the plan period until the end of the designated holding period, 15 February 2018, and if his or her employment has not ended before this date for reasons related to the employee. Approximately 1,286 Konecranes employees signed up for the plan that commenced on July 1, 2014. The number of new shares to be issued or own shares held by the Company to be transferred under the terms and conditions of the plan may be a maximum total of 38,543 shares, which corresponds to 0.1 percent of all of the Company’s shares.
The fourth plan period began on July 1, 2015 and ended on June 30, 2016. Each participant will receive one free matching share for every two acquired savings shares. Matching shares will be delivered to a participant if the participant holds the acquired shares from the plan period until the end of the designated holding period, February 15, 2019, and if his or her employment has not ended before this date for reasons attributable to the employee. Approximately 1,345 Konecranes employees signed up for the Plan Period that commenced on July 1, 2015. The number of new shares to be issued or own shares held by the Company to be transferred under the terms and conditions of the plan may be a maximum total of 50,330 shares, which corresponds to 0.1 percent of all the Company’s shares.
The fifth plan period began on September 1, 2016 and end on June 30, 2017. The maximum savings amount per partic-ipant during one month is 5 percent of gross salary and the minimum is EUR 50. Each participant will receive one free matching share for every two acquired savings shares. Matching shares will be delivered to a participant if the participant holds the acquired shares from the plan period until the end of the designated holding period, February 15, 2020, and if his or her employment has not ended before this date for reasons related to the employee. The total amount of all savings of the commencing plan period may not exceed EUR 8.5 million. Approximately 1,300 Konecranes employees signed up for the plan period that commenced on September 1, 2016.
For a more detailed description of the employee share savings plan, see Note 29 on Page 103 of the Financial Statements.
Flagging notificationsOn February 23, 2016, Konecranes received a disclosure under Chapter 9, Section 5 of the Securities Market Act, according to which the holding of Sanderson Asset Management LLP in Konecranes Plc has decreased below 5 percent. Sanderson Asset Management LLP held 3,161,739 Konecranes Plc’s shares on February 22, 2016, which is 4.99 percent of Konecranes Plc’s shares and votes.
On July 25, 2016, Konecranes received a disclosure under Chapter 9, Section 5 of the Securities Market Act, according
SHAreS AnD SHAreHoLDerS SHAreS AnD SHAreHoLDerS
132 Konecranes Annual Report 2016 Konecranes Annual Report 2016 133
Largest shareholders on December 31, 2016number of shares
and votes% of shares and
votes
1 HTT KCR Holding Oy Ab 6,870,568 10.9%
2 Gustavson Stig and family* 2,078,013 3.3%
3 Varma Mutual Pension Insurance Company 1,190,275 1.9%
4 The Local Government Pensions Institution, Keva 598,542 0.9%
5 Samfundet Folkhälsan i Svensk-Finland 535,600 0.8%
6 The State Pension Fund 480,000 0.8%
7 Sigrid Jusélius Foundation 446,500 0.7%
8 Evli Funds 349,986 0.6%
9 Ilmarinen Mutual Pension Insurance Company 326,603 0.5%
10 Etera Mutual Pension Insurance Company 250,766 0.4%
ten largest registered shareholders' total ownership 13,126,853 20.7%
Nominee registered shares 33,683,855 53.2%
Other shareholders 11,940,301 18.9%
Shares held by Konecranes Plc 4,521,333 7.1%
total 63,272,342 100.0%
to which the holding of Harris Associates Investment Trust (Oakmark International Small Cap Fund) in Konecranes Plc has decreased below 5 percent. Harris Associates Investment Trust (Oakmark International Small Cap Fund) held 3,106,800 Konecranes Plc’s shares on July 22, 2016, which is 4.91 percent of Konecranes Plc’s shares and votes.
On August 17, 2016, Konecranes received a disclosure under Chapter 9, Section 5 of the Securities Market Act, according to which the holding of Sanderson Asset Management LLP in Konecranes Plc has exceeded 5 percent. Sanderson Asset Management LLP held 3,230,546 Konecranes Plc’s shares on August 16, 2016, which is 5.11 percent of Konecranes Plc’s shares and votes.
On September 9, 2016, Konecranes received a notifica-tion under Chapter 9, Section 5 of the Securities Market Act, according to which the total holding of BlackRock, Inc. in Konecranes Plc’s shares and votes has exceeded 5 percent. On September 8, 2016, Blackrock Inc.’s total holding through shares and financials instruments amounted to 5.05 percent of Konecranes Plc’s shares and votes.
On October 5, 2016, Konecranes received a disclosure under Chapter 9, Section 5 of the Securities Market Act, according to
which the holding of Harris Associates L.P. in Konecranes Plc has decreased below 5 percent. Harris Associates L.P. held 3,152,800 Konecranes Plc’s shares on October 4, 2016, which is 4.98 percent of Konecranes Plc’s shares and votes.
ShareholdersKonecranes had 19,523 (19,915) shareholders on December 31, 2016. At year-end 2016, 53.2 (48.7) percent of the Compa-ny’s shares were nominee registered. More information on the breakdown of share ownership and board and management interests can be found in the Shares and Shareholders section on page 135.
Konecranes Plc share trading information• Date of listing on Nasdaq Helsinki: March 27, 1996• Segment: Large Cap• ICB classification: Industrials, Industrial Goods & Services,
Industrial Engineering, Commercial Vehicles & Trucks 2753• ISIN code: FI0009005870• Trading code: KCR
Shares and options owned by the members of the Board and of Directors and of the group executive Board on December 31, 2016
change in shareholding in 2016
number of shares owned
% of shares and votes
Board of Directors * -16,392 38,635 0.1%
Group Executive Board 26,420 170,937 0.3%
total 10,028 209,572 0.3%
* On December 28, 2011 Konecranses Plc received information according to which the Chairman of the company’s Board of Directors Stig Gustavson had donated all of his shares in Konecranes Plc to his near relatives retaining himself for life the voting rights and right to dividend attached to the donated shares. The donation encompassed in total 2,069,778 shares.
Breakdown of share ownership by number of shares owned on December 31, 2016
Shares number of shareholders % of shareholdersnumber of shares
and votes % of shares and votes
1–100 9,267 47.5% 473,342 0.7%
101–1 000 8,901 45.6% 3,043,168 4.8%
1 001–10 000 1,194 6.1% 3,232,407 5.1%
10 001–100 000 129 0.7% 3,908,063 6.2%
100 001–1 000 000 17 0.1% 4,279,553 6.8%
Over 1,000,001 5 0.0% 14,651,954 23.2%
registered shareholders total 19,513 99.9% 29,588,487 46.8%
Nominee registered shares 10 0.1% 33,683,855 53.2%
total 19,523 100.0% 63,272,342 100.0%
Breakdown of share ownership by shareholder category on December 31, 2016% of shares and votes
Private companies 20.2%
Financial and insurance institutions 2.3%
Public sector organizations 4.7%
Households 13.7%
Non-profit organizations 5.0%
Foreigners 0.7%
Nominee registered shares 53.2%
total 100.0%
Source: Euroclear Finland Oy, December 31, 2016.
SHAreS AnD SHAreHoLDerS SHAreS AnD SHAreHoLDerS
134 Konecranes Annual Report 2016 Konecranes Annual Report 2016 135
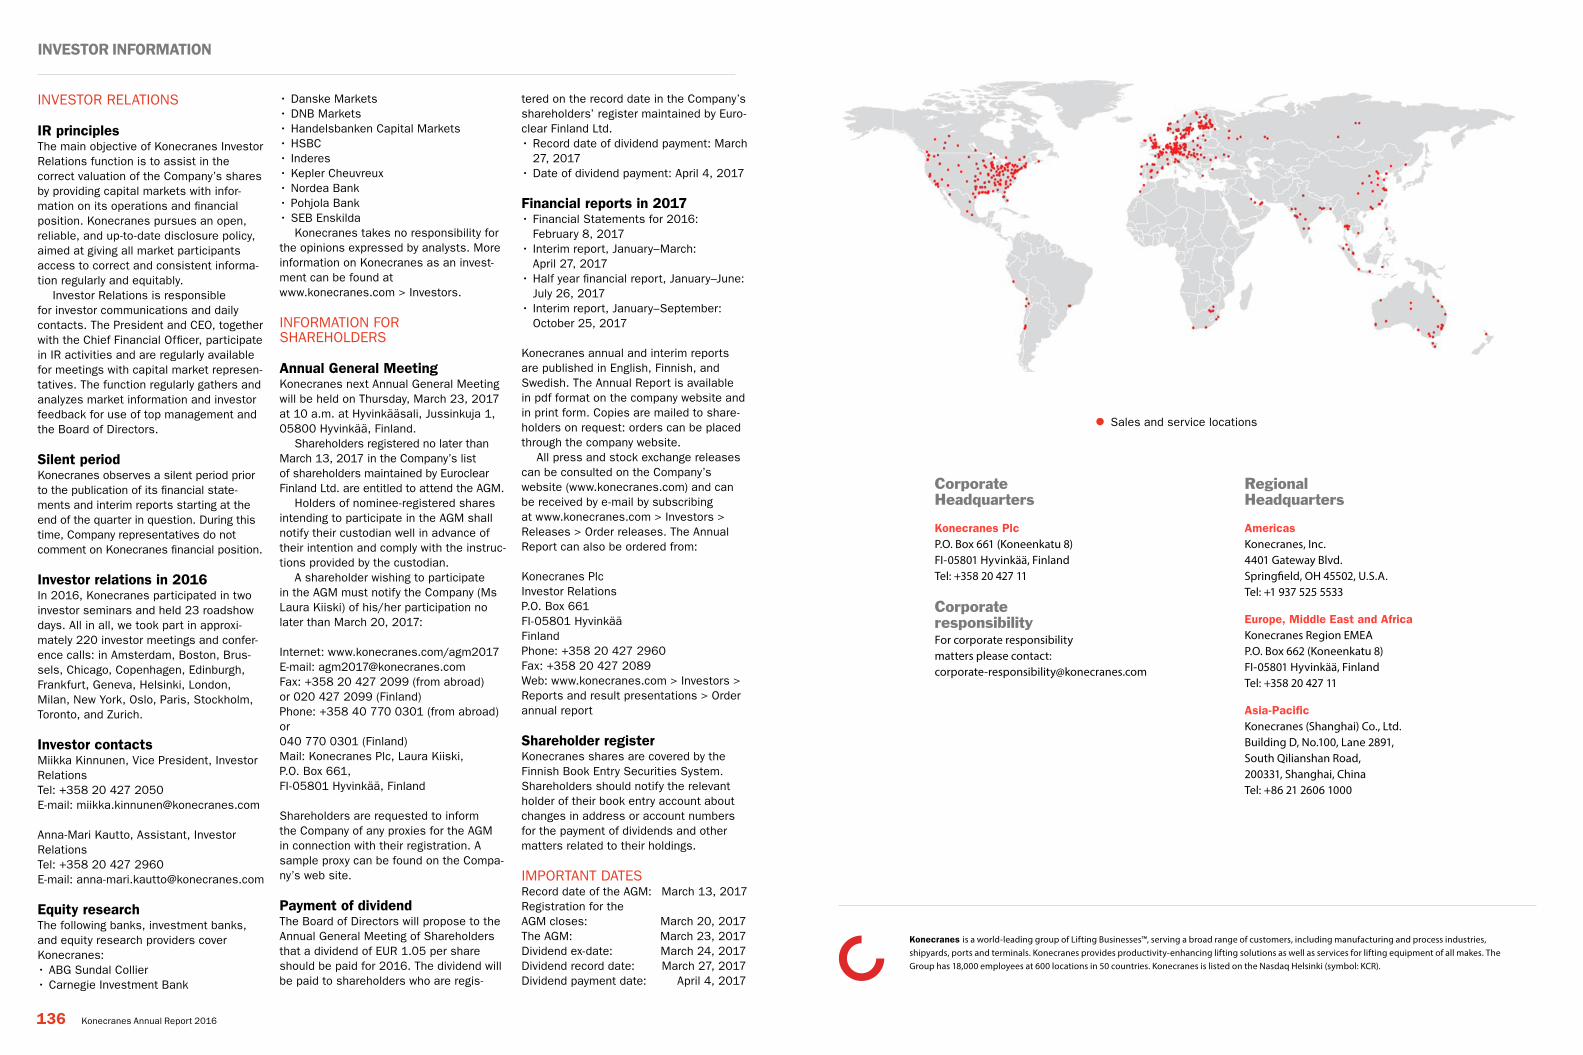
INVESTOR RELATIONS
ir principlesThe main objective of Konecranes Investor Relations function is to assist in the correct valuation of the Company’s shares by providing capital markets with infor-mation on its operations and financial position. Konecranes pursues an open, reliable, and up-to-date disclosure policy, aimed at giving all market participants access to correct and consistent informa-tion regularly and equitably.
Investor Relations is responsible for investor communications and daily contacts. The President and CEO, together with the Chief Financial Officer, participate in IR activities and are regularly available for meetings with capital market represen-tatives. The function regularly gathers and analyzes market information and investor feedback for use of top management and the Board of Directors.
Silent periodKonecranes observes a silent period prior to the publication of its financial state-ments and interim reports starting at the end of the quarter in question. During this time, Company representatives do not comment on Konecranes financial position.
investor relations in 2016In 2016, Konecranes participated in two investor seminars and held 23 roadshow days. All in all, we took part in approxi-mately 220 investor meetings and confer-ence calls: in Amsterdam, Boston, Brus-sels, Chicago, Copenhagen, Edinburgh, Frankfurt, Geneva, Helsinki, London, Milan, New York, Oslo, Paris, Stockholm, Toronto, and Zurich.
investor contactsMiikka Kinnunen, Vice President, Investor RelationsTel: +358 20 427 2050E-mail: [email protected]
Anna-Mari Kautto, Assistant, Investor RelationsTel: +358 20 427 2960E-mail: [email protected]
equity researchThe following banks, investment banks, and equity research providers cover Konecranes:• ABG Sundal Collier• Carnegie Investment Bank
• Danske Markets• DNB Markets• Handelsbanken Capital Markets• HSBC• Inderes• Kepler Cheuvreux• Nordea Bank• Pohjola Bank• SEB Enskilda
Konecranes takes no responsibility for the opinions expressed by analysts. More information on Konecranes as an invest-ment can be found at www.konecranes.com > Investors.
INFORMATION FOR SHAREHOLDERS
Annual general MeetingKonecranes next Annual General Meeting will be held on Thursday, March 23, 2017 at 10 a.m. at Hyvinkääsali, Jussinkuja 1, 05800 Hyvinkää, Finland.
Shareholders registered no later than March 13, 2017 in the Company’s list of shareholders maintained by Euroclear Finland Ltd. are entitled to attend the AGM.
Holders of nominee-registered shares intending to participate in the AGM shall notify their custodian well in advance of their intention and comply with the instruc-tions provided by the custodian.
A shareholder wishing to participate in the AGM must notify the Company (Ms Laura Kiiski) of his/her participation no later than March 20, 2017:
Internet: www.konecranes.com/agm2017E-mail: [email protected]: +358 20 427 2099 (from abroad)or 020 427 2099 (Finland)Phone: +358 40 770 0301 (from abroad) or040 770 0301 (Finland)Mail: Konecranes Plc, Laura Kiiski, P.O. Box 661,FI-05801 Hyvinkää, Finland
Shareholders are requested to inform the Company of any proxies for the AGM in connection with their registration. A sample proxy can be found on the Compa-ny’s web site.
Payment of dividendThe Board of Directors will propose to the Annual General Meeting of Shareholders that a dividend of EUR 1.05 per share should be paid for 2016. The dividend will be paid to shareholders who are regis-
tered on the record date in the Company’s shareholders’ register maintained by Euro-clear Finland Ltd.• Record date of dividend payment: March
27, 2017• Date of dividend payment: April 4, 2017
Financial reports in 2017• Financial Statements for 2016:
February 8, 2017• Interim report, January–March:
April 27, 2017• Half year financial report, January–June:
July 26, 2017• Interim report, January–September:
October 25, 2017
Konecranes annual and interim reports are published in English, Finnish, and Swedish. The Annual Report is available in pdf format on the company website and in print form. Copies are mailed to share-holders on request: orders can be placed through the company website.
All press and stock exchange releases can be consulted on the Company’s website (www.konecranes.com) and can be received by e-mail by subscribing at www.konecranes.com > Investors > Releases > Order releases. The Annual Report can also be ordered from:
Konecranes PlcInvestor RelationsP.O. Box 661FI-05801 HyvinkääFinlandPhone: +358 20 427 2960Fax: +358 20 427 2089Web: www.konecranes.com > Investors > Reports and result presentations > Order annual report
Shareholder registerKonecranes shares are covered by the Finnish Book Entry Securities System. Shareholders should notify the relevant holder of their book entry account about changes in address or account numbers for the payment of dividends and other matters related to their holdings.
IMPORTANT DATESRecord date of the AGM: March 13, 2017Registration for the AGM closes: March 20, 2017The AGM: March 23, 2017Dividend ex-date: March 24, 2017Dividend record date: March 27, 2017Dividend payment date: April 4, 2017
inVeStor inForMAtion
136 Konecranes Annual Report 2016
Konecranes is a world-leading group of Lifting Businesses™, serving a broad range of customers, including manufacturing and process industries, shipyards, ports and terminals. Konecranes provides productivity-enhancing lifting solutions as well as services for lifting equipment of all makes. The Group has 18,000 employees at 600 locations in 50 countries. Konecranes is listed on the Nasdaq Helsinki (symbol: KCR).
Regional Headquarters
AmericasKonecranes, Inc.4401 Gateway Blvd.Springfield, OH 45502, U.S.A.Tel: +1 937 525 5533
Europe, Middle East and AfricaKonecranes Region EMEAP.O. Box 662 (Koneenkatu 8)FI-05801 Hyvinkää, FinlandTel: +358 20 427 11
Asia-PacificKonecranes (Shanghai) Co., Ltd.Building D, No.100, Lane 2891, South Qilianshan Road, 200331, Shanghai, China Tel: +86 21 2606 1000
Corporate Headquarters
Konecranes PlcP.O. Box 661 (Koneenkatu 8) FI-05801 Hyvinkää, Finland Tel: +358 20 427 11
Corporate responsibilityFor corporate responsibility matters please contact: [email protected]
Sales and service locations
"Change always brings opportunities, Konecranes’ business transformation is now more fully realized than ever."
Panu Routila, President and CEO