KONE Q3 2018 · 2 Q3 2018 KONE’s January–September 2018 review: Orders received and sales grew...
36
Interim Report for January–September KONE Q3 2018
Transcript of KONE Q3 2018 · 2 Q3 2018 KONE’s January–September 2018 review: Orders received and sales grew...

Interim Report for January–September
KONE Q3 2018

Q3 20182
KONE’s January–September 2018 review: Orders received and sales grew in all regions, increasing costs burdened profitability
July–September 2018 Orders received grew by 5.3% to EUR 1,832 (7–9/2017: 1,739) million. At comparable exchange rates, orders
grew by 7.3%.
Sales grew by 3.6% to EUR 2,289 (2,210) million. At comparable exchange rates, sales grew by 5.6%.
Operating income (EBIT) was EUR 258.0 (317.9) million or 11.3% (14.4%) of sales. The adjusted EBIT was EUR 273.7 (321.3) million or 12.0% (14.5%) of sales.*
Cash flow from operations (before financing items and taxes) was EUR 273.3 (302.7) million.
January–September 2018 Orders received grew by 2.6% to EUR 5,859 (1–9/2017: 5,708) million. At comparable exchange rates, orders
grew by 6.8%.
Sales grew by 2.1% to EUR 6,627 (6,490) million. At comparable exchange rates, sales grew by 6.2%.
Operating income (EBIT) was EUR 750.0 (899.5) million or 11.3% (13.9%) of sales. The adjusted EBIT was EUR 792.5 (902.9) million or 12.0% (13.9%) of sales.*
Cash flow from operations (before financing items and taxes) was EUR 818.5 (928.4) million.
KONE has adopted the new IFRS 15 and IFRS 9 effective January 1, 2018. In this Interim Report all 2017 financials are restated applying the standards retrospectively. More information on pages 30–35.
Business outlook for 2018 (specified)
In 2018, KONE’s sales is estimated to grow by 4–7% (previously 3–7%) at comparable exchange rates as com-pared to the restated 2017 sales. The adjusted EBIT is expected to be in the range of EUR 1,100–1,150 (previously 1,100–1,200) million, assuming that foreign exchange rates would remain at the end of September 2018 level for the remainder of the year. Foreign exchange rates are estimated to impact EBIT negatively by approximately EUR 45 (previously 35) million. The pressure on the adjusted EBIT margin is expected to start to ease towards the end of 2018 as a result of pricing and productivity actions that have been taken.
KEY FIGURES 7–9/2018 7–9/2017 Change 1–9/2018 1–9/2017 Change 1–12/2017Orders received MEUR 1,831.9 1,739.0 5.3% 5,859.1 5,708.2 2.6% 7,554.0Order book MEUR 7,791.6 7,473.5 4.3% 7,791.6 7,473.5 4.3% 7,357.8Sales MEUR 2,288.7 2,209.7 3.6% 6,627.3 6,490.3 2.1% 8,796.7Operating income (EBIT) MEUR 258.0 317.9 -18.9% 750.0 899.5 -16.6% 1,192.3Operating income margin (EBIT margin) % 11.3 14.4 11.3 13.9 13.6Adjusted EBIT* MEUR 273.7 321.3 -14.8% 792.5 902.9 -12.2% 1,205.5Adjusted EBIT margin* % 12.0 14.5 12.0 13.9 13.7Income before tax MEUR 271.9 330.2 -17.7% 786.0 948.5 -17.1% 1,250.4Net income MEUR 217.2 253.6 -14.4% 613.1 728.4 -15.8% 960.2Basic earnings per share EUR 0.42 0.49 -14.7% 1.19 1.41 -16.0% 1.86Cash flow from operations (before financing items and taxes) MEUR 273.3 302.7 818.5 928.4 1,263.3Interest-bearing net debt MEUR -1,425.5 -1,464.9 -1,425.5 -1,464.9 -1,690.2Equity ratio % 47.8 47.7 47.8 47.7 50.0Return on equity % 28.0 33.9 28.0 33.9 32.1Net working capital (including financing items and taxes) MEUR -719.0 -782.2 -719.0 -782.2 -772.6Gearing % -50.8 -52.5 -50.8 -52.5 -55.8
* In September 2017, KONE introduced a new alternative performance measure, adjusted EBIT, to enhance comparability of the business performance between reporting periods during the Accelerate program. Restructuring costs related to the Accelerate program are excluded from the calculation of the adjusted EBIT.

3Q3 2018
Henrik Ehrnrooth, President and CEO:
“Our performance was mixed in the third quarter. I am very pleased with the continued brisk growth in our orders received with stabilized margins. Also, our service business continued its consistent good growth path. However, the development of our adjusted EBIT margin was clearly unsatisfactory. As we had expected, our profitability continued to be burdened by several factors, such as the intense price competition over the past years and increased costs. Recent geopolitical tensions also had a negative impact on our result. We are seeing good momentum for our new services and solutions. The key to improving growth and profitability is further differentiation. Our digital services and solutions are central to driving differentiation in both our services as well as our new equipment business. We are seeing strong customer interest for these and feedback from early adopters is very positive.
The Accelerate program will help compensate for the headwinds in our markets. The Accelerate program that was launched to speed-up the execution of our strategy is also progressing and we expect to start seeing clear benefits from it in 2019. The benefits include further improvement in customer service capability, faster introduction of new services and solutions for our customers globally as well as improved cost efficiency. We have specified our outlook in connection to the Q3 results. We now expect sales to grow by 4–7% at comparable exchange rates and the adjusted EBIT to be in the range of EUR 1,100 to 1,150 million. After seeing clear decline in our adjusted EBIT margin for the first three quarters, in the final quarter we expect the margin to be close to the level of the comparison period or slightly higher, as implied by our business outlook. Despite the increased uncertainty in many markets, we continue to see good opportunities for growth both in new equipment and in services also in the coming years. I’m confident that differentiation will help us capture the opportunities, and that the actions we are taking will improve our profitability.“

Q3 20184
Key Figures
Sales (MEUR)
Orders received (MEUR) In July–September 2018, orders received grew by 5.3% (7.3% at comparable exchange rates).
Orders received grew in all regions and all businesses.
At comparable rates, new equipment orders received grew clearly with clear growth in the volume business and significant growth in major projects. In modernization, orders received grew slightly. Volume business grew clearly while major projects declined significantly.
Margin of orders received was stable.
– – –
In January–September 2018, orders received grew by 2.6% (6.8% at comparable exchange rates).
In July–September 2018, sales grew by 3.6% (5.6% at compa-rable exchange rates).
New equipment sales grew by 2.8% (5.4% at comparable exchange rates). Service (maintenance and modernization) sales grew by 4.5% (5.9% at comparable rates), with maintenance sales growing by 3.6% (4.9% at comparable rates) and moderni-zation sales growing by 6.6% (8.1% at comparable rates).
Sales in the EMEA region grew by 0.3% (2.4% at comparable rates). In the Americas region, sales grew by 6.3% (6.7% at comparable rates). In the Asia-Pacific region, sales grew by 5.6% (8.2% at comparable rates).
– – –
In January–September 2018, sales grew by 2.1% (6.2% at com-parable exchange rates).
Sales by businessSales by region
EMEA 42% (40%) Americas 20% (21%) Asia-Pacific 38% (39%)
1–9/2018 (1–9/2017)
New equipment 53% (53%) Maintenance 33% (33%) Modernization 14% (14%)
1–9/2018 (1–9/2017)
10,000
8,000
6,000
4,000
2,000
0
10,000
8,000
6,000
4,000
2,000
0
*) 2016 not restated with IFRS 15 and IFRS 9 changes
7,621 7,554
1,739
8,784 8,797
2,210
6,627
2,289
5,859
1,832
1–9/201820172016
1–9/201820172016*
Q3 Q3
Q3 Q3

5Q3 2018
2) Cash flow from operations before financing items and taxes
1) Including financing items and taxes
Net working capital1 (MEUR)
Adjusted EBIT (MEUR)
Cash flow2 (MEUR)
In July–September 2018, operating income was 11.3% of sales (7–9/2017: 14.4%). The adjusted EBIT margin was 12.0%.
Profitability was burdened by price competition seen in earlier years as well as increasing costs. Increased geopolitical uncer-tainty also had a negative impact on the result. The headwinds were partly compensated by productivity improvements and focused pricing actions.
Translation exchange rates had a negative impact of EUR 11 mil-lion on the operating income.
Restructuring costs related to the Accelerate program were EUR 15.7 million and are excluded from the calculation of the adjusted EBIT.
– – –
In January–September 2018, operating income was 11.3% of sales (1–9/2017: 13.9%). The adjusted EBIT margin was 12.0%.
At the end of September 2018, net working capital was slightly less negative than at the beginning of the year.
Around EUR 45 million of the change in net working capital com-pared to the end of September 2017 resulted from changes in foreign exchange rates.
In July–September 2018, cash flow declined from the compari-son period driven by the decline in the operating income.
– – –
In January–September 2018, cash flow declined from the com-parison period, mainly driven by the decline in the operating income.
1,750
1,500
1,250
1,000
750
500
250
0
0
-200
-400
-600
-800
-1,000
1,500
1,250
1,000
750
500
250
0
1,509
1,263
*) 2016 not restated with IFRS 15 and IFRS 9 changes
1,2931,206
1,509
1,263
1–9/201820172016*
9/201820179/2017
1–9/201820172016
273303
Q3
Q3
-719-773
321274
792
818
-782
Q3
Q3

Q3 20186
KONE’s January–September 2018 review
KONE’s operating environment
Operating environment by region
New equipment market in units Maintenance market Modernization market
7–9/2018 1–9/2018 7–9/2018 1–9/2018 7–9/2018 1–9/2018
Total market + + + + + +
EMEA Stable + + + Stable Stable
Central and North Europe Stable Stable + + Stable Stable
South Europe + + + + – Stable
Middle East – + ++ ++ Stable +
North America + + + + + +
Asia-Pacific + + ++ ++ ++ +++China + + ++ ++ +++ +++
– – – Significant decline (>10%), – – Clear decline (5–10%), – Slight decline (<5%), Stable, + Slight growth (<5%), ++ Clear growth (5–10%), +++ Significant growth (>10%)

7Q3 2018
January–September 2018The global new equipment market grew slightly in units compared to January–September 2017. In Asia-Pacific, the new equipment market grew slightly. In China, the new equipment market grew slightly. In the rest of Asia-Pacific, the new equipment markets grew slightly driven by the Indian market in particular. In the EMEA region, the new equipment market grew slightly. New equipment market in Central and North Europe was rather stable at a high level, while in South Europe, the market continued to see slight growth from a low level. In the Middle East, the market grew in the first half of the year, but declined in the third quarter due to increased uncertainty across the region. In North America, the new equipment market continued to grow slightly from a high level.
Global service markets continued to develop posi-tively. Both the maintenance and the modernization mar-kets continued to see growth across the regions, with the strongest rate of growth seen in Asia-Pacific and a more moderate development in Europe and North America.
Pricing trends remained varied during January–Sep-tember. In China, competition remained intense but pricing was rather stable in the new equipment market. In the EMEA region, the pricing environment continued to be characterized by strong competition, particularly in South Europe and the Middle East, while maintenance pricing improved slightly in Central and North Europe. In North America, pricing environment continued to be more favorable than in the other regions.
July–September 2018The global new equipment market grew slightly in units compared to the third quarter of 2017. In Asia-Pacific, the new equipment market grew slightly. In China, the new equipment market grew slightly with residential and infrastructure segments developing bet-ter than the commercial segment. Government restric-tions across city tiers continued to have a cooling effect on the overall markets. In the rest of Asia-Pacific, the new equipment markets grew slightly with clear varia-tion between countries. In the EMEA region, the new equipment market was rather stable. The new equip-ment market in Central and North Europe was rather stable at a high level, while in South Europe, the market continued to see slight growth from a low level. In the Middle East, the market declined due to increased mar-ket uncertainty across the region. In North America, the new equipment market continued to grow slightly from a high level.
Global service markets continued to develop posi-tively. Both the maintenance and the modernization markets continued to see growth across the regions, with the strongest rate of growth seen in Asia-Pacific and a more moderate development in Europe and North America.
Pricing trends remained varied during July–Septem-ber. Across the regions, cost increases, both for mate-rial and labor, were more pronounced driving a need to further increase prices. In China, competition remained intense but pricing was rather stable in the new equip-ment market. In the EMEA region, the pricing environ-ment continued to be characterized by strong competi-tion, particularly in South Europe and the Middle East. In North America, the overall positive development in pricing continued despite increased competition in some segments.

Q3 20188
Orders received and order book
Orders received
MEUR 7–9/2018 7–9/2017 ChangeComparable
change1) 1–9/2018 1–9/2017 ChangeComparable
change1) 1–12/2017Orders received 1,831.9 1,739.0 5.3% 7.3% 5,859.1 5,708.2 2.6% 6.8% 7,554.0
1) Change at comparable foreign exchange rates
Orders received consist predominantly of new equipment and modernization orders. Maintenance contracts are not included in orders received, but the figure includes orders related to the maintenance business, such as repairs.
July–September 2018Orders received grew by 5.3% as compared to July–September 2017 and totaled EUR 1,832 million. At comparable exchange rates, KONE’s orders received grew by 7.3%.
At comparable rates, new equipment orders received grew clearly with clear growth in the volume business and significant growth in major projects. In modernization, orders received grew slightly. Volume business grew clearly while major proj-ects declined significantly.
The relative margin of orders received was stable compared to the comparison period. We have taken focused pricing actions and continued to make progress in improving produc-tivity to compensate for the cost pressures.
Orders received in the EMEA region grew significantly at comparable exchange rates as compared to July–September 2017. New equipment orders in the region grew significantly driven by growth in Northern Europe. In the Middle East, orders received declined significantly. Modernization orders received were relatively stable.
In the Americas region, orders received saw slight growth at comparable rates as compared to July–September 2017. Modernization orders grew significantly, while new equipment orders declined slightly.
Orders received in the Asia-Pacific region grew clearly at comparable rates as compared to July–September 2017. In China, new equipment orders grew clearly in units and sig-nificantly in monetary value. Like-for-like prices were slightly higher than in the comparison period and increased also slightly from previous quarters. Mix was slightly negative. In the rest of Asia-Pacific, new equipment orders received were stable with a significant decline in Australia and a significant growth in Southeast Asia. Modernization orders received declined significantly in the rest of Asia-Pacific.
January–September 2018Orders received grew by 2.6% as compared to Janu-ary–September 2017 and totaled EUR 5,859 million. At comparable exchange rates, KONE’s orders received grew by 6.8%
At comparable rates, new equipment orders grew clearly with clear growth in both the volume business and in major projects. Also in modernization, orders received grew clearly with clear growth in both volume business and in major projects.
The relative margin of orders received was stable compared to the comparison period. We have taken focused pricing actions and continued to make progress in improving productivity to compensate for the cost pressures.
Orders received in the EMEA region grew clearly at comparable exchange rates as compared to January–September 2017. The significant growth in new equip-ment orders was driven by positive development in Europe. Modernization orders in the region grew clearly.
In the Americas region, orders received saw slight growth at comparable rates as compared to January–September 2017. Modernization orders grew clearly, and new equipment orders grew slightly in the region.
Orders received in the Asia-Pacific region grew clearly at comparable rates as compared to January–September 2017. In China, new equipment orders grew clearly in units and in monetary value. Like-for-like prices were slightly higher than in the comparison period while mix was slightly negative. In the rest of Asia-Pacific, new equipment orders received grew clearly and moderniza-tion orders grew slightly.
Terminology: Slight <5%, clear 5–10%, significant >10%

9Q3 2018
Order book
MEUR Sep 30, 2018 Sep 30, 2017 ChangeComparable
change1) Dec 31, 2017
Order book 7,791.6 7,473.5 4.3% 5.5% 7,357.8
1) Change at comparable foreign exchange rates
The order book grew slightly compared to the end of September 2017 and stood at a strong level of EUR 7,792 million at the end of the reporting period.
The order book margin remained at a healthy level. Cancellations of orders remained at a very low level.

Q3 201810
Sales
By region
MEUR 7–9/2018 7–9/2017 ChangeComparable
change1) 1–9/2018 1–9/2017 ChangeComparable
change1) 1–12/2017EMEA 899.6 896.7 0.3% 2.4% 2,758.6 2,589.0 6.6% 9.1% 3,594.5Americas 458.3 431.3 6.3% 6.7% 1,326.1 1,345.5 -1.4% 5.5% 1,778.5Asia-Pacific 930.8 881.8 5.6% 8.2% 2,542.6 2,555.9 -0.5% 3.5% 3,423.7Total 2,288.7 2,209.7 3.6% 5.6% 6,627.3 6,490.3 2.1% 6.2% 8,796.7
1) Change at comparable foreign exchange rates
By business
MEUR 7–9/2018 7–9/2017 ChangeComparable
change1) 1–9/2018 1–9/2017 ChangeComparable
change1) 1–12/2017New equipment 1,241.7 1,207.6 2.8% 5.4% 3,512.3 3,446.3 1.9% 6.3% 4,653.9Services 1,047.1 1,002.1 4.5% 5.9% 3,115.1 3,044.0 2.3% 6.0% 4,142.8
Maintenance 731.4 705.9 3.6% 4.9% 2,189.1 2,143.3 2.1% 5.6% 2,887.3Modernization 315.7 296.2 6.6% 8.1% 925.9 900.7 2.8% 7.0% 1,255.6
Total 2,288.7 2,209.7 3.6% 5.6% 6,627.3 6,490.3 2.1% 6.2% 8,796.7
1) Change at comparable foreign exchange rates
July–September 2018KONE’s sales grew by 3.6% as compared to July–Septem-ber 2017, and totaled EUR 2,289 million. At comparable exchange rates, KONE’s sales grew by 5.6%.
Sales in the EMEA region grew by 0.3% and totaled EUR 899.6 million. At comparable exchange rates, the growth was 2.4%. New equipment and maintenance sales grew slightly, while modernization sales were stable in the region.
In the Americas, sales grew by 6.3% and totaled EUR 458.3 million. At comparable exchange rates, sales grew by 6.7%. The development in the region was positive in all businesses, with the fastest growth in modernization.
In Asia-Pacific, sales grew by 5.6% and totaled EUR 930.8 million. At comparable exchange rates, sales grew by 8.2%. New equipment sales grew clearly with growth across the region, except in Southeast Asia, where new equipment sales declined slightly. In maintenance and modernization sales grew significantly.
January–September 2018KONE’s sales grew 2.1% as compared to January–Sep-tember 2017, and totaled EUR 6,627 million. At com-parable exchange rates, KONE’s sales grew by 6.2%.
Sales in the EMEA region grew by 6.6% and totaled EUR 2,759 million. At comparable exchange rates, the growth was 9.1%. New equipment sales grew significantly, and maintenance and moderniza-tion sales grew slightly in the region.
In the Americas, sales declined by 1.4% and totaled EUR 1,326 million. At comparable exchange rates, sales grew by 5.5%. New equipment and main-tenance sales grew slightly, and modernization sales grew significantly.
In Asia-Pacific, sales declined by 0.5% and totaled EUR 2,543 million. At comparable exchange rates, sales grew by 3.5%. New equipment sales grew slightly, while maintenance and modernization sales grew sig-nificantly.

11Q3 2018
Financial result
Financial result
MEUR 7–9/2018 7–9/2017 Change 1–9/2018 1–9/2017 Change 1–12/2017Operating income, MEUR 258.0 317.9 -18.9% 750.0 899.5 -16.6% 1,192.3
Operating income margin, % 11.3 14.4 11.3 13.9 13.6
Adjusted EBIT, MEUR 273.7 321.3 -14.8% 792.5 902.9 -12.2% 1,205.5
Adjusted EBIT margin, % 12.0 14.5 12.0 13.9 13.7Income before taxes, MEUR 271.9 330.2 -17.7% 786.0 948.5 -17.1% 1,250.4Net income, MEUR 217.2 253.6 -14.4% 613.1 728.4 -15.8% 960.2
Basic earnings per share, EUR 0.42 0.49 -14.7% 1.19 1.41 -16.0% 1.86
July–September 2018KONE’s operating income (EBIT) declined to EUR 258.0 million or 11.3% of sales. The adjusted EBIT, which excludes restructuring costs related to the Accelerate program, was EUR 273.7 million or 12.0% of sales.
Profitability was burdened by price competition seen in earlier years as well as increasing costs. Increased geopolitical uncertainty also had a negative impact on the result. The headwinds were partly compensated by productivity improvements and focused pricing actions.
Translation exchange rates had a negative impact of EUR 11 mil-lion on the operating income, and the restructuring costs related to the Accelerate program were EUR 15.7 million.
Taxes included a EUR 10 million tax benefit as a result of the US tax rate change.
Basic earnings per share was EUR 0.42.
January–September 2018KONE’s operating income (EBIT) declined to EUR 750.0 million or 11.3% of sales. The adjusted EBIT, which excludes restructuring costs related to the Accelerate program, was EUR 792.5 mil-lion or 12.0% of sales.
Profitability was burdened by price competi-tion seen in earlier years as well as increasing costs. Increased geopolitical uncertainty also had a negative impact on the result. The head-winds were partly compensated by productivity improvements and focused pricing actions.
Translation exchange rates had a negative impact of around EUR 43 million on the operat-ing income, and the restructuring costs related to the Accelerate program were EUR 42.5 million.
In the third quarter, taxes included a EUR 10 million tax benefit as a result of the US tax rate change.
Basic earnings per share was EUR 1.19.
Terminology: Slight <5%, clear 5–10%, significant >10%

Q3 201812
Cash flow and financial position
Cash flow and financial position
7–9/2018 7–9/2017 1–9/2018 1–9/2017 1–12/2017Cash flow from operations (before financing items and taxes), MEUR 273.3 302.7 818.5 928.4 1,263.3Net working capital (including financing items and taxes), MEUR -719.0 -782.2 -772.6
Interest-bearing net debt, MEUR -1,425.5 -1,464.9 -1,690.2
Gearing, % -50.8 -52.5 -55.8
Equity ratio, % 47.8 47.7 50.0
Equity per share, EUR 5.41 5.38 5.85
KONE’s financial position was very strong at the end of Sep-tember 2018.
Cash flow from operations (before financing items and taxes) during January–September 2018 declined to EUR 818.5 million driven mainly by the decline in operating income.
Net working capital including financing items and taxes was EUR -719.0 million at the end of September 2018 and was slightly less negative than in the beginning of the year.
Interest-bearing net debt was EUR -1,426 million at the end of September 2018. KONE’s cash and cash equivalents
together with current deposits and loan receivables were EUR 1,767 (December 31, 2017: 2,065) million at the end of the reporting period. Interest-bearing liabilities were EUR 352.8 (387.4) million, including a net pension liability of EUR 128.2 (152.2) million and short-term loans of EUR 12.8 (30.1) mil-lion. In addition, the interest-bearing net debt includes EUR 10.4 (10.3) million of option liabilities from acquisitions. Gear-ing was -50.8% and equity ratio was 47.8% at the end of Sep-tember 2018.
Equity per share was EUR 5.41.
Capital expenditure and acquisitions
Capital expenditure & acquisitions
MEUR 7–9/2018 7–9/2017 1–9/2018 1–9/2017 1–12/2017On fixed assets 20.7 24.6 58.8 63.8 94.6On leasing agreements 5.6 4.6 14.0 19.9 21.7On acquisitions 2.5 13.5 10.9 16.5 35.1Total 28.8 42.7 83.7 100.2 151.3
KONE’s capital expenditure and acquisitions totaled EUR 83.7 million in January–September 2018. Capital expenditure was mainly related to equipment and facilities in R&D, IT, opera-tions and production.
Acquisitions totaled EUR 10.9 million in January–Septem-ber 2018. KONE completed small acquisitions of maintenance businesses in Europe and in the United States and a small divestment in the United States.

13Q3 2018
Research and development
R&D expenditure
MEUR 7–9/2018 7–9/2017 Change 1–9/2018 1–9/2017 Change 1–12/2017
R&D expenditure, MEUR 39.5 36.4 8.5% 119.2 114.1 4.4% 158.4
As percentage of sales, % 1.7 1.6 1.8 1.8 1.8
KONE’s vision is to deliver the Best People Flow® experience by providing ease, effectiveness and experiences to its custom-ers and users. In line with its strategy, Winning with Custom-ers, the objective of KONE’s solution and service development is to drive differentiation further by putting the needs of customers and users at the center of all development. By closer collaboration with customers and partners, KONE will increase the speed of bringing new services and solutions to the market.
Research and development expen-ditures totaled EUR 119.2 million, representing 1.8% of sales in January–September 2018. R&D expenditures include the development of new prod-uct and service concepts as well as fur-ther development of existing solutions and services.
During the first quarter of 2018, KONE introduced a new digital platform, which uses state-of-the-art technologies and is open to third-party solutions. KONE’s digital platform connects customers, users and employees to equipment and data transforming the people flow experience in buildings and cities. In connection with the launch of the platform, KONE introduced a renewed products and services portfolio utilizing the platform and consisting of
three layers: 1) KONE’s core solutions 2) Advanced People Flow Solutions 3) People Flow Planning and Consulting Services. In addition, KONE 24/7 Connected Services, a KONE core solu-tion using advanced IoT technologies, was extended to escala-
tors in the first quarter of 2018. During the second quarter, KONE was ranked as one of the world’s most innovative companies in 2018 by the business magazine Forbes. KONE ranked 59th and was the only elevator and escala-tor company on the list.
KONE also launched new elevator models and made several updates and enhancements to its existing product offering during the reporting period. In January–March, KONE launched new elevator models, U MonoSpace®, a machine-roomless elevator, and U MiniSpace™, a small-machine room elevator in India. During the second
quarter of 2018, KONE extended its offering in the residen-tial and commercial segments and launched a renewed ver-sion of the JumpLift in China. During the third quarter, KONE made several enhancements to the MonoSpace®, EcoSpace™ and TranSys™ elevator models in the EMEA region. In China, KONE 24/7 Connected Services was made available for new escalator and autowalk deliveries.
HIGHLIGHTS Q3/2018• Several enhancements for
Mono Space®, EcoSpace™ and TranSys™ elevators in the EMEA region
• KONE 24/7 Connected Services readiness for all new escalator and autowalk deliveries in China

Q3 201814
The main goals of KONE’s personnel strategy are to secure the availability, engagement, motivation and continuous devel-opment of the company’s personnel. All KONE’s activities are guided by ethical principles. Employee rights and responsibili-ties include the right to a safe and healthy working environ-ment, personal well-being, freedom of association, collective bargaining, non-discrimination and the right to a working environment in which harass-ment of any kind is not tolerated. One of our strategic targets is to be a great place to work, which we measure by employee engagement. During the second quarter of 2018, we con-ducted our annual employee engage-ment survey covering all employees. The response rate was 91%, and the employee engagement remained on a high level. During the third quarter, we focused on sharing the results and planning actions together with employees in all countries.
We strive to have the best professionals with the right com-petencies in each position. We facilitate this effort as well as increase the motivation, engagement and continuous devel-opment of the personnel through regular performance discus-sions. During the first quarter of 2018, we concentrated on performance discussions to ensure goal setting and achieve-ment reviews from the past year. Goals were set to more than 40,000 employees in the new Workday platform. Annual mid-year performance reviews and individual development planning discussions were held during the third quarter in all countries.
KONE’s strategy, Winning with Customers, focuses on put-ting the needs of our customers and users at the center of all development at KONE. People are key to the strategy’s success, which requires us to develop and obtain new competences in the fields of leadership, digitalization, partnering, understand-ing customers’ businesses and project management. During the first quarter of 2018, we launched a Leadership Funda-
mentals program for all new people leaders at KONE. During the second quarter, we launched a senior leader program with IMD, an independent business school, focusing on customer centricity and agile leaderships. We continued strengthen-ing our training capability by opening new training centers
in Malaysia and India during the first quarter and in Vietnam during the sec-ond quarter, adding up to a total of 38 KONE training centers globally.
A key focus area within the KONE personnel strategy is attracting the best talent, as well as talent with new com-petences. During the first quarter, we received more than 2,000 applications to the KONE International Trainee Pro-gram (ITP), which offers several trainee positions across the KONE countries and is meant for university students who are at least halfway through their studies. Furthermore, KONE organized
several training sessions to the talent acquisition teams on tar-geting new competencies and increasing diversity through recruitment. Efforts to increase diversity through recruitment were realized in July–September as a large number of appli-cants for open positions at KONE coming from outside the elevator and escalator industry. During the third quarter, 79% of all applicants were attracted from other industries.
In September 2017, we launched a program called Acceler-ate Winning with Customers, which aims at creating a more customer-focused way of working on a country, area and global level, across the entire KONE organization. During the second quarter of 2018, we initiated the first organizational changes in our finance, sourcing, technical sales support & engineering, as well as in our marketing & communications function, in order to create a faster-moving, customer-centric organization that leverages our scale more efficiently. Acceler-ate changes continued during the third quarter, resulting in the establishment of a renewed organization for Customer Solutions Engineering and Sourcing as well as for Logistics.
Personnel
KONE employees
1–9/2018 1–9/2017 1–12/2017Number of employees at the end of period 56,611 54,193 55,075Average number of employees 55,815 52,990 53,417
Geographical distribution of KONE employees
1–9/2018 1–9/2017 1–12/2017EMEA 22,592 21,849 22,013Americas 7,299 7,214 7,320Asia-Pacific 26,720 25,130 25,742Total 56,611 54,193 55,075
HIGHLIGHTS Q3/2018• Action planning together
with employees based on annual employee engage-ment survey results
• 79% of applicants for open positions attracted from outside the elevator and escalator industry

15Q3 2018
Environment KONE’s environmental targets for 2017–2021 are to be the leading provider of low-carbon People Flow® solutions and to have efficient low-carbon operations. Our Environmental Excellence program supports the transformation of the built environment into smart eco-cities, low-carbon communities, and net zero energy buildings. Improving resource efficiency is one of our top priorities.
During the second quarter, KONE published its Sustainability Report 2017, which follows the Global Report-ing Initiative G4 guidelines when applicable. The main environmental achievements related to KONE’s oper-ations in 2017 were energy efficiency improvements, for example the use of green electricity (30% of all electric-ity consumption), and reductions in greenhouse gas emissions from busi-ness air travel. KONE’s target is to reduce the carbon footprint relative to sales by 3% annually. KONE’s overall carbon foot-print relative to sales decreased by 0.2% compared to 2016 with sales growth calculated at comparable exchange rates. The carbon footprint of scope 1 and 2 greenhouse gas emis-sions relative to sales decreased by 2.6%, which equals 87% of the 3% target. KONE’s 2017 absolute operational carbon foot-print amounted to 319,600 tonnes of carbon dioxide equiva-lent (2016: 305,300; figure restated).
The most significant impact of KONE’s operational carbon footprint relates to logistics, which amounted to 50% of our operational greenhouse gas emissions in 2017. Other signifi-cant areas are our vehicle fleet (30%) and electricity/district heat consumption at KONE’s facilities (11%). The main rea-son for not meeting the 3% overall carbon footprint reduc-tion target in 2017 is related to increased logistics emissions, for example resulting from longer transportation distances. KONE’s carbon footprint data has been externally assured.
During the reporting period, KONE received several rec-ognitions related to the transparency and eco-efficiency of its solutions. During the first quarter, KONE achieved approved BVB (Byggvarubedömningen) environmental assessments
for its KONE MonoSpace® 500 and KONE MonoSpace® 700 elevators in Sweden as the first elevator company. During the second quarter, KONE extended the classification coverage of its product range according to the ISO 25745 energy efficiency standard with the best possible A rating for a high rise KONE MiniSpace™ elevator, in addition to 15 elevators or escalators classified earlier. During the third quar-ter, three additional KONE solutions, the KONE TransitMaster™ 140 esca-lator, and the KONE S MonoSpace® and KONE S MiniSpace™ elevators
received the Singapore Green Building Product (SGBP) cer-tificates. Based on the new criteria released this year for ver-tical transportation, the aforementioned solutions received the highest possible “Excellent” and “Leader” ratings in their respective categories. In both categories, KONE is the first ele-vator and escalator company to achieve these ratings. Three other KONE solutions have previously been granted SGBP cer-tificates. Through the certification, these solutions are recom-mended for Green Mark certified green buildings.
During the reporting period, KONE also achieved the ISO 9001 & 14001 quality and environmental management sys-tem recertification and upgraded its certification to the 2015 version of the ISO 9001 and ISO 14001 standards.
In September 2018, KONE was again confirmed as an FTSE4Good Index Series constituent. The FTSE4Good Index Series is designed to measure the performance of companies demonstrating strong environmental, social and governance (ESG) practices.
Other eventsIn 2007 a decision was issued by the European Commission concerning alleged local anticompetitive practices before early 2004 in Germany, Luxembourg, Belgium and the Nether-lands by leading elevator and escalator companies, includ-ing KONE’s local subsidiaries. Also, the Austrian Cartel Court issued in 2007 a decision concerning anticompetitive prac-tices that had taken place before mid-2004 in local Austrian markets by leading elevator and escalator companies, includ-ing KONE’s local subsidiary. As announced by KONE earlier, a number of civil damage claims by certain companies and
public entities, relating to the two 2007 decisions, are pend-ing in related countries. The claims have been made against various companies concerned by the decisions, including certain KONE companies. All claims are independent and are progressing procedurally at different stages. The total capital amount claimed jointly and severally from all of the defen-dants together was EUR 198 million at the end of September 2018 (June 30, 2018: EUR 205 million). KONE’s position is that the claims are without merit. No provision has been made.
HIGHLIGHTS Q3/2018• KONE was again confirmed
as constituent of the FTSE-4Good Index Series
• Singapore Green Building Product certificates achieved for three additional KONE solutions

Q3 201816
Most significant risks KONE is exposed to risks that may arise from its operations or changes in the operating environment. The risk factors described below can potentially have an adverse effect on KONE’s business operations and financial position and, as a result, on the value of the company. Other risks, which are cur-rently either unknown or considered immaterial to KONE may, however, become material in the future.
Strategic risks A weakening of the global economic environment could result in deterioration of the market environment and the com-petitive situation in the industry. More specifically, a material decline or prolonged weakness within the construction indus-try could result in a significant decline for the new equipment market and a more challenging environment for services. In particular, a sustained market decline in China, which accounts for over 25% of KONE’s sales, could have an adverse effect on KONE’s growth and profitability.
Digitalization, and, as a result, new customer requirements, potential new competition, ecosystems, business models and structural changes in key markets, could have a significant impact on the elevator and escalator industry. Failure to antici-pate or address changes in the external market environment could result in a deterioration of KONE’s growth, competitive-ness, market share or profitability.
KONE operates in an industry with various local regulatory requirements. Sudden or unforeseen changes in regulations, or a further increase in geopolitical tensions or regulatory protectionism could result in more challenging market condi-tions in affected countries. Such developments could have an adverse impact on KONE’s operations.
A significant portion of KONE’s component suppliers and global supply capacity is located in China, for both the eleva-tor and escalator businesses. Therefore, KONE’s operations may be adversely impacted by changes in trade agreements or by the introduction of trade restrictions.
Operational risks As one of the leading companies in the industry, KONE has a strong brand and reputation. Issues that impact the com-pany’s reputation or brand could have an effect on KONE’s business and financial performance. Such reputational risks could materialize; for example, in the case of an incident, a major delivery issue or a product quality issue. Matters con-cerning product integrity or quality could also have an impact on KONE’s financial performance.
KONE operates in a changing market environment that requires balancing rapid business growth with transformation.
This applies, in particular, to the availability of skilled person-nel, the adequate supply of components and materials, and the ability to ensure the quality of products and services which are delivered. Failure to adequately manage resourcing, qual-ity and the timeliness of delivery, or other critical aspects in projects, could have an adverse impact on KONE’s profitability.
The majority of components used in KONE’s supply chain are sourced from external suppliers, which exposes KONE to component price and availability risk as well as raw material price risk. Therefore, stronger than anticipated increases in prices for raw materials and components may have a signifi-cant impact on KONE’s profitability.
Hazard, security and incidental risksKONE’s business activities are dependent on the uninterrupted operation, quality and reliability of its manufacturing facilities, sourcing channels, operational service solutions and logistics processes. In addition, KONE’s operations extensively utilize information technology and its business is dependent on the quality, integrity and availability of information. Thus, in addi-tion to physical risks, KONE is exposed to cyber security risks, as operational information systems and products may be vulner-able to interruption, loss or manipulation of data, or malfunc-tions which can result in disruptions in processes and equip-ment availability and therefore impact KONE’s business. Any breach of sensitive employee or customer data may also result in significant penalties as well as reputational damage. Such cyber incidents could be caused by, including but not limited to, cybercrime, cyber-attacks, computer malware, information theft, fraud, misappropriation, or inadvertent actions from our employees and vendors.
Financial risks The majority of KONE’s sales are denominated in currencies other than the Euro, which exposes KONE to risks arising from foreign exchange-rate fluctuations. KONE is also exposed to counterparty risks related to financial institutions, through the significant amounts of liquid funds deposited with financial institutions, in the form of financial investments and in deriva-tives. Additionally, KONE is exposed to risks related to the liquidity and payment schedules of its customers, which may impact cash flow or lead to credit losses. Significant changes in local financial or taxation regulation could also have an impact on KONE’s financial performance. For further information on financial risks, please refer to notes 2.4 and 5.3 in KONE’s Financial Statements for 2017.
17Q3 2018
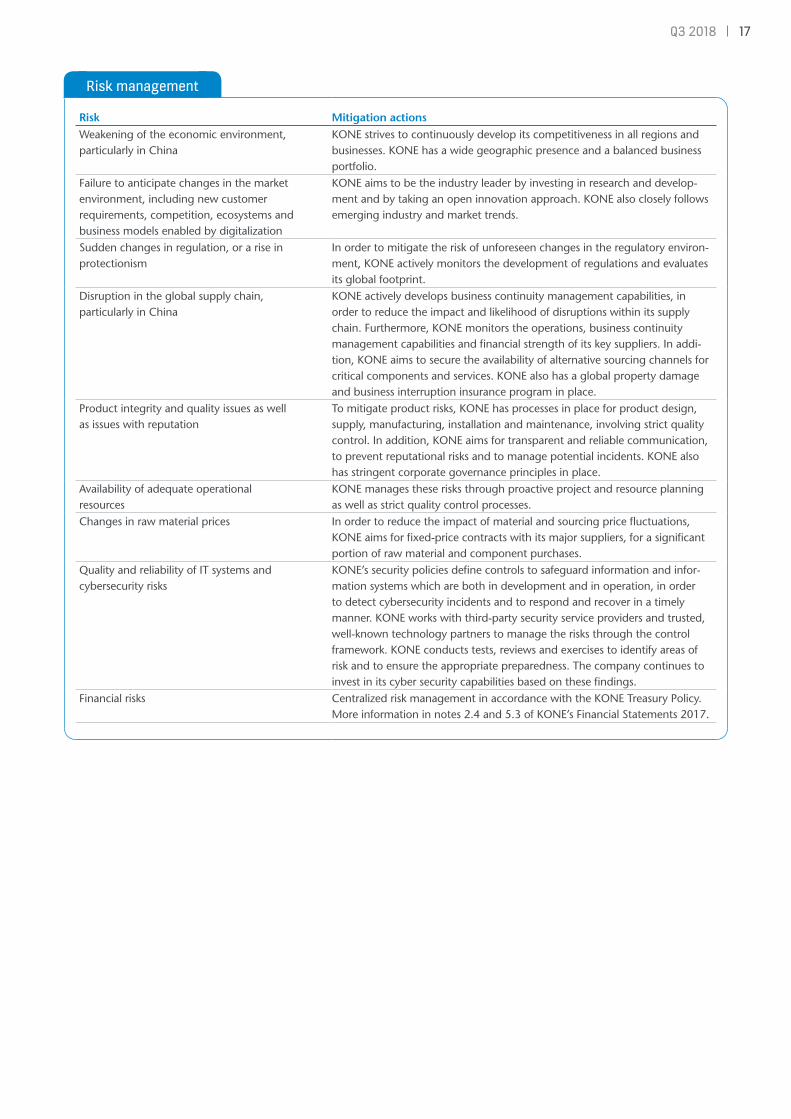
Risk management
Risk Mitigation actionsWeakening of the economic environment, particularly in China
KONE strives to continuously develop its competitiveness in all regions and businesses. KONE has a wide geographic presence and a balanced business portfolio.
Failure to anticipate changes in the market environment, including new customer requirements, competition, ecosystems and business models enabled by digitalization
KONE aims to be the industry leader by investing in research and develop-ment and by taking an open innovation approach. KONE also closely follows emerging industry and market trends.
Sudden changes in regulation, or a rise in protectionism
In order to mitigate the risk of unforeseen changes in the regulatory environ-ment, KONE actively monitors the development of regulations and evaluates its global footprint.
Disruption in the global supply chain, particularly in China
KONE actively develops business continuity management capabilities, in order to reduce the impact and likelihood of disruptions within its supply chain. Furthermore, KONE monitors the operations, business continuity management capabilities and financial strength of its key suppliers. In addi-tion, KONE aims to secure the availability of alternative sourcing channels for critical components and services. KONE also has a global property damage and business interruption insurance program in place.
Product integrity and quality issues as well as issues with reputation
To mitigate product risks, KONE has processes in place for product design, supply, manufacturing, installation and maintenance, involving strict quality control. In addition, KONE aims for transparent and reliable communication, to prevent reputational risks and to manage potential incidents. KONE also has stringent corporate governance principles in place.
Availability of adequate operational resources
KONE manages these risks through proactive project and resource planning as well as strict quality control processes.
Changes in raw material prices In order to reduce the impact of material and sourcing price fluctuations, KONE aims for fixed-price contracts with its major suppliers, for a significant portion of raw material and component purchases.
Quality and reliability of IT systems and cybersecurity risks
KONE’s security policies define controls to safeguard information and infor-mation systems which are both in development and in operation, in order to detect cybersecurity incidents and to respond and recover in a timely manner. KONE works with third-party security service providers and trusted, well-known technology partners to manage the risks through the control framework. KONE conducts tests, reviews and exercises to identify areas of risk and to ensure the appropriate preparedness. The company continues to invest in its cyber security capabilities based on these findings.
Financial risks Centralized risk management in accordance with the KONE Treasury Policy. More information in notes 2.4 and 5.3 of KONE’s Financial Statements 2017.

Q3 201818
Decisions of the Annual General MeetingKONE Corporation’s Annual General Meeting was held in Hel-sinki on February 26, 2018. The meeting approved the finan-cial statements and discharged the responsible parties from liability for the financial period January 1-December 31, 2017.
The number of Members of the Board of Directors was confirmed as eight. Re-elected as Members of the Board were Matti Alahuhta, Anne Brunila, Antti Herlin, Iiris Herlin, Jussi Herlin, Ravi Kant, Juhani Kaskeala and Sirpa Pietikäinen.
At its meeting held after the General Meeting, the Board of Directors elected from among its members Antti Herlin as its Chairman and Jussi Herlin as Vice Chairman.
Jussi Herlin was elected as Chairman and Anne Brunila, Antti Herlin and Ravi Kant as members of the Audit Commit-tee. Anne Brunila and Ravi Kant are independent of both the company and of significant shareholders.
Antti Herlin was elected as Chairman and Matti Alahuhta, Jussi Herlin and Juhani Kaskeala as members of the Nomination and Compensation Committee. Matti Alahuhta and Juhani Kaskeala are independent of both the company and of signifi-cant shareholders.
The General Meeting confirmed an annual compensation of EUR 55,000 (previously 54,000) for the Chairman of the Board, EUR 45,000 (44,000) for the Vice Chairman and EUR 40,000 (37,000) for Board Members. In addition, a compensa-tion of EUR 500 was approved for attendance at Board and Committee meetings. For Committee members residing out-side of Finland, a compensation of EUR 2,000 for attendance at Committee meetings was approved. Of the annual remu-neration, 40 percent will be paid in class B shares of KONE Corporation and the rest in cash.
The General Meeting approved the authorization for the Board of Directors to repurchase KONE’s own shares. Alto-gether no more than 52,440,000 shares may be repurchased, of which no more than 7,620,000 may be class A shares and 44,820,000 class B shares. The authorization shall remain in effect for a period of one year from the date of decision of the General Meeting.
Authorized public accountants PricewaterhouseCoopers Oy and Heikki Lassila were nominated as auditors.
Share-based incentivesKONE has two separate share-based incentive plans. One plan is targeted for the senior management of KONE including the President & CEO, members of the Executive Board and other top management, consisting of approximately 60 individuals. A second plan is targeted for other key personnel of KONE, totaling approximately 450 individuals. The potential reward in both plans is based on annual targets that are decided by the Board. These annual targets are set with the aim to take KONE towards the long-term financial targets. The potential reward is to be paid as a combination of KONE class B shares and a cash payment equivalent to the taxes and similar charges that are incurred from the receipt of shares. Plans include con-ditions preventing participants from transferring the shares received and participants are obliged to return the shares and the cash payments if employment or service contract is ter-minated during a period of two years following the ending of each earning period. As part of the plan for the senior manage-ment, a long-term target for their ownership has been set.
In December 2013, KONE granted a conditional 2014 option program. The stock options 2014 were listed on the Nasdaq Helsinki Ltd. as of April 1, 2016. The total number of stock options was 1,500,000 and 133,000 of them were held by KONE Corporation’s subsidiary. Each option entitled its
holder to subscribe for one (1) new class B shares at the price of, from February 27, 2018, EUR 25.00 per share. During the reporting period, 865,638 class B shares were subscribed for with 2014 option rights. The subscription period for the KONE 2014 option ended on April 30, 2018. The 133,000 KONE 2014 option rights in possession of KONE Corporation’s sub-sidiary, and the 4,060 KONE 2014 option rights not exercised during the subscription period expired upon the expiry of the subscription period.
In December 2014, KONE granted a conditional 2015 option program. The stock options 2015 were listed on the Nasdaq Helsinki Ltd. as of April 1, 2017. The total number of stock options was 1,500,000 and 131,000 of them are held by KONE Corporation’s subsidiary. During the reporting period, 28,349 class B shares were subscribed for with 2015 option rights. On September 30, 2018, a maximum of 1,327,576 shares could be subscribed for with the remaining outstanding option rights. Each stock option entitles its holder to subscribe for one (1) new class B KONE share at the price of, from Feb-ruary 27, 2018, EUR 30.40 per share. The share subscription period for the stock options 2015 is April 1, 2017–April 30, 2019.

19Q3 2018
KONE Share
Share capital and market capitalization*
Sep 30, 2018 Dec 31, 2017Number of class B shares 451,865,682 450,971,695Number of class A shares 76,208,712 76,208,712Total shares 528,074,394 527,180,407
Share capital, EUR 66,009,299 65,897,551
Market capitalization, MEUR* 23,749 23,052
* Market capitalization is calculated on the basis of both the listed B shares and the unlisted A shares excluding treasury shares. Class A shares are valued at the closing price of the class B shares at the end of the reporting period.
Shares in KONE’s possession
1–9/2018Shares in KONE’s possession at the beginning of the period 12,402,796Changes in own shares during the period -375,910Shares in KONE’s possession at the end of the period 12,026,886
At the end of September 2018, the Group had 12,026,886 class B shares in its possession. The shares in the Group’s pos-
session represent 2.7% of the total number of class B shares. This corresponds to 1.0% of the total voting rights.

Q3 201820
Trading on the Nasdaq Helsinki Ltd
1–9/2018 1–9/2017 1–12/2017
Shares traded on the Nasdaq Helsinki Ltd., million 132.8 137.2 175.3
Average daily trading volume 702,495 725,972 698,221
Volume-weighted average share price EUR 44.02 43.37 43.73
Highest share notation EUR 49.13 47.35 47.70
Lowest share notation EUR 39.15 39.77 39.77
Share notation at the end of period EUR 46.02 44.80 44.78
In addition to the Nasdaq Helsinki Ltd., KONE’s class B share is traded also on various alternative trading platforms. The vol-ume of KONE’s B shares traded on the Nasdaq Helsinki Stock Exchange represented approximately 29.2% of the total vol-ume of KONE’s class B shares traded in January–September 2018 (source: Fidessa Fragmentation Index, www.fragmenta-tion.fidessa.com).
The number of registered shareholders was 61,139 at the beginning of the review period and 62,216 at its end. The number of private households holding shares totaled 58,480 at the end of the period, which corresponds to approximately 12.9% of the listed B shares. At the end of September, 2018 a total of 52.6% of the B shares were owned by nominee-regis-tered and non-Finnish investors.
Flagging notificationsDuring January–September 2018, BlackRock, Inc. announced several notices in accordance with the Finnish Securities Mar-ket Act Chapter 9, Section 5. The notices were announced on March 29, June 13 and June 26. The notices have been released as stock exchange releases and are available on KONE Corporation’s internet pages at www.kone.com. According to the latest notification, the total number of KONE Corporation
shares owned by BlackRock, Inc. and its funds excluding finan-cial instruments increased above five (5) per cent of the total number of shares of KONE Corporation on June 25, 2018. The total number of shares including financial instruments owned by BlackRock, Inc. and its funds remained above five (5) per cent of the total number of shares of KONE Corporation on June 25, 2018.

21Q3 2018
North AmericaNew equipment Services
Slight growth
Maintenance
Slight growth
Modernization
Slight growth
EMEANew equipment Services
Stable
Maintenance
Slight growth
Modernization
Stable
Asia-PacificNew equipment Services
China
To be stable or to grow slightly in units and com-petition to remain intense
Outside China
Growth
Maintenance
Strong growth
Modernization
Strong growth
Outlook
Market outlook 2018
Foreign exchange rates are estimated to impact EBIT nega-tively by approximately EUR 45 (previously 35) million. The pressure on the adjusted EBIT margin is expected to start to ease towards the end of 2018 as a result of pricing and pro-ductivity actions that have been taken.
The outlook is based on KONE’s maintenance base and order book as well as the market outlook. The main factors continuing to pressure the adjusted EBIT margin in 2018 are the decrease in the margin of orders received witnessed in 2017, in China in particular, and higher labor and mate-rial costs. Higher raw material prices are estimated to impact KONE’s 2018 EBIT negatively by approximately EUR 100 mil-lion. Also, the increased geopolitical uncertainty is expected to have a negative impact. The margin pressure is expected to start to ease towards the end of 2018 as a result of pricing actions taken and general productivity improvements as well as the first savings from the Accelerate program.
Helsinki, October 25, 2018 KONE Corporation’s Board of Directors
Market outlook 2018In new equipment, the market in China is expected to be stable or to grow slightly in units ordered and competition to remain intense. In the rest of Asia-Pacific, the market is expected to grow. The market in North America is expected to grow slightly. In the Europe, Middle East and Africa region, the market is expected to be stable.
Maintenance markets are expected to see the strongest growth rate in Asia-Pacific, and to grow slightly in other regions.
The modernization market is expected to be stable in the Europe, Middle East and Africa region, to grow slightly in North America, and to develop strongly in Asia-Pacific.
Business outlook for 2018 (specified)In 2018, KONE’s sales is estimated to grow by 4–7% (previ-ously 3–7%) at comparable exchange rates as compared to the restated 2017 sales. The adjusted EBIT is expected to be in the range of EUR 1,100–1,150 (previously 1,100–1,200) mil-lion, assuming that foreign exchange rates would remain at the end of September 2018 level for the remainder of the year.
Accounting PrinciplesKONE Corporation’s Interim Report for January–September 2018 has been prepared in line with IAS 34, ‘Interim Financial Reporting’ and should be read in conjunction with KONE’s financial statements for 2017, published on January 25, 2018. KONE has applied the same accounting principles in the preparation of this Interim Report as in its Financial Statements for 2017, except for the adoption of new stan-dards and interpretations effective during 2018 that are relevant to its operations. In this Interim Report all 2017 financials are restated applying IFRS 15 and IFRS 9 retrospectively. More information for adoption of IFRS 15 and IFRS 9 is presented in pages 30–35. Changes of other standards or interpretations did not have a material impact on the Interim Report. The information presented in this Interim Report has not been audited.

Q3 201822
MEUR 7–9/2018 % 7–9/2017 % 1–9/2018 % 1–9/2017 % 1–12/2017 %Sales 2,288.7 2,209.7 6,627.3 6,490.3 8,796.7
Costs and expenses -2,001.0 -1,863.5 -5,789.1 -5,506.0 -7,490.1Depreciation and amortization -29.7 -28.3 -88.2 -84.8 -114.3
Operating income 258.0 11.3 317.9 14.4 750.0 11.3 899.5 13.9 1,192.3 13.6Share of associated companies' net income -1.2 -0.2 -2.4 0.1 -0.2Financing income 18.4 16.2 47.9 59.5 72.2Financing expenses -3.3 -3.7 -9.4 -10.6 -13.9
Income before taxes 271.9 11.9 330.2 14.9 786.0 11.9 948.5 14.6 1,250.4 14.2Taxes -54.7 -76.6 -172.9 -220.1 -290.2
Net income 217.2 9.5 253.6 11.5 613.1 9.3 728.4 11.2 960.2 10.9
Net income attributable to:Shareholders of the parent company 216.5 252.9 610.5 724.6 955.8Non-controlling interests 0.7 0.7 2.5 3.9 4.4
Total 217.2 253.6 613.1 728.4 960.2
Earnings per share for profit attributable to the shareholders of the parent company, EUR
Basic earnings per share, EUR 0.42 0.49 1.19 1.41 1.86Diluted earnings per share, EUR 0.42 0.49 1.18 1.41 1.86
Consolidated statement of comprehensive income
MEUR 7–9/2018 7–9/2017 1–9/2018 1–9/2017 1–12/2017
Net income 217.2 253.6 613.1 728.4 960.2
Other comprehensive income, net of tax:
Translation differences -40.7 -58.4 -19.0 -192.2 -204.9Hedging of foreign subsidiaries -1.6 13.9 -6.3 45.5 52.8Cash flow hedges -12.9 8.5 -24.9 30.0 39.6
Items that may be subsequently reclassified to statement of income -55.2 -36.0 -50.3 -116.6 -112.5
Changes in fair value 1.9 -5.2 2.7 -10.1 -12.2Remeasurements of employee benefits 2.0 4.8 14.8 5.5 8.3
Items that will not be reclassified to statement of income 3.9 -0.5 17.5 -4.6 -3.9
Total other comprehensive income, net of tax -51.3 -36.5 -32.7 -121.2 -116.4
Total comprehensive income 165.9 217.1 580.3 607.2 843.8
Total comprehensive income attributable to:
Shareholders of the parent company 165.2 216.4 577.8 603.4 839.4Non-controlling interests 0.7 0.7 2.5 3.9 4.4
Total 165.9 217.1 580.3 607.2 843.8
Consolidated statement of income

23Q3 2018
Condensed consolidated statement of financial positionAssets MEUR Sep 30, 2018 Sep 30, 2017 Dec 31, 2017
Non-current assets
Goodwill 1,321.6 1,324.1 1,325.5
Other intangible assets 260.5 272.4 274.5
Tangible assets 378.5 368.5 377.0
Loan receivables and other interest-bearing assets I 1.0 0.5 0.7
Investments 138.3 140.0 134.3
Employee benefits I 10.4 - 11.5
Deferred tax assets II 243.7 276.9 263.3
Total non-current assets 2,354.1 2,382.3 2,386.9
Current assets
Inventories II 648.5 638.5 626.8
Accounts receivable II 1,910.8 1,779.5 1,910.8
Deferred assets II 640.5 483.7 404.5
Income tax receivables II 74.8 95.3 67.5
Current deposits and loan receivables I 1,227.3 1,284.0 1,568.8
Cash and cash equivalents I 539.6 558.7 496.5
Total current assets 5,041.4 4,839.7 5,075.0
Total assets 7,395.5 7,222.0 7,461.9
Equity and liabilitiesMEUR Sep 30, 2018 Sep 30, 2017 Dec 31, 2017
Equity 2,805.5 2,787.7 3,028.9
Non-current liabilities
Loans I 201.4 204.2 194.7
Employee benefits I 128.2 153.3 152.2
Deferred tax liabilities II 143.4 161.9 143.8
Total non-current liabilities 473.0 519.5 490.7
Provisions II 132.8 129.9 137.9
Current liabilities
Loans I 23.2 20.7 40.5
Advance payments received and deferred revenue II 1,531.7 1,376.7 1,404.6
Accounts payable II 741.5 690.2 705.1
Accruals II 1,650.2 1,610.9 1,569.2
Income tax payables II 37.6 86.4 85.1
Total current liabilities 3,984.3 3,784.9 3,804.4
Total equity and liabilities 7,395.5 7,222.0 7,461.9
Items designated “ I “ comprise interest-bearing net debt.Items designated “ II “ comprise net working capital.

Q3 201824
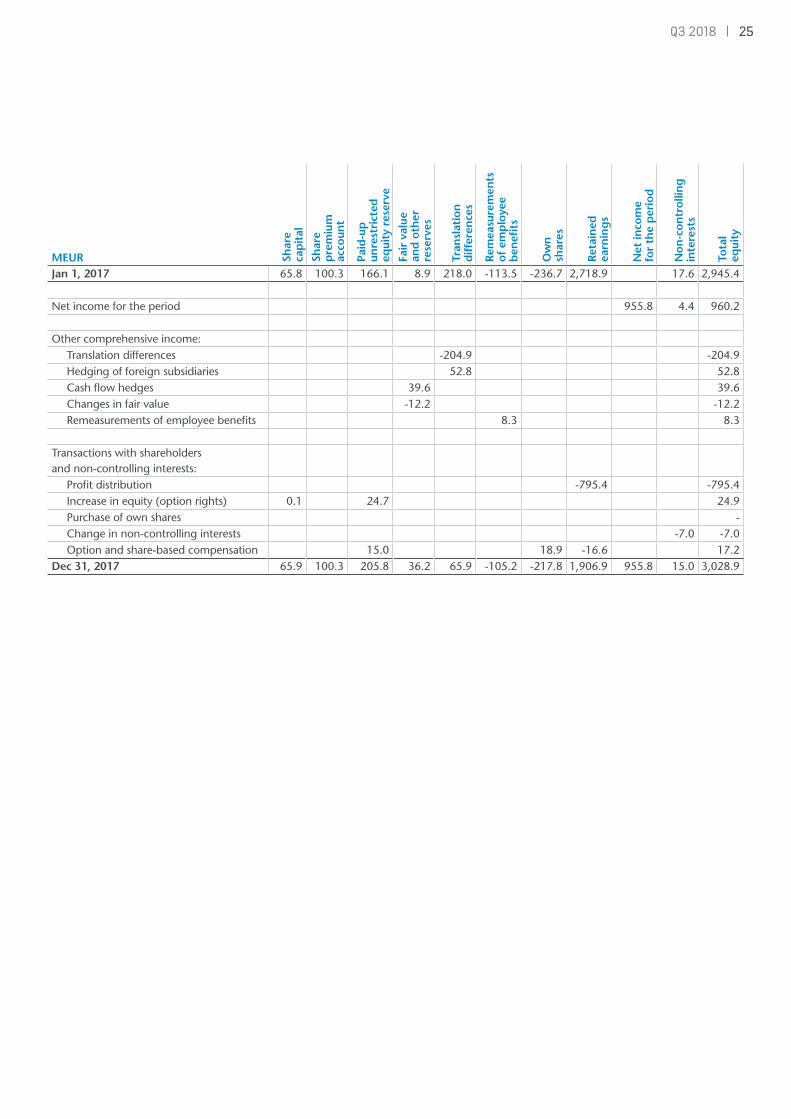
Consolidated statement of changes in equity
MEUR Shar
e ca
pit
al
Shar
e
pre
miu
m
acco
unt
Paid
-up
un
rest
rict
ed
equi
ty r
eser
ve
Fair
val
ue
and
oth
er
rese
rves
Tran
slat
ion
d
iffe
ren
ces
Rem
easu
rem
ents
of
em
plo
yee
ben
efits
Ow
n
shar
es
Ret
ain
ed
earn
ing
s
Net
inco
me
fo
r th
e p
erio
d
Non
-con
trol
ling
in
tere
sts
Tota
l eq
uity
Jan 1, 2018 65.9 100.3 205.8 36.2 65.9 -105.2 -217.8 2,862.7 15.0 3,028.9
Net income for the period 610.5 2.5 613.1
Other comprehensive income:Translation differences -19.0 -19.0Hedging of foreign subsidiaries -6.3 -6.3Cash flow hedges -24.9 -24.9Changes in fair value 2.7 2.7Remeasurements of employee benefits 14.8 14.8
Transactions with shareholders and non-controlling interests:
Profit distribution -849.2 -849.2Increase in equity (option rights) 0.1 22.4 22.5Purchase of own shares -Change in non-controlling interests -1.8 -1.8Option and share-based compensation 24.5 14.7 -14.5 24.7
Sep 30, 2018 66.0 100.3 252.7 14.0 40.6 -90.3 -203.1 1,999.0 610.5 15.8 2,805.5
MEUR Shar
e ca
pit
al
Shar
e
pre
miu
m
acco
unt
Paid
-up
un
rest
rict
ed
equi
ty r
eser
ve
Fair
val
ue
and
oth
er
rese
rves
Tran
slat
ion
d
iffe
ren
ces
Rem
easu
rem
ents
of
em
plo
yee
ben
efits
Ow
n
shar
es
Ret
ain
ed
earn
ing
s
Net
inco
me
fo
r th
e p
erio
d
Non
-con
trol
ling
in
tere
sts
Tota
l eq
uity
Jan 1, 2017 65.8 100.3 166.1 8.9 218.0 -113.5 -236.7 2,718.9 17.6 2,945.4
Net income for the period 724.7 3.9 728.6
Other comprehensive income:Translation differences -192.2 -192.2Hedging of foreign subsidiaries 45.5 45.5Cash flow hedges 30.0 30.0Changes in fair value -10.1 -10.1Remeasurements of employee benefits 5.5 5.5
Transactions with shareholders and non-controlling interests:
Profit distribution -795.4 -795.4Increase in equity (option rights) 0.1 21.5 21.6Purchase of own shares -Change in non-controlling interests -4.1 -4.1Option and share-based compensation 10.7 19.1 -17.0 12.8
Sep 30, 2017 65.9 100.3 198.3 28.8 71.4 -108.0 -217.6 1,906.6 724.7 17.3 2,787.7
25Q3 2018
MEUR Shar
e ca
pit
al
Shar
e
pre
miu
m
acco
unt
Paid
-up
un
rest
rict
ed
equi
ty r
eser
ve
Fair
val
ue
and
oth
er
rese
rves
Tran
slat
ion
d
iffe
ren
ces
Rem
easu
rem
ents
of
em
plo
yee
ben
efits
Ow
n
shar
es
Ret
ain
ed
earn
ing
s
Net
inco
me
fo
r th
e p
erio
d
Non
-con
trol
ling
in
tere
sts
Tota
l eq
uity
Jan 1, 2017 65.8 100.3 166.1 8.9 218.0 -113.5 -236.7 2,718.9 17.6 2,945.4
Net income for the period 955.8 4.4 960.2
Other comprehensive income:Translation differences -204.9 -204.9Hedging of foreign subsidiaries 52.8 52.8Cash flow hedges 39.6 39.6Changes in fair value -12.2 -12.2Remeasurements of employee benefits 8.3 8.3
Transactions with shareholders and non-controlling interests:
Profit distribution -795.4 -795.4Increase in equity (option rights) 0.1 24.7 24.9Purchase of own shares -Change in non-controlling interests -7.0 -7.0Option and share-based compensation 15.0 18.9 -16.6 17.2
Dec 31, 2017 65.9 100.3 205.8 36.2 65.9 -105.2 -217.8 1,906.9 955.8 15.0 3,028.9

Q3 201826
MEUR 7–9/2018 7–9/2017 1–9/2018 1–9/2017 1–12/2017
Operating income 258.0 317.9 750.0 899.5 1,192.3
Change in working capital
before financing items and taxes -14.5 -43.5 -19.7 -56.0 -43.3
Depreciation and amortization 29.7 28.3 88.2 84.8 114.3
Cash flow from operations before
financing items and taxes 273.3 302.7 818.5 928.4 1,263.3
Cash flow from financing items and taxes -72.9 -107.7 -192.7 -242.1 -299.6
Cash flow from operating activities 200.3 195.0 625.8 686.2 963.7
Cash flow from investing activities -13.7 -39.2 -67.9 -96.3 -143.5
Cash flow after investing activities 186.6 155.8 557.9 589.9 820.2
Purchase of own shares - - - - -
Increase in equity (option rights) 0.3 7.1 22.5 21.6 24.9
Profit distribution - - -849.2 -795.4 -795.4
Change in deposits and loans receivable, net -144.4 -174.5 331.2 201.8 -82.4
Change in loans payable and other interest-bearing debt -9.4 -27.7 -13.9 -24.1 -33.2
Changes in non-controlling interests -2.4 -2.7 -3.0 -3.2 -5.5
Cash flow from financing activities -155.9 -197.8 -512.4 -599.3 -891.7
Change in cash and cash equivalents 30.7 -42.0 45.6 -9.3 -71.5
Cash and cash equivalents at beginning of period 511.7 607.9 496.5 589.2 589.2
Translation difference -2.8 -7.1 -2.5 -21.1 -21.1
Cash and cash equivalents at end of period 539.6 558.7 539.6 558.7 496.5
CHANGE IN INTEREST-BEARING NET DEBT
MEUR 7–9/2018 7–9/2017 1–9/2018 1–9/2017 1–12/2017
Interest-bearing net debt at beginning of period -1,254.8 -1,302.1 -1,690.2 -1,687.6 -1,687.6
Interest-bearing net debt at end of period -1,425.5 -1,464.9 -1,425.5 -1,464.9 -1,690.2
Change in interest-bearing net debt -170.7 -162.8 264.7 222.7 -2.6
Condensed consolidated statement of cash flows

27Q3 2018
KEY FIGURES
1–9/2018 1–9/2017 1–12/2017
Basic earnings per share EUR 1.19 1.41 1.86
Diluted earnings per share EUR 1.18 1.41 1.86
Equity per share EUR 5.41 5.38 5.85
Interest-bearing net debt MEUR -1,425.5 -1,464.9 -1,690.2
Equity ratio % 47.8 47.7 50.0
Gearing % -50.8 -52.5 -55.8
Return on equity % 28.0 33.9 32.1
Return on capital employed % 25.2 30.2 28.8
Total assets MEUR 7,395.5 7,222.0 7,461.9
Assets employed MEUR 1,380.0 1,322.8 1,338.7
Net working capital (including financing and tax items) MEUR -719.0 -782.2 -772.6
The calculation formulas of key figures are presented in KONE’s Financial Statements for 2017.
ALTERNATIVE PERFORMANCE MEASURE
KONE reports an alternative performance measure, adjusted EBIT, to enhance comparability of the business performance between reporting periods during the Accelerate program. The adjusted EBIT is calculated by excluding significant items impacting compara-bility such as significant restructuring costs arising from redundancy and other costs directly associated to the Accelerate program.
7–9/2018 7–9/2017 1–9/2018 1–9/2017 1–12/2017
Operating income MEUR 258.0 317.9 750.0 899.5 1,192.3
Operating income margin % 11.3 14.4 11.3 13.9 13.6
Items impacting comparability MEUR 15.7 3.3 42.5 3.3 13.2
Adjusted EBIT MEUR 273.7 321.3 792.5 902.9 1,205.5
Adjusted EBIT margin % 12.0 14.5 12.0 13.9 13.7
Net working capital
MEUR Sep 30, 2018 Sep 30, 2017 Dec 31, 2017
Net working capital
Inventories 648.5 638.5 626.8
Advance payments received and deferred revenue -1,531.7 -1,376.7 -1,404.6
Accounts receivable 1,910.8 1,779.5 1,910.8
Deferred assets and income tax receivables 715.3 579.0 472.0
Accruals and income tax payables -1,687.8 -1,697.3 -1,654.3
Provisions -132.8 -129.9 -137.9
Accounts payable -741.5 -690.2 -705.1
Net deferred tax assets/liabilities 100.3 115.0 119.5
Total net working capital -719.0 -782.2 -772.6
Notes for the Interim Report

Q3 201828
QUARTERLY FIGURES
KONE has applied new IFRS 15 and IFRS 9 standards from January 1, 2018 onwards and 2017 financials are restated retrospectively. Figures for 2011–2016 are not restated and thus not fully comparable.
Q3/2018 Q2/2018 Q1/2018 Q4/2017 Q3/2017 Q2/2017 Q1/2017
Orders received MEUR 1,831.9 2,118.6 1,908.7 1,845.8 1,739.0 2,056.2 1,913.0
Order book MEUR 7,791.6 7,915.3 7,786.6 7,357.8 7,473.5 7,749.2 7,960.5
Sales MEUR 2,288.7 2,330.6 2,008.0 2,306.3 2,209.7 2,337.2 1,943.4
Operating income MEUR 258.0 280.5 211.5 292.8 317.9 335.8 245.8
Operating income margin % 11.3 12.0 10.5 12.7 14.4 14.4 12.6
Adjusted EBIT 1) MEUR 273.7 300.4 218.3 302.6 321.3 335.8 245.8
Adjusted EBIT margin 1) % 12.0 12.9 10.9 13.1 14.5 14.4 12.6
Items impacting comparability MEUR 15.7 19.9 6.9 9.9 3.3
Q4/2016 Q3/2016 Q2/2016 Q1/2016 Q4/2015 Q3/2015 Q2/2015 Q1/2015
Orders received MEUR 1,839.2 1,771.7 2,067.8 1,942.3 1,947.2 1,764.5 2,193.5 2,053.8
Order book MEUR 8,591.9 8,699.0 8,763.6 8,529.7 8,209.5 8,350.7 8,627.4 8,529.6
Sales MEUR 2,593.2 2,170.2 2,272.6 1,748.3 2,561.8 2,184.2 2,210.4 1,690.9
Operating income MEUR 392.2 331.1 348.6 221.4 378.5 325.9 325.2 211.9
Operating income margin % 15.1 15.3 15.3 12.7 14.8 14.9 14.7 12.5
Adjusted EBIT 1) MEUR 392.2 331.1 348.6 221.4 378.5 325.9 325.2 211.9
Adjusted EBIT margin 1) % 15.1 15.3 15.3 12.7 14.8 14.9 14.7 12.5
Items impacting comparability MEUR
Q4/2014 Q3/2014 Q2/2014 Q1/2014 Q4/2013 Q3/2013 Q2/2013 Q1/2013
Orders received MEUR 1,703.8 1,577.2 1,801.9 1,729.7 1,473.2 1,327.2 1,638.2 1,712.4
Order book MEUR 6,952.5 6,995.8 6,537.2 6,175.4 5,587.5 5,642.1 5,874.4 5,823.1
Sales MEUR 2,165.8 1,877.9 1,848.9 1,441.8 2,033.0 1,739.2 1,761.7 1,398.7
Operating income MEUR 315.3 277.5 263.2 179.6 292.8 257.5 242.8 160.4
Operating income margin % 14.6 14.8 14.2 12.5 14.4 14.8 13.8 11.5
Adjusted EBIT 1) MEUR 315.3 277.5 263.2 179.6 292.8 257.5 242.8 160.4
Adjusted EBIT margin 1) % 14.6 14.8 14.2 12.5 14.4 14.8 13.8 11.5
Items impacting comparability MEUR
Q4/2012 Q3/2012 Q2/2012 Q1/2012 Q4/2011 Q3/2011 Q2/2011 Q1/2011
Orders received MEUR 1,321.3 1,295.6 1,513.4 1,365.9 1,098.8 1,095.4 1,226.2 1,044.7
Order book MEUR 5,050.1 5,283.7 5,305.3 4,842.8 4,348.2 4,143.2 3,947.7 3,737.5
Sales MEUR 1,857.7 1,633.7 1,544.1 1,241.3 1,588.8 1,296.2 1,286.4 1,053.8
Operating income MEUR 257.4 226.4 173.0 134.6 233.0 188.9 184.5 118.7
Operating income margin % 13.9 13.9 11.2 10.8 14.7 14.6 14.3 11.3
Adjusted EBIT 1) MEUR 257.4 226.4 210.3 134.6 233.0 188.9 184.5 118.7
Adjusted EBIT margin 1) % 13.9 13.9 13.6 10.8 14.7 14.6 14.3 11.3
Items impacting comparability MEUR 37.3
1) Operating income excluding items impacting comparability.

29Q3 2018
Depreciation and amortization
MEUR 7–9/2018 7–9/2017 1–9/2018 1–9/2017 1–12/2017
Depreciation and amortization of fixed assets 21.4 20.4 63.8 61.0 82.7
Amortization of acquisition-related intangible assets 8.3 7.9 24.5 23.8 31.7
Total 29.7 28.3 88.2 84.8 114.3
Key exchange rates in euros
Sep 30, 2018 Sep 30, 2017Income
statementStatement of
financial positionIncome
statementStatement of
financial position
Chinese Renminbi RMB 7.7934 7.9662 7.5828 7.8534US Dollar USD 1.1938 1.1576 1.1151 1.1806British Pound GBP 0.8845 0.8873 0.8719 0.8818Australian Dollar AUD 1.5757 1.6048 1.4592 1.5075
Derivatives
Fair values of derivative financial instruments Derivative assets
Derivative liabilities
Fair value,net
Fair value,net
Fair value,net
MEURSep 30,
2018Sep 30,
2018Sep 30,
2018Sep 30,
2017Dec 31,
2017
Foreign exchange forward contracts and swaps 44.4 -52.4 -8.0 19.7 23.5
Electricity price forward contracts 0.1 - 0.1 -0.3 -0.3
Total 44.5 -52.4 -8.0 19.4 23.2
Nominal values of derivative financial instrumentsMEUR Sep 30, 2018 Sep 30, 2017 Dec 31, 2017
Foreign exchange forward contracts and swaps 3,440.7 2,442.6 2,389.6
Electricity price forward contracts 0.2 1.1 1.0
Total 3,440.9 2,443.7 2,390.6
The fair values of foreign exchange forward contracts and swaps as well as the fair values of cross-currency swaps are measured based on price information derived from active markets and commonly used valuation methods (fair value hierarchy level 2). For electricity price forward contracts, there exists a stock exchange price.
The fair values are represented on the balance sheet on a gross basis and can be set off on conditional terms. No collaterals or pledges have been given as a security against any liabilities or received against any assets arising from derivatives or other financial instruments. Financial contracts are executed only with counterparties that have high credit ratings. The credit risk of these coun-terparties as well as the present creditworthiness of KONE are considered when calculating the fair values of outstanding financial assets and liabilities.

Q3 201830
INVESTMENTSThe shares held include a 19.9% holding in Toshiba Elevator and Building Systems Corporation (TELC). TELC is an invest-ment in equity instruments that does not have a quoted price in an active market. Investment also include other non-current financial assets which are investments in smaller holdings in other companies without public quotation.
Shares and other non-current financial assets are classified as investments measured at fair value through other compre-hensive income and the fair value is measured using income or market approach valuation techniques under fair value hierar-chy level 3.
Commitments
MEUR Sep 30, 2018 Sep 30, 2017 Dec 31, 2017
Guarantees
Others 2.7 5.3 5.0
Operating leases 315.7 294.4 294.5
Total 318.4 299.7 299.5
Banks and financial institutions have guaranteed obligations arising in the ordinary course of business of KONE companies up to a maximum of EUR 1,617 (1,371) million as of September 30, 2018.
KONE leases cars, machinery & equipment and buildings under operating leases with varying terms.
The future minimum lease payments under non-cancellable operating leasesMe Sep 30, 2018 Sep 30, 2017 Dec 31, 2017
Less than 1 year 75.6 69.8 73.0
1–5 years 176.4 159.3 161.3
Over 5 years 63.7 65.2 60.2
Total 315.7 294.4 294.5
Restated information on 2017 financials as a result of adoption of new IFRS 15 and IFRS 9 accounting standardsKONE has adapted new accounting standards issued by the International Accounting Standards Board, IFRS 15, Revenue from Contracts with Customers, and IFRS 9, Financial Instru-ments, effective on January 1, 2018.
The most significant impact from the implementation of the IFRS 15 is the application of percentage of completion rev-enue recognition method also in the volume new equipment and modernization businesses. In these businesses revenue
was previously recognized upon the handover of the project to the customer while long-term major projects were already recognized under percentage of completion method. With the new IFRS 15 principles revenue is recognized gradually for all construction contracts at KONE based on the progress from the point when materials arrive at customer site until the hand-over of the project. Implementation of IFRS 9 did not have a material impact in KONE’s consolidated financial statements.
IFRS 15IFRS 15 establishes a new five-step model that applies to rev-enue arising from contracts with customers. Revenue is recog-nized when, or as, the customer obtains control of the goods or services in an amount that reflects the consideration to which the entity expects to be entitled in exchange for those goods or services. KONE has adopted the new standard by using the full retrospective method.
The impact of the implementation of IFRS 15 is limited to revenue recognition of new equipment and modernization contracts where the revenue recognition will occur over time, measured based on the percentage of completion method as the customer obtains control of each asset, i.e. separately identifiable performance obligation. A performance obligation is a distinct good or service within a contract that customer can benefit on stand-alone basis. For KONE’s new equipment

31Q3 2018
and modernization contracts, a performance obligation typi-cally means delivery and installation of a single unit, i.e. an elevator, escalator or other People Flow™ solution. Percent-age of completion is defined as the proportion of an individual performance obligation’s cost incurred to date from the total estimated costs for that particular performance obligation. The percentage of completion method requires accurate estimates of future revenues and costs over the full term of the contracts. These significant estimates form the basis for the amount of revenue to be recognized and include the latest updated total revenue, cost and risks adjusted by the typical estimation revi-sions for similar types of contracts. These estimates may mate-rially change due to the stage of completion of the contract, changes in the contract scope, costs estimates and customer’s plans and other factors.
Application of new revenue recognition principles under IFRS 15 has a material impact on KONE’s consolidated finan-cial statements. In practice, revenue is recognized earlier based on the progress also for those new equipment and modern-ization contracts which were not previously defined as long-term major projects already recognized under the percentage of completion method. From a balance sheet perspective, the application of new principles decreased inventories and related advances received and deferred revenue, while receivables were somewhat increased. Deferred tax assets and liabilities changed slightly. As a result of the restated timing of revenue recognition, retained earnings were increased. Also, reported new equipment and modernization order book decreased due to application of percentage of completion method also for other new equipment and modernization contracts than long-term major projects. These changes do not impact cash flow.
IFRS 9IFRS 9 includes revised guidance on the classification and mea-surement of financial instruments, a new expected credit loss model for calculating impairment on financial assets, and new general hedge accounting requirements. Additionally, IFRS 9 introduces expanded disclosure requirements and changes in presentation. KONE has adopted the new standard by using the full retrospective method.
The main impact of the IFRS 9 application for KONE is coming from the new expected credit loss model applied to assess impairment loss for the doubtful accounts receivable. KONE applies the simplified approach allowed by IFRS 9 as the accounts receivable does not contain significant financing component. To measure the lifetime expected credit losses trade receivables have been grouped based on shared credit risk characteristics and aging category and measured based on historical loss rates adjusted by forward looking estimates and individual assessment. The adaptation of the new principles slightly increased the accumulated impairment loss.
IFRS 9 contains a new classification and measurement guidance for financial assets and liabilities that reflects the
business model in which assets are managed and their cash flow characteristics. IFRS 9 contains three principal classifica-tion categories for financial assets and accordingly KONE has classified financial assets as measured at amortized cost, at fair value through other comprehensive income and at fair value through statement of income. The standard eliminated previ-ous IAS 39 categories of held to maturity, loans and receivables and available-for-sale. Under IFRS 9, all shares and non-current financial assets which were previously classified as available-for-sale investments and measured at cost are classified as investments measured at fair value through other compre-hensive income. Investments in interest rate funds which were previously classified as loans and receivables and measured at amortized cost are classified at fair value through statement of income.
Application of IFRS 9 did not have any material impact on KONE’s Accounting Principles for financial liabilities or to hedge accounting. Thus, the implementation of IFRS 9 did not have a material impact on the transactions and balances rec-ognized in KONE’s consolidated financial statements.

Q3 201832
KEY FIGURES, RESTATED
Q1 Q2 Q3 Q4 1–12/2017Orders received MEUR 1,913.0 2,056.2 1,739.0 1,845.8 7,554.0
Order book MEUR 7,960.5 7,749.2 7,473.5 7,357.8 7,357.8
Sales MEUR 1,943.4 2,337.2 2,209.7 2,306.3 8,796.7
Operating income MEUR 245.8 335.8 317.9 292.8 1,192.3
Operating income margin % 12.6 14.4 14.4 12.7 13.6
Adjusted EBIT 1) MEUR 245.8 335.8 321.3 302.6 1,205.5
Adjusted EBIT margin 1) % 12.6 14.4 14.5 13.1 13.7
Income before tax MEUR 271.8 346.5 330.2 301.9 1,250.4
Net income MEUR 208.7 266.1 253.6 231.8 960.2
Basic earnings per share EUR 0.40 0.52 0.49 0.45 1.86
Equity per share EUR 4.58 4.94 5.38 5.85 5.85
Cash flow from operations (before financing items and taxes) MEUR 305.3 320.4 302.7 335.0 1,263.3
Interest-bearing net debt MEUR -1,182.8 -1,302.1 -1,464.9 -1,690.2 -1,690.2
Equity ratio % 42.5 44.5 47.7 50.0 50.0
Return on equity % 31.4 34.5 33.9 32.1 32.1
Return on capital employed % 27.6 30.5 30.2 28.8 28.8
Net working capital (including financing items and taxes) MEUR -995.3 -861.7 -782.2 -772.6 -772.6
Gearing % -49.9 -50.8 -52.5 -55.8 -55.8
1) Operating income excluding items impacting comparability.
SALES BY REGION, RESTATED
MEUR Q1 % Q2 % Q3 % Q4 % 1–12/2017 % EMEA 785.0 40% 907.3 39% 896.7 41% 1,005.6 44% 3,594.5 41%
Americas 463.4 24% 450.8 19% 431.3 20% 432.9 19% 1,778.5 20%
Asia-Pacific 695.0 36% 979.1 42% 881.8 40% 867.8 38% 3,423.7 39%
Total 1,943.4 2,337.2 2,209.7 2,306.3 8,796.7
SALES BY BUSINESS, RESTATED
MEUR Q1 % Q2 % Q3 % Q4 % 1–12/2017 % New equipment 939.0 48% 1,299.7 56% 1,207.6 55% 1,207.5 52% 4,653.9 53%
Services 1,004.4 52% 1,037.5 44% 1,002.1 45% 1,098.8 48% 4,142.8 47%
Maintenance 719.7 37% 717.6 31% 705.9 32% 744.0 32% 2,887.3 33%
Modernization 284.7 15% 319.9 14% 296.2 13% 354.9 15% 1,255.6 14%
Total 1,943.4 2,337.2 2,209.7 2,306.3 8,796.7

33Q3 2018
CONSOLIDATED STATEMENT OF INCOME, RESTATED
MEUR Q1 % Q2 % Q3 % Q4 % 1–12/2017 % Sales 1,943.4 2,337.2 2,209.7 2,306.3 8,796.7
Costs and expenses -1,669.2 -1,973.3 -1,863.5 -1,984.1 -7,490.1
Depreciation and amortization -28.4 -28.2 -28.3 -29.5 -114.3
Operating income 245.8 12.6 335.8 14.4 317.9 14.4 292.8 12.7 1,192.3 13.6
Share of associated companies' net income 0.3 0.0 -0.2 -0.3 -0.2
Financing income 28.5 14.8 16.2 12.7 72.2
Financing expenses -2.8 -4.1 -3.7 -3.3 -13.9
Income before taxes 271.8 14.0 346.5 14.8 330.2 14.9 301.9 13.1 1,250.4 14.2
Taxes -63.1 -80.4 -76.6 -70.1 -290.2
Net income 208.7 10.7 266.1 11.4 253.6 11.5 231.8 10.0 960.2 10.9
Net income attributable to:
Shareholders of the parent company 206.5 265.1 252.9 231.2 955.8
Non-controlling interests 2.3 0.9 0.7 0.5 4.4
Total 208.7 266.1 253.6 231.8 960.2
Earnings per share for profit attributable to the shareholders of the parent company, EUR
Basic earnings per share, EUR 0.40 0.52 0.49 0.45 1.86
Diluted earnings per share, EUR 0.40 0.52 0.49 0.45 1.86

Q3 201834
CONDENSED CONSOLIDATED STATEMENT OF FINANCIAL POSITION, RESTATED
Assets MEUR Q4/16 Q1/17 Q2/17 Q3/17 Q4/17Non-current assets
Goodwill 1,371.8 1,369.9 1,333.2 1,324.1 1,325.5
Other intangible assets 292.9 287.2 276.8 272.4 274.5
Tangible assets 368.3 369.7 365.8 368.5 377.0
Loan receivables and other interest-bearing assets I 7.4 7.3 7.3 0.5 0.7
Investments 150.1 155.1 145.4 140.0 134.3
Employee benefits I - - - - 11.5
Deferred tax assets II 302.7 295.5 283.8 276.9 263.3
Total non-current assets 2,493.1 2,484.7 2,412.3 2,382.3 2,386.9
Current assets
Inventories II 558.0 617.7 611.8 638.5 626.8
Accounts receivable II 1,901.9 1,813.0 1,866.1 1,779.5 1,910.8
Deferred assets II 454.7 485.1 452.3 483.7 404.5
Income tax receivables II 61.4 60.5 79.5 95.3 67.5
Current deposits and loan receivables I 1,496.6 1,053.3 1,098.8 1,284.0 1,568.8
Cash and cash equivalents I 589.2 536.6 607.9 558.7 496.5
Total current assets 5,061.7 4,566.1 4,716.4 4,839.7 5,075.0
Total assets 7,554.8 7,050.8 7,128.8 7,222.0 7,461.9
Equity and liabilities MEUR Q4/16 Q1/17 Q2/17 Q3/17 Q4/17Equity 2,945.4 2,369.4 2,561.6 2,787.7 3,028.9
Non-current liabilities
Loans I 203.1 203.9 208.3 204.2 194.7
Employee benefits I 176.7 179.9 175.7 153.3 152.2
Deferred tax liabilities II 160.1 160.4 164.1 161.9 143.8
Total non-current liabilities 539.9 544.2 548.1 519.5 490.7
Provisions II 179.6 158.7 141.1 129.9 137.9
Current liabilities
Loans I 25.8 30.6 27.9 20.7 40.5
Advance payments received and deferred revenue II 1,428.6 1,474.4 1,376.8 1,376.7 1,404.6
Accounts payable II 743.3 644.2 735.1 690.2 705.1
Accruals II 1,609.7 1,756.8 1,653.4 1,610.9 1,569.2
Income tax payables II 82.5 72.5 84.8 86.4 85.1
Total current liabilities 3,890.0 3,978.5 3,878.0 3,784.9 3,804.4
Total equity and liabilities 7,554.8 7,050.8 7,128.8 7,222.0 7,461.9
Items designated ” I ” comprise interest-bearing net debt.
Items designated ” II ” comprise net working capital.

35Q3 2018
CONDENSED CONSOLIDATED STATEMENT OF CASH FLOWS, RESTATED
MEUR Q1 Q2 Q3 Q4 1–12/2017Operating income 245.8 335.8 317.9 292.8 1,192.3
Change in working capital before financing items and taxes 31.1 -43.6 -43.5 12.7 -43.3
Depreciation and amortization 28.4 28.2 28.3 29.5 114.3
Cash flow from operations before financing items and taxes 305.3 320.4 302.7 335.0 1,263.3
Cash flow from financing items and taxes -50.0 -84.5 -107.7 -57.5 -299.6
Cash flow from operating activities 255.3 235.9 195.0 277.5 963.7
Cash flow from investing activities -27.0 -30.1 -39.2 -47.2 -143.5
Cash flow after investing activities 228.4 205.8 155.8 230.2 820.2
Purchase of own shares - - - - -
Increase in equity (option rights) - 14.5 7.1 3.3 24.9
Profit distribution -729.8 -65.6 - - -795.4
Change in deposits and loans receivable, net 443.1 -66.8 -174.5 -284.2 -82.4
Change in loans payable and other interest-bearing debt 4.7 -1.1 -27.7 -9.1 -33.2
Changes in non-controlling interests - -0.4 -2.7 -2.4 -5.5
Cash flow from financing activities -282.0 -119.5 -197.8 -292.4 -891.7
Change in cash and cash equivalents -53.6 86.4 -42.0 -62.2 -71.5
Cash and cash equivalents at beginning of period 589.2 536.6 607.9 558.7 589.2
Translation difference 1.0 -15.0 -7.1 -0.0 -21.1
Cash and cash equivalents at end of period 536.6 607.9 558.7 496.5 496.5
Change in interest-bearing net debtMEUR Q1 Q2 Q3 Q4 1–12/2017Interest-bearing net debt at beginning of period -1,687.6 -1,182.8 -1,302.1 -1,464.9 -1,687.6
Interest-bearing net debt at end of period -1,182.8 -1,302.1 -1,464.9 -1,690.2 -1,690.2
Change in interest-bearing net debt 504.8 -119.3 -162.8 -225.3 -2.6

KONE Corporation
Corporate OfficesKeilasatama 3P.O. Box 7FI-02150 Espoo, FinlandTel. +358 (0)204 751Fax +358 (0)204 75 4496
www.kone.com
For further information please contact:Sanna KajeVice President, Investor RelationsTel. +358 (0)204 75 4705
KONE as a companyAt KONE, our mission is to improve the flow of urban life. As a global leader in the elevator and escalator industry, KONE provides elevators, escalators and automatic building doors, as well as solutions for maintenance and modernization to add value to buildings throughout their life cycle. Through more effective People Flow®, we make people’s journeys safe, convenient and reliable, in taller, smarter buildings. In 2017, KONE had annual sales of EUR 8.9 billion, and at the end of the year over 55,000 employees. KONE class B shares are listed on the Nasdaq Helsinki Ltd. in Finland. www.kone.com
This bulletin contains forward-looking statements that are based on the current expectations, known factors, decisions and plans of the management of KONE. Although the management believes that the expectations reflected in such forward-looking statements are reasonable, no assurance can be given that such expectations will prove to be correct. Accordingly, results could differ materially from those implied in the forward-looking statements as a result of, among other factors, changes in economic, market and competitive conditions, changes in the regulatory environment and other govern-ment actions as well as fluctuations in exchange rates.