Komal Lalwani Final
51
FINANCIAL PERFORMANCE ANALYSIS 1
description
KOMAL LALWANI
Transcript of Komal Lalwani Final

FINANCIAL PERFORMANCE ANALYSIS 1

CONTENTS
FINANCIAL PERFORMANCE ANALYSIS 2
ABSTRACT
Financial analysis is the process of identifying the financial
strengths and weakness of the firm by properly establishing the relations
ship between the items of the balance sheet and profit loss account.
Financial analysis can be undertaken by management of the firm, or by
parties outside the firm, viz. owners, creditors, investors and others. The
nature of analysis will differ depending on the purpose of analyst.
Management, creditors, investors and others to form
judgment about the operating performance and financial position of the
firm use the information contained in this statements can get further
insight about the financial strengths and weakness of the firm to make
their best use and to be able to spot out financial weakness of the firm to
take suitable corrective actions.
Thus financial analysis is the starting point for making
plans, before using any sophisticated forecasting and planning
procedures. Understanding the past is a prerequisite for anticipating
future.
LIST OF THE TABLES
FINANCIAL PERFORMANCE ANALYSIS 3

TABLE-NO PARTICULARS PAGE-NO
FINANCIAL PERFORMANCE ANALYSIS 4
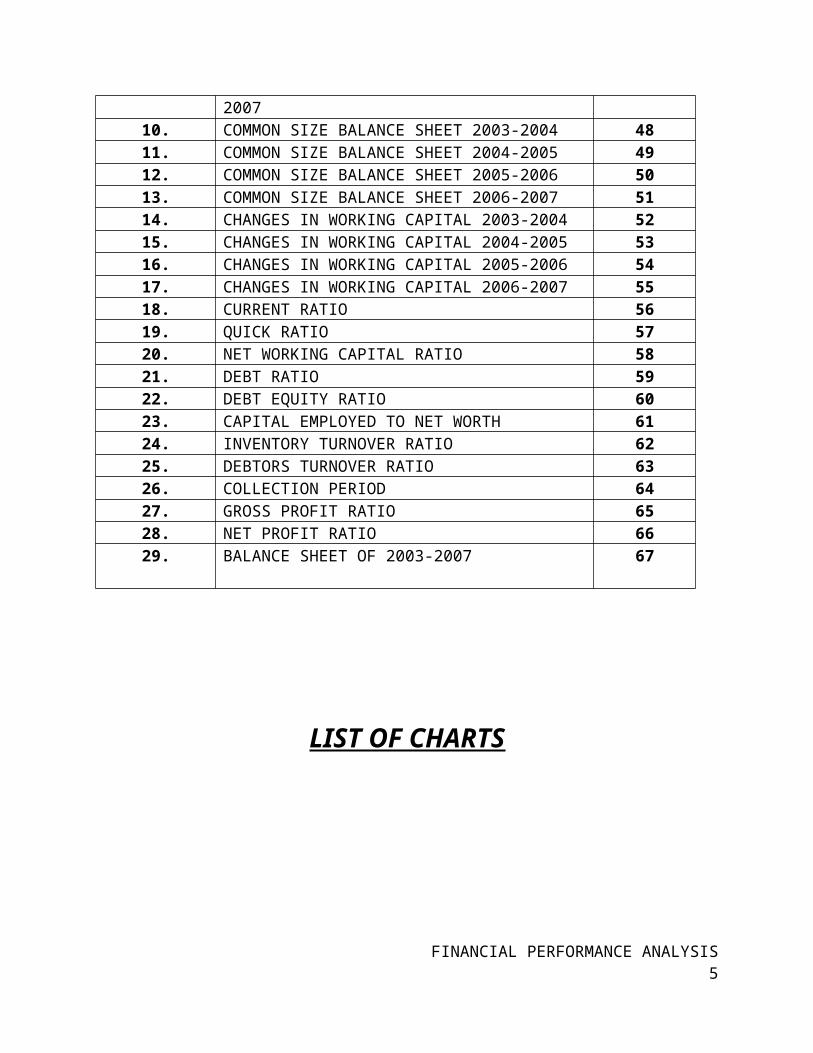
1. COMPARITIVE INCOME STATEMENT 2003-2004 392. COMPARITIVE INCOME STATEMENT 2004-2005 403. COMPARITIVE INCOME STATEMENT 2005-2006 414. COMPARITIVE INCOME STATEMENT 2006-2007 425. COMPARITIVE BALANCE SHEET 2003-2004 436. COMPARITIVE BALANCE SHEET 2004-2005 447. COMPARITIVE BALANCE SHEET 2005-2006 458. COMPARITIVE BALANCE SHEET 2006-2007 469. COMMON SIZE INCOME STATEMENT 2003-2007 4710. COMMON SIZE BALANCE SHEET 2003-2004 4811. COMMON SIZE BALANCE SHEET 2004-2005 4912. COMMON SIZE BALANCE SHEET 2005-2006 5013. COMMON SIZE BALANCE SHEET 2006-2007 5114. CHANGES IN WORKING CAPITAL 2003-2004 5215. CHANGES IN WORKING CAPITAL 2004-2005 5316. CHANGES IN WORKING CAPITAL 2005-2006 5417. CHANGES IN WORKING CAPITAL 2006-2007 5518. CURRENT RATIO 5619. QUICK RATIO 5720. NET WORKING CAPITAL RATIO 5821. DEBT RATIO 5922. DEBT EQUITY RATIO 6023. CAPITAL EMPLOYED TO NET WORTH 6124. INVENTORY TURNOVER RATIO 6225. DEBTORS TURNOVER RATIO 6326. COLLECTION PERIOD 6427. GROSS PROFIT RATIO 6528. NET PROFIT RATIO 6629. BALANCE SHEET OF 2003-2007 67
LIST OF CHARTS
FINANCIAL PERFORMANCE ANALYSIS 5

FINANCIAL PERFORMANCE ANALYSIS 6
TABLE-NO PARTICULARS PAGE-NO
1. LEQUIDITY RATIOS
1.1.CURRENT RATIO1.2.QUICK RATIO1.3.NET WORKING CAPITAL RATIO
565758
2. LEVERAGE RATIOS
2.1.DEBT RATIO2.2.DEBT EQUITY RATIO2.3.CAPITAL EMPLOYED TO NET WORTH
596061
3. ACTIVITY RATIOS
3.1.INVENTORY TURNOVER RATIO3.2.DEBTORS TURNOVER RATIO3.3.COLLECTION PERIOD
626364
4. PROFITABILITY RATIOS
4.1.GROSS PROFIT RATIO4.2.NET PROFIT RATIO
6566
I
FINANCIAL PERFORMANCE ANALYSIS 7
INTRODUCTION
In our present day economy, finance is defined as the provision of
money at the time when it is required. Every enterprise, whether big, medium of
small, needs finance to carry its operations and to achieve its targets. In fact,
finance is so indispensable today that it is rightly said to be the lifeblood of an
FINANCIAL PERFORMANCE ANALYSIS 8

enterprise. Without adequate finance, no enterprise can possibly accomplish its
objectives.
Financial management is applicable to every type of organization,
irrespective of its size kind of nature. It is as useful to a small concern as to a big
unit. A trading concern gets the same utility from its application as a
manufacturing unit may expect. This subject is important and useful for all types of
ownership organizations. Where there is a use of finance. Financial management is
helpful. Every management aims to utilize its funds in a best possible and
profitable way. So this subject is acquiring a universal applicability.
It is indispensable in any organization as helps in:
(I) Financial planning and successful promotion of an enterprise;
(II) Acquisition of funds as and when required at the minimum possible
cost;
(III) Proper use and allocation of funds;
(IV) Taking sound financial decisions ;
(V) Improving the profitability through financial controls;
(VI) Increasing the wealth of the investors and the nation; and
(vii) Promoting and mobilizing individual and corporate savings.
OBJECTIVES OF FINANCIAL MANAGEMENT
Financial management is concerned with procurement and use of
funds. Its main aim is to use business funds in such a way that the firm’s
value/earnings are maximized. There are various alternatives available for using
business funds. Each alternative course has to be evaluated in detail.
FINANCIAL PERFORMANCE ANALYSIS 9

The pros and cons of various decisions have to look into before
making a final selection. The decisions will have take into consideration the
commercial strategy of the business. Financial management provides a framework
for selecting a proper course of action and deciding a viable commercial strategy.
The main objective of a business is to maximize the owner’s economic welfare.
This objective can be achieved by:
1. Profit Maximization
2. Wealth maximization
1. Profit maximization:
Profit earning is the main aim of every economic activity. A business
being an economic institution must earn profit to cover its costs and provide funds
for growth. No business can service without earning profit. Profits are a measure of
efficiency of a business enterprise. Profits also serve as a protection against risks
which cannot be ensured. The accumulated profits enable a business to face risks
like fall in prices, competition from other units, adverse government policies etc.
Thus, profit maximization is considered as the main objective of business:
(i) When profit – earning is the aim of business then profit maximization should
be the obvious objective.
(ii) Profitability is a barometer for measuring efficiency and economic prosperity
of a business enterprise, thus, profit maximization is justified on the grounds
of rationality.
(iii) Economic and business conditions do not remain same at all the times. There
may be adverse business conditions like recession, depression, severe
competition etc. A business will be able to service under unfavorable situation
only if it has some past earnings to rely upon. Therefore a business should try
to earn more and more when situation is favorable.
FINANCIAL PERFORMANCE ANALYSIS 10

(iv) Profits are the main sources of finance for the growth of a business. So, a
business should aim at maximization of profits for enabling its growth and
development.
(v) Profitability is essential for fulfilling social goals also. A firm by pursuing the
objective of profit maximization also maximizes socio- economic welfare.
2. Wealth maximization
Wealth maximization is the appropriate objective of an enterprise
financial theory asserts that wealth maximization is the single substitute for
stockholder’s utility. When the firm maximizes the stockholder’s wealth, the
individual stockholder can use this wealth to maximize his individual utility. It
means that by maximizing stockholder’s wealth firm is operating consistently
towards maximizing stockholder’s utility.
OBJECTIVES OF STUDY
RESEARCH METHODOLOGY
FINANCIAL PERFORMANCE ANALYSIS 11

The research design refers to preplanning of what a researcher does in
his study. The design adopted in the study comes under exploratory and
evaluatory research. Since the data collected from the financial statements of the
company is analyzed under various financial and tactical tools.
Data collection;
The study is based on the two types data is obtained from the tata
VEHICLEs ltd., chittoor.
They are:
Secondary data
Secondary Data;
Secondary data is based on the past data i.e. [three years Annual Reports
2011-2014
FINANCIAL PERFORMANCE ANALYSIS 12

II
FINANCIAL PERFORMANCE ANALYSIS 13
COMPANY PROFILE
IIIFINANCIAL PERFORMANCE ANALYSIS 14

Tata VEHICLEs Limited (formerly TELCO, short for Tata Engineering and Locomotive Company) is an Indian multinational automotive manufacturing company headquartered in Mumbai, Maharashtra, India and a subsidiary of the Tata Group. Its products include passenger cars, trucks, vans, coaches, buses, construction equipment and military vehicles. It is the world's seventeenth-largest VEHICLE vehicle manufacturing company, fourth-largest truck manufacturer and second-largest bus manufacturer by volume.[7]
Tata VEHICLEs has auto manufacturing and assembly plants in Jamshedpur, Pantnagar, Lucknow, Sanand, Dharwad and Pune in India, as well as in Argentina, South Africa, Thailand and the United Kingdom. It has research and development centres in Pune, Jamshedpur, Lucknow and Dharwad, India, and in South Korea, Spain, and the United Kingdom. Tata VEHICLEs' principal subsidiaries include the British premium car maker Jaguar Land Rover (the maker of Jaguar, Land Rover and Range Rover cars) and the South Korean commercial vehicle manufactuer Tata Daewoo. Tata VEHICLEs has a bus manufacturing joint venture with Marcopolo S.A. (Tata Marcopolo), a construction equipment manufacturing joint venture with Hitachi (Tata Hitachi Construction Machinery), and a joint venture with Fiat which manufactures automotive components and Fiat and Tata branded vehicles.
Founded in 1945 as a manufacturer of locomotives, the company manufactured its first commercial vehicle in 1954 in a collaboration with Daimler-Benz AG, which ended in 1969. Tata VEHICLEs entered the passenger vehicle market in 1991 with the launch of the Tata Sierra, becoming the first Indian manufacturer to achieve the capability of developing a competitive indigenous automobile.[8] In 1998, Tata launched the first fully indigenous Indian passenger car, the Indica, and in 2008 launched the Tata Nano, the world's most affordable car. Tata VEHICLEs acquired the South Korean truck manufacturer Daewoo Commercial Vehicles Company in 2004 and purchased Jaguar Land Rover from Ford in 2008.
FINANCIAL PERFORMANCE ANALYSIS 15

Tata VEHICLEs is listed on the Bombay Stock Exchange, where it is a constituent of the BSE SENSEX index, the National Stock Exchange of India and the New York Stock Exchange. Tata VEHICLEs is ranked 314th in the 2012 Fortune Global 500 ranking of the world's biggest corporations
ANALYSIS AND
INTERPRETATION
FINANCIAL PERFORMANCE ANALYSIS 16

INTRODUCTION TO FINANCIAL STATEMENTS
A financial statement is a collection of data organized according to logical and
consistent accounting procedures. Its purpose is to convey an understanding of
some financial aspects of a business firm. It may show a position at a movement
in time, as in the case of balance sheet, or may reveal a series of activities over
a given period of time, as in the case of an income statement.
Objectives of financial statements:
Financial statements are the sources of information on the basis of which
conclusions are drawn about the profitability and financial position of a
concern. They are the major means employed by firms to present their financial
situation of owners, creditors and the general public. The primary objective of
financial statements is to assist in decision making. The Accounting Principles
Board of America (APB) states the following objectives of financial statements:
(i) To provide reliable financial information about economic resources and
obligations of business firm.
(ii) To provide other needed information about changes in such economic
resources and obligations.
(iii) To provide reliable information about changes in net resources (resources less
obligations) arising out of business activities.
FINANCIAL PERFORMANCE ANALYSIS 17

(iv) To provide financial information that assists in estimating the earning
potentials of business.
(v) To disclose, to the extent possible, other information related to the financial
statements that is relevant to the needs of the users of these statements.
FINANCIAL STATEMENT ANALYSIS
Financial analysis is the process of determining financial strengths
and weakness of the firm by establishing strategic relationship between the items
of the items of the balance sheet, profit and loss account and other operative data.
In the words of Myers, “financial statements analysis is largely a study of
relationship among various financial factors in a business as disclosed by a single
set of statements, and a study of the trend of these factors as shown in series of
statements
4. PROFITABILITY RATIO:
The profitability ratios are used to calculate the efficiency of operating of the company. Profits are ultimate goal of every company and it should be continuously evaluated in terms of profits. Generally two major profits are calculated, they are
i. Gross profit ratio
ii. Net profit ratio
iii. Expense ratio
iv. Return on capital employed
i.Gross profit ratio:
FINANCIAL PERFORMANCE ANALYSIS 18

The first profitability ratio in relation to sales reflects the efficiency
with which management produces each unit of product. It is calculated by dividing
the Gross Profit with Sales.
Gross profitGross Profit ratio = x 100
Sales
ii. Net profit ratio:
Net profit ratio explains the net profit of the company after paying
taxes of particular period. It establishes relation between net profit and sales.
Net Profit Net profit ratio= Sales
Expense ratio:
Expense/sales X100
Return on capital employed:
FINANCIAL PERFORMANCE ANALYSIS 19

Profit before interest and tax/capital employed x100
COMPARITIVE INCOME STATEMENT
FINANCIAL PERFORMANCE ANALYSIS 20

Comparative income statement of tata VEHICLEs ltd., 2003-2004
Particulars 31-3-2011 31-3-2012 changePercentag
e
Sales 201486573 130517437-70969136 -35.22%
Less: Cost of goods sold 239132131 155574480-83557651 -34.94%
Gross profit/loss -37645558 -25057043 12588515 -33.44%
Less: Operating expenses 12609835 10532587 -2077248 -16.47%
Operating profit/loss -50255393 -35589630 14665763 -29.18%
Add: Other income
Miscellaneous income 9500299 1639130 -7861169 -82.75%
Interest received 118481 129866 11385 9.61%
Profit/loss before interest -40636613 -33820634 6815979 -16.77%
Less: Interest paid 26777116 28813070 2035954 7.60%
Profit/loss after interest -67413729 -62633704 4780025 -7.09%
Less: Loss up to last year 231799275 299213004 67413729 29.08%
Net loss cumulative -299213004-361846708-62633704 20.93%
Source: Annual Reports of TML.
Interpretation:
FINANCIAL PERFORMANCE ANALYSIS 21
From the above table it was analyzed that sales and cost of goods sold were decreased so gross loss also decreased, and there was high decrease in miscellaneous income (i.e. 82.75%) loss increased due to lack of operational efficiency.
Comparative income statement of tata VEHICLEs ltd., 2004-2005
Particulars 31-3-2012 31-3-2013 changePercentag
eSales 130517437 96920394-33597043 -25.74%
Less: Cost of goods sold 155574480 102243876-53330604 -34.28%
Gross profit/loss -25057043 -5323482 19733561 -78.75%
Less: Operating expenses 10532587 11133862 601275 5.71%
Operating profit/loss -35589630 -16457344 19132286 -53.76%
Add: Other income
Miscellaneous income 1639130 4383327 2744197 167.42%
Interest received 129866 143577 13711 10.56%
Profit/loss before interest -33820634 -11930440 21890194 -64.72%
Less: Interest paid 28813070 23326176 -5486894 -19.04%
Profit/loss after interest -62633704 -35256616 27377088 -43.71%
Less: Loss up to last year 299213004 361846708 62633704 20.93%
Net loss cumulative -361846708-397103324-35256616 9.74%
Source: Annual Reports of TML.
Interpretation:
From the above table it was analyzed that the percentage decrease in cost of goods sold is more than the decrease in sales so gross loss also decreased due to reduce in the cost of raw materials. Even though increase in operating expenses operating loss decreased due to effective control of raw material cost.
FINANCIAL PERFORMANCE ANALYSIS 22

Comparative income statement of tata VEHICLEs ltd., 2005-2006
Particulars 31-3-2013 31-3-2014 changePercentag
eSales 96920394 124629657 27709263 28.59%
Less: Cost of goods sold 102243876 72877770-29366106 -28.72%
Gross profit/loss -5323482 51751887 57075369 -1072.14%
Less: Operating expenses 11133862 35468649 24334787 218.57%
Operating profit/loss -16457344 16283238 32740582 -198.94%
Add: Other income
Miscellaneous income 4383327 4664988 281661 6.43%
Interest received 143577 172981 29404 20.48%
Profit/loss before interest -11930440 21121207 33051647 -277.04%
Less: Interest paid 23326176 29320178 5994002 25.70%
Profit/loss after interest -35256616 -8198971 27057645 -76.74%
Less: Loss up to last year 361846708 397103324 35256616 9.74%
Net loss cumulative -397103324-405302295 -8198971 2.06%
Source: Annual Reports of TML.
Interpretation:
From the above table it was analyzed that sales percentage increased and at the same time cost of goods sold decreased so the firm earned gross profit due to high control in purchase of raw materials. Due to increase in operating expenses loss increased (2.06%) the firm has no control over the operating activities.
FINANCIAL PERFORMANCE ANALYSIS 23

COMPARITIVE BALANCE SHEET
FINANCIAL PERFORMANCE ANALYSIS 24

COMMON SIZE INCOME STATEMENT
FINANCIAL PERFORMANCE ANALYSIS 25

COMMON SIZE BALANCE SHEET
FINANCIAL PERFORMANCE ANALYSIS 26

RATIO ANALYSIS
FINANCIAL PERFORMANCE ANALYSIS 27

Table3: Capital employed to net worth
Years Capital employed Net Worth Ratio2003 325654257 61201511 5.322004 260575021 7940102 32.822005 287272474 -7955293 -36.112006 435610011 245159 1776.852007 352622327 -88281982 -3.99
Source: Annual Reports of TML
Interpretation:
From the above graph it was analyzed that capital employed to net
worth was 5.32%, increased to 32.83% in 2004, became negative in 2005,2007 and
in the year 2006 increased to 1776.85% due to changes in the value of net worth of
the firm.
FINANCIAL PERFORMANCE ANALYSIS 28

PROFITABILITY RATIOS
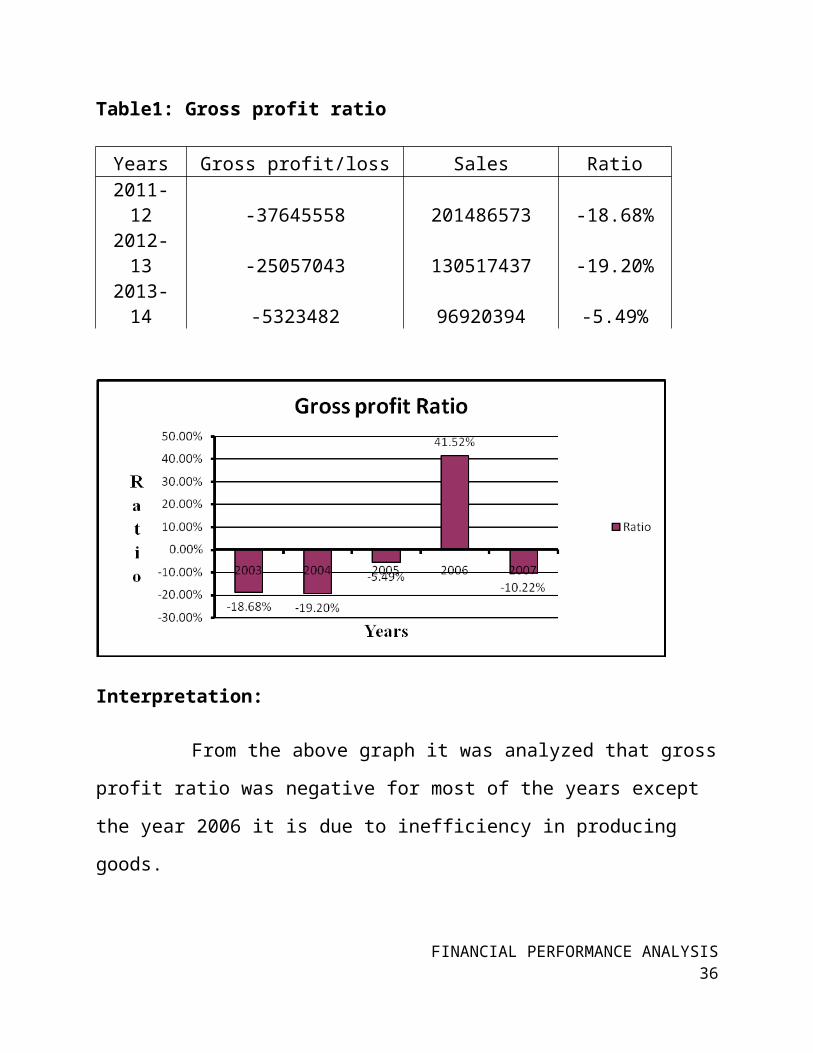
Table1: Gross profit ratio
Years Gross profit/loss Sales Ratio2011-12 -37645558 201486573 -18.68%2012-13 -25057043 130517437 -19.20%2013-14 -5323482 96920394 -5.49%
Interpretation:
From the above graph it was analyzed that gross profit ratio was
negative for most of the years except the year 2006 it is due to inefficiency in
producing goods.
FINANCIAL PERFORMANCE ANALYSIS 29

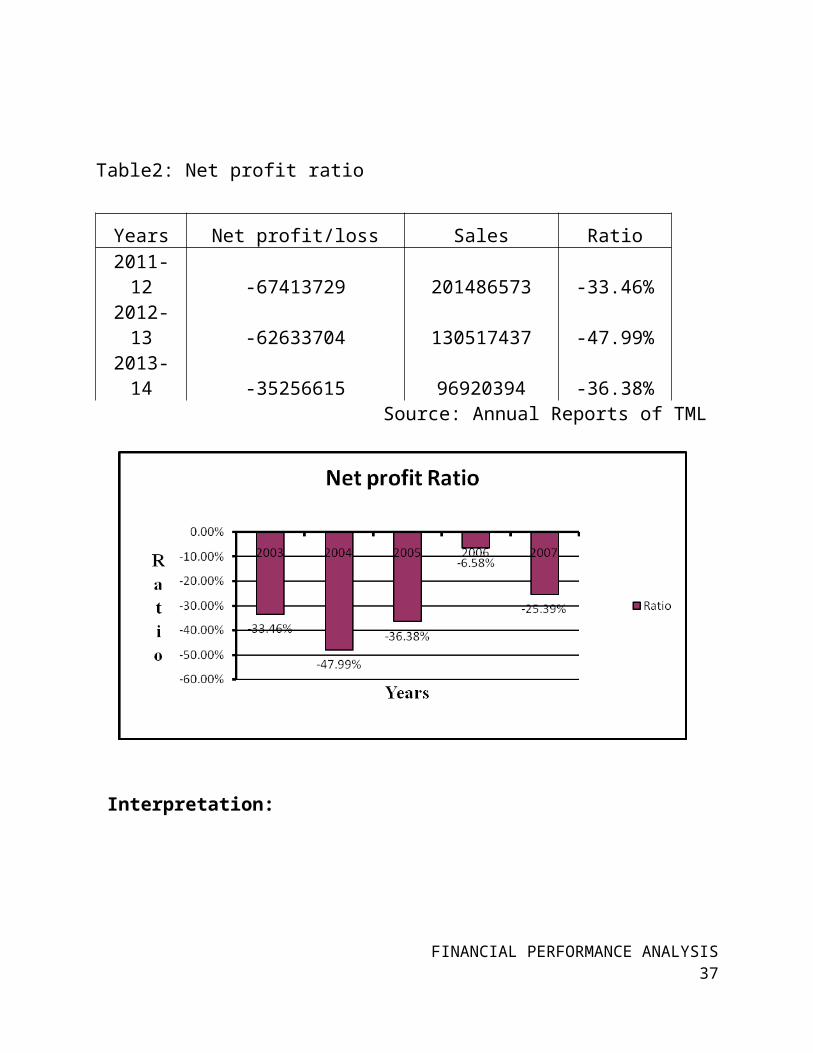
Table2: Net profit ratio
Years Net profit/loss Sales Ratio
2011-12 -67413729 201486573 -33.46%
2012-13 -62633704 130517437 -47.99%
2013-14 -35256615 96920394 -36.38%Source: Annual Reports of TML
Interpretation:
From the above graph it was analyzed that in all the years the net profit ratio is negative due to over all inefficiency in the firm.
FINANCIAL PERFORMANCE ANALYSIS 30
Balance sheet
FINANCIAL PERFORMANCE ANALYSIS 31

FINANCIAL PERFORMANCE ANALYSIS 32
Balance sheet of tata VEHICLEs ltd chittoor.for the years 2003-2007LIABILITIES 31-3-2011 31-3-2012 31-3-2013 31-3-2006 31-3-2007 ASSETSShare capital 140,958,700 140,960,300 140,961,400 141,140,700 142,553,600 F.D.S with banks
Reserves 219,357,188 228,727,884 248,088,004 264,309,028 268,006,835
Shares in other co-operative institutions
U.D.P 64,227 64,227 64,227 64,227 64,227
Loans to other co-operative factories
Reserves to be invested 24,703 24,703 24,703 24,703 24,703 Fixed assetsAuditfund 9,696 9,696 9,696 9,696 9,696 DefictsBorrowings 235,616,210 223,822,462 266,073,588 404,340,806 405,702,422 Cash on handDeposits 28,836,536 28,812,457 29,154,179 31,024,046 35,201,887 Cash at bank
Creditors 182,912,074 115,020,074 108,107,592 140,980,325 229,172,905Deposits with various agencies
Outstanding interest 6,094,478 27,190,688 40,525,798 49,024,989 46,928,301
Loans and advances to members
Debtors
Interest receivable
Closing stock Loss Total 813,873,812 764,632,491 833,009,187 1,030,918,520 1,127,664,576 Total
findings
FINDINGS
Cost of goods sold was more than the sales except the year 2006. So, the tata VEHICLEs ltd. got gross loss in most of the years.
Operating loss decreased up to the year 2006 and then increased in the year 2007.
The tata VEHICLEs ltd. did not earned net profit in all the years.
FINANCIAL PERFORMANCE ANALYSIS 33

It had been maintaining high inventory levels for all the years. In most of the years debtor’s collection period was very high. Most of the funds rose through debts with high interest rates. Most of the funds were lost in operations.
FINANCIAL PERFORMANCE ANALYSIS 34

Suggestions
SUGGESSIONS
TML should adopt cost control measures by drawing inspiration from prospering VEHICLE factories.
TML should reduce operating and administrative expenses, it will increase over all efficiency of the firm.
A high level of debt introduces inflexibility in the firms operations due to increaseasing interference and pressures from creditors. A high debt company is able to borrow funds on
FINANCIAL PERFORMANCE ANALYSIS 35
very restrictive terms and conditions. So, it should raise owners funds.
TML can adopt forward integration strategy by opening retail outlets where its own VEHICLE can be sold. It increases revenues one hand and cash position on the other.
FINANCIAL PERFORMANCE ANALYSIS 36
Conclusion
FINANCIAL PERFORMANCE ANALYSIS 37

CONCLUSION
The present study of “FINANCIAL PERFORMANCE ANALYSIS IN TATA VEHICLES LTD,.” Was conducted with the help of annual report. Various financial tools are used in the study from the ratio analysis it has been found out that the average collection period of the company is high and capital gearing is low. To extent possible the study has achieved its stated objectives. It is on the part of the company to accept the suggestions.
TML Profitability position was deteriorated year by year, liquidity position also moderate, long term solvency of the firm is also moderate due to high debts, the firm’s efficiency in utilizing assets is also very low.
Finally the study helped me to acquire practical knowledge that was only over by books and papers alone. I take up this opportunity to thank one and all for making this study a complete one.
FINANCIAL PERFORMANCE ANALYSIS 38

BEBLIOGRAPHY
FINANCIAL PERFORMANCE ANALYSIS 39

BIBILOGRAPHY
BOOKS
Financial Management I. M. Pandey Ninth Edition Vikash Publishing house
Pvt ltd.
Financial Management Theory and Practice Prasanna Chandra Sixth
Edition Tata Mc Graw Hill Publishing company.
Management Accounting Principles and Practice R. K. Sharma Sahashi K.
Guptha Eigth edition kalyani publishiers.
Dr .S.N. Maheswari-financial management G.G.S. Indraprasatha university ,
new delhi.
WEBSITES
www.cliffsnotes.com
www.financial-education.com
FINANCIAL PERFORMANCE ANALYSIS 40

THANK YOU
FINANCIAL PERFORMANCE ANALYSIS 41