Seven & i Holdings Co., Ltd. and its consolidated subsidiaries
KOLAO HOLDINGS AND ITS SUBSIDIARIES CONSOLIDATED FINANCIAL STATEMENTS AS OF AND FOR THE YEARS ENDED DECEMBER 31, 2013 AND 2012, AND INDEPENDENT AUDITORS’ REPORT
Independent Auditors’ Report English Translation of a Report Originally Issued in Korean To the Shareholders and Board of Directors of KOLAO Holdings: We have audited the accompanying consolidated financial statements of KOLAO Holdings(the “Company”) and its subsidiaries. The consolidated financial statements consist of the consolidated statement of financial position as of December 31, 2013 and 2012, and the related consolidated statement of income, consolidated statement of changes in shareholders’ equity and consolidated statement of cash flows, all expressed in US dollars, for the years ended December 31, 2013 and 2012. The Company’s management is responsible for the preparation and fair presentation of the consolidated financial statements and our responsibility is to express an opinion on these consolidated financial statements based on our audits. We conducted our audits in accordance with auditing standards generally accepted in the Republic of Korea. Those standards require that we plan and perform the audit to obtain reasonable assurance about whether the consolidated financial statements are free of material misstatement. An audit includes examining, on a test basis, evidence supporting the amounts and disclosures in the consolidated financial statements. An audit also includes assessing the accounting principles used and significant estimates made by management, as well as evaluating the overall consolidated financial statement presentation. We believe that our audits provide a reasonable basis for our opinion. In our opinion, the consolidated financial statements referred to above present fairly, in all material respects, the financial position of the Company and its subsidiaries as of December 31, 2013 and 2012, and the results of its operations, changes in its equity and its cash flows for the years then ended in conformity with International Financial Reporting Standards. Auditing standards and their application in practice vary among countries. The procedures and practices utilized in the Republic of Korea to audit the accompanying consolidated financial statements may differ from those generally accepted and applied in other countries. Accordingly, this report and the accompanying consolidated financial statements are for use by those knowledgeable about Korean auditing standards and their application in practice.
March 20, 2014
Notice to Readers
This report is effective as of March 20, 2014, the auditors’ report date. Certain subsequent events or circumstances may have occurred between the auditors’ report date and the time the auditors’ report is read. Such events or circumstances could significantly affect the accompanying consolidated financial statements and may result in modifications to the auditors’ report.
KOLAO HOLDINGS AND ITS SUBSIDIARIES CONSOLIDATED FINANCIAL STATEMENTS AS OF AND FOR THE YEARS ENDED DECEMBER 31, 2013 AND 2012
The accompanying consolidated financial statements including all footnote disclosures were prepared by and are the responsibility of the Company. Oh, Se Young Chief Executive Officer KOLAO Holdings
KOLAO HOLDINGS AND ITS SUBSIDIARIES
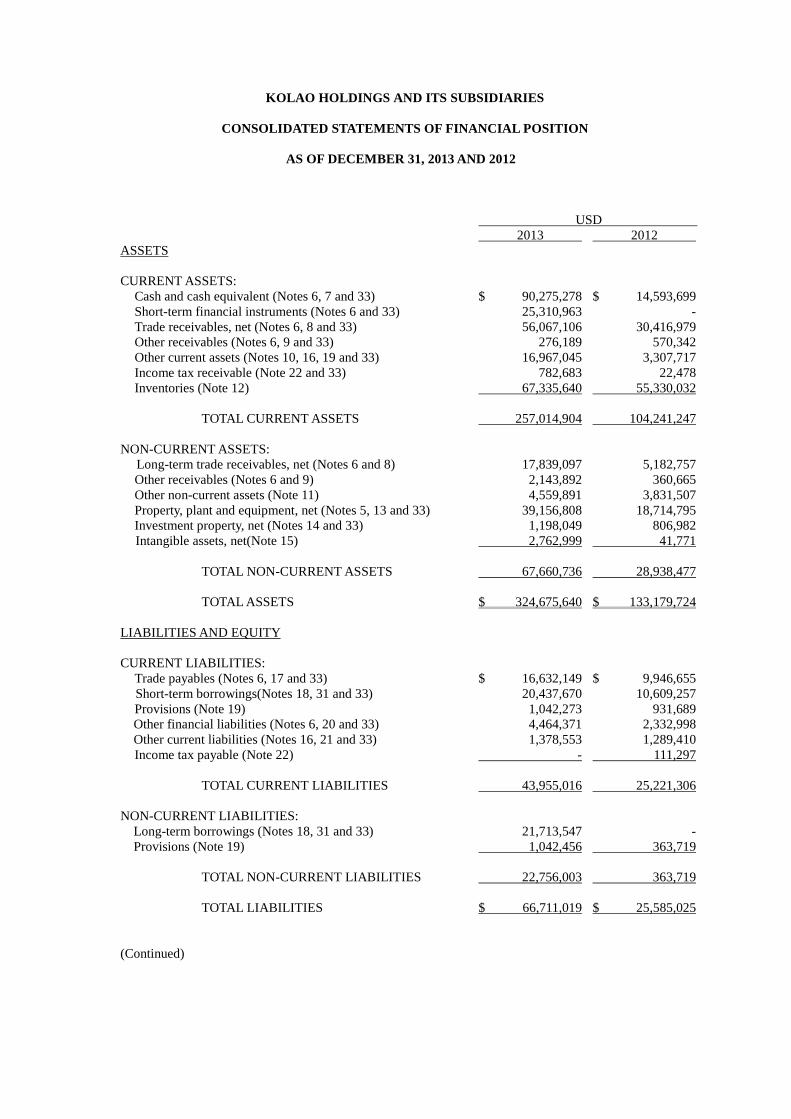
CONSOLIDATED STATEMENTS OF FINANCIAL POSITION
AS OF DECEMBER 31, 2013 AND 2012
USD 2013 2012 ASSETS CURRENT ASSETS: Cash and cash equivalent (Notes 6, 7 and 33) $ 90,275,278 $ 14,593,699 Short-term financial instruments (Notes 6 and 33) 25,310,963 - Trade receivables, net (Notes 6, 8 and 33) 56,067,106 30,416,979 Other receivables (Notes 6, 9 and 33) 276,189 570,342 Other current assets (Notes 10, 16, 19 and 33) 16,967,045 3,307,717 Income tax receivable (Note 22 and 33) 782,683 22,478 Inventories (Note 12) 67,335,640 55,330,032
TOTAL CURRENT ASSETS 257,014,904 104,241,247 NON-CURRENT ASSETS:
Long-term trade receivables, net (Notes 6 and 8) 17,839,097 5,182,757 Other receivables (Notes 6 and 9) 2,143,892 360,665 Other non-current assets (Note 11) 4,559,891 3,831,507
Property, plant and equipment, net (Notes 5, 13 and 33) 39,156,808 18,714,795 Investment property, net (Notes 14 and 33) 1,198,049 806,982
Intangible assets, net(Note 15) 2,762,999 41,771
TOTAL NON-CURRENT ASSETS 67,660,736 28,938,477
TOTAL ASSETS $ 324,675,640 $ 133,179,724 LIABILITIES AND EQUITY CURRENT LIABILITIES: Trade payables (Notes 6, 17 and 33) $ 16,632,149 $ 9,946,655
Short-term borrowings(Notes 18, 31 and 33) 20,437,670 10,609,257 Provisions (Note 19) 1,042,273 931,689
Other financial liabilities (Notes 6, 20 and 33) 4,464,371 2,332,998 Other current liabilities (Notes 16, 21 and 33) 1,378,553 1,289,410 Income tax payable (Note 22) - 111,297
TOTAL CURRENT LIABILITIES 43,955,016 25,221,306 NON-CURRENT LIABILITIES:
Long-term borrowings (Notes 18, 31 and 33) 21,713,547 - Provisions (Note 19) 1,042,456 363,719
TOTAL NON-CURRENT LIABILITIES 22,756,003 363,719
TOTAL LIABILITIES $ 66,711,019 $ 25,585,025 (Continued)

KOLAO HOLDINGS AND ITS SUBSIDIARIES
CONSOLIDATED STATEMENTS OF FINANCIAL POSITION (CONT INUED)
AS OF DECEMBER 31, 2013 AND 2012
USD 2013 2012 EQUITY: Share capital (Note 23) $ 11,290,000 $ 9,600,000 Other issued capital (Note 23 and 35) 145,102,488 21,281,621 Retained earnings (Note 24) 101,045,650 76,713,078 Non-controlling interests 526,483 -
TOTAL EQUITY 257,964,621 107,594,699 TOTAL LIABILITIES AND EQUITY $ 324,675,640 $ 133,179,724
See accompanying notes to consolidated financial statements.
KOLAO HOLDINGS AND ITS SUBSIDIARIES
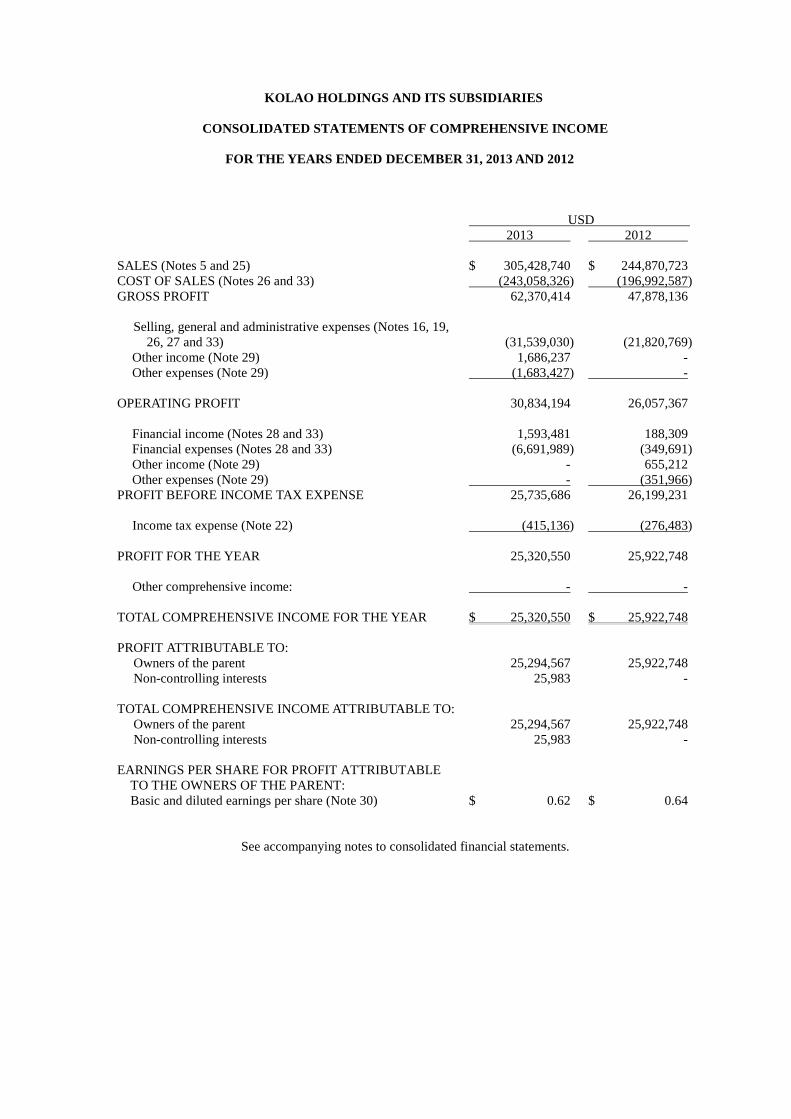
CONSOLIDATED STATEMENTS OF COMPREHENSIVE INCOME
FOR THE YEARS ENDED DECEMBER 31, 2013 AND 2012
USD 2013 2012
SALES (Notes 5 and 25) $ 305,428,740 $ 244,870,723 COST OF SALES (Notes 26 and 33) (243,058,326) (196,992,587) GROSS PROFIT 62,370,414 47,878,136
Selling, general and administrative expenses (Notes 16, 19, 26, 27 and 33) (31,539,030) (21,820,769)
Other income (Note 29) 1,686,237 - Other expenses (Note 29) (1,683,427) -
OPERATING PROFIT 30,834,194 26,057,367 Financial income (Notes 28 and 33) 1,593,481 188,309 Financial expenses (Notes 28 and 33) (6,691,989) (349,691) Other income (Note 29) - 655,212 Other expenses (Note 29) - (351,966)
PROFIT BEFORE INCOME TAX EXPENSE 25,735,686 26,199,231
Income tax expense (Note 22) (415,136) (276,483) PROFIT FOR THE YEAR 25,320,550 25,922,748
Other comprehensive income: - - TOTAL COMPREHENSIVE INCOME FOR THE YEAR $ 25,320,550 $ 25,922,748 PROFIT ATTRIBUTABLE TO:
Owners of the parent 25,294,567 25,922,748 Non-controlling interests 25,983 -
TOTAL COMPREHENSIVE INCOME ATTRIBUTABLE TO:
Owners of the parent 25,294,567 25,922,748 Non-controlling interests 25,983 -
EARNINGS PER SHARE FOR PROFIT ATTRIBUTABLE
TO THE OWNERS OF THE PARENT: Basic and diluted earnings per share (Note 30) $ 0.62 $ 0.64
See accompanying notes to consolidated financial statements.
KOLAO HOLDINGS AND ITS SUBSIDIARIES
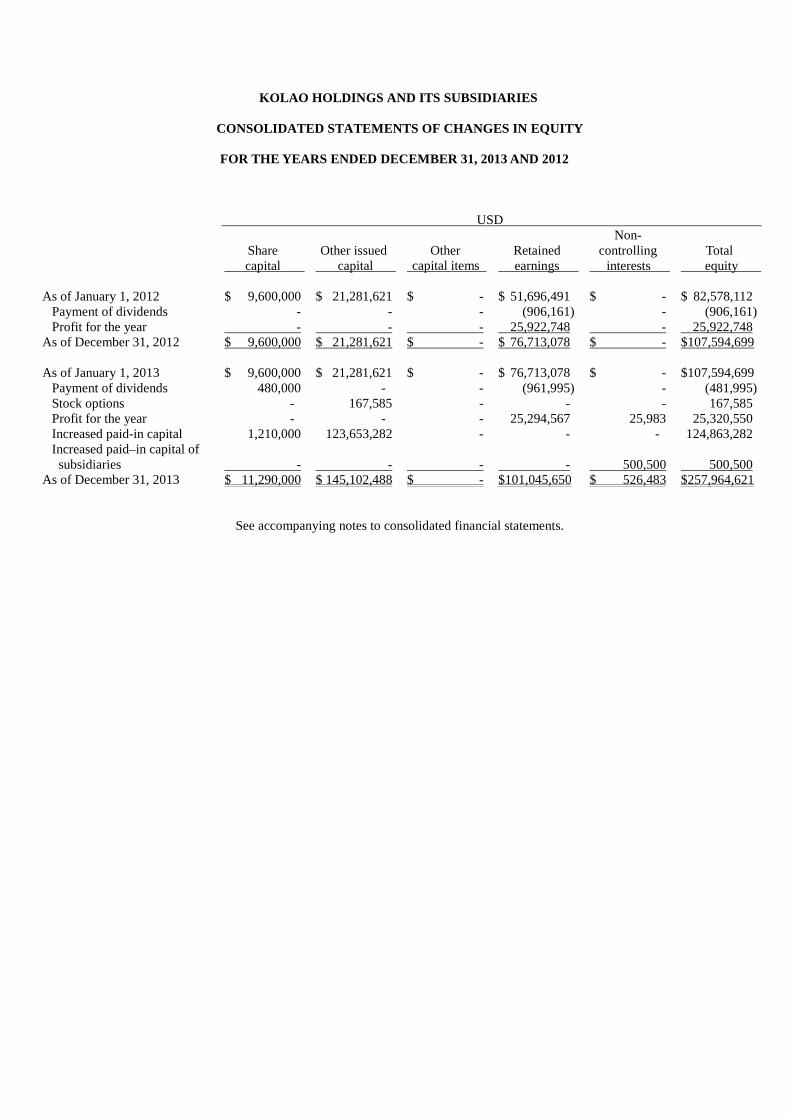
CONSOLIDATED STATEMENTS OF CHANGES IN EQUITY
FOR THE YEARS ENDED DECEMBER 31, 2013 AND 2012
USD
Share capital
Other issued capital
Other
capital items
Retained earnings
Non-controlling
interests
Total equity
As of January 1, 2012 $ 9,600,000 $ 21,281,621 $ - $ 51,696,491 $ - $ 82,578,112
Payment of dividends - - - (906,161) - (906,161) Profit for the year - - - 25,922,748 - 25,922,748
As of December 31, 2012 $ 9,600,000 $ 21,281,621 $ - $ 76,713,078 $ - $107,594,699 As of January 1, 2013 $ 9,600,000 $ 21,281,621 $ - $ 76,713,078 $ - $107,594,699
Payment of dividends 480,000 - - (961,995) - (481,995) Stock options - 167,585 - - - 167,585 Profit for the year - - - 25,294,567 25,983 25,320,550 Increased paid-in capital 1,210,000 123,653,282 - - - 124,863,282 Increased paid–in capital of subsidiaries - - - - 500,500 500,500
As of December 31, 2013 $ 11,290,000 $ 145,102,488 $ - $101,045,650 $ 526,483 $257,964,621
See accompanying notes to consolidated financial statements.
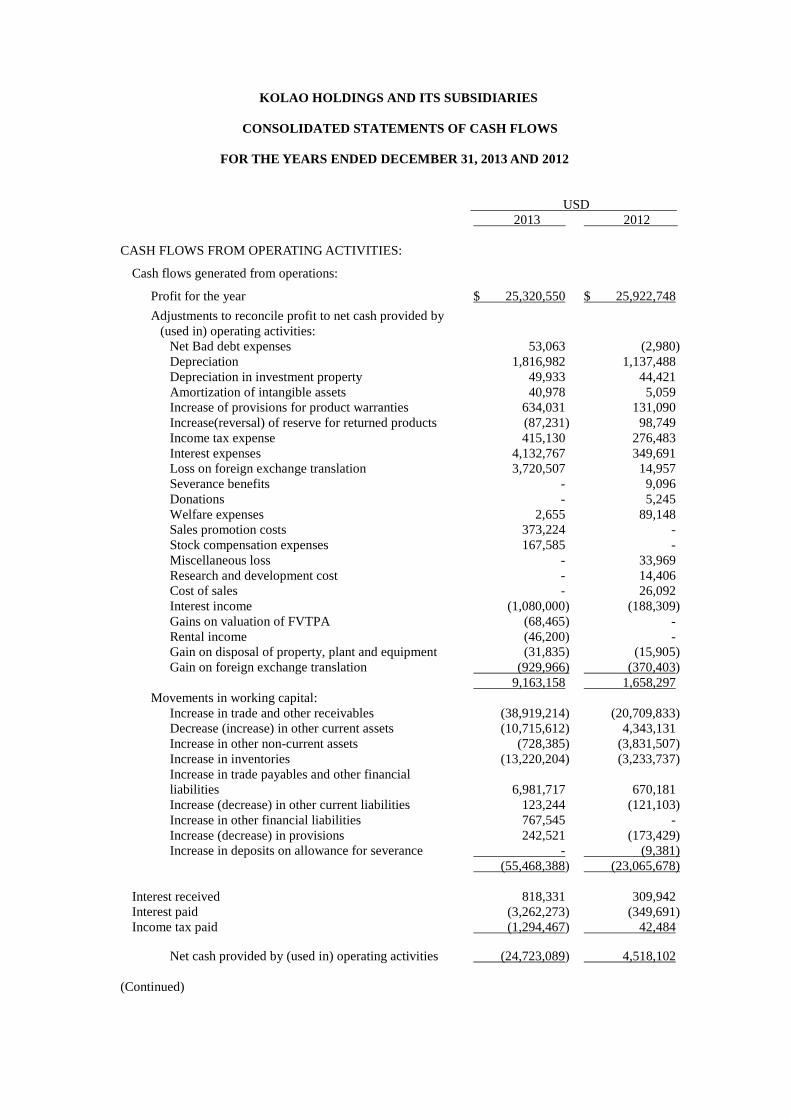
KOLAO HOLDINGS AND ITS SUBSIDIARIES
CONSOLIDATED STATEMENTS OF CASH FLOWS
FOR THE YEARS ENDED DECEMBER 31, 2013 AND 2012
USD 2013 2012
CASH FLOWS FROM OPERATING ACTIVITIES:
Cash flows generated from operations:
Profit for the year $ 25,320,550 $ 25,922,748 Adjustments to reconcile profit to net cash provided by
(used in) operating activities: Net Bad debt expenses 53,063 (2,980) Depreciation 1,816,982 1,137,488 Depreciation in investment property 49,933 44,421 Amortization of intangible assets 40,978 5,059 Increase of provisions for product warranties 634,031 131,090 Increase(reversal) of reserve for returned products (87,231) 98,749 Income tax expense 415,130 276,483 Interest expenses 4,132,767 349,691 Loss on foreign exchange translation 3,720,507 14,957 Severance benefits - 9,096 Donations - 5,245 Welfare expenses 2,655 89,148 Sales promotion costs 373,224 - Stock compensation expenses 167,585 - Miscellaneous loss - 33,969 Research and development cost - 14,406 Cost of sales - 26,092 Interest income (1,080,000) (188,309) Gains on valuation of FVTPA (68,465) - Rental income (46,200) - Gain on disposal of property, plant and equipment (31,835) (15,905) Gain on foreign exchange translation (929,966) (370,403)
9,163,158 1,658,297 Movements in working capital:
Increase in trade and other receivables (38,919,214) (20,709,833) Decrease (increase) in other current assets (10,715,612) 4,343,131 Increase in other non-current assets (728,385) (3,831,507) Increase in inventories (13,220,204) (3,233,737) Increase in trade payables and other financial liabilities 6,981,717 670,181 Increase (decrease) in other current liabilities 123,244 (121,103) Increase in other financial liabilities 767,545 - Increase (decrease) in provisions 242,521 (173,429) Increase in deposits on allowance for severance - (9,381)
(55,468,388) (23,065,678)
Interest received 818,331 309,942 Interest paid (3,262,273) (349,691) Income tax paid (1,294,467) 42,484
Net cash provided by (used in) operating activities (24,723,089) 4,518,102
(Continued)
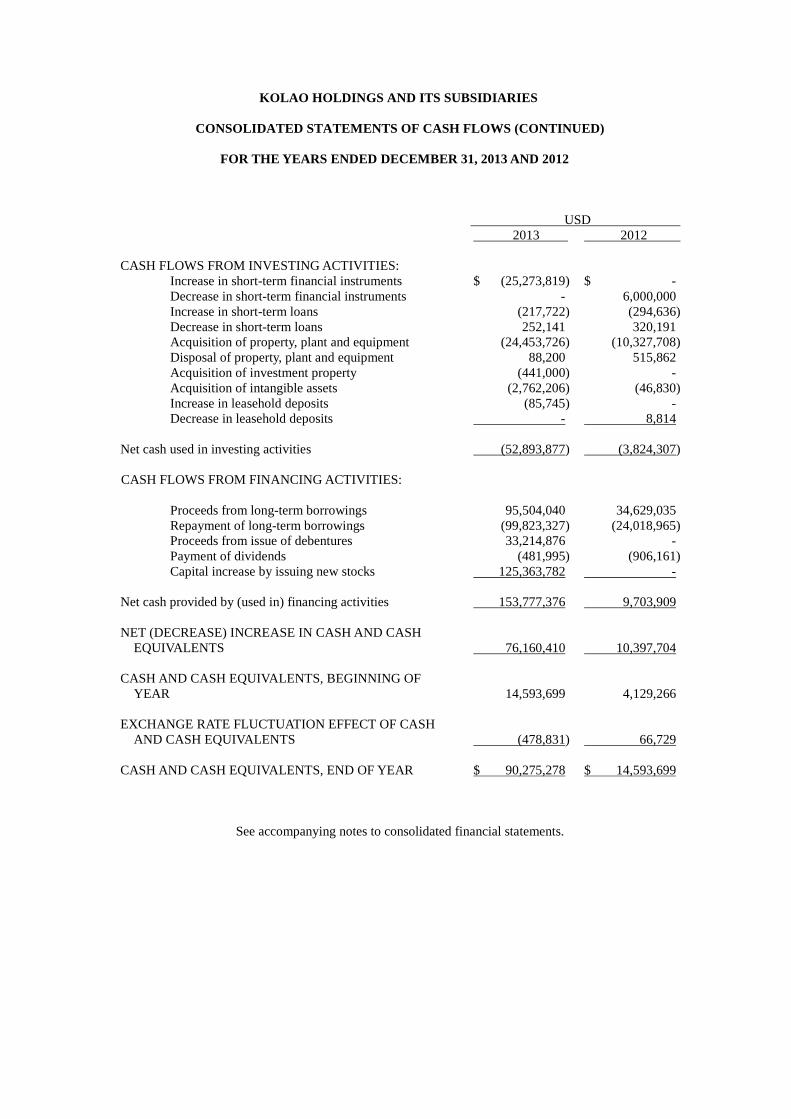
KOLAO HOLDINGS AND ITS SUBSIDIARIES
CONSOLIDATED STATEMENTS OF CASH FLOWS (CONTINUED)
FOR THE YEARS ENDED DECEMBER 31, 2013 AND 2012
USD 2013 2012 CASH FLOWS FROM INVESTING ACTIVITIES:
Increase in short-term financial instruments $ (25,273,819) $ - Decrease in short-term financial instruments - 6,000,000 Increase in short-term loans (217,722) (294,636) Decrease in short-term loans 252,141 320,191 Acquisition of property, plant and equipment (24,453,726) (10,327,708) Disposal of property, plant and equipment 88,200 515,862 Acquisition of investment property (441,000) - Acquisition of intangible assets (2,762,206) (46,830) Increase in leasehold deposits (85,745) - Decrease in leasehold deposits - 8,814
Net cash used in investing activities (52,893,877) (3,824,307) CASH FLOWS FROM FINANCING ACTIVITIES:
Proceeds from long-term borrowings 95,504,040 34,629,035 Repayment of long-term borrowings (99,823,327) (24,018,965) Proceeds from issue of debentures 33,214,876 - Payment of dividends (481,995) (906,161) Capital increase by issuing new stocks 125,363,782 -
Net cash provided by (used in) financing activities 153,777,376 9,703,909 NET (DECREASE) INCREASE IN CASH AND CASH EQUIVALENTS 76,160,410 10,397,704 CASH AND CASH EQUIVALENTS, BEGINNING OF YEAR 14,593,699 4,129,266 EXCHANGE RATE FLUCTUATION EFFECT OF CASH AND CASH EQUIVALENTS (478,831) 66,729 CASH AND CASH EQUIVALENTS, END OF YEAR $ 90,275,278 $ 14,593,699
See accompanying notes to consolidated financial statements.
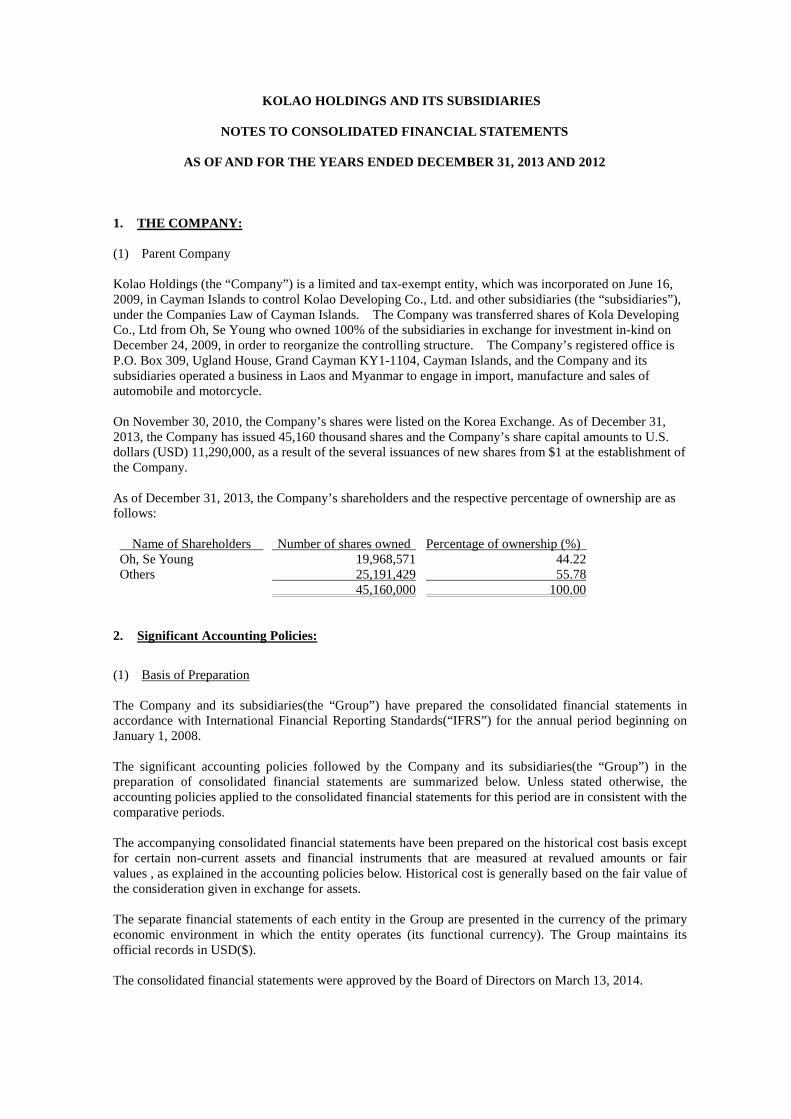
KOLAO HOLDINGS AND ITS SUBSIDIARIES
NOTES TO CONSOLIDATED FINANCIAL STATEMENTS
AS OF AND FOR THE YEARS ENDED DECEMBER 31, 2013 AND 2012
1. THE COMPANY: (1) Parent Company
Kolao Holdings (the “Company”) is a limited and tax-exempt entity, which was incorporated on June 16, 2009, in Cayman Islands to control Kolao Developing Co., Ltd. and other subsidiaries (the “subsidiaries”), under the Companies Law of Cayman Islands. The Company was transferred shares of Kola Developing Co., Ltd from Oh, Se Young who owned 100% of the subsidiaries in exchange for investment in-kind on December 24, 2009, in order to reorganize the controlling structure. The Company’s registered office is P.O. Box 309, Ugland House, Grand Cayman KY1-1104, Cayman Islands, and the Company and its subsidiaries operated a business in Laos and Myanmar to engage in import, manufacture and sales of automobile and motorcycle. On November 30, 2010, the Company’s shares were listed on the Korea Exchange. As of December 31, 2013, the Company has issued 45,160 thousand shares and the Company’s share capital amounts to U.S. dollars (USD) 11,290,000, as a result of the several issuances of new shares from $1 at the establishment of the Company. As of December 31, 2013, the Company’s shareholders and the respective percentage of ownership are as follows: Name of Shareholders Number of shares owned Percentage of ownership (%) Oh, Se Young 19,968,571 44.22 Others 25,191,429 55.78 45,160,000 100.00
2. Significant Accounting Policies:
(1) Basis of Preparation The Company and its subsidiaries(the “Group”) have prepared the consolidated financial statements in accordance with International Financial Reporting Standards(“IFRS”) for the annual period beginning on January 1, 2008. The significant accounting policies followed by the Company and its subsidiaries(the “Group”) in the preparation of consolidated financial statements are summarized below. Unless stated otherwise, the accounting policies applied to the consolidated financial statements for this period are in consistent with the comparative periods. The accompanying consolidated financial statements have been prepared on the historical cost basis except for certain non-current assets and financial instruments that are measured at revalued amounts or fair values , as explained in the accounting policies below. Historical cost is generally based on the fair value of the consideration given in exchange for assets. The separate financial statements of each entity in the Group are presented in the currency of the primary economic environment in which the entity operates (its functional currency). The Group maintains its official records in USD($). The consolidated financial statements were approved by the Board of Directors on March 13, 2014.
- 2 -
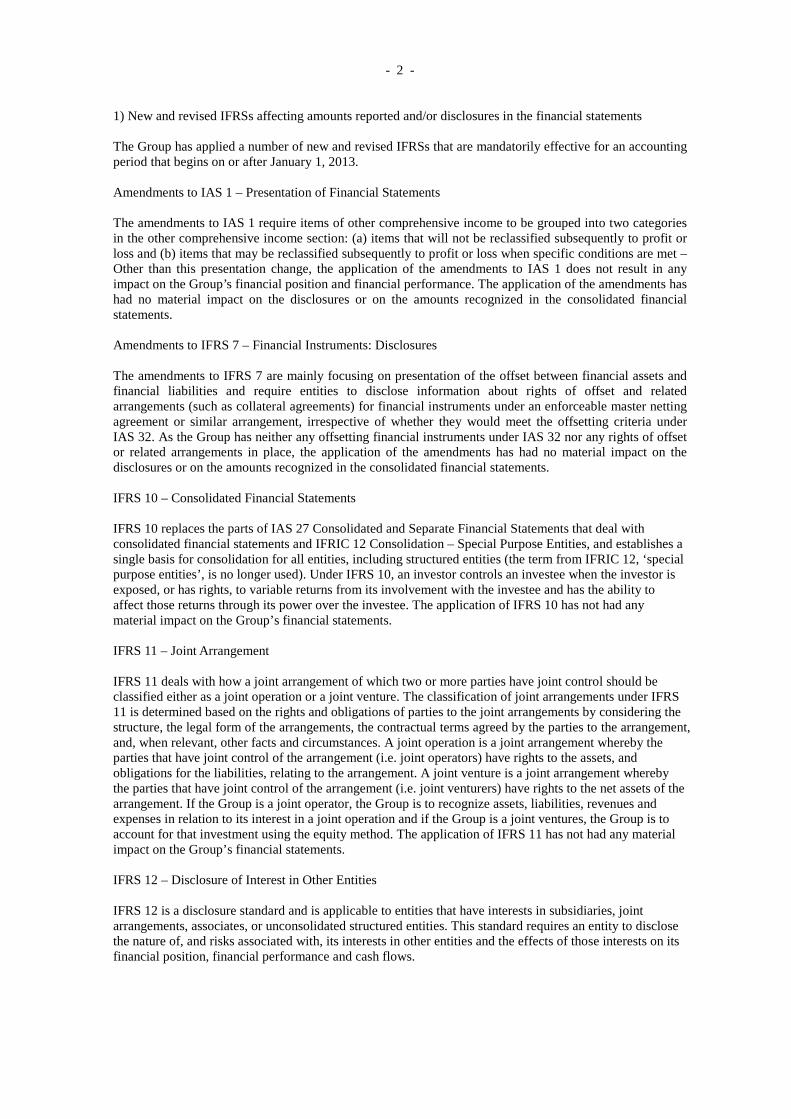
1) New and revised IFRSs affecting amounts reported and/or disclosures in the financial statements The Group has applied a number of new and revised IFRSs that are mandatorily effective for an accounting period that begins on or after January 1, 2013. Amendments to IAS 1 – Presentation of Financial Statements The amendments to IAS 1 require items of other comprehensive income to be grouped into two categories in the other comprehensive income section: (a) items that will not be reclassified subsequently to profit or loss and (b) items that may be reclassified subsequently to profit or loss when specific conditions are met – Other than this presentation change, the application of the amendments to IAS 1 does not result in any impact on the Group’s financial position and financial performance. The application of the amendments has had no material impact on the disclosures or on the amounts recognized in the consolidated financial statements. Amendments to IFRS 7 – Financial Instruments: Disclosures The amendments to IFRS 7 are mainly focusing on presentation of the offset between financial assets and financial liabilities and require entities to disclose information about rights of offset and related arrangements (such as collateral agreements) for financial instruments under an enforceable master netting agreement or similar arrangement, irrespective of whether they would meet the offsetting criteria under IAS 32. As the Group has neither any offsetting financial instruments under IAS 32 nor any rights of offset or related arrangements in place, the application of the amendments has had no material impact on the disclosures or on the amounts recognized in the consolidated financial statements. IFRS 10 – Consolidated Financial Statements IFRS 10 replaces the parts of IAS 27 Consolidated and Separate Financial Statements that deal with consolidated financial statements and IFRIC 12 Consolidation – Special Purpose Entities, and establishes a single basis for consolidation for all entities, including structured entities (the term from IFRIC 12, ‘special purpose entities’, is no longer used). Under IFRS 10, an investor controls an investee when the investor is exposed, or has rights, to variable returns from its involvement with the investee and has the ability to affect those returns through its power over the investee. The application of IFRS 10 has not had any material impact on the Group’s financial statements. IFRS 11 – Joint Arrangement IFRS 11 deals with how a joint arrangement of which two or more parties have joint control should be classified either as a joint operation or a joint venture. The classification of joint arrangements under IFRS 11 is determined based on the rights and obligations of parties to the joint arrangements by considering the structure, the legal form of the arrangements, the contractual terms agreed by the parties to the arrangement, and, when relevant, other facts and circumstances. A joint operation is a joint arrangement whereby the parties that have joint control of the arrangement (i.e. joint operators) have rights to the assets, and obligations for the liabilities, relating to the arrangement. A joint venture is a joint arrangement whereby the parties that have joint control of the arrangement (i.e. joint venturers) have rights to the net assets of the arrangement. If the Group is a joint operator, the Group is to recognize assets, liabilities, revenues and expenses in relation to its interest in a joint operation and if the Group is a joint ventures, the Group is to account for that investment using the equity method. The application of IFRS 11 has not had any material impact on the Group’s financial statements. IFRS 12 – Disclosure of Interest in Other Entities IFRS 12 is a disclosure standard and is applicable to entities that have interests in subsidiaries, joint arrangements, associates, or unconsolidated structured entities. This standard requires an entity to disclose the nature of, and risks associated with, its interests in other entities and the effects of those interests on its financial position, financial performance and cash flows.
- 3 -
There are some other amendments made to IFRSs as part of the Annual Improvements to IFRSs 2009 – 2011, such as the tax effect of distribution to holders of equity instruments (the amendments to IAS 32), which has not resulted in material effects on the Group’s consolidated financial statements. 2) New and revised IFRSs in issue but not yet effective The Group has not applied the following new and revised IFRSs that have been issued but are not yet effective. IFRS 13 – Fair Value Measurement IFRS 13 establishes a single source of guidance for fair value measurements and disclosure about fair value measurements. The standard defines fair value, establishes a framework for measuring fair value, and requires disclosures about fair value measurements. IFRS 13 defines fair value as the price that would be received to sell an asset or paid to transfer a liability in an orderly transaction between market participants at the measurement date. Fair value is measured by taking into account the characteristics of the asset or liability that market participants would take when pricing the asset or liability at the measurement date. A fair value measurement under IFRS 13 requires an entity to determine the particular asset or liability that is subject of the measurement, the principal (or most advantageous) market for the asset or liability, and the valuation technique(s) appropriate for the measurement. In addition, IFRS 13 requires extensive disclosures about fair value measurements. The amendments to IFRS 13 are effective for annual periods beginning on or after January 1, 2014. Amendments to IFRS 32 – Financial Instruments: Presentation The amendments to IFRS 32 clarify existing application issue relating to the offset of financial assets and financial liabilities requirements. Specifically, the amendments clarify the meaning of ‘currently has a legally enforceable right of set-off’ and ‘simultaneous realization and settlement’. Group’s right to offset must not be conditional on the occurrence of future events but enforceable anytime during the contract periods, during the ordinary course of business with counterparty, a default of counterparty and master netting agreement or in some forms of non-recourse debt. The amendments to IFRS 32 are effective for annual periods beginning on or after January 1, 2014. Amendments to IFRS 39 – Financial Instruments: Recognition and Measurement The amendments to IFRS 39 allows the continuation of hedge accounting when a derivative is novated to a clearing counterparty or entity acting in a similar capacity and certain conditions are met. The amendment to IFRS 39 is effective for annual periods beginning on or after January 1, 2014. Amendments to IFRS 10, IFRS 12 and IFRS 27 Investment Entities The amendments introduce an exception to the principle under IFRS 10 that all subsidiaries shall be consolidated and require a reporting entity that meets the definition of an investment entity not to consolidate its subsidiaries but instead to measure its subsidiaries at fair value through profit or loss in its consolidated and separate financial statements. In addition, consequential amendments have been made to IFRS 12 and IFRS 27 to introduce new disclosure requirements for investment entities. The investment entities amendments are effective for annual periods beginning on or after January 1, 2014. IFRIC 21 Levies IFRIC 21 defines a levy as a payment to a government for which an entity receives no specific goods or services. The interpretation requires that a liability is recognized when the obligating event occurs. The obligating event is the activity that triggers payment of the levy and is typically specified in the legislation that imposes the levy. The interpretation is effective for annual periods beginning on or after January 1, 2014.
- 4 -
The list above does not include some other amendments such as the Amendments to IAS 36 relating to recoverable amount disclosures for non-financial assets that are effective from January 1, 2014 with earlier application permitted.
(2) Basis of Consolidation The consolidated financial statements incorporate the financial statements of the Company and entities (including structured entities) controlled by the Company (and its subsidiaries). Control is achieved where the Company 1) has the power over the investee, 2) is exposed, or has rights, to variable returns from its involvement with the investee, and 3) has the ability to use its power to affect its returns. The Company reassesses whether or not it controls an investee if facts and circumstances indicate that there are changes to one or more of the three elements of control listed above. When the Company has less than a majority of the voting rights of an investee, it has power over the investee when the voting rights are sufficient to give it the practical ability to direct the relevant activities of the investee unilaterally. The Company considers all relevant facts and circumstances in assessing whether or not the Company's voting rights in an investee are sufficient to give it power, including:
• the size of the Company's holding of voting rights relative to the size and dispersion of holdings of the other vote holders;
• potential voting rights held by the Company, other vote holders or other parties; • rights arising from other contractual arrangements; and • any additional facts and circumstances that indicate that the Company has, or does not have, the
current ability to direct the relevant activities at the time that decisions need to be made, including voting patterns at previous shareholders' meetings.
Income and expenses of subsidiaries acquired or disposed of during the year are included in the consolidated statement of comprehensive income from the date the Company gains control until the date when the Company ceases to control the subsidiaries. Profit or loss and each component of other comprehensive income are attributed to the owners of the Company and to the non-controlling interests. Total comprehensive income of subsidiaries is attributed to the owners of the Company and to the non-controlling interests even if this results in the non-controlling interests having a deficit balance When necessary, adjustments are made to the financial statements of subsidiaries to bring their accounting policies into line with the Group’s accounting policies. All intra-group transactions and related assets and liabilities, income and expenses are eliminated in full on consolidation Changes in the Group’s ownership interests in subsidiaries that do not result in the Group losing control over the subsidiaries are accounted for as equity transactions. The carrying amounts of the Group’s interests and the non-controlling interests are adjusted to reflect the changes in their relative interests in the subsidiaries. Any difference between the amount by which the non-controlling interests are adjusted and the fair value of the consideration paid or received is recognized directly in equity and attributed to owners of the Company. When the Group loses control of a subsidiaries, a gain or loss on disposal is calculated as the difference between (i) the aggregate of the fair value of the consideration received and the fair value of any retained interest and (ii) the previous carrying amount of the assets (including goodwill), and liabilities of the subsidiaries and any non-controlling interests. When assets of the subsidiaries are carried at revalued amounts or fair values and the related cumulative gain or loss has been recognized in other comprehensive income and accumulated in equity, the amounts previously recognized in other comprehensive income and accumulated in equity are accounted for as if the Company had directly disposed of the relevant assets (i.e. reclassified to profit or loss or transferred directly to retained earnings). The fair value of any investment retained in the former subsidiaries at the date when control is lost is recognized as the fair value on initial recognition for subsequent accounting under IAS 39 Financial Instruments: Recognition and Measurement or, when applicable, the cost on initial recognition of an investment in an associate or a joint venture.
- 5 -
(3) Cash and Cash Equivalents Cash and cash equivalents include cash, savings and checking accounts and highly liquid short-term investment (maturities of three months or less from the date of acquisition). Bank overdrafts are considered short-term borrowings in the consolidated statement of financial position. (4) Revenue Recognition The Group’s revenue categories consist of sale of goods, services rendered and other income. 1) Sale of goods
Revenue from sale of goods is measured at the fair value of the consideration received or receivable, net of value added tax and trade discounts. Revenue from the sale of goods is recognized when the Group has transferred to the buyer the significant risks and rewards of ownership of the goods, the Group retains neither continuing managerial involvement to the degree usually associated with ownership nor effective control over the goods sold, the amount of revenue can be measured reliably, it is probable that the economic benefits associated with the transaction will flow to the Group and the costs incurred or to be incurred in respect of the transaction can be measured reliably. 2) Rendering of services Revenue associated with the transaction involving the rendering of services is recognized by reference to the stage of completion of the transaction at the end of the reporting period when the amount of revenue can be measured reliably, it is probable that the economic benefits associated with the transaction will flow to the Group, the stage of completion of the transaction at the end of the reporting period can be measured reliably and the costs incurred for the transaction and the costs to complete the transaction can be measured reliably. When the outcome of the transaction involving the rendering of services cannot be estimated reliably, revenue is recognized only to the extent of the expenses recognized that are recoverable. 3) Dividend income and interest income Dividend income from investments is recognized when the right to receive payment has been established. Interest income is recognized when it is probable that the economic benefits will flow to the Group and the amount of revenue can be measured reliably. Interest income is accrued on a time basis, by reference to the principal outstanding and at the effective interest rate applicable. 4) Rental income The Group’s policy for recognition of revenue from operating leases is described in Note 2 (14) below. (5) Financial Assets Financial assets are recognized when the Company becomes a party to the contractual provisions of the instruments. Financial assets are initially measured at fair value. Transaction costs that are directly attributable to the acquisition or issue of financial assets are added to or deducted from the fair value of the financial assets, as appropriate, on initial recognition. Transaction costs directly attributable to the acquisition of financial assets at fair value through profit or loss are recognized immediately in profit or loss. All regular way purchases or sales of financial assets are recognized and derecognized on a trade date basis. Regular way purchases or sales are purchases or sales of financial assets that require delivery of assets within the time frame established by regulation or convention in the marketplace. Financial assets are classified into the following specified categories: ‘financial assets at FVTPL,’ ‘held-to-maturity investments,’ ‘available-for-sale (“AFS”) financial assets’ and ‘loans and receivables.’ The classification depends on the nature and purpose of the financial assets and is determined at the time of initial recognition.
- 6 -
1) Effective interest method The effective interest method is a method of calculating the amortized cost of a debt instrument and of allocating interest income over the relevant period. The effective interest rate is the rate that exactly discounts estimated future cash receipts (including all fees and points paid or received that form an integral part of the effective interest rate, transaction costs and other premiums or discounts) through the expected life of the debt instrument, or, where appropriate, a shorter period, to the net carrying amount on initial recognition. Income is recognized on an effective interest basis for debt instruments other than those financial assets classified as at FVTPL. 2) Financial Assets at FVTPL Financial assets at FVTPL include a financial asset held for trading and a financial asset designated as at FVTPL upon initial recognition. A financial asset is classified as held for trading if it has been acquired principally for the purpose of selling in the near term. Every financial instrument, containing one of more embedded derivatives, treated separately from the host contract, is classified as held-for-trading if it is a derivative that is not designated and effective as a hedge instrument or not a financial guarantee contract. Financial assets at FVTPL are stated at fair value, with any gains or losses arising on remeasurement recognized in profit or loss. A financial asset is classified as held for trading if:
� it has been acquired principally for the purpose of selling it in the near term; � on initial recognition, it is part of a portfolio of identified financial instruments that the Group
manages together and has a recent actual pattern of short-term profit taking; or � it is a derivative that is not designated and effective as a hedging instrument.
A financial asset other than a financial asset held for trading may be designated as at FVTPL upon initial recognition if:
� such designation eliminates or significantly reduces a measurement or recognition inconsistency that would otherwise arise;
� the financial asset forms part of a group of financial assets or financial liabilities, or both, which is managed, and its performance is evaluated on a fair value basis in accordance with the Group's documented risk management or investment strategy, and information about the grouping is provided internally on that basis; or
� it forms part of a contract containing one or more embedded derivatives, and IAS 39 Financial Instruments: Recognition and Measurement permits the entire combined contract (asset or liability) to be designated as at FVTPL.
Financial assets at FVTPL are stated at fair value, with any gains or losses arising on remeasurement recognized in profit or loss. The net gain or loss recognized in profit or loss incorporates any dividend or interest earned on the financial asset and is included in the ‘other gains and losses’ line item in the consolidated statements of comprehensive income. 3) Held-to-Maturity Investments Non-derivative financial assets with fixed or determinable payments and fixed maturity that the Group has the positive intention and ability to hold to maturity are classified as held-to-maturity investments. After initial recognition, held-to-maturity investments are measured at amortized cost using the effective interest method, less any impairment, with revenue recognized on an effective yield basis. 4) AFS Financial Assets Non-derivatives financial assets that are not classified as at held to maturity, held for trading, designated as at FVTPL or loans and receivables are classified as at financial assets AFS.
- 7 -
They are subsequently measured at fair value at the end of each reporting period. Changes in the carrying amount of AFS monetary financial assets relating to changes in foreign currency rates (see below), interest income calculated using the effective interest method and dividends on AFS equity investments are recognized in profit or loss. Other changes in the carrying amount of AFS financial assets are recognized in other comprehensive income and accumulated under the heading of investments revaluation reserve. When the investment is disposed of or is determined to be impaired, the cumulative gain or loss previously accumulated in the investments revaluation reserve is reclassified to profit or loss. Dividends on AFS equity instruments are recognized in profit or loss when the Group’s right to receive the dividends is established. The fair value of AFS monetary assets denominated in a foreign currency is determined in that foreign currency and translated at the spot rate at the end of the reporting period. The foreign exchange gains and losses that are recognized in profit or loss are determined based on the amortized cost of the monetary asset. Other foreign exchange gains and losses are recognized in other comprehensive income. Unquoted AFS financial assets whose fair value cannot be measured reliably and derivative assets linked with unquoted equity financial assets whose pay for the equity financial assets are carried at acquisition cost, less impairment. 5) Loans and Receivables Trade receivables, loans and other receivables that have fixed or determinable payments that are not quoted in an active market are classified as loans and receivables. Loans and receivables are measured at amortized cost using the effective interest method, less any impairment. Interest income is recognized by applying the effective interest rate, except for short-term receivables when the recognition of interest would be immaterial. 6) Impairment of Financial Assets Financial assets, other than those at FVTPL, are assessed for indicators of impairment at the end of each reporting period. Financial assets are considered to be impaired when there is objective evidence that, as a result of one or more events that occurred after the initial recognition of the financial asset, the estimated future cash flows of the investment have been affected. For listed and unlisted equity investments classified as AFS, a significant or prolonged decline in the fair value of the security below its cost is considered to be objective evidence of impairment. For all other financial assets, including redeemable notes classified as AFS and finance lease receivables, objective evidence of impairment could include:
� significant financial difficulty of the issuer or counterparty; � default or delinquency in interest or principal payments; or � it becoming probable that the borrower will enter bankruptcy or financial reorganization.
For certain categories of financial asset, such as trade receivables, assets that are assessed not to be impaired individually are, in addition, assessed for impairment on a collective basis. Objective evidence of impairment for a portfolio of receivables could include the Group’s past experience of collecting payments as well as observable changes in national or local economic conditions that correlate with default on receivables. For financial assets carried at amortized cost, the amount of the impairment loss recognized is the difference between the asset’s carrying amount and the present value of estimated future cash flows, discounted at the financial asset’s original effective interest rate. When loan and receivables are considered uncollectible, they are written off against the allowance account. Subsequent recoveries of amounts previously written off are credited against the allowance account. Changes in the carrying amount of the allowance account are recognized in profit or loss.
- 8 -
When an AFS financial asset is considered to be impaired, cumulative gains or losses previously recognized in other comprehensive income are reclassified to profit or loss in that period. With the exception of AFS equity instruments, if, in a subsequent period, the amount of the impairment loss decreases and the decrease can be related objectively to an event occurring after the impairment was recognized, the previously recognized impairment loss is reversed through profit or loss to the extent that the carrying amount of the investment at the date the impairment is reversed does not exceed what the amortized cost would have been had the impairment not been recognized. In respect of AFS equity securities, impairment losses previously recognized in profit or loss are not reversed through profit or loss. Any increase in fair value subsequent to an impairment loss is recognized in other comprehensive income. 7) Derecognition of Financial Assets The Group derecognizes a financial asset only when the contractual rights to the cash flows from the asset expire, or when it transfers the financial asset and substantially all the risks and rewards of ownership of the asset to another entity. If the Group neither transfers nor retains substantially all the risks and rewards of ownership and continues to control the transferred asset, the Group recognizes its retained interest in the asset and an associated liability for amounts it may have to pay. If the Group retains substantially all the risks and rewards of ownership of a transferred financial asset, the Group continues to recognize the financial asset and also recognize a collateralized borrowing for the proceeds received. (6) Derivative Financial Instruments Derivatives are initially recognized at fair value at the date the derivative contract is entered into, and are subsequently remeasured to their fair value at the end of each reporting period. The resulting gain or loss is recognized in profit or loss immediately, unless the derivative is designated and effective as a hedging instrument. A derivative is presented as a non-current asset or a non-current liability if the remaining maturity of the instrument is more than 12 months and it is not expected to be realized or settled within 12 months. Other derivatives are presented as current assets or current liabilities. (7) Inventories Inventories are stated at the lower of cost and net realizable value. Costs, including an appropriate portion of fixed and variable overhead expenses, are assigned to inventories by the method most appropriate to the particular class of inventory, being valued by the weighted-average method, excluding goods in transit (specific identification method). Net realizable value represents the estimated selling price for inventories, less all estimated costs of completion and costs necessary to make the sale. The carrying amount of inventories sold in the period and the amount of any write-down of inventories to net realizable value and all losses of inventories in the period, less the amount of any reversal in the period of any write-down of the inventories, arising from an increase in net realizable value, are recognized as expense during the period. (8) Property, Plant, and Equipment and Depreciation Property, plant, and equipment are stated at cost, less subsequent accumulated depreciation and accumulated impairment losses. The cost of property, plant and equipment includes expenditure arising directly from the construction or acquisition of the asset, any costs directly attributable to bringing the asset to the location and condition necessary for it to be capable of operating in the manner intended by management and the initial estimate of the costs of dismantling and removing the item and restoring the site on which it is located. Subsequent costs are recognized in the carrying amount of property, plant and equipment at cost or, if appropriate, as separate items if it is probable that future economic benefits associated with the item will flow to the Group and the cost of the item can be measured reliably. The carrying amount of the replaced part is derecognized. The costs of the day-to-day servicing are recognized in profit or loss as incurred.
- 9 -
Depreciation is recognized so as to write off the cost, less their residual values over their useful lives, using the straight-line method. The estimated useful lives, residual values and depreciation method are reviewed at each year end, with the effect of any changes in estimate accounted for on a prospective basis. The estimated useful lives are as follows: Assets Estimated useful lives (in years)
Buildings 20 Tools and equipment 5
Vehicles 5 Office equipment 5
The carrying amount of an item of property, plant and equipment is derecognized on disposal or when no future economic benefits are expected from its use or disposal. The gain or loss arising from the derecognition of an item of property, plant and equipment is determined as the difference between the net disposal proceeds, if any, and the carrying amount of the item. (9) Investment Property Investment properties are properties held to earn rentals or for capital appreciation (including property under construction for such purposes). Investment properties are measured initially at cost, including transaction costs. Subsequent to initial recognition, investment properties are measured at fair value. Gains and losses arising from changes in the fair value of investment properties are included in profit or loss in the period in which they arise. An investment property is derecognized upon disposal or when the investment property is permanently withdrawn from use, and no future economic benefits are expected from the disposal. Any gain or loss arising on derecognition of the property (calculated as the difference between the net disposal proceeds and the carrying amount of the asset) is included in profit or loss in the period in which the property is derecognized. While land is not depreciated, all other investment property is depreciated, based on the respective asset’s estimated useful lives of 20 years, using the straight-line method. The estimated useful lives, residual values and depreciation method are reviewed at the end of each reporting period, with the effect of any changes in estimate accounted for on a prospective basis. (10) Intangible assets 1) Intangible assets acquired separately Intangible assets with finite useful lives that are acquired separately are carried at cost less accumulated amortization and accumulated impairment losses. Amortization is recognized on a straight-line basis over their estimated useful lives. The estimated useful life and amortization method are reviewed at the end of each reporting period, with the effect of any changes in estimate being accounted for on a prospective basis. Intangible assets with indefinite useful lives that are acquired separately are carried at cost less accumulated impairment losses. 2) Internally generated intangible assets - research and development expenditure Expenditure on research activities is recognized as an expense in the period in which it is incurred. An internally generated intangible asset arising from development (or from the development phase of an internal project) is recognized if, and only if, all of the following have been demonstrated: • improvement of technical feasibility and development of new product and • the ability to measure reliably the expenditure attributable to the intangible asset during its development.
- 10 -
The amount initially recognized for internally generated intangible assets is the sum of the expenditure incurred from the date when the intangible asset first meets the recognition criteria listed above. Where no internally generated intangible asset can be recognized, development expenditure is recognized in profit or loss in the period in which it is incurred. Subsequent to initial recognition, internally generated intangible assets are reported at cost, less accumulated amortization and accumulated impairment losses. 3) Intangible assets acquired in a business combination Intangible assets that are acquired in a business combination are recognized separately from goodwill and are initially recognized at their fair value at the acquisition date (which is regarded as their cost). Subsequent to initial recognition, intangible assets acquired in a business combination are reported at cost, less accumulated amortization and accumulated impairment losses, on the same basis as intangible assets that are acquired separately. 4) Derecognition of intangible assets An intangible asset is derecognized on disposal or when no future economic benefits are expected from its use or disposal. Gains or losses arising from derecognition of an intangible asset, measured as the difference between the net disposal proceeds and the carrying amount of the asset, are recognized in profit or loss when the asset is derecognized. (11) Impairment of tangible and intangible assets, except for goodwill At the end of each reporting period, the Group reviews the carrying amounts of its tangible and intangible assets to determine whether there is any indication that those assets have suffered an impairment loss. If any such indication exists, the recoverable amount of the asset is estimated in order to determine the extent of the impairment loss (if any). Where it is not possible to estimate the recoverable amount of an individual asset, the Group estimates the recoverable amount of the cash-generating unit to which the asset belongs. Where a reasonable and consistent basis of allocation can be identified, corporate assets are also allocated to individual cash-generating units, or otherwise, they are allocated to the smallest group of cash-generating units for which a reasonable and consistent allocation basis can be identified. Intangible assets with indefinite useful lives and intangible assets not yet available for use are tested for impairment at least annually and whenever there is an indication that the asset may be impaired. Recoverable amount is the higher of fair value, less costs to sell, or value in use. In assessing value in use, the estimated future cash flows are discounted to their present value using a pretax discount rate that reflects current market assessments of the time value of money and the risks specific to the asset for which the estimates of future cash flows have not been adjusted. If the recoverable amount of an asset (or a cash-generating unit) is estimated to be less than its carrying amount, the carrying amount of the asset (or the cash-generating unit) is reduced to its recoverable amount. An impairment loss is recognized immediately in profit or loss, unless the relevant asset is carried at a revalued amount, in which case the impairment loss is treated as a revaluation decrease. (12) Borrowing Costs Borrowing costs directly attributable to the acquisition, construction or production of qualifying assets, which are assets that necessarily take a substantial period of time to get ready for their intended use or sale, are added to the cost of those assets, until such time as the assets are substantially ready for their intended use or sale. Investment income earned on the temporary investment of specific borrowings pending their expenditure on qualifying assets is deducted from the borrowing costs eligible for capitalization. All other borrowing costs are recognized in profit or loss in the period in which they are incurred.
- 11 -
(13) Financial Liabilities and Equity Instruments 1) Classification as Debt or Equity Debt and equity instruments are classified as either financial liabilities or equity in accordance with the substance of the contractual arrangement. 2) Equity Instruments An equity instrument is any contract that evidences a residual interest in the assets of an entity after deducting all of its liabilities. Equity instruments issued by the Group are recognized as the proceeds are received, net of direct issue costs. 3) Financial Liabilities Financial liabilities are recognized when the Group becomes a party to the contractual provisions of the instruments. Financial liabilities are initially measured at fair value. Transaction cost that are directly attributable to the issue of financial liabilities are deducted from the fair value of the financial liabilities, as appropriate, on initial recognition. Transaction cost directly attributable to acquisition of financial liabilities at FVTPL are recognized immediately in profit or loss. Financial liabilities are classified as either financial liabilities at FVTPL or other financial liabilities. 4) Financial Liabilities at FVTPL Financial liabilities are classified as at FVTPL when the financial liability is either held for trading or designated as FVTPL. A financial liability is classified as held for trading if:
� it has been acquired principally for the purpose of repurchasing in the near term; or � on initial recognition, it is part of a portfolio of identified financial instruments that the Group
manages together and has a recent actual pattern of short-term profit-taking; or � it is a derivative that is not designated and effective as a hedging instrument.
A financial liability other than a financial liability held for trading may be designated as at FVTPL upon initial recognition if:
� such designation eliminates or significantly reduces a measurement or recognition inconsistency that would otherwise arise;
� the financial liability forms part of a group of financial assets or financial liabilities, or both, which is managed, and its performance is evaluated on a fair value basis in accordance with the Group's documented risk management or investment strategy, and information about the grouping is provided internally on that basis; or
� it forms part of a contract containing one or more embedded derivatives, and IAS 39 permits the entire combined contract (asset or liability) to be designated as at FVTPL.
Financial liabilities at FVTPL are stated at fair value, with any gains or losses arising on remeasurement recognized in profit or loss. The net gain or loss recognized in profit or loss incorporates any interest paid on the financial liability and is included in the ‘other gains and losses’ line item in the consolidated statement of comprehensive income. 5) Other Financial Liabilities Other financial liabilities are subsequently measured at amortized cost using the effective interest method, with interest expense recognized on an effective yield basis. The effective interest method is a method of calculating the amortized cost of a financial liability and allocating interest expense over the relevant period. The effective interest rate is the rate that exactly discounts estimated future cash payments through the expected life of the financial liability, or, where appropriate, a shorter period, to the net carrying amount on initial recognition.
- 12 -
6) Financial Guarantee Contract Liabilities A financial guarantee contract is a contract that requires the issuer to make specified payments to reimburse the holder for a loss it incurs because a specified debtor fails to make payments when due in accordance with the terms of a debt instruments. Financial guarantee contract liabilities are initially measured at their fair values and, if not designated as at FVTPL, are subsequently measured at the higher of:
� the amount of the obligation under the contract, as determined in accordance with IAS 37 Provisions, Contingent Liabilities and Contingent Assets; and
� the amount initially recognized, less cumulative amortization recognized in accordance with the IAS 18 Revenue
7) Derecognition of Financial Liabilities The Group derecognizes financial liabilities when, and only when, the Group’s obligations are discharged or canceled or they expire. (14) Leases Leases are classified as finance leases whenever the terms of the lease transfer substantially all the risks and rewards of ownership to the lessee. All other leases are classified as operating leases. 1) The Group as lessor Amounts due from lessees under finance leases are recognized as receivables at the amount of the Group’s net investment in the leases. Finance lease income is allocated to accounting periods so as to reflect a constant periodic rate of return on the Group’s net investment outstanding in respect of the leases. Rental income from operating leases is recognized on a straight-line basis over the term of the relevant lease. Initial direct costs incurred in negotiating and arranging an operating lease are added to the carrying amount of the leased asset and recognized on a straight-line basis over the lease term. 2) The Group as lessee Assets held under finance leases are initially recognized as assets of the Group at their fair value at the inception of the lease or, if lower, at the present value of the minimum lease payments. The corresponding liability to the lessor is included in the consolidated statement of financial position as a finance lease obligation. Lease payments are apportioned between finance expenses and reduction of the lease obligation so as to achieve a constant rate of interest on the remaining balance of the liability. Finance expenses are recognized immediately in profit or loss, unless they are directly attributable to qualifying assets, in which case they are capitalized in accordance with the Group’s general policy on borrowing costs (see Note 2 (12)). Contingent rentals are recognized as expenses in the periods in which they are incurred. Operating lease payments are recognized as an expense on a straight-line basis over the lease term, except where another systematic basis is more representative of the time pattern in which economic benefits from the leased asset are consumed. Contingent rentals arising under operating leases are recognized as an expense in the period in which they are incurred. In the event that lease incentives are received to enter into operating leases, such incentives are recognized as a liability. The aggregate benefit of incentives is recognized as a reduction of rental expense on a straight-line basis, except where another systematic basis is more representative of the time pattern in which economic benefits from the leased asset are consumed.
- 13 -
(15) Income Tax Expense The Group operates its business in Laos, Singapore and Myanmar and the tax currently payable is based on taxable profit for the year. Taxable profit differs from profit as reported in the consolidated statement of comprehensive income because of items of income or expense that are taxable or deductible in other years and items that are never taxable or deductible. The Group’s liability for current tax is calculated using tax rates that have been enacted or substantively enacted by the end of the reporting period. (16) Employee Benefits 1) Short-term Employee Benefits Short-term employee benefits are employee benefits that are due to be settled within 12 months after the end of the period in which the employees render the related service. When an employee has rendered service to the Group during a reporting period, the Group recognizes the undiscounted amount of short-term employee benefits expected to be paid in exchange for that service. 2) Postemployment Benefits and Termination Benefits Of all subsidiaries, employees in Kolao Developing Co., Ltd are entitled to lump-sum payments based on current rates of pay and length of service when they leave due to involuntary termination under the Laos Law. Therefore, according to the historical experiences that involuntary termination was recommended for the Group’s employees, a present legal and constructive payment obligation arising from past events is not created, and the amount of the obligation cannot be measured with sufficient reliability. For these reasons, no amounts are recognized as liabilities in respect of postemployment benefits. Due to such involuntary termination, the Group adopted a policy that recognizes a payment obligation that is created by the Laos Law in loss as termination benefits. Whereas, employees in the other subsidiaries are entitled to post-employment benefits under the each jurisdiction and law and the Group recognized no liabilities with regard to the post-employment and termination benefits as of December 31, 2013. (17) Provisions and Contingent Liabilities Provisions are recognized when the Group has a present obligation (legal or constructive) as a result of a past event, it is probable that the Group will be required to settle the obligation and a reliable estimate can be made of the amount of the obligation. The amount recognized as a provision is the best estimate of the consideration required to settle the present obligation at the end of the reporting period, taking into account the risks and uncertainties surrounding the obligation. When a provision is measured using the cash flows estimated to settle the present obligation, its carrying amount is the present value of those cash flows (where the effect of the time value of money is material). When some or all of the economic benefits required to settle a provision are expected to be recovered from a third party, a receivable is recognized as an asset if it is virtually certain that reimbursement will be received and the amount of the receivable can be measured reliably. At the end of each reporting period, the remaining provision balance is reviewed and assessed to determine if the current best estimate is being recognized. If the existence of an obligation to transfer economic benefit is no longer probable, the related provision is reversed during the period. (18) Foreign Currency Transactions and Translation of Foreign Assets and Liabilities The consolidated financial statements are presented in USD, which is the functional currency and presentation currency. In preparing the consolidated financial statements, transactions in currencies other than the entity’s functional currency (“foreign currencies”) are recognized at the rates of exchange prevailing at the dates of the transactions. At the end of each reporting period, monetary items denominated in foreign currencies are retranslated at the rates prevailing at that date. Non-monetary items carried at fair value that are denominated in foreign currencies are retranslated at the rates prevailing at the date when the fair value was determined. Non-monetary items that are measured in terms of historical cost in a foreign currency are not retranslated.
- 14 -
Exchange differences are recognized in profit or loss in the period in which they arise, except for:
� exchange differences on foreign currency borrowings relating to assets under construction for future productive use, which are included in the cost of those assets when they are regarded as an adjustment to interest costs on those foreign currency borrowings;
� exchange differences on transactions entered into in order to hedge certain foreign currency risks; and � exchange differences on monetary items receivable from or payable to a foreign operation for which
settlement is neither planned nor likely to occur (therefore forming part of the net investment in the foreign operation), which are recognized initially in other comprehensive income (loss) and reclassified from equity to profit or loss on disposal or partial disposal of the net investment.
For the purpose of presenting consolidated financial statements, the assets and liabilities of the Group’s foreign operations are expressed in USD using exchange rates prevailing at the end of the reporting period. Income and expense items are translated at the average exchange rates for the period, unless exchange rates fluctuated significantly during that period, in which case the exchange rates at the dates of the transactions are used. Exchange differences arising, if any, are recognized in other comprehensive income and accumulated in equity (attributed to non-controlling interests as appropriate). On the disposal of a foreign operation (i.e. a disposal of the Group’s entire interest in a foreign operation, or a disposal involving loss of control over a subsidiaries that includes a foreign operation, or partial disposal of an interest in a joint arrangement or an associate that includes a foreign operation of which the retained interest becomes a financial asset), all of the accumulated exchange differences in respect of that operation attributable to the owners of the Company are reclassified to profit or loss. Any exchange differences that have previously been attributed to non-controlling interests are derecognized, but they are not reclassified to profit or loss. In the case of a partial disposal (i.e. no loss of control) of a subsidiaries that includes a foreign operation, the proportionate share of accumulated exchange differences are re-attributed to non-controlling interests in equity and are not recognized in profit or loss. For all other partial disposals (i.e. partial disposals of associates or joint arrangements that do not result in the Group losing significant influence or joint control), the proportionate share of the accumulated exchange differences is reclassified to profit or loss. Goodwill and fair value adjustments arising on the acquisition of a foreign operation are treated as assets and liabilities of the foreign operation and translated at the closing rate. (19) Fair Value Fair value is the price that would be received to sell an asset or paid to transfer a liability in an orderly transaction between market participants at the measurement date, regardless of whether that price is directly observable or estimated using another valuation technique. In estimating the fair value of an asset or a liability, the Group takes into account the characteristics of the asset or liability if market participants would take those characteristics into account when pricing the asset or liability at the measurement date. Fair value for measurement and/or disclosure purposes in these consolidated financial statements is determined on such a basis, except for share-based payment transactions that are within the scope of IFRS 2 Share-based payment, leasing transactions that are within the scope of IFRS 17 Leases, and measurements that have some similarities to fair value but are not fair value, such as net realisable value in IAS 2 Inventories or value in use in IAS 36 Impairment of Assets. In addition, for financial reporting purposes, fair value measurements are categorized into Level 1, 2 or 3 based on the degree to which the inputs to the fair value measurements are observable and the significance of the inputs to the fair value measurement in its entirety, which are described as follows:
• Level 1 inputs are quoted prices (unadjusted) in active markets for identical assets or liabilities that the entity can access at the measurement date;
• Level 2 inputs are inputs, other than quoted prices included within Level 1, that are observable for the asset or liability, either directly or indirectly; and
• Level 3 inputs are unobservable inputs for the asset or liability
- 15 -
3. CRITICAL ACCOUNTING JUDGMENTS AND KEY SOURCES OF ES TIMATING UNCERTAINTY:
In the application of the Group accounting policies, which are described in Note 2, management is required to make judgments, estimates and assumptions about the carrying amounts of assets and liabilities that are not readily apparent from other sources. The estimates and associated assumptions are based on historical experience and other factors that are considered to be relevant. Actual results may differ from these estimates. The estimates and underlying assumptions are reviewed on an ongoing basis. Revisions to accounting estimates are recognized in the period in which the estimate is revised if the revision affects only that period or in the period of the revision and future periods if the revision affects both current and future periods. The estimates and assumptions that have a significant risk of causing a material adjustment to the carrying amounts of assets and liabilities within the next financial year are addressed below: (1) Allowance for Trade and Other Receivables An allowance for doubtful accounts is recognized based on assessment of recoverability of trade and other receivables. Whether any impairment from trade and other receivables exists is assessed based on the management’s judgments and estimations. The management’s judgments and estimates consider the Group’s past experience of collecting payments and an increase in the number of delayed payments in the portfolio past the average credit period, as well as observable changes in national or local economic conditions that correlate with default on receivables. Total value of trade and other receivables and an allowance for doubtful accounts is disclosed in Note 8. (2) Depreciation Depreciation of production facilities used in processes of manufacturing automobiles and motorcycles is recognized by using the straight-line method over their useful lives. The Group’s management estimates useful lives for production facilities at less than five years. Technology development and changes in the assets’ expected capacity of physical output may affect economic useful lives of production facilities. Useful lives of production facilities as of the end of the Group’s reporting period are disclosed in Note 2. (3) Impairment of Non-financial Assets other than Goodwill At the end of the reporting period, the Group reviews the carrying amounts of its non-financial assets to determine whether there is any indication that those assets have suffered an impairment loss. Other non-financial assets, except for assets that have an indefinite useful life, are tested for impairment whenever there is an indication that the carrying amount will not be recoverable. In the calculation of an asset’s value in use, the Group’s management reflects an estimate of the future cash flows the entity expects to derive from the assets or the cash-generating unit, and applies the appropriate discount rate to those future cash flows.
- 16 -
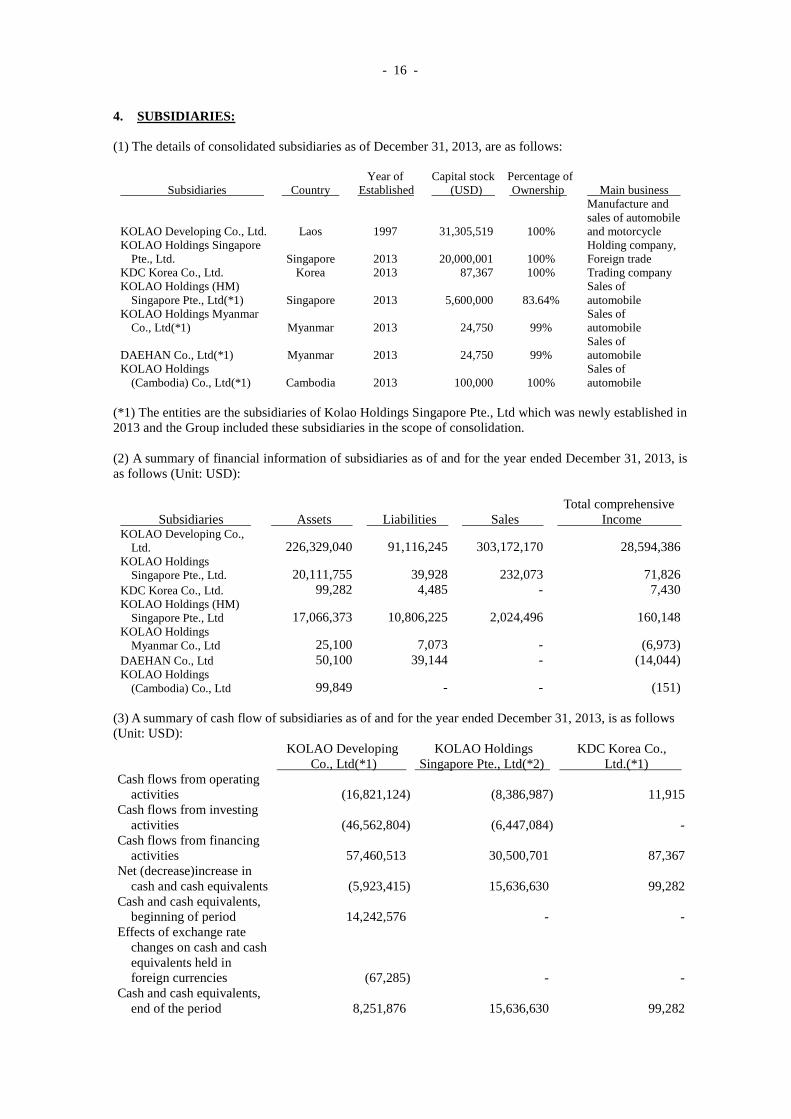
4. SUBSIDIARIES: (1) The details of consolidated subsidiaries as of December 31, 2013, are as follows:
Subsidiaries Country Year of
Established Capital stock (USD)
Percentage of Ownership Main business
KOLAO Developing Co., Ltd. Laos 1997 31,305,519 100%
Manufacture and sales of automobile and motorcycle
KOLAO Holdings Singapore Pte., Ltd. Singapore 2013 20,000,001 100%
Holding company, Foreign trade
KDC Korea Co., Ltd. Korea 2013 87,367 100% Trading company KOLAO Holdings (HM)
Singapore Pte., Ltd(*1) Singapore 2013 5,600,000 83.64% Sales of automobile
KOLAO Holdings Myanmar Co., Ltd(*1) Myanmar 2013 24,750 99%
Sales of automobile
DAEHAN Co., Ltd(*1) Myanmar 2013 24,750 99% Sales of automobile
KOLAO Holdings (Cambodia) Co., Ltd(*1) Cambodia 2013 100,000 100%
Sales of automobile
(*1) The entities are the subsidiaries of Kolao Holdings Singapore Pte., Ltd which was newly established in 2013 and the Group included these subsidiaries in the scope of consolidation. (2) A summary of financial information of subsidiaries as of and for the year ended December 31, 2013, is as follows (Unit: USD):
Subsidiaries Assets Liabilities Sales Total comprehensive
Income KOLAO Developing Co.,
Ltd. 226,329,040 91,116,245 303,172,170 28,594,386 KOLAO Holdings
Singapore Pte., Ltd. 20,111,755 39,928 232,073 71,826 KDC Korea Co., Ltd. 99,282 4,485 - 7,430 KOLAO Holdings (HM)
Singapore Pte., Ltd 17,066,373 10,806,225 2,024,496 160,148 KOLAO Holdings
Myanmar Co., Ltd 25,100 7,073 - (6,973) DAEHAN Co., Ltd 50,100 39,144 - (14,044) KOLAO Holdings
(Cambodia) Co., Ltd 99,849 - - (151) (3) A summary of cash flow of subsidiaries as of and for the year ended December 31, 2013, is as follows (Unit: USD):
KOLAO Developing
Co., Ltd(*1) KOLAO Holdings
Singapore Pte., Ltd(*2) KDC Korea Co.,
Ltd.(*1) Cash flows from operating
activities (16,821,124) (8,386,987) 11,915 Cash flows from investing
activities (46,562,804) (6,447,084) - Cash flows from financing
activities 57,460,513 30,500,701 87,367 Net (decrease)increase in
cash and cash equivalents (5,923,415) 15,636,630 99,282 Cash and cash equivalents,
beginning of period 14,242,576 - - Effects of exchange rate
changes on cash and cash equivalents held in foreign currencies (67,285) - -
Cash and cash equivalents, end of the period 8,251,876 15,636,630 99,282
- 17 -
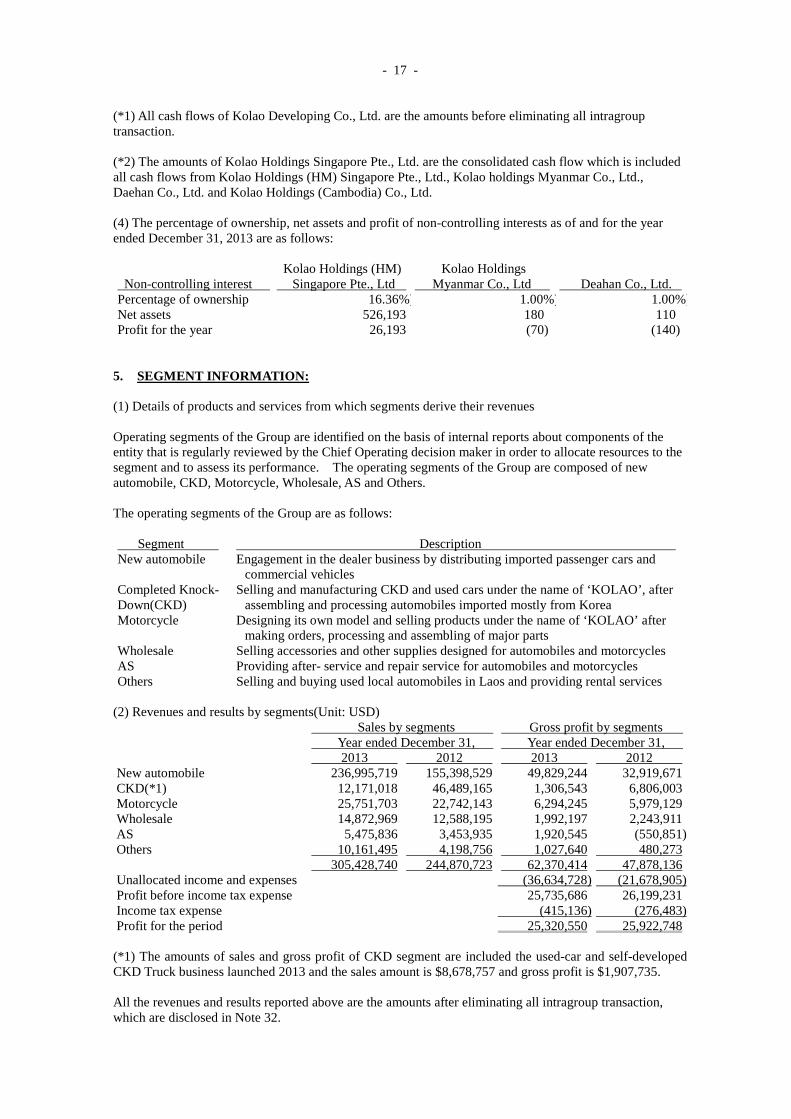
(*1) All cash flows of Kolao Developing Co., Ltd. are the amounts before eliminating all intragroup transaction. (*2) The amounts of Kolao Holdings Singapore Pte., Ltd. are the consolidated cash flow which is included all cash flows from Kolao Holdings (HM) Singapore Pte., Ltd., Kolao holdings Myanmar Co., Ltd., Daehan Co., Ltd. and Kolao Holdings (Cambodia) Co., Ltd. (4) The percentage of ownership, net assets and profit of non-controlling interests as of and for the year ended December 31, 2013 are as follows:
Non-controlling interest Kolao Holdings (HM)
Singapore Pte., Ltd Kolao Holdings
Myanmar Co., Ltd
Deahan Co., Ltd. Percentage of ownership 16.36%) 1.00%) 1.00%)Net assets 526,193 180 110 Profit for the year 26,193 (70) (140) 5. SEGMENT INFORMATION: (1) Details of products and services from which segments derive their revenues Operating segments of the Group are identified on the basis of internal reports about components of the entity that is regularly reviewed by the Chief Operating decision maker in order to allocate resources to the segment and to assess its performance. The operating segments of the Group are composed of new automobile, CKD, Motorcycle, Wholesale, AS and Others. The operating segments of the Group are as follows: Segment Description New automobile Engagement in the dealer business by distributing imported passenger cars and
commercial vehicles Completed Knock- Down(CKD)
Selling and manufacturing CKD and used cars under the name of ‘KOLAO’, after assembling and processing automobiles imported mostly from Korea
Motorcycle Designing its own model and selling products under the name of ‘KOLAO’ after making orders, processing and assembling of major parts
Wholesale Selling accessories and other supplies designed for automobiles and motorcycles AS Providing after- service and repair service for automobiles and motorcycles Others Selling and buying used local automobiles in Laos and providing rental services
(2) Revenues and results by segments(Unit: USD) Sales by segments Gross profit by segments Year ended December 31, Year ended December 31, 2013 2012 2013 2012 New automobile 236,995,719 155,398,529 49,829,244 32,919,671 CKD(*1) 12,171,018 46,489,165 1,306,543 6,806,003 Motorcycle 25,751,703 22,742,143 6,294,245 5,979,129 Wholesale 14,872,969 12,588,195 1,992,197 2,243,911 AS 5,475,836 3,453,935 1,920,545 (550,851) Others 10,161,495 4,198,756 1,027,640 480,273 305,428,740 244,870,723 62,370,414 47,878,136 Unallocated income and expenses (36,634,728) (21,678,905) Profit before income tax expense 25,735,686 26,199,231 Income tax expense (415,136) (276,483) Profit for the period 25,320,550 25,922,748 (*1) The amounts of sales and gross profit of CKD segment are included the used-car and self-developed CKD Truck business launched 2013 and the sales amount is $8,678,757 and gross profit is $1,907,735. All the revenues and results reported above are the amounts after eliminating all intragroup transaction, which are disclosed in Note 32.
- 18 -
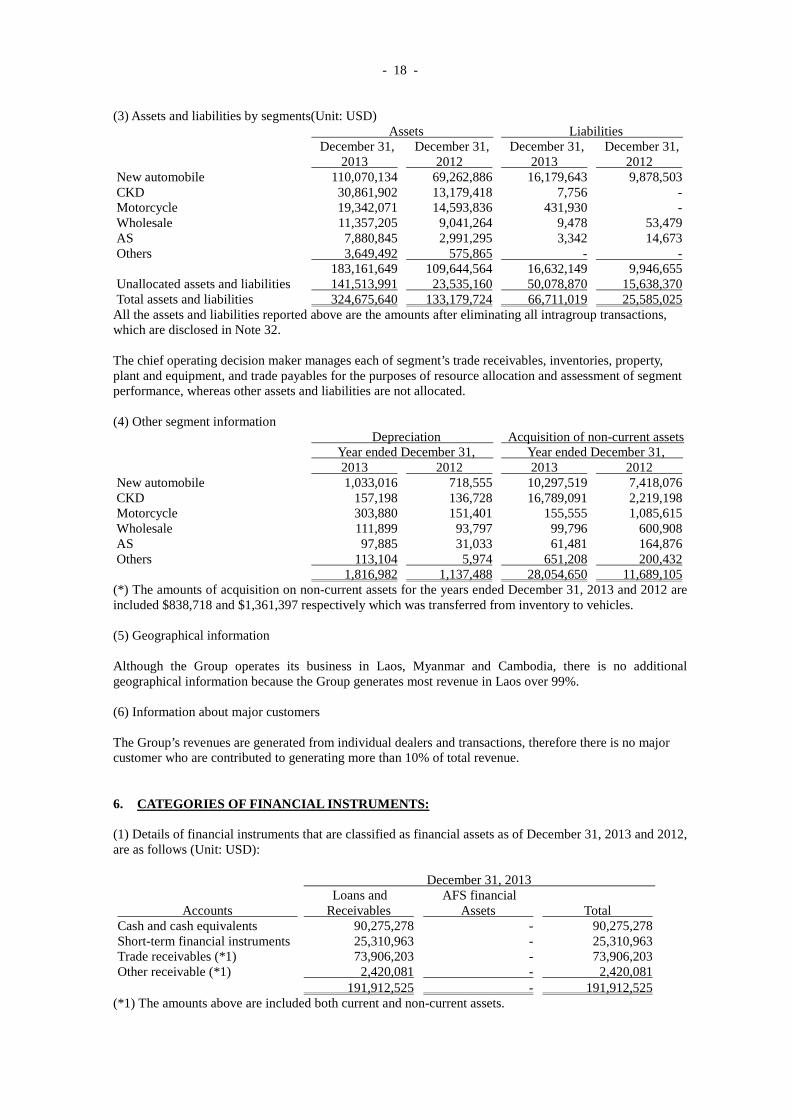
(3) Assets and liabilities by segments(Unit: USD) Assets Liabilities
December 31,
2013 December 31,
2012 December 31,
2013 December 31,
2012 New automobile 110,070,134 69,262,886 16,179,643 9,878,503 CKD 30,861,902 13,179,418 7,756 - Motorcycle 19,342,071 14,593,836 431,930 - Wholesale 11,357,205 9,041,264 9,478 53,479 AS 7,880,845 2,991,295 3,342 14,673 Others 3,649,492 575,865 - - 183,161,649 109,644,564 16,632,149 9,946,655 Unallocated assets and liabilities 141,513,991 23,535,160 50,078,870 15,638,370 Total assets and liabilities 324,675,640 133,179,724 66,711,019 25,585,025 All the assets and liabilities reported above are the amounts after eliminating all intragroup transactions, which are disclosed in Note 32. The chief operating decision maker manages each of segment’s trade receivables, inventories, property, plant and equipment, and trade payables for the purposes of resource allocation and assessment of segment performance, whereas other assets and liabilities are not allocated. (4) Other segment information Depreciation Acquisition of non-current assets Year ended December 31, Year ended December 31, 2013 2012 2013 2012 New automobile 1,033,016 718,555 10,297,519 7,418,076 CKD 157,198 136,728 16,789,091 2,219,198 Motorcycle 303,880 151,401 155,555 1,085,615 Wholesale 111,899 93,797 99,796 600,908 AS 97,885 31,033 61,481 164,876 Others 113,104 5,974 651,208 200,432 1,816,982 1,137,488 28,054,650 11,689,105 (*) The amounts of acquisition on non-current assets for the years ended December 31, 2013 and 2012 are included $838,718 and $1,361,397 respectively which was transferred from inventory to vehicles. (5) Geographical information Although the Group operates its business in Laos, Myanmar and Cambodia, there is no additional geographical information because the Group generates most revenue in Laos over 99%. (6) Information about major customers The Group’s revenues are generated from individual dealers and transactions, therefore there is no major customer who are contributed to generating more than 10% of total revenue. 6. CATEGORIES OF FINANCIAL INSTRUMENTS: (1) Details of financial instruments that are classified as financial assets as of December 31, 2013 and 2012, are as follows (Unit: USD): December 31, 2013
Accounts Loans and
Receivables AFS financial
Assets Total Cash and cash equivalents 90,275,278 - 90,275,278 Short-term financial instruments 25,310,963 - 25,310,963 Trade receivables (*1) 73,906,203 - 73,906,203 Other receivable (*1) 2,420,081 - 2,420,081 191,912,525 - 191,912,525
(*1) The amounts above are included both current and non-current assets.
- 19 -
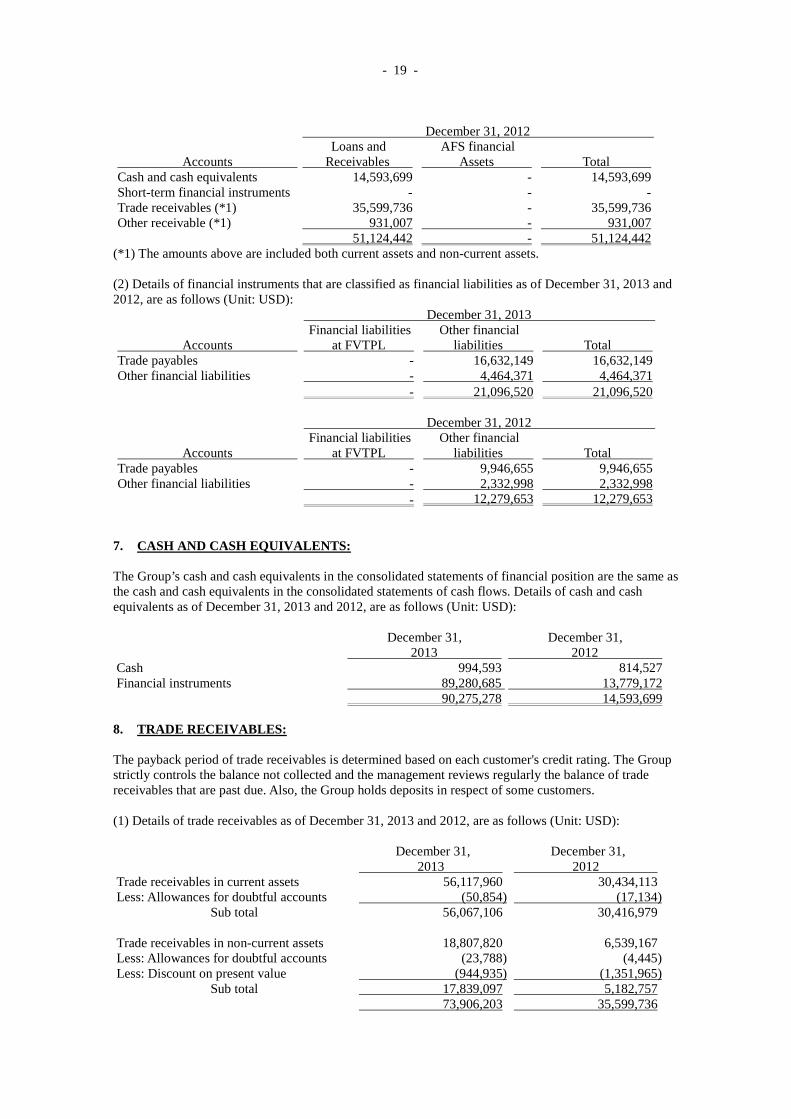
December 31, 2012
Accounts Loans and
Receivables AFS financial
Assets Total Cash and cash equivalents 14,593,699 - 14,593,699 Short-term financial instruments - - - Trade receivables (*1) 35,599,736 - 35,599,736 Other receivable (*1) 931,007 - 931,007 51,124,442 - 51,124,442
(*1) The amounts above are included both current assets and non-current assets. (2) Details of financial instruments that are classified as financial liabilities as of December 31, 2013 and 2012, are as follows (Unit: USD): December 31, 2013
Accounts Financial liabilities
at FVTPL Other financial
liabilities Total Trade payables - 16,632,149 16,632,149 Other financial liabilities - 4,464,371 4,464,371 - 21,096,520 21,096,520
December 31, 2012
Accounts Financial liabilities
at FVTPL Other financial
liabilities Total Trade payables - 9,946,655 9,946,655 Other financial liabilities - 2,332,998 2,332,998 - 12,279,653 12,279,653
7. CASH AND CASH EQUIVALENTS: The Group’s cash and cash equivalents in the consolidated statements of financial position are the same as the cash and cash equivalents in the consolidated statements of cash flows. Details of cash and cash equivalents as of December 31, 2013 and 2012, are as follows (Unit: USD):
December 31,
2013 December 31,
2012 Cash 994,593 814,527 Financial instruments 89,280,685 13,779,172 90,275,278 14,593,699 8. TRADE RECEIVABLES: The payback period of trade receivables is determined based on each customer's credit rating. The Group strictly controls the balance not collected and the management reviews regularly the balance of trade receivables that are past due. Also, the Group holds deposits in respect of some customers. (1) Details of trade receivables as of December 31, 2013 and 2012, are as follows (Unit: USD):
December 31,
2013 December 31,
2012 Trade receivables in current assets 56,117,960 30,434,113 Less: Allowances for doubtful accounts (50,854) (17,134)
Sub total 56,067,106 30,416,979 Trade receivables in non-current assets 18,807,820 6,539,167 Less: Allowances for doubtful accounts (23,788) (4,445) Less: Discount on present value (944,935) (1,351,965)
Sub total 17,839,097 5,182,757 73,906,203 35,599,736
- 20 -
The trade receivables, excluding interest-bearing receivables, obtained from installment sales are classified as current assets because they reach maturity within one year from the end of the reporting period. The fair value approximates the book value because the effect of discount is not material. The interest-bearing receivables obtained from the installment sales, which reach maturity after one year, are classified as non-current assets and discount on present value according to effective interest method for long-term installment receivables is recorded. The Company used an interest rate of installment receivables that has a similar credit condition, because there is no local enterprise that has a same credit condition. (2) The aging analysis of the trade receivables as of December 31, 2013 and 2012, is as follows(Unit: USD): December 31, 2013
Accounts Within 6
Months 6 months
–1 year 1–2 years 2–3 years More than
3 years Total Trade receivables 58,126,874 11,408,954 5,125,707 256,004 8,241 74,925,780 Allowances for doubtful accounts (655) (224) (54,497) (11,025) (8,241) (74,642) 58,126,219 11,408,730 5,071,210 244,979 - 74,851,138 December 31, 2012
Accounts Within 6
months 6 months
–1 year 1–2 years 2–3 years More than
3 years Total Trade receivables 33,570,409 2,410,781 933,422 38,179 20,489 36,973,280 Allowances for doubtful accounts (726) (54) (291) (19) (20,489) (21,579) 33,569,683 2,410,727 933,131 38,160 - 36,951,701 If the trade receivables become overdue, the Group renegotiates the payment terms, such as an extension of due by each individual receivable. In that case, the Group collects trade receivables and determines whether receivables are overdue according to the new terms. By the individual analysis, the Group recognizes impairment loss on overdue receivables that are not collected because the initial or new conditions are not satisfied. (3) Changes in allowance for doubtful accounts for the years ended December 31, 2013 and 2012, are as follows (Units: USD):
December 31,
2013 December 31,
2012 Beginning balance 21,579 44,445 Offsetting of allowance - (19,886) Reversal of allowance 53,063 (2,980) Ending balance 74,642 21,579 9. OTHER RECEIVABLES:
The Group’s other receivables as of December 31, 2013 and 2012, are as follows (Unit: USD): December 31, 2013 December 31, 2012 Current Non-current Current Non-current Short-term loans (*1) 22,594 - 56,705 - Other accounts receivables 122,796 - 513,637 - Accrued income 130,799 - - - Business leasehold deposit - 2,005,000 - 305,000 Guarantee deposits - 138,892 - 55,665 276,189 2,143,892 570,342 360,665 (*1) The total amount represents interest-free loans for employees and is deducted from employees’ salaries every month. Those loans are mostly repaid within 12 months so that there are no differences between the fair value and book value of loans.
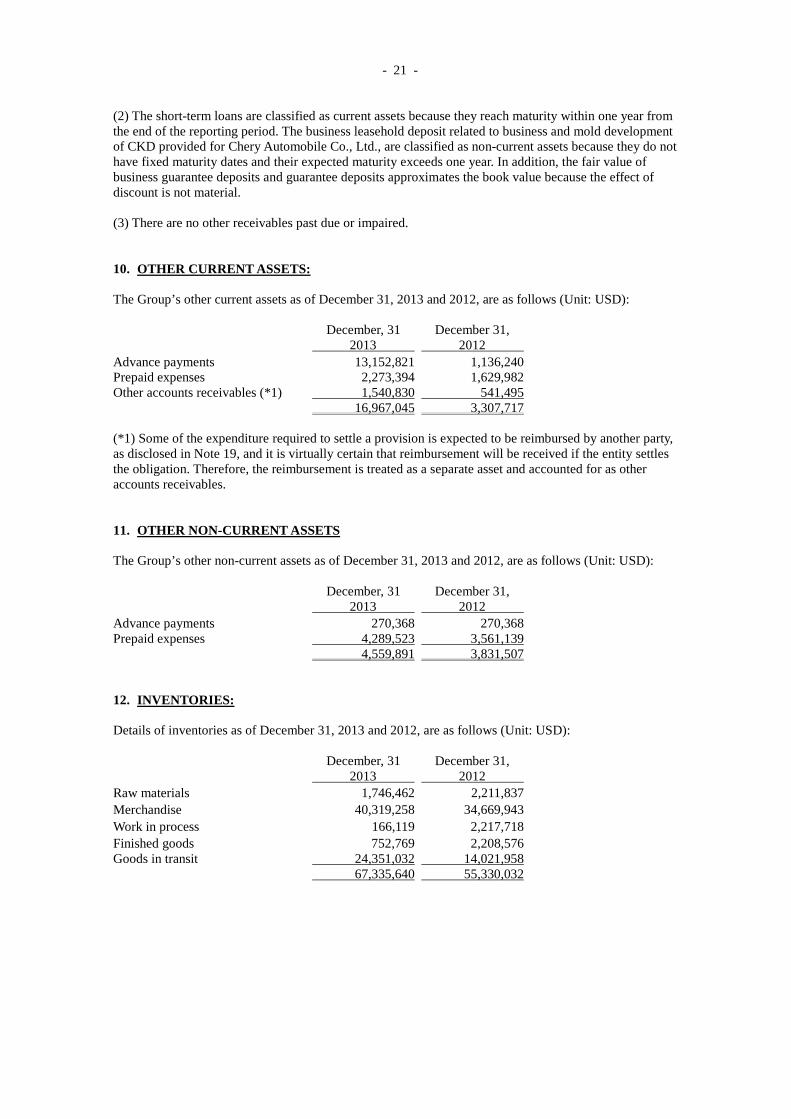
- 21 -
(2) The short-term loans are classified as current assets because they reach maturity within one year from the end of the reporting period. The business leasehold deposit related to business and mold development of CKD provided for Chery Automobile Co., Ltd., are classified as non-current assets because they do not have fixed maturity dates and their expected maturity exceeds one year. In addition, the fair value of business guarantee deposits and guarantee deposits approximates the book value because the effect of discount is not material. (3) There are no other receivables past due or impaired. 10. OTHER CURRENT ASSETS:
The Group’s other current assets as of December 31, 2013 and 2012, are as follows (Unit: USD):
December, 31
2013 December 31, 2012
Advance payments 13,152,821 1,136,240 Prepaid expenses 2,273,394 1,629,982 Other accounts receivables (*1) 1,540,830 541,495 16,967,045 3,307,717 (*1) Some of the expenditure required to settle a provision is expected to be reimbursed by another party, as disclosed in Note 19, and it is virtually certain that reimbursement will be received if the entity settles the obligation. Therefore, the reimbursement is treated as a separate asset and accounted for as other accounts receivables. 11. OTHER NON-CURRENT ASSETS The Group’s other non-current assets as of December 31, 2013 and 2012, are as follows (Unit: USD):
December, 31
2013 December 31, 2012
Advance payments 270,368 270,368 Prepaid expenses 4,289,523 3,561,139 4,559,891 3,831,507 12. INVENTORIES: Details of inventories as of December 31, 2013 and 2012, are as follows (Unit: USD):
December, 31
2013 December 31, 2012
Raw materials 1,746,462 2,211,837 Merchandise 40,319,258 34,669,943 Work in process 166,119 2,217,718 Finished goods 752,769 2,208,576 Goods in transit 24,351,032 14,021,958 67,335,640 55,330,032
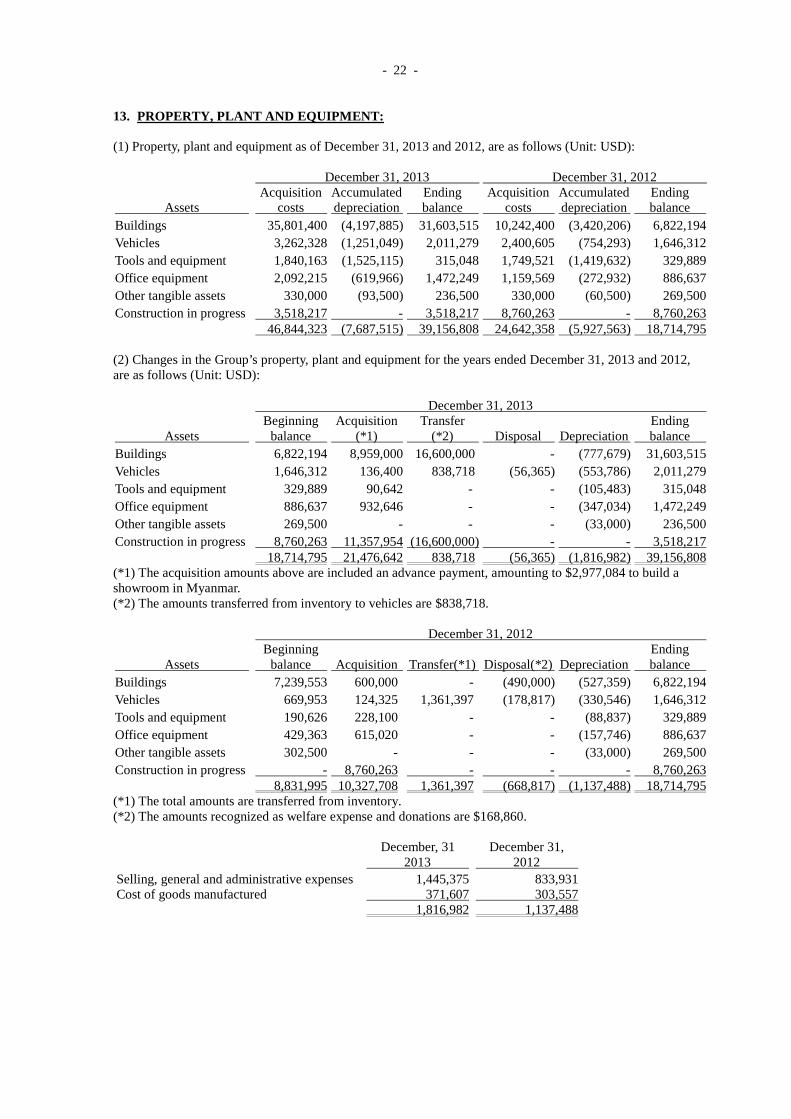
- 22 -
13. PROPERTY, PLANT AND EQUIPMENT: (1) Property, plant and equipment as of December 31, 2013 and 2012, are as follows (Unit: USD): December 31, 2013 December 31, 2012
Assets Acquisition costs
Accumulated depreciation
Ending balance
Acquisition costs
Accumulated depreciation
Ending balance
Buildings 35,801,400 (4,197,885) 31,603,515 10,242,400 (3,420,206) 6,822,194 Vehicles 3,262,328 (1,251,049) 2,011,279 2,400,605 (754,293) 1,646,312 Tools and equipment 1,840,163 (1,525,115) 315,048 1,749,521 (1,419,632) 329,889 Office equipment 2,092,215 (619,966) 1,472,249 1,159,569 (272,932) 886,637 Other tangible assets 330,000 (93,500) 236,500 330,000 (60,500) 269,500 Construction in progress 3,518,217 - 3,518,217 8,760,263 - 8,760,263 46,844,323 (7,687,515) 39,156,808 24,642,358 (5,927,563) 18,714,795 (2) Changes in the Group’s property, plant and equipment for the years ended December 31, 2013 and 2012, are as follows (Unit: USD): December 31, 2013
Assets Beginning balance
Acquisition (*1)
Transfer (*2)
Disposal Depreciation
Ending balance
Buildings 6,822,194 8,959,000 16,600,000 - (777,679) 31,603,515 Vehicles 1,646,312 136,400 838,718 (56,365) (553,786) 2,011,279 Tools and equipment 329,889 90,642 - - (105,483) 315,048 Office equipment 886,637 932,646 - - (347,034) 1,472,249 Other tangible assets 269,500 - - - (33,000) 236,500 Construction in progress 8,760,263 11,357,954 (16,600,000) - - 3,518,217 18,714,795 21,476,642 838,718 (56,365) (1,816,982) 39,156,808 (*1) The acquisition amounts above are included an advance payment, amounting to $2,977,084 to build a showroom in Myanmar. (*2) The amounts transferred from inventory to vehicles are $838,718. December 31, 2012
Assets Beginning balance Acquisition
Transfer(*1)
Disposal(*2) Depreciation
Ending balance
Buildings 7,239,553 600,000 - (490,000) (527,359) 6,822,194 Vehicles 669,953 124,325 1,361,397 (178,817) (330,546) 1,646,312 Tools and equipment 190,626 228,100 - - (88,837) 329,889 Office equipment 429,363 615,020 - - (157,746) 886,637 Other tangible assets 302,500 - - - (33,000) 269,500 Construction in progress - 8,760,263 - - - 8,760,263 8,831,995 10,327,708 1,361,397 (668,817) (1,137,488) 18,714,795 (*1) The total amounts are transferred from inventory. (*2) The amounts recognized as welfare expense and donations are $168,860.
December, 31
2013 December 31, 2012
Selling, general and administrative expenses 1,445,375 833,931 Cost of goods manufactured 371,607 303,557 1,816,982 1,137,488
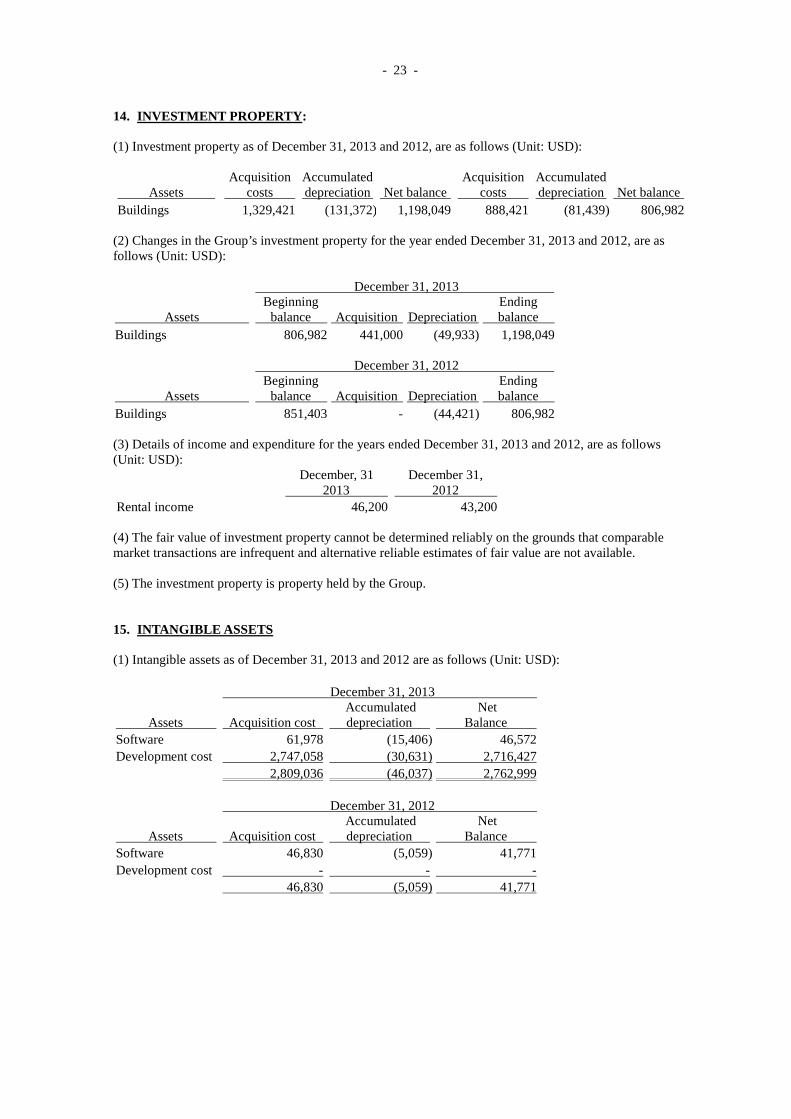
- 23 -
14. INVESTMENT PROPERTY:
(1) Investment property as of December 31, 2013 and 2012, are as follows (Unit: USD):
Assets Acquisition costs
Accumulated depreciation Net balance
Acquisition costs
Accumulated depreciation Net balance
Buildings 1,329,421 (131,372) 1,198,049 888,421 (81,439) 806,982 (2) Changes in the Group’s investment property for the year ended December 31, 2013 and 2012, are as follows (Unit: USD):
December 31, 2013
Assets Beginning balance Acquisition
Depreciation
Ending balance
Buildings 806,982 441,000 (49,933) 1,198,049 December 31, 2012
Assets Beginning balance Acquisition
Depreciation
Ending balance
Buildings 851,403 - (44,421) 806,982 (3) Details of income and expenditure for the years ended December 31, 2013 and 2012, are as follows (Unit: USD):
December, 31
2013 December 31, 2012
Rental income 46,200 43,200 (4) The fair value of investment property cannot be determined reliably on the grounds that comparable market transactions are infrequent and alternative reliable estimates of fair value are not available.
(5) The investment property is property held by the Group. 15. INTANGIBLE ASSETS
(1) Intangible assets as of December 31, 2013 and 2012 are as follows (Unit: USD): December 31, 2013
Assets Acquisition cost Accumulated
depreciation Net
Balance Software 61,978 (15,406) 46,572 Development cost 2,747,058 (30,631) 2,716,427 2,809,036 (46,037) 2,762,999 December 31, 2012
Assets Acquisition cost Accumulated
depreciation Net
Balance Software 46,830 (5,059) 41,771 Development cost - - - 46,830 (5,059) 41,771
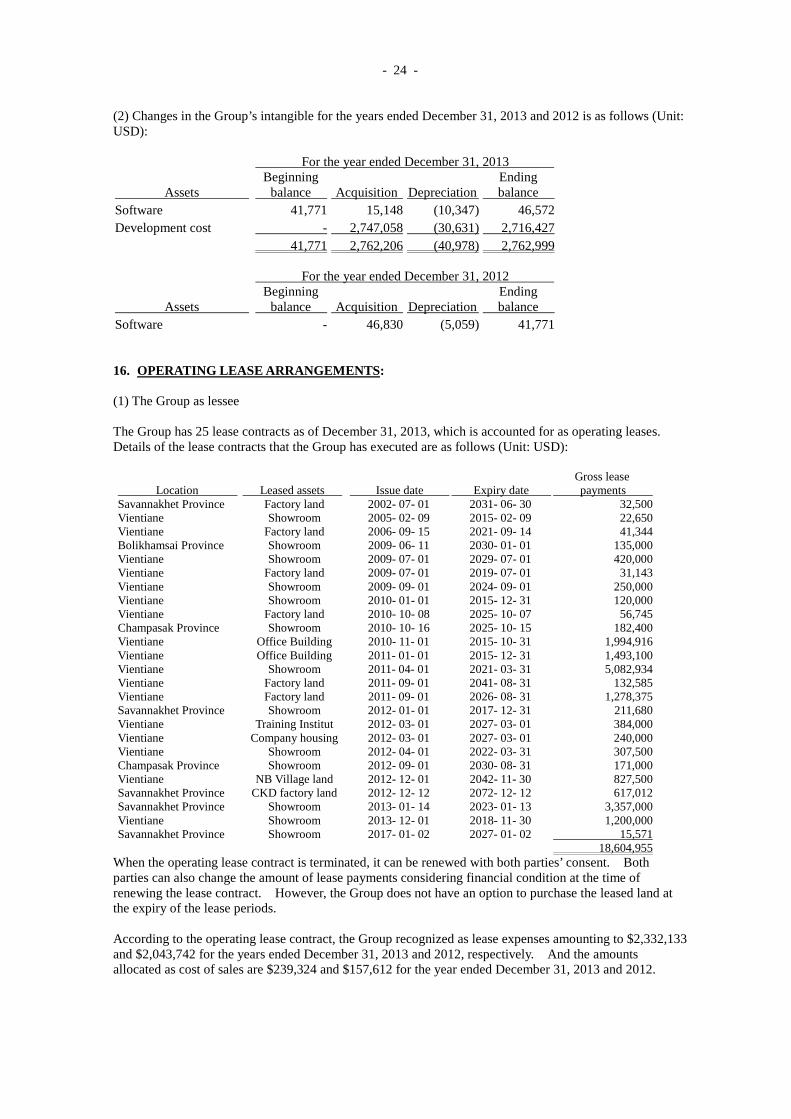
- 24 -
(2) Changes in the Group’s intangible for the years ended December 31, 2013 and 2012 is as follows (Unit: USD): For the year ended December 31, 2013
Assets Beginning balance Acquisition
Depreciation
Ending balance
Software 41,771 15,148 (10,347) 46,572 Development cost - 2,747,058 (30,631) 2,716,427 41,771 2,762,206 (40,978) 2,762,999 For the year ended December 31, 2012
Assets Beginning balance Acquisition
Depreciation
Ending balance
Software - 46,830 (5,059) 41,771 16. OPERATING LEASE ARRANGEMENTS: (1) The Group as lessee The Group has 25 lease contracts as of December 31, 2013, which is accounted for as operating leases. Details of the lease contracts that the Group has executed are as follows (Unit: USD):
Location Leased assets Issue date Expiry date Gross lease
payments Savannakhet Province Factory land 2002- 07- 01 2031- 06- 30 32,500 Vientiane Showroom 2005- 02- 09 2015- 02- 09 22,650 Vientiane Factory land 2006- 09- 15 2021- 09- 14 41,344 Bolikhamsai Province Showroom 2009- 06- 11 2030- 01- 01 135,000 Vientiane Showroom 2009- 07- 01 2029- 07- 01 420,000 Vientiane Factory land 2009- 07- 01 2019- 07- 01 31,143 Vientiane Showroom 2009- 09- 01 2024- 09- 01 250,000 Vientiane Showroom 2010- 01- 01 2015- 12- 31 120,000 Vientiane Factory land 2010- 10- 08 2025- 10- 07 56,745 Champasak Province Showroom 2010- 10- 16 2025- 10- 15 182,400 Vientiane Office Building 2010- 11- 01 2015- 10- 31 1,994,916 Vientiane Office Building 2011- 01- 01 2015- 12- 31 1,493,100 Vientiane Showroom 2011- 04- 01 2021- 03- 31 5,082,934 Vientiane Factory land 2011- 09- 01 2041- 08- 31 132,585 Vientiane Factory land 2011- 09- 01 2026- 08- 31 1,278,375 Savannakhet Province Showroom 2012- 01- 01 2017- 12- 31 211,680 Vientiane Training Institut 2012- 03- 01 2027- 03- 01 384,000 Vientiane Company housing 2012- 03- 01 2027- 03- 01 240,000 Vientiane Showroom 2012- 04- 01 2022- 03- 31 307,500 Champasak Province Showroom 2012- 09- 01 2030- 08- 31 171,000 Vientiane NB Village land 2012- 12- 01 2042- 11- 30 827,500 Savannakhet Province CKD factory land 2012- 12- 12 2072- 12- 12 617,012 Savannakhet Province Showroom 2013- 01- 14 2023- 01- 13 3,357,000 Vientiane Showroom 2013- 12- 01 2018- 11- 30 1,200,000 Savannakhet Province Showroom 2017- 01- 02 2027- 01- 02 15,571 18,604,955
When the operating lease contract is terminated, it can be renewed with both parties’ consent. Both parties can also change the amount of lease payments considering financial condition at the time of renewing the lease contract. However, the Group does not have an option to purchase the leased land at the expiry of the lease periods. According to the operating lease contract, the Group recognized as lease expenses amounting to $2,332,133 and $2,043,742 for the years ended December 31, 2013 and 2012, respectively. And the amounts allocated as cost of sales are $239,324 and $157,612 for the year ended December 31, 2013 and 2012.
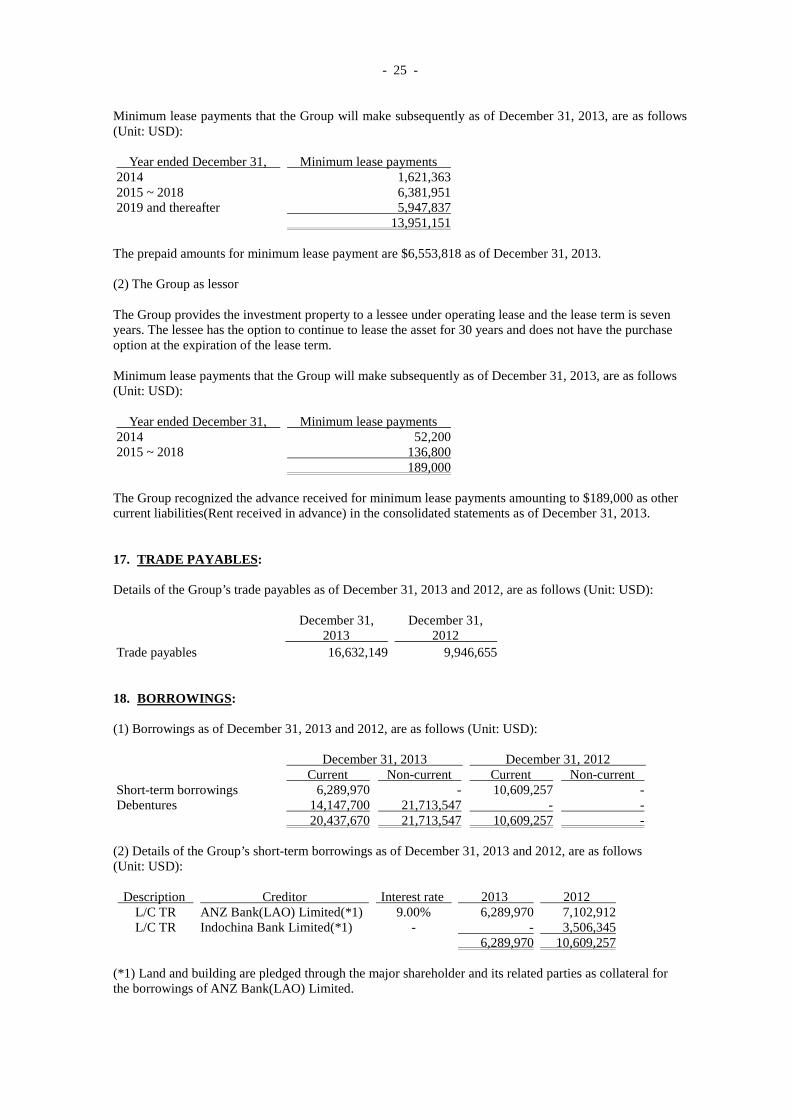
- 25 -
Minimum lease payments that the Group will make subsequently as of December 31, 2013, are as follows (Unit: USD): Year ended December 31, Minimum lease payments 2014 1,621,363 2015 ~ 2018 6,381,951 2019 and thereafter 5,947,837 13,951,151 The prepaid amounts for minimum lease payment are $6,553,818 as of December 31, 2013. (2) The Group as lessor The Group provides the investment property to a lessee under operating lease and the lease term is seven years. The lessee has the option to continue to lease the asset for 30 years and does not have the purchase option at the expiration of the lease term. Minimum lease payments that the Group will make subsequently as of December 31, 2013, are as follows (Unit: USD): Year ended December 31, Minimum lease payments 2014 52,200 2015 ~ 2018 136,800 189,000 The Group recognized the advance received for minimum lease payments amounting to $189,000 as other current liabilities(Rent received in advance) in the consolidated statements as of December 31, 2013. 17. TRADE PAYABLES: Details of the Group’s trade payables as of December 31, 2013 and 2012, are as follows (Unit: USD):
December 31,
2013 December 31, 2012
Trade payables 16,632,149 9,946,655 18. BORROWINGS: (1) Borrowings as of December 31, 2013 and 2012, are as follows (Unit: USD): December 31, 2013 December 31, 2012 Current Non-current Current Non-current Short-term borrowings 6,289,970 - 10,609,257 - Debentures 14,147,700 21,713,547 - - 20,437,670 21,713,547 10,609,257 - (2) Details of the Group’s short-term borrowings as of December 31, 2013 and 2012, are as follows (Unit: USD): Description Creditor Interest rate 2013 2012
L/C TR ANZ Bank(LAO) Limited(*1) 9.00% 6,289,970 7,102,912 L/C TR Indochina Bank Limited(*1) - - 3,506,345
6,289,970 10,609,257 (*1) Land and building are pledged through the major shareholder and its related parties as collateral for the borrowings of ANZ Bank(LAO) Limited.
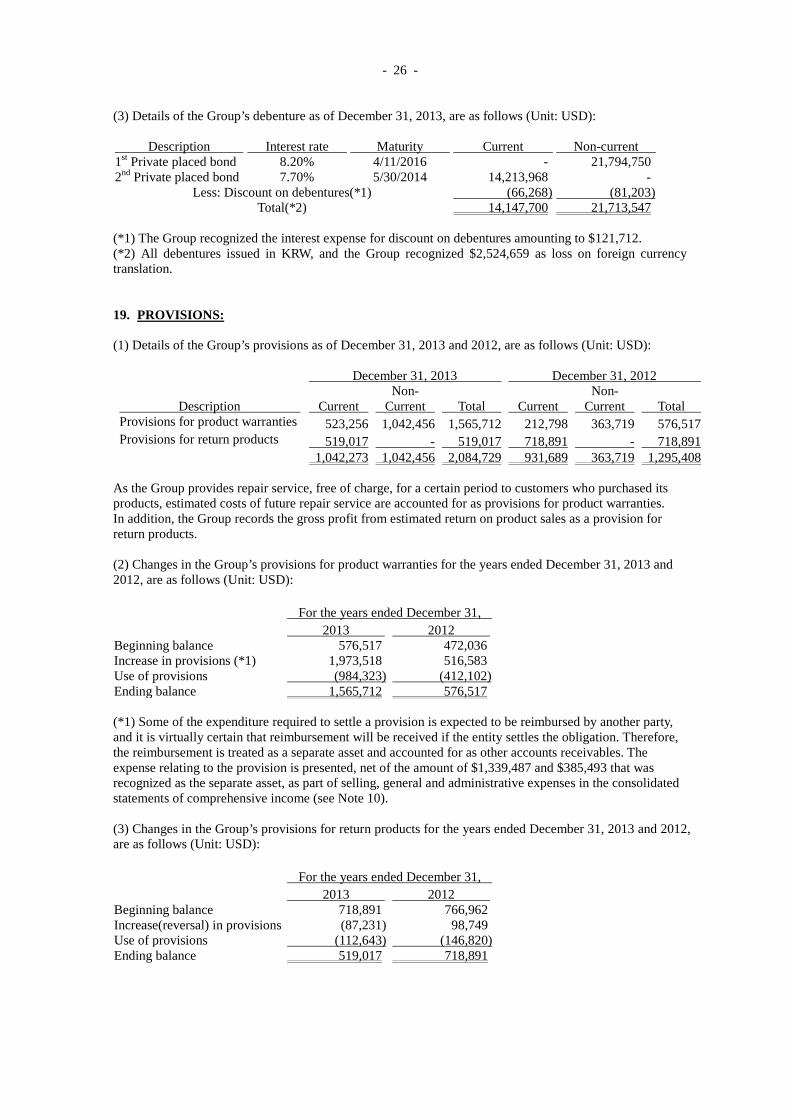
- 26 -
(3) Details of the Group’s debenture as of December 31, 2013, are as follows (Unit: USD): Description Interest rate Maturity Current Non-current 1st Private placed bond 8.20% 4/11/2016 - 21,794,750 2nd Private placed bond 7.70% 5/30/2014 14,213,968 -
Less: Discount on debentures(*1) (66,268) (81,203) Total(*2) 14,147,700 21,713,547
(*1) The Group recognized the interest expense for discount on debentures amounting to $121,712. (*2) All debentures issued in KRW, and the Group recognized $2,524,659 as loss on foreign currency translation. 19. PROVISIONS: (1) Details of the Group’s provisions as of December 31, 2013 and 2012, are as follows (Unit: USD):
December 31, 2013 December 31, 2012
Description Current Non-
Current Total Current Non-
Current Total Provisions for product warranties 523,256 1,042,456 1,565,712 212,798 363,719 576,517 Provisions for return products 519,017 - 519,017 718,891 - 718,891
1,042,273 1,042,456 2,084,729 931,689 363,719 1,295,408 As the Group provides repair service, free of charge, for a certain period to customers who purchased its products, estimated costs of future repair service are accounted for as provisions for product warranties. In addition, the Group records the gross profit from estimated return on product sales as a provision for return products. (2) Changes in the Group’s provisions for product warranties for the years ended December 31, 2013 and 2012, are as follows (Unit: USD): For the years ended December 31, 2013 2012 Beginning balance 576,517 472,036 Increase in provisions (*1) 1,973,518 516,583 Use of provisions (984,323) (412,102) Ending balance 1,565,712 576,517 (*1) Some of the expenditure required to settle a provision is expected to be reimbursed by another party, and it is virtually certain that reimbursement will be received if the entity settles the obligation. Therefore, the reimbursement is treated as a separate asset and accounted for as other accounts receivables. The expense relating to the provision is presented, net of the amount of $1,339,487 and $385,493 that was recognized as the separate asset, as part of selling, general and administrative expenses in the consolidated statements of comprehensive income (see Note 10). (3) Changes in the Group’s provisions for return products for the years ended December 31, 2013 and 2012, are as follows (Unit: USD): For the years ended December 31, 2013 2012 Beginning balance 718,891 766,962 Increase(reversal) in provisions (87,231) 98,749 Use of provisions (112,643) (146,820) Ending balance 519,017 718,891
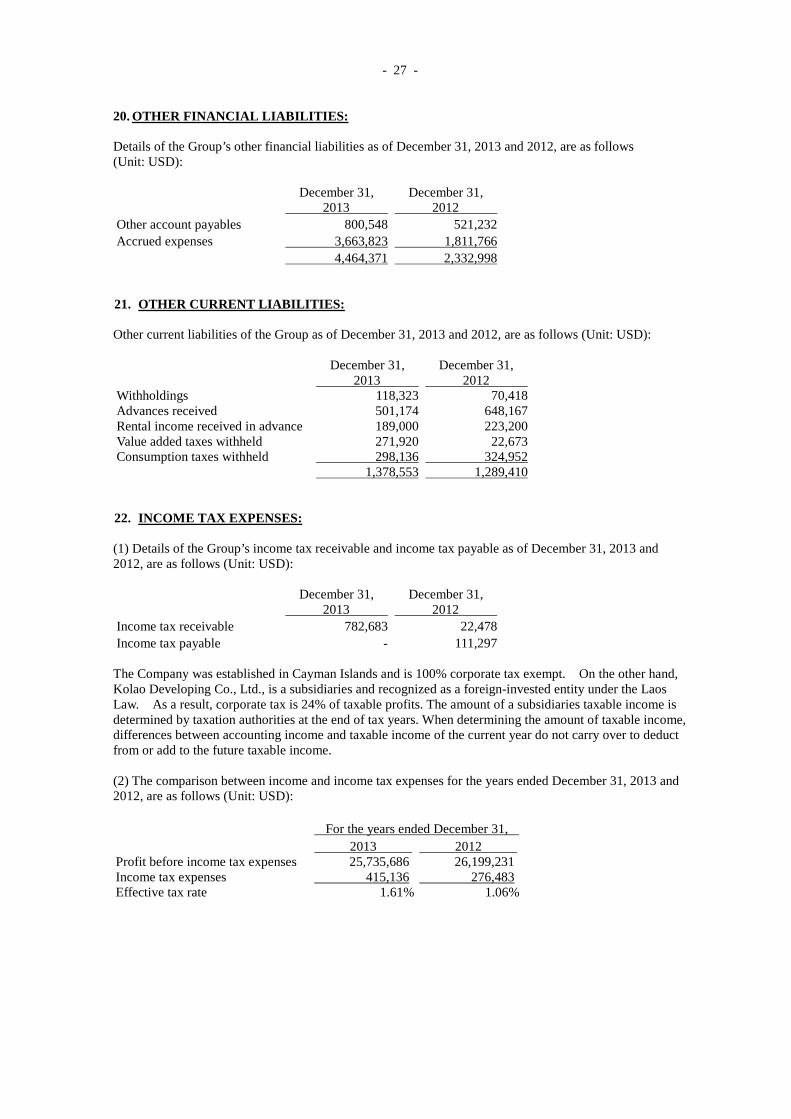
- 27 -
20. OTHER FINANCIAL LIABILITIES: Details of the Group’s other financial liabilities as of December 31, 2013 and 2012, are as follows (Unit: USD):
December 31,
2013 December 31,
2012 Other account payables 800,548 521,232 Accrued expenses 3,663,823 1,811,766 4,464,371 2,332,998 21. OTHER CURRENT LIABILITIES: Other current liabilities of the Group as of December 31, 2013 and 2012, are as follows (Unit: USD):
December 31,
2013 December 31, 2012
Withholdings 118,323 70,418 Advances received 501,174 648,167 Rental income received in advance 189,000 223,200 Value added taxes withheld 271,920 22,673 Consumption taxes withheld 298,136 324,952 1,378,553 1,289,410 22. INCOME TAX EXPENSES: (1) Details of the Group’s income tax receivable and income tax payable as of December 31, 2013 and 2012, are as follows (Unit: USD):
December 31,
2013 December 31,
2012 Income tax receivable 782,683 22,478 Income tax payable - 111,297 The Company was established in Cayman Islands and is 100% corporate tax exempt. On the other hand, Kolao Developing Co., Ltd., is a subsidiaries and recognized as a foreign-invested entity under the Laos Law. As a result, corporate tax is 24% of taxable profits. The amount of a subsidiaries taxable income is determined by taxation authorities at the end of tax years. When determining the amount of taxable income, differences between accounting income and taxable income of the current year do not carry over to deduct from or add to the future taxable income. (2) The comparison between income and income tax expenses for the years ended December 31, 2013 and 2012, are as follows (Unit: USD): For the years ended December 31, 2013 2012 Profit before income tax expenses 25,735,686 26,199,231 Income tax expenses 415,136 276,483 Effective tax rate 1.61% 1.06%
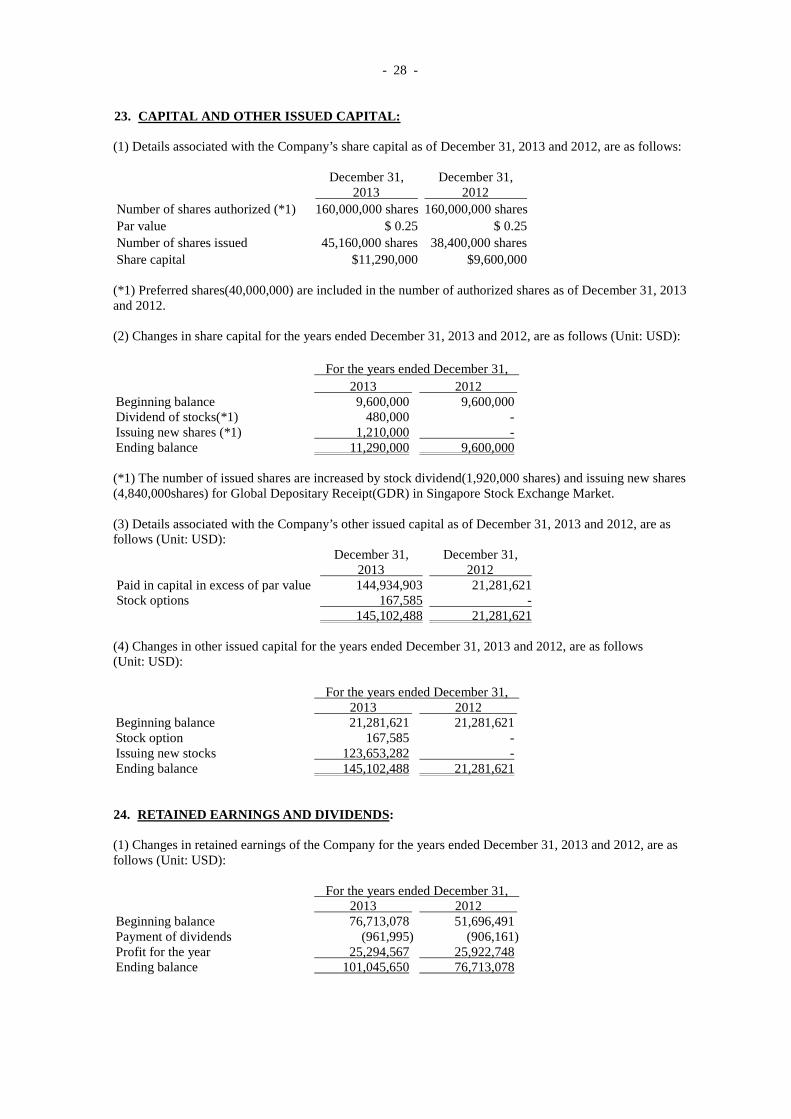
- 28 -
23. CAPITAL AND OTHER ISSUED CAPITAL: (1) Details associated with the Company’s share capital as of December 31, 2013 and 2012, are as follows:
December 31,
2013 December 31,
2012 Number of shares authorized (*1) 160,000,000 shares 160,000,000 shares Par value $ 0.25 $ 0.25 Number of shares issued 45,160,000 shares 38,400,000 shares Share capital $11,290,000 $9,600,000 (*1) Preferred shares(40,000,000) are included in the number of authorized shares as of December 31, 2013 and 2012. (2) Changes in share capital for the years ended December 31, 2013 and 2012, are as follows (Unit: USD): For the years ended December 31, 2013 2012 Beginning balance 9,600,000 9,600,000 Dividend of stocks(*1) 480,000 - Issuing new shares (*1) 1,210,000 - Ending balance 11,290,000 9,600,000 (*1) The number of issued shares are increased by stock dividend(1,920,000 shares) and issuing new shares (4,840,000shares) for Global Depositary Receipt(GDR) in Singapore Stock Exchange Market. (3) Details associated with the Company’s other issued capital as of December 31, 2013 and 2012, are as follows (Unit: USD):
December 31,
2013 December 31,
2012 Paid in capital in excess of par value 144,934,903 21,281,621 Stock options 167,585 - 145,102,488 21,281,621 (4) Changes in other issued capital for the years ended December 31, 2013 and 2012, are as follows (Unit: USD): For the years ended December 31, 2013 2012 Beginning balance 21,281,621 21,281,621 Stock option 167,585 - Issuing new stocks 123,653,282 - Ending balance 145,102,488 21,281,621
24. RETAINED EARNINGS AND DIVIDENDS: (1) Changes in retained earnings of the Company for the years ended December 31, 2013 and 2012, are as follows (Unit: USD): For the years ended December 31, 2013 2012 Beginning balance 76,713,078 51,696,491 Payment of dividends (961,995) (906,161) Profit for the year 25,294,567 25,922,748 Ending balance 101,045,650 76,713,078
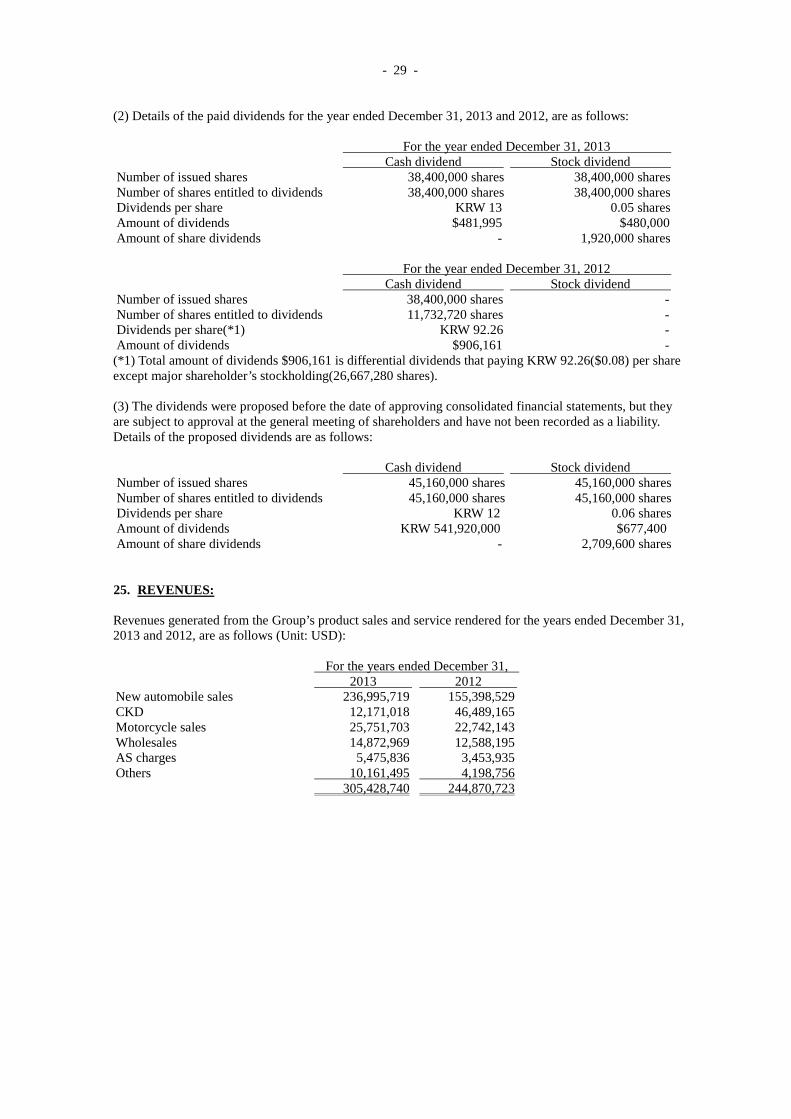
- 29 -
(2) Details of the paid dividends for the year ended December 31, 2013 and 2012, are as follows: For the year ended December 31, 2013 Cash dividend Stock dividend Number of issued shares 38,400,000 shares 38,400,000 shares Number of shares entitled to dividends 38,400,000 shares 38,400,000 shares Dividends per share KRW 13 0.05 shares Amount of dividends $481,995 $480,000 Amount of share dividends - 1,920,000 shares For the year ended December 31, 2012 Cash dividend Stock dividend Number of issued shares 38,400,000 shares - Number of shares entitled to dividends 11,732,720 shares - Dividends per share(*1) KRW 92.26 - Amount of dividends $906,161 - (*1) Total amount of dividends $906,161 is differential dividends that paying KRW 92.26($0.08) per share except major shareholder’s stockholding(26,667,280 shares). (3) The dividends were proposed before the date of approving consolidated financial statements, but they are subject to approval at the general meeting of shareholders and have not been recorded as a liability. Details of the proposed dividends are as follows: Cash dividend Stock dividend Number of issued shares 45,160,000 shares 45,160,000 shares Number of shares entitled to dividends 45,160,000 shares 45,160,000 shares Dividends per share KRW 12 0.06 shares Amount of dividends KRW 541,920,000 $677,400 Amount of share dividends - 2,709,600 shares 25. REVENUES: Revenues generated from the Group’s product sales and service rendered for the years ended December 31, 2013 and 2012, are as follows (Unit: USD): For the years ended December 31, 2013 2012 New automobile sales 236,995,719 155,398,529 CKD 12,171,018 46,489,165 Motorcycle sales 25,751,703 22,742,143 Wholesales 14,872,969 12,588,195 AS charges 5,475,836 3,453,935 Others 10,161,495 4,198,756 305,428,740 244,870,723
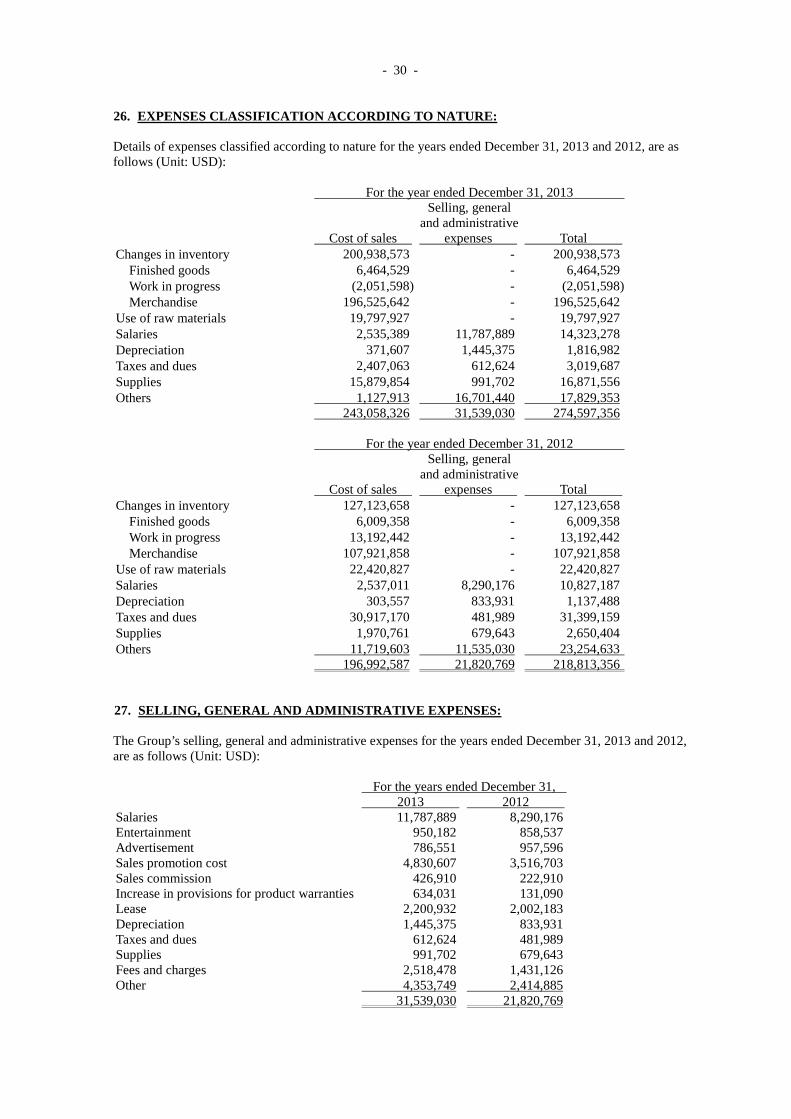
- 30 -
26. EXPENSES CLASSIFICATION ACCORDING TO NATURE: Details of expenses classified according to nature for the years ended December 31, 2013 and 2012, are as follows (Unit: USD): For the year ended December 31, 2013
Cost of sales
Selling, general and administrative expenses Total
Changes in inventory 200,938,573 - 200,938,573 Finished goods 6,464,529 - 6,464,529 Work in progress (2,051,598) - (2,051,598) Merchandise 196,525,642 - 196,525,642
Use of raw materials 19,797,927 - 19,797,927 Salaries 2,535,389 11,787,889 14,323,278 Depreciation 371,607 1,445,375 1,816,982 Taxes and dues 2,407,063 612,624 3,019,687 Supplies 15,879,854 991,702 16,871,556 Others 1,127,913 16,701,440 17,829,353 243,058,326 31,539,030 274,597,356 For the year ended December 31, 2012
Cost of sales
Selling, general and administrative expenses Total
Changes in inventory 127,123,658 - 127,123,658 Finished goods 6,009,358 - 6,009,358 Work in progress 13,192,442 - 13,192,442 Merchandise 107,921,858 - 107,921,858
Use of raw materials 22,420,827 - 22,420,827 Salaries 2,537,011 8,290,176 10,827,187 Depreciation 303,557 833,931 1,137,488 Taxes and dues 30,917,170 481,989 31,399,159 Supplies 1,970,761 679,643 2,650,404 Others 11,719,603 11,535,030 23,254,633 196,992,587 21,820,769 218,813,356 27. SELLING, GENERAL AND ADMINISTRATIVE EXPENSES: The Group’s selling, general and administrative expenses for the years ended December 31, 2013 and 2012, are as follows (Unit: USD): For the years ended December 31, 2013 2012 Salaries 11,787,889 8,290,176 Entertainment 950,182 858,537 Advertisement 786,551 957,596 Sales promotion cost 4,830,607 3,516,703 Sales commission 426,910 222,910 Increase in provisions for product warranties 634,031 131,090 Lease 2,200,932 2,002,183 Depreciation 1,445,375 833,931 Taxes and dues 612,624 481,989 Supplies 991,702 679,643 Fees and charges 2,518,478 1,431,126 Other 4,353,749 2,414,885 31,539,030 21,820,769
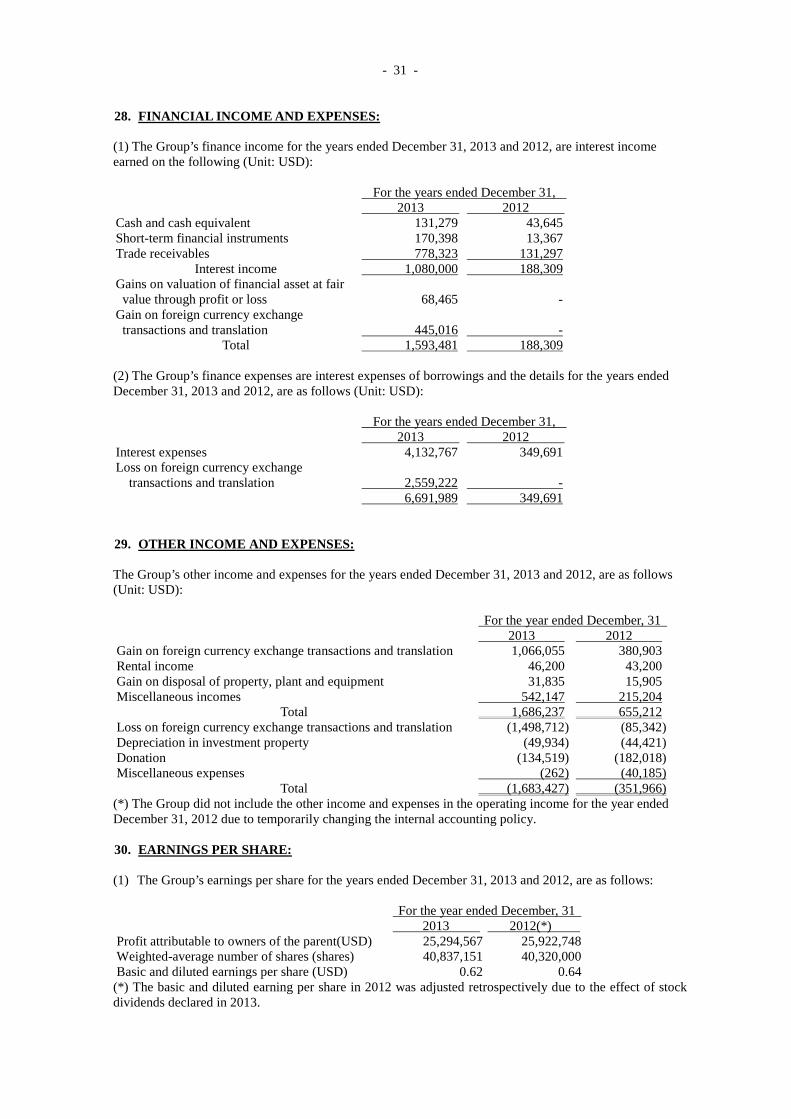
- 31 -
28. FINANCIAL INCOME AND EXPENSES: (1) The Group’s finance income for the years ended December 31, 2013 and 2012, are interest income earned on the following (Unit: USD): For the years ended December 31, 2013 2012 Cash and cash equivalent 131,279 43,645 Short-term financial instruments 170,398 13,367 Trade receivables 778,323 131,297
Interest income 1,080,000 188,309 Gains on valuation of financial asset at fair value through profit or loss 68,465 - Gain on foreign currency exchange transactions and translation 445,016 -
Total 1,593,481 188,309 (2) The Group’s finance expenses are interest expenses of borrowings and the details for the years ended December 31, 2013 and 2012, are as follows (Unit: USD): For the years ended December 31, 2013 2012 Interest expenses 4,132,767 349,691 Loss on foreign currency exchange
transactions and translation 2,559,222 - 6,691,989 349,691 29. OTHER INCOME AND EXPENSES: The Group’s other income and expenses for the years ended December 31, 2013 and 2012, are as follows (Unit: USD): For the year ended December, 31 2013 2012 Gain on foreign currency exchange transactions and translation 1,066,055 380,903 Rental income 46,200 43,200 Gain on disposal of property, plant and equipment 31,835 15,905 Miscellaneous incomes 542,147 215,204
Total 1,686,237 655,212 Loss on foreign currency exchange transactions and translation (1,498,712) (85,342) Depreciation in investment property (49,934) (44,421) Donation (134,519) (182,018) Miscellaneous expenses (262) (40,185)
Total (1,683,427) (351,966) (*) The Group did not include the other income and expenses in the operating income for the year ended December 31, 2012 due to temporarily changing the internal accounting policy. 30. EARNINGS PER SHARE: (1) The Group’s earnings per share for the years ended December 31, 2013 and 2012, are as follows: For the year ended December, 31 2013 2012(*) Profit attributable to owners of the parent(USD) 25,294,567 25,922,748 Weighted-average number of shares (shares) 40,837,151 40,320,000 Basic and diluted earnings per share (USD) 0.62 0.64 (*) The basic and diluted earning per share in 2012 was adjusted retrospectively due to the effect of stock dividends declared in 2013.
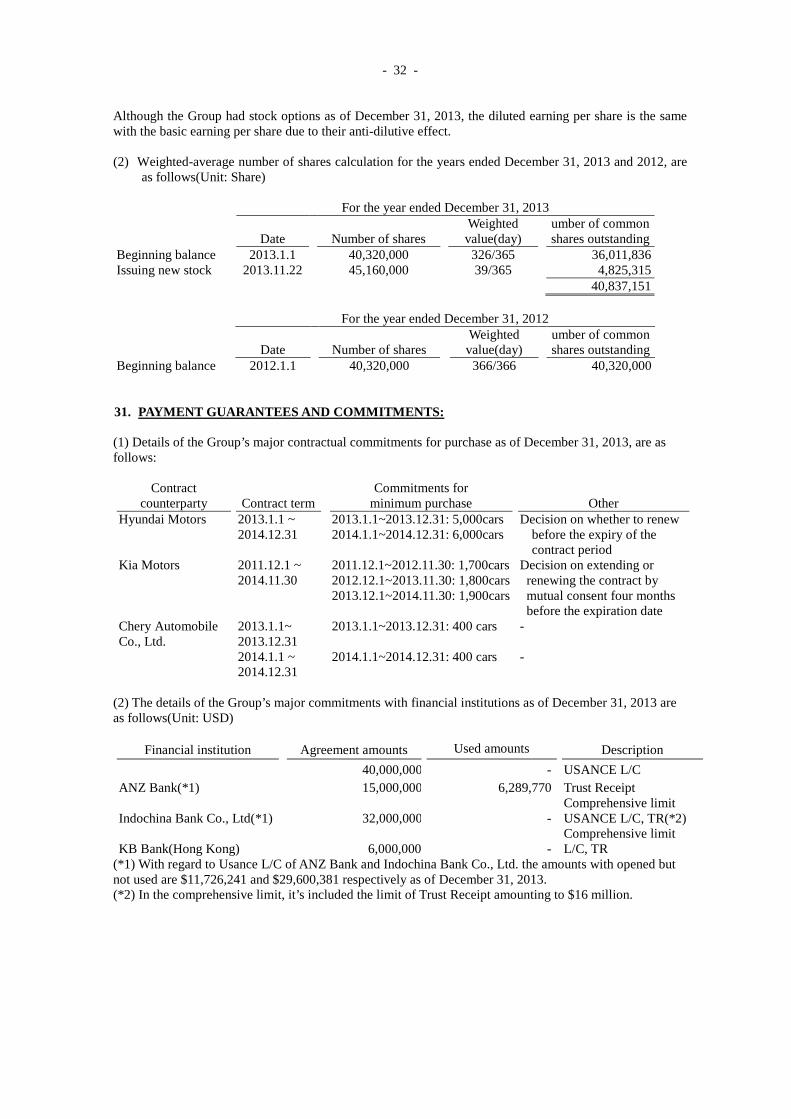
- 32 -
Although the Group had stock options as of December 31, 2013, the diluted earning per share is the same with the basic earning per share due to their anti-dilutive effect. (2) Weighted-average number of shares calculation for the years ended December 31, 2013 and 2012, are
as follows(Unit: Share)
For the year ended December 31, 2013
Date Number of shares Weighted value(day)
umber of common shares outstanding
Beginning balance 2013.1.1 40,320,000 326/365 36,011,836 Issuing new stock 2013.11.22 45,160,000 39/365 4,825,315 40,837,151
For the year ended December 31, 2012
Date Number of shares Weighted value(day)
umber of common shares outstanding
Beginning balance 2012.1.1 40,320,000 366/366 40,320,000 31. PAYMENT GUARANTEES AND COMMITMENTS: (1) Details of the Group’s major contractual commitments for purchase as of December 31, 2013, are as follows:
Contract counterparty Contract term
Commitments for minimum purchase Other
Hyundai Motors 2013.1.1 ~ 2014.12.31
2013.1.1~2013.12.31: 5,000cars 2014.1.1~2014.12.31: 6,000cars
Decision on whether to renew before the expiry of the contract period
Kia Motors 2011.12.1 ~ 2014.11.30
2011.12.1~2012.11.30: 1,700cars 2012.12.1~2013.11.30: 1,800cars 2013.12.1~2014.11.30: 1,900cars
Decision on extending or renewing the contract by mutual consent four months before the expiration date
Chery Automobile Co., Ltd.
2013.1.1~ 2013.12.31
2013.1.1~2013.12.31: 400 cars -
2014.1.1 ~ 2014.12.31
2014.1.1~2014.12.31: 400 cars -
(2) The details of the Group’s major commitments with financial institutions as of December 31, 2013 are as follows(Unit: USD)
Financial institution Agreement amounts Used amounts Description
ANZ Bank(*1) 40,000,000 - USANCE L/C 15,000,000 6,289,770 Trust Receipt
Indochina Bank Co., Ltd(*1) 32,000,000 - Comprehensive limit USANCE L/C, TR(*2)
KB Bank(Hong Kong)
6,000,000
- Comprehensive limit L/C, TR
(*1) With regard to Usance L/C of ANZ Bank and Indochina Bank Co., Ltd. the amounts with opened but not used are $11,726,241 and $29,600,381 respectively as of December 31, 2013. (*2) In the comprehensive limit, it’s included the limit of Trust Receipt amounting to $16 million.
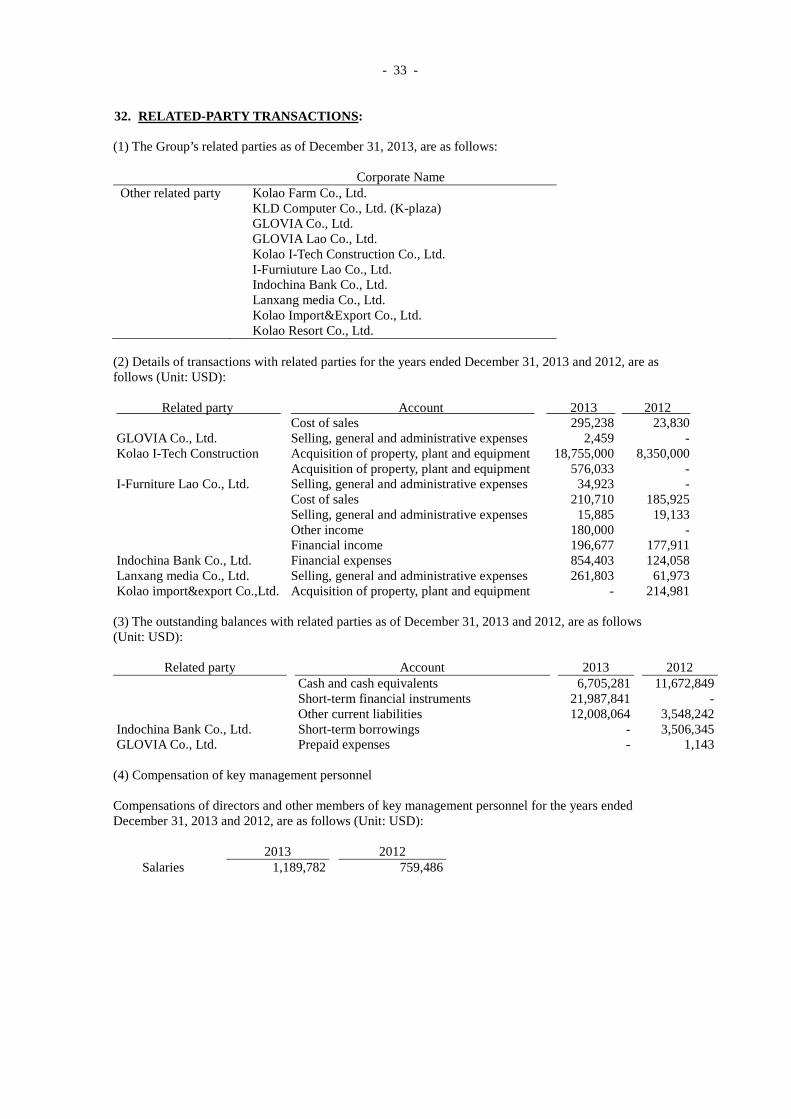
- 33 -
32. RELATED-PARTY TRANSACTIONS: (1) The Group’s related parties as of December 31, 2013, are as follows: Corporate Name Other related party Kolao Farm Co., Ltd. KLD Computer Co., Ltd. (K-plaza) GLOVIA Co., Ltd. GLOVIA Lao Co., Ltd. Kolao I-Tech Construction Co., Ltd. I-Furniuture Lao Co., Ltd. Indochina Bank Co., Ltd. Lanxang media Co., Ltd. Kolao Import&Export Co., Ltd. Kolao Resort Co., Ltd.
(2) Details of transactions with related parties for the years ended December 31, 2013 and 2012, are as follows (Unit: USD): Related party Account 2013 2012
GLOVIA Co., Ltd. Cost of sales 295,238 23,830 Selling, general and administrative expenses 2,459 -
Kolao I-Tech Construction Acquisition of property, plant and equipment 18,755,000 8,350,000
I-Furniture Lao Co., Ltd. Acquisition of property, plant and equipment 576,033 - Selling, general and administrative expenses 34,923 -
Indochina Bank Co., Ltd.
Cost of sales 210,710 185,925 Selling, general and administrative expenses 15,885 19,133 Other income 180,000 - Financial income 196,677 177,911 Financial expenses 854,403 124,058
Lanxang media Co., Ltd. Selling, general and administrative expenses 261,803 61,973 Kolao import&export Co.,Ltd. Acquisition of property, plant and equipment - 214,981 (3) The outstanding balances with related parties as of December 31, 2013 and 2012, are as follows (Unit: USD):
Related party Account 2013 2012
Indochina Bank Co., Ltd.
Cash and cash equivalents 6,705,281 11,672,849 Short-term financial instruments 21,987,841 - Other current liabilities 12,008,064 3,548,242 Short-term borrowings - 3,506,345
GLOVIA Co., Ltd. Prepaid expenses - 1,143 (4) Compensation of key management personnel Compensations of directors and other members of key management personnel for the years ended December 31, 2013 and 2012, are as follows (Unit: USD):
2013 2012 Salaries 1,189,782 759,486
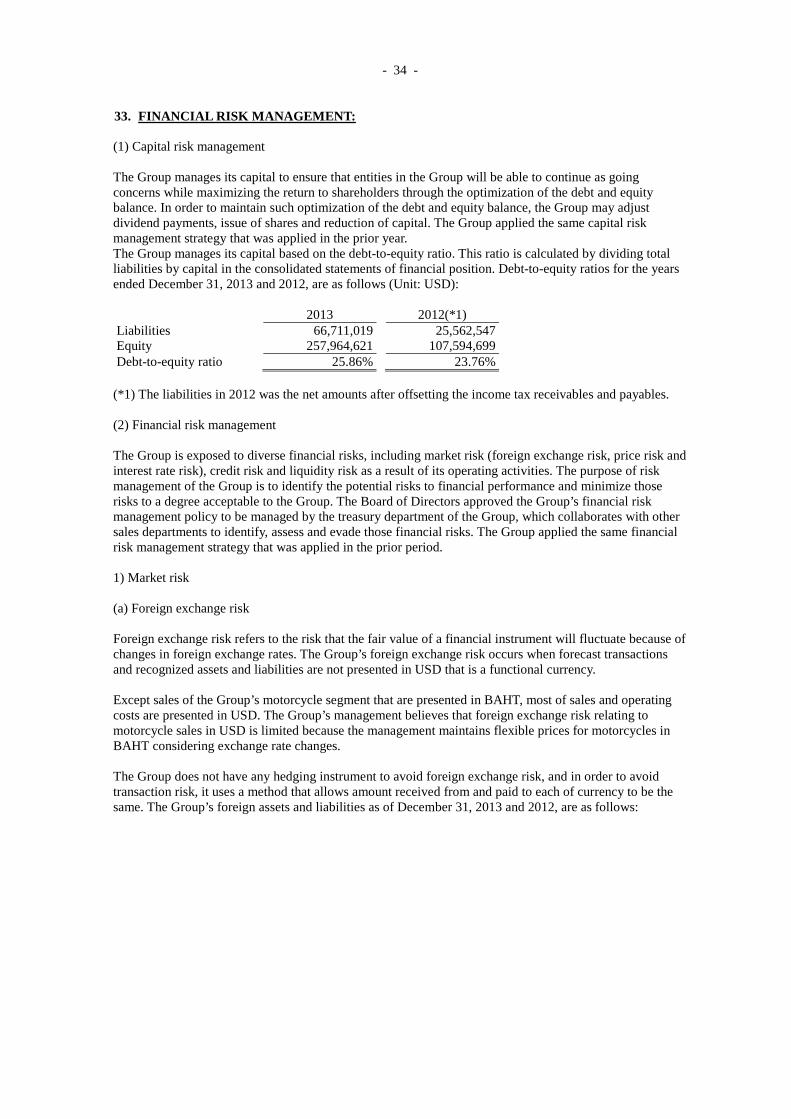
- 34 -
33. FINANCIAL RISK MANAGEMENT: (1) Capital risk management The Group manages its capital to ensure that entities in the Group will be able to continue as going concerns while maximizing the return to shareholders through the optimization of the debt and equity balance. In order to maintain such optimization of the debt and equity balance, the Group may adjust dividend payments, issue of shares and reduction of capital. The Group applied the same capital risk management strategy that was applied in the prior year. The Group manages its capital based on the debt-to-equity ratio. This ratio is calculated by dividing total liabilities by capital in the consolidated statements of financial position. Debt-to-equity ratios for the years ended December 31, 2013 and 2012, are as follows (Unit: USD):
2013 2012(*1) Liabilities 66,711,019 25,562,547 Equity 257,964,621 107,594,699 Debt-to-equity ratio 25.86% 23.76% (*1) The liabilities in 2012 was the net amounts after offsetting the income tax receivables and payables. (2) Financial risk management The Group is exposed to diverse financial risks, including market risk (foreign exchange risk, price risk and interest rate risk), credit risk and liquidity risk as a result of its operating activities. The purpose of risk management of the Group is to identify the potential risks to financial performance and minimize those risks to a degree acceptable to the Group. The Board of Directors approved the Group’s financial risk management policy to be managed by the treasury department of the Group, which collaborates with other sales departments to identify, assess and evade those financial risks. The Group applied the same financial risk management strategy that was applied in the prior period. 1) Market risk (a) Foreign exchange risk Foreign exchange risk refers to the risk that the fair value of a financial instrument will fluctuate because of changes in foreign exchange rates. The Group’s foreign exchange risk occurs when forecast transactions and recognized assets and liabilities are not presented in USD that is a functional currency. Except sales of the Group’s motorcycle segment that are presented in BAHT, most of sales and operating costs are presented in USD. The Group’s management believes that foreign exchange risk relating to motorcycle sales in USD is limited because the management maintains flexible prices for motorcycles in BAHT considering exchange rate changes. The Group does not have any hedging instrument to avoid foreign exchange risk, and in order to avoid transaction risk, it uses a method that allows amount received from and paid to each of currency to be the same. The Group’s foreign assets and liabilities as of December 31, 2013 and 2012, are as follows:
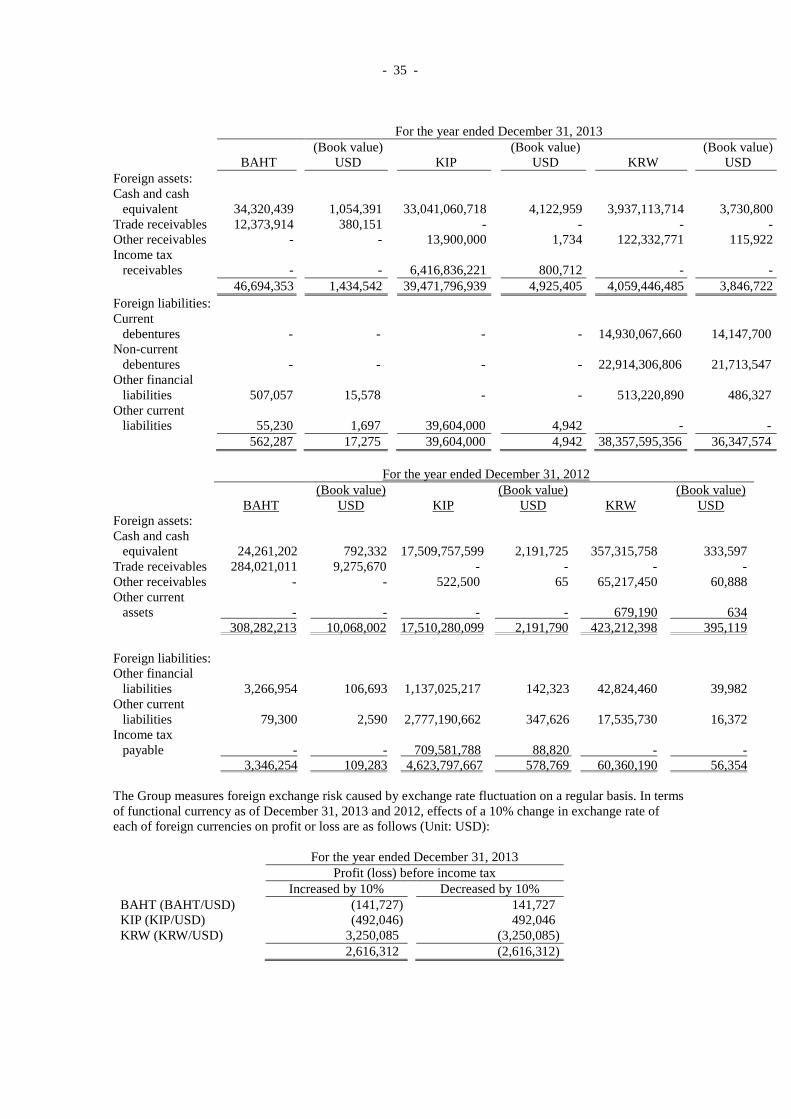
- 35 -
For the year ended December 31, 2013
BAHT (Book value)
USD KIP (Book value)
USD KRW (Book value)
USD Foreign assets: Cash and cash
equivalent 34,320,439 1,054,391 33,041,060,718 4,122,959 3,937,113,714 3,730,800 Trade receivables 12,373,914 380,151 - - - - Other receivables - - 13,900,000 1,734 122,332,771 115,922 Income tax
receivables - - 6,416,836,221 800,712 - - 46,694,353 1,434,542 39,471,796,939 4,925,405 4,059,446,485 3,846,722 Foreign liabilities: Current
debentures - - - - 14,930,067,660 14,147,700 Non-current
debentures - - - - 22,914,306,806 21,713,547 Other financial
liabilities 507,057 15,578 - - 513,220,890 486,327
Other current liabilities 55,230 1,697 39,604,000 4,942 - -
562,287 17,275 39,604,000 4,942 38,357,595,356 36,347,574 For the year ended December 31, 2012
BAHT (Book value)
USD KIP (Book value)
USD KRW (Book value)
USD Foreign assets: Cash and cash
equivalent 24,261,202 792,332 17,509,757,599 2,191,725 357,315,758 333,597 Trade receivables 284,021,011 9,275,670 - - - - Other receivables - - 522,500 65 65,217,450 60,888 Other current
assets - - - - 679,190 634 308,282,213 10,068,002 17,510,280,099 2,191,790 423,212,398 395,119 Foreign liabilities: Other financial
liabilities 3,266,954 106,693 1,137,025,217 142,323 42,824,460 39,982 Other current
liabilities 79,300 2,590 2,777,190,662 347,626 17,535,730 16,372 Income tax
payable - - 709,581,788 88,820 - - 3,346,254 109,283 4,623,797,667 578,769 60,360,190 56,354 The Group measures foreign exchange risk caused by exchange rate fluctuation on a regular basis. In terms of functional currency as of December 31, 2013 and 2012, effects of a 10% change in exchange rate of each of foreign currencies on profit or loss are as follows (Unit: USD):
For the year ended December 31, 2013 Profit (loss) before income tax
Increased by 10% Decreased by 10% BAHT (BAHT/USD) (141,727) 141,727 KIP (KIP/USD) (492,046) 492,046 KRW (KRW/USD) 3,250,085 (3,250,085)
2,616,312 (2,616,312)

- 36 -
For the year ended December 31, 2012 Profit (loss) before income tax
Increased by 10% Decreased by 10% BAHT (BAHT/USD) (995,872) 995,872 KIP (KIP/USD) (161,302) 161,302 KRW (KRW/USD) (33,877) 33,877
(1,191,051) 1,191,051 The above sensitivity analysis was applied to monetary assets and liabilities denominated in foreign currencies other than the functional currency at the end of the reporting period. (b) Price risk Price risk refers to the risk that the fair value or future cash flows of a financial instrument will fluctuate because of changes in market prices other than those arising from interest rate risk or currency risk. The Group was exposed to price risk of its equity securities that were classified as AFS financial assets in the consolidated statement of financial position of the prior period. The Group has invested in non-marketable equity securities by exercising the management’s judgments, and the Group does not have any separate investment strategy for equity securities. As of the end of the reporting period, the Group does not have any AFS financial assets. (c) Interest rate risk Interest rate risk refers to the risk that the fair value or future cash flows of a financial instrument will fluctuate because of changes in market interest rates. The Group has financial liabilities, such as borrowings, as of the end of the reporting period, and therefore, it is exposed to interest rate risk. The Group’s management has established diverse strategies to manage interest rate risk derived from refinancing and renewal of borrowings. As of the end of the reporting period, the Group does not have any liabilities that are exposed to interest rate risk. 2) Credit risk Credit risk refers to the risk that one party to a financial instrument will cause a financial loss for the other party by failing to discharge an obligation. The Group has adopted a policy of only dealing with reputable counterparties and obtaining sufficient collateral, where appropriate, as a means of mitigating the risk of financial loss from defaults. Customers’ credit is evaluated upon their financial status, sales history and other factors. Based on this information, the Group limits the aggregate amount and receives security or certain amount of deposit from customers. The Group regularly monitors customers’ credit ratings, checks on the counterparties’ credit limit and readjusts deposit or aggregate amount of transactions. The Group concluded that credit risk exposure to any single counterparty is not material. 3) Liquidity risk Liquidity risk refers to risk caused by being unable to raise enough funds to fulfill all the terms of financial contracts by its maturity date. The Group creates short-term and long-term fund management plans and analyzes and reviews actual cash outflow and its budget to correspond the maturity of financial liabilities and assets in order to manage liquidity. Management of the Group believes that financial liability may be redeemed by cash inflow arising from operating activities and financial assets.
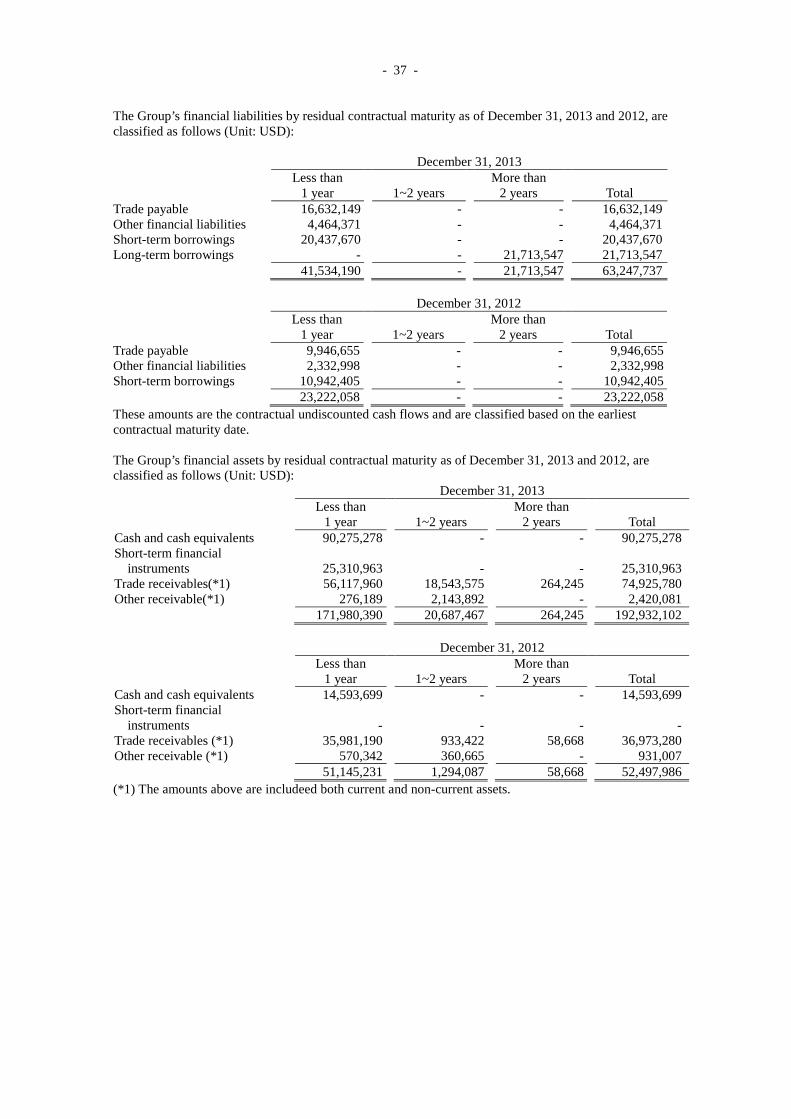
- 37 -
The Group’s financial liabilities by residual contractual maturity as of December 31, 2013 and 2012, are classified as follows (Unit: USD):
December 31, 2013
Less than
1 year 1~2 years More than
2 years Total Trade payable 16,632,149 - - 16,632,149 Other financial liabilities 4,464,371 - - 4,464,371 Short-term borrowings 20,437,670 - - 20,437,670 Long-term borrowings - - 21,713,547 21,713,547 41,534,190 - 21,713,547 63,247,737
December 31, 2012
Less than
1 year 1~2 years More than
2 years Total Trade payable 9,946,655 - - 9,946,655 Other financial liabilities 2,332,998 - - 2,332,998 Short-term borrowings 10,942,405 - - 10,942,405 23,222,058 - - 23,222,058 These amounts are the contractual undiscounted cash flows and are classified based on the earliest contractual maturity date. The Group’s financial assets by residual contractual maturity as of December 31, 2013 and 2012, are classified as follows (Unit: USD):
December 31, 2013
Less than
1 year 1~2 years More than
2 years Total Cash and cash equivalents 90,275,278 - - 90,275,278 Short-term financial
instruments
25,310,963 - - 25,310,963 Trade receivables(*1) 56,117,960 18,543,575 264,245 74,925,780 Other receivable(*1) 276,189 2,143,892 - 2,420,081 171,980,390 20,687,467 264,245 192,932,102
December 31, 2012
Less than
1 year 1~2 years More than
2 years Total Cash and cash equivalents 14,593,699 - - 14,593,699 Short-term financial
instruments
- - - - Trade receivables (*1) 35,981,190 933,422 58,668 36,973,280 Other receivable (*1) 570,342 360,665 - 931,007 51,145,231 1,294,087 58,668 52,497,986 (*1) The amounts above are includeed both current and non-current assets.
- 38 -
(3) Fair value estimation The fair values of financial instruments (i.e., financial assets held for trading and financial assets AFS) traded on active markets are determined with reference to quoted market prices. The Group uses the current bid price as the quoted market price for its financial assets. The fair values of financial instruments not traded in active markets (i.e., non-marketable AFS financial assets) are determined using a valuation technique. The Group uses various valuation techniques and makes assumptions based on current market conditions at the end of the reporting period. The Group receives information about fair values from external evaluation agencies that are trustworthy in Korea in order to use it for the Group’s non-marketable AFS financial assets, payment guarantee liabilities and derivative financial instruments. The fair values of long-term liabilities are determined using market prices or dealer quotes for similar instruments. Where such prices are not available, a discounted cash flow analysis or other valuation technique is performed to measure their fair values. The fair values of trade receivable and other receivables are approximated as their carrying value, less impairment loss. The Group estimates the fair values of financial liabilities as the present value of future contractual cash flows discounted based on current market rates applied to similar financial instruments. Meanwhile, since the carrying amount that expires within 12 months is not materially affected by the discount effect, repayment at maturity is considered to approximate its fair value. The following provides an analysis of financial instruments that are measured subsequent to initial recognition at fair value, grouped into Levels 1 to 3 based on the degree to which the fair value is observable: - Level 1: Fair value measurements are those derived from quoted prices (unadjusted) in active markets for
identical assets or liabilities. - Level 2: Fair value measurements are those derived from inputs other than quoted prices included within
Level 1 that are observable for the asset or liability, either directly (i.e., as prices) or indirectly (i.e., derived from prices).
- Level 3: Fair value measurements are those derived from valuation techniques that include inputs for the asset or liability that are not based on observable market data (unobservable inputs).
The Group has no financial instruments that are measured subsequent to initial recognition at fair value. 34. NON-CASH TRANSACTIONS: Major non-cash transactions that were not included in the consolidated statements of cash flows for the years ended December 31, 2013 and 2012, are as follows (Unit: USD): 2013 2012 Write-off of trade receivables - 19,886 Transfer to vehicles from inventories 838,718 1,361,397 Transfer to buildings from construction in progress 16,600,000 -
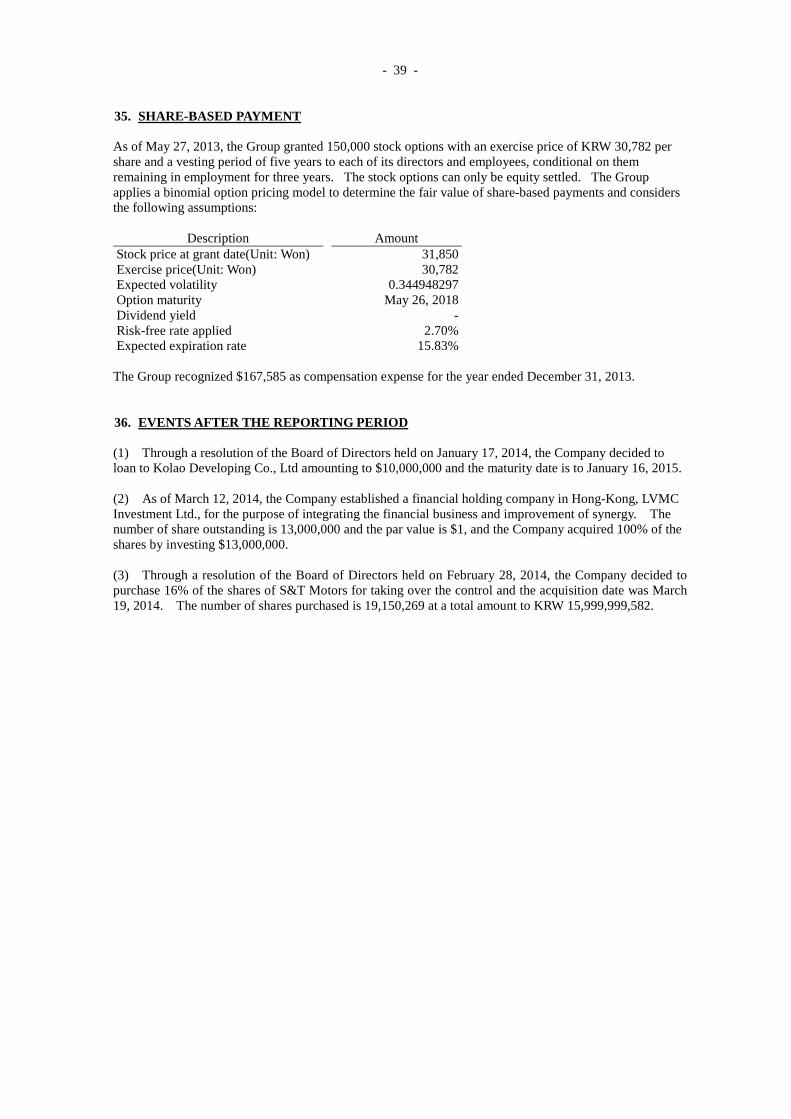
- 39 -
35. SHARE-BASED PAYMENT As of May 27, 2013, the Group granted 150,000 stock options with an exercise price of KRW 30,782 per share and a vesting period of five years to each of its directors and employees, conditional on them remaining in employment for three years. The stock options can only be equity settled. The Group applies a binomial option pricing model to determine the fair value of share-based payments and considers the following assumptions:
Description Amount Stock price at grant date(Unit: Won) 31,850 Exercise price(Unit: Won) 30,782 Expected volatility 0.344948297 Option maturity May 26, 2018 Dividend yield - Risk-free rate applied 2.70% Expected expiration rate 15.83% The Group recognized $167,585 as compensation expense for the year ended December 31, 2013. 36. EVENTS AFTER THE REPORTING PERIOD (1) Through a resolution of the Board of Directors held on January 17, 2014, the Company decided to loan to Kolao Developing Co., Ltd amounting to $10,000,000 and the maturity date is to January 16, 2015. (2) As of March 12, 2014, the Company established a financial holding company in Hong-Kong, LVMC Investment Ltd., for the purpose of integrating the financial business and improvement of synergy. The number of share outstanding is 13,000,000 and the par value is $1, and the Company acquired 100% of the shares by investing $13,000,000. (3) Through a resolution of the Board of Directors held on February 28, 2014, the Company decided to purchase 16% of the shares of S&T Motors for taking over the control and the acquisition date was March 19, 2014. The number of shares purchased is 19,150,269 at a total amount to KRW 15,999,999,582.
- 40 -
Independent Accountant’s Review Report on Internal Accounting Control System (“IACS”)
English Translation of a Report Originally Issued in Korean To the Representative Director of Kolao Holdings We have reviewed the accompanying Report on the Management’s Assessment of IACS (the “Management’s Report”) of Kolao Holdings (the “Company”) as of December 31, 2013. The Management’s Report, and the design and operation of IACS are the responsibility of the Company’s management. Our responsibility is to review the Management’s Report and issue a review report based on our procedures. The Company’s management stated in the accompanying Management’s Report that “based on the assessment of the IACS as of December 31, 2013, the Company’s IACS has been appropriately designed and is operating effectively as of December 31, 2013, in all material respects, in accordance with the IACS Framework established by the Korea Listed Companies Association.” We conducted our review in accordance with the IACS Review Standards established by the Korean Institute of Certified Public Accountants. Those standards require that we plan and perform a review, the objective of which is to obtain a lower level of assurance than an audit, of the Management’s Report in all material respects. A review includes obtaining an understanding of a company’s IACS and making inquiries regarding the Management’s Report and, when deemed necessary, performing a limited inspection of underlying documents and other limited procedures. The Company’s IACS represents internal accounting policies and a system to manage and operate such policies to provide reasonable assurance regarding the reliability of consolidated financial statements prepared, in accordance with IFRS, for the purpose of preparing and disclosing reliable accounting information. Because of its inherent limitations, IACS may not prevent or detect a material misstatement of the consolidated financial statements. Also, projections of any evaluation of effectiveness of IACS to future periods are subject to the risk that controls may become inadequate because of changes in conditions, or that the degree of compliance with the policies or procedures may deteriorate. Based on our review, nothing has come to our attention that causes us to believe that the Management’s Report referred to above is not fairly stated, in all material respects, in accordance with the IACS Framework established by the Korea Listed Companies Association. Our review is based on the Company’s IACS as of December 31, 2013, and we did not review its IACS subsequent to December 31, 2013. This report has been prepared pursuant to Article 63-4 of the KOSPI Market Listing Regulation and the Acts on External Audit for Stock Companies in the Republic of Korea and may not be appropriate for other purposes or for other users.
March 20, 2014
Notice to Readers
This report is annexed in relation to the audit of the consolidated financial statements as of December 31, 2013, and the review of internal accounting control system pursuant to Article 63-4 of the KOSPI Market Listing Regulation and Acts on External Audit for Stock Companies in the Republic of Korea.
- 41 -