
Affordability and Expenditure Patterns for Electricity and Kerosene in Urban Households in Tanzanian

Kokonte Expenditure in Ghana: Patterns from GLSS3 data (NRI report no. 2382)
Greenwich Academic Literature Archive (GALA) Citation:
Collinson, C. (1998) Kokonte Expenditure in Ghana: Patterns from GLSS3 data (NRI report no. 2382). [Working Paper]
Available at:
http://gala.gre.ac.uk/11484
Copyright Status:
Permission is granted by the Natural Resources Institute (NRI), University of Greenwich for the copying, distribution and/or transmitting of this work under the conditions that it is attributed in the manner specified by the author or licensor and it is not used for commercial purposes. However you may not alter, transform or build upon this work. Please note that any of the aforementioned conditions can be waived with permission from the NRI.
Where the work or any of its elements is in the public domain under applicable law, that status is in no way affected by this license. This license in no way affects your fair dealing or fair use rights, or other applicable copyright exemptions and limitations and neither does it affect the author’s moral rights or the rights other persons may have either in the work itself or in how the work is used, such as publicity or privacy rights. For any reuse or distribution, you must make it clear to others the license terms of this work.
This work is licensed under a Creative Commons Attribution-NonCommercial-NoDerivs 3.0 Unported License.
Contact:
GALA Repository Team: [email protected] Natural Resources Institute: [email protected]
Kokonte Expenditure in Ghana: Patterns from GLSS3 data
February 1998
A report for project A0498
Chris Collinson, Marketing Systems Economics Group
Social Sciences Department, Natural Resources Institute.
NRI report no: 23 82

Contents Page
1. Executive summary 2
2. Introduction 3
3. GLSS data and its limitations 3
4. Regional kokonte expenditure 5
5. GLSS kokonte prices 7
6. Kokonte expenditure in Accra 10
7. Conclusions 12
References 14
Appendix - tests of statistical significance 15
1

1. Executive Summary
The impetus for this research came from the findings of a previous report, which recommended the use of Ghana Living Standards Survey Round 3 (GLSS3) data to study kokonte expenditure patterns in Ghana. Such research was necessary to :
• Confirm previouly gathered anecdotal evidence on kokonte expenditure
• Test hypotheses regarding consumer preferences for kokonte
• Provide background information for a forthcoming kokonte consumer survey
• Assist the targetting of potential technology transfer projects
The research concluded that the biggest kokonte spenders came from Northern Region, Upper East Region, Greater Accra Region and Central Region. The smallest spenders were from Brong Ahafo, Eastern Region, Western Region and Upper West region.
Data on kokonte prices was also collected during GLSS3 . Unfortunately, large gaps appear in the price series. Despite this, two price patterns emerged. First, urban areas which were furthest from areas of kokonte production seemed to experienced higher prices. The high cost of Ghanaian transport explains this finding. Second, prices in many of Ghana's ten regions experienced a peak between the beginning of April and the end of July 1992. Typically during this period, kokonte supply is low and demand is high due to the unavailability of other food items.
The analysis is developed by focussing on expenditure in Accra. Accra households whose origins lie in Central Region, Greater Accra and Ashanti were found to be under-represented among kokonte consuming households in Accra. Those households which were "over-represented" hailed from Eastern Region, Upper East Region and Northern Region. By and large, these results confirm expectations and coincide with results from previous sections of this report.
Finally, the Accra analysis examines the relationship between income, family size and kokonte expenditure. The research provides no conclusive evidence that kokonte is an inferior good. However, the report concludes that large Accra households tend to exploit the relative cheapness of kokonte to ensure that sufficient food is available for household members.
2
2. Introduction
This research chases the heels of a report entitled "A summary of potential markets for improved cassava chips" (R6506, Chris Collinson, March 1997). The report identified the possibility of using Ghana Living Standards Survey (GLSS)1 data to research regional kokonte expenditure patterns within Ghana.
There are several reasons for conducting such a study. First, the cassava project (R6506) has already gathered anecdotal evidence on regional kokonte expenditure patterns in Ghana. By conducting quantitative research, the author hoped to find numerical support for the qualitative findings.
Second, in southern parts of Ghana, kokonte has a reputation as a poor man' s food (it is locally called "face the wall" in reference to the shame associated with eating it). With such a stigma, one would expect a negative relationship between household income and household kokonte expenditure. An initial examination of GLSS data suggested that the construction of a statistical model designed to test this relationship would be possible. However, a closer look at the data sets revealed data gaps which exclude the possibility of estimating such a model. The analysis therefore adopted narrower, less sophisticated and consequently less conclusive methods of analysing the relationship .
Third, the research will provide useful background material for an imminent study of consumer kokonte preferences in Accra. For this reason, this report contains a section devoted to the analysis of expenditure in Accra.
Fourth, if research outputs from R6506 ever form the basis of a technology transfer project, a clear picture of which regions are the biggest kokonte spenders will greatly assist targetting.
The GLSS3 datasets date from 1991/92. While the information is therefore comparatively old, it is nevertheless the most relevant and complete data available. The period since the survey will doubtlessly have witnessed changes in absolute expenditure figures. However, relative expenditure levels (between regions and also between urban and rural areas) have probably changed less. Viewed in this light, GLSS3 data still holds contemporary relevance.
3. GLSS data and its limitations
The Ghana Living Standards Survey data sets provide a remarkable array of household and community data, covering subjects as diverse as educational attainment, post-natal care, housekeeping activities, migration patterns and housing conditions. There have now been three rounds ofthe survey (GLSS1 , 1985/86, GLSS2, 1988/89 and GLSS3, 1991/92). The design ofthe third round ofGLSS marked a significant departure from the previous two. For the first time, a significant part of the survey concentrated on household consumption, expenditure and income. The detailed information in these
1 The author gratefully acknowledges the Ghana Statistical SeiVice's permission to use GLSS3 data for this research.
3

sections gives a fascinating insight to nation-wide patterns offood expenditure and consumption. Moreover, the convenient GLSS3 self-weighting sample design permits easy comparisons between the regions and between rural and urban areas.
Unfortunately, GLSS3 does not specifically cover household kokonte consumption. Instead kokonte is lumped into a category called "cassava (other forms)", which covers any cassava consumption which is not in the form of either fresh roots or gari. Kokonte does however explicitly appear in the expenditure survey, and it is from this data which the analysis in this report draws.
The lack ofkokonte consumption data is not a crucial deficiency: The research project for which this report has been compiled, concerns itself with studying ways in which farmers can earn greater incomes from their cassava production. Consequently, the most relevant variables are the volumes and values of kokonte which are traded (rather than consumed) throughout Ghana. Expenditure data is therefore sufficient for our purposes.
The analysis in this report encountered two data deficiency problems, one which suggested several plausible solutions and the other which suggested none. The first problem relates to regional price variations. Expenditure comprises two components -the price of a product and the quantity purchased. In a country such as Ghana, where marketing infrastructure is still developing, prices at any particular point in time can vary greatly throughout the country. Furthermore, prices throughout time vary considerably according to seasonal supply and demand changes. In these circumstances, expenditure data can give a misleading picture of the volumes of a product which are traded in different parts of the country and throughout time. The GLSS team realised this problem and included a market price investigator in each household interviewing team. The investigator' s job was to record the price of the products that each cluster of households purchased. In principle, this would have provided very precise data on quantities purchased. In practice (at least in the case of kokonte) the coverage was incomplete to such an extent that deriving time series regional prices throughout the relevant data collection periods proves impossible. The obvious, but less than ideal solution adopted in this analysis, involved grouping regions into zones, each of which might be expected to experience similar temporal kokonte market prices. In some cases the zone classifications were somewhat arbitrary but most were guided by what we considered reasonable a-priori expectations. The chosen zones were as follows :
• Zone 1: Upper East Region, Upper West Region and Northern Region.
• Zone 2: Brong Ahafo, Ashanti, Eastern Region.
• Zone 3: Western Region, Central Region, Greater Accra, Volta Region.
The second data deficiency problem concerned seasonal expenditure patterns. Anecdotal evidence suggests that kokonte consumption, and therefore kokonte expenditure, have pronounced seasonal patterns. Unfortunately, the GLSS3 data recording teams were unable to survey each region evenly throughout the year, meaning that some degree of bias will have crept into the data. For instance, peak
4

expenditure in Upper East Region (a major kokonte consuming area) probably occurs in the May, June, July period. If during this time, the data collection teams were concentrating their efforts in Upper West Region (a minor kokonte consuming area), the figures for both the nation as a whole and Upper East Region would be biased. There is no convenient way of correcting this bias and consequently no correcting mechanism was adopted in the analysis.
As already mentioned, the GLSS3 survey design is self-weighting. To derive national estimates from the survey, one has to multiply the survey figures by a simple scaling factor. This factor is calculated by dividing the total number of households which existed in Ghana at the time of the survey by the number of households in the survey. Unfortunately, the last population census figures were gathered in 1984 and thus an adjustment must be made to account for population change over the eight year period between the census and GLSS3. Equally unfortunately, the government produces just one population change estimate for the whole of Ghana, meaning that relative regional population changes had to be ignored in our analysis. For the purposes of this research, the government estimate of population increase was abandoned in favour of a higher figure which was estimated by the Ghana Statistical Service directly from GLSS3 data.
Before final presentation, expenditure estimates were adjusted to place them on an annual basis. This was achieved by multiplying the estimates by the number of survey cycles (11 cycles for the urban survey, 22 cycles for the rural survey) and then adjusting the figures upwards to allow for the mismatch between the survey year and the calendar year.
4. Regional Kokonte Expenditure
Table 1 reports the estimated absolute and per capita expenditures on kokonte in each of the ten regions of Ghana, for the period from October 1991 to September 1992 inclusive. The Cedi figures are presented in constant March 1992 prices (conversions were made using weights which appear in the GLSS datasets). Table 2 takes the analysis one step further by splitting regional absolute and per capita expenditures into urban and rural areas.
Table 1. Estimated Regional Kokonte Expenditure (March '92 Cedis), Oct '91 to Seot'92 ~--- --
Region Estimated Regional % of.Estimated.National EStimatedPer·Capita: .-·_::-''''< Expenditure-{Mar '92 million Expenditure Experiditure(Ma:r '92 Cedis) }
Cedis)
Western 60 0.7% 40 Central 927 11.2% 621 Greater Accra 1,256 15 .2% 671 Eastern 333 4.0% 152 Volta 735 8.9% 464 Ashanti 699 8.4% 256 Brong Ahafo 656 7.9% 416 Northern 2,408 29.1% 1582 Upper We~ 14 0.2% 24
--- ----- --- ·- ----
5

I UpperE~~t 1,1961 14.4% 1 1184J Source: GLSS3 datasets and author's own calculations Note. In March 1992, the midpoint ofthe GLS3 survey, the Cedi exchange rate was approximately US$1 to C400.
Table 2. Estimated Regional Expenditure (March '92 Cedis) split between Urban and Rural Areas, Oct '91 to Sept '92
Estimated Regional Kokonte. Expenditure · Estimated~er Capita Kokonte (Mi!Iion Cedis) · ExpenditUre - utbari/Rura1
I ·<( Cedis)
Region Urban ..• Rliral • · · urban • -< Rural
·Western 53 7 156 6 Central 79 848 184 798 ·Greater Accra 599 657 385 2071 Eastern .·. 154 179 252 113
·Volta •••··· 28 707 85 561 AShanti · 210 488 237 264
•· Brong Ahafo 364 293 867 253 Northern . 791 1,616 2064 1420 U pper West 0 14 0 27 U pper East 0 1,196 0 1363 Source: GLSS3 datasets and author 's own calculations Note. In March 1992, the midpoint of the GLS3 survey, the Cedi exchange rate was approximately US$1 to C400.
The regions which spent most on kokonte during the survey period were (in order of greatest to least expenditure) Northern, Greater Accra, Upper East and Central. In terms of per capita expenditure, the same four regions again feature as the most important buyers. However, the order of importance changes. Northern (C 1,184 per capita) remains at the top, but Upper East (C1, 184 per capita) overhauls Greater Accra (C671 per capita), while Central (C621 per capita) once again comes fourth.
Unsurprisingly, Northern and Upper East appear among the top kokonte purchasers. Both areas produce large quantities of cassava and, at certain times of the year, experience ideal kokonte drying conditions. An anomaly does however appear in the urban/rural per capita figures for these two regions. Per capita expenditure in urban areas of Northern Region is greater than in the rural areas, while in Upper East, the analysis suggests that no purchases were made in urban areas during the survey period. The results may reflect the fact that Tamale, the capital and major urban centre in Northern Region, is much larger and more developed than Bolgatanga, the regional capital of Upper East. Urban consumers in Northern Region may therefore be less well integrated with their rural surroundings than their counterparts in Upper East, forcing the Northern Region urbanites to purchase kokonte rather than rely on their own or their relatives' farm production.
Per capita expenditure in Greater Accra is much greater in rural than in urban areas (C2,071 vs. C385). This may reflect the greater availability ofnon-kokonte staples in the urban markets. Another factor may be the occupations of rural dwellers in Greater Accra. Livelihoods in the rural areas are predominately non-agricultural and thus the
6

rural population relies more heavily on processed food (such as kokonte) than fresh food .
A more detailed analysis of kokonte expenditure in Accra city appears in a subsequent section.
The reason for Central Region's high kokonte expenditure is not immediately apparent, especially when one notes that neighbouring Western Region spent very little on kokonte during the survey period. However, two factors may help to account for Central ' s apparent kokonte feasting. First, much ofthe soil along the heavily populated coastal strip is of poor quality and can not sustain crops such as maize and yams. Cassava on the other hand, gives respectable yields even when grown on poor soils (although ironically, the crop can degrades soil at a fast rate - Howeler 1991). Second, Central Region has good road links with Brong Ahafo Region, one of the major kokonte producing areas in Ghana.
The bottom four buyers of kokonte during the survey period were, in order of highest to least per capita expenditure, Brong Ahafo (C416), Eastern (C152), Western (C40) and Upper West (C24). As one of the largest kokonte producing areas in Ghana, Brong Ahafo seemed to spend surprisingly little on kokonte during the survey period. While acknowledging that this result may have been skewed by seasonal sampling bias, the figure probably reflects the preferred staple diets ofBrong Ahafo ' s rural dwellers. Maize and yam predominate, while kokonte is usually produced for sale.
Ghanaian colleagues at TechhoServe in Accra claim that the lack of a kokonte tradition is responsible for the low levels of kokonte expenditure in Western Region. The same is true ofkokonte consumption in Upper West Region, although in this case, the overriding reason for low kokonte consumption is the poor cassava growing climate which prevails in this region.
5. GLSS3 Kokonte Prices
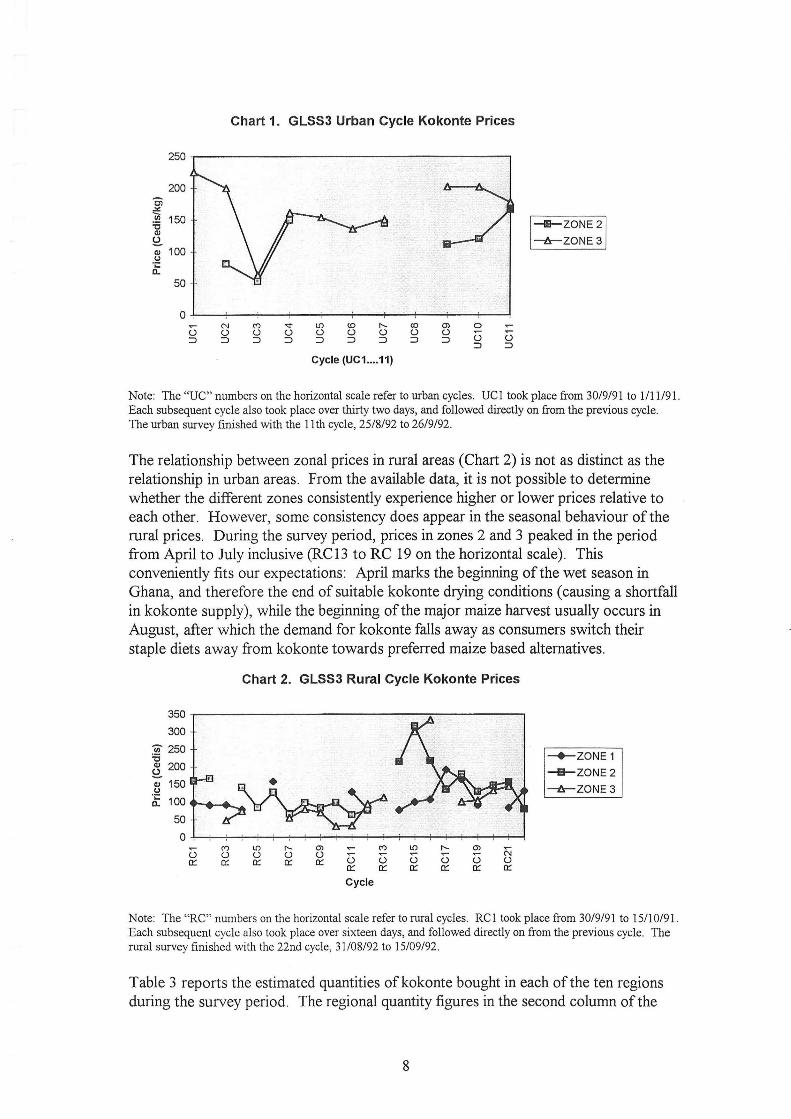
Even when the GLSS3 price data is aggregated into the price zones described in section 3, there remain considerable gaps in the data. The most obvious omission is the absence of any price data from urban areas in the Northern Region (Table 2 reports considerable expenditure in these areas) . But, while the picture remains incomplete, a few price patterns emerge. In urban areas, one would expect that Zone 2 (broadly speaking, the middle band of Ghana) might experience lower prices than Zone 3 (the southern band), simply because the cost of transport in Ghana is generally high and because Zone 2 contains significant areas of kokonte production. A glance at Chart 1 suggests that our expectations are probably valid, with Zone 2 prices consistently below those of Zone 3.
7
250
200 Ci .X
~ 150 "C Q) t)
;- 100 .!::! ~
50
0 ~
t) ::J
N t) ::J
Chart 1. GLSS3 Urban Cycle Kokonte Prices
(") t) ::J
"<t L{) t) t) ::J ::J
(0 t) ::J
I'- tO t) t) ::J ::J
Cycle (UC1 .... 11)
0> t) ::J
0
() ::J
~
() ::J
-ZONE2
-tr-ZONE 3
Note: The "UC" numbers on the horizontal scale refer to urban cycles. UCl took place from 30/9/91 to 1111/91. Each subsequent cycle also took place over thirty two days, and followed directly on from the previous cycle. The urban survey finished with the 11th cycle, 25/8/92 to 26/9/92.
The relationship between zonal prices in rural areas (Chart 2) is not as distinct as the relationship in urban areas. From the available data, it is not possible to determine whether the different zones consistently experience higher or lower prices relative to each other. However, some consistency does appear in the seasonal behaviour ofthe rural prices. During the survey period, prices in zones 2 and 3 peaked in the period from April to July inclusive (RC13 to RC 19 on the horizontal scale). This conveniently fits our expectations: April marks the beginning of the wet season in Ghana, and therefore the end of suitable kokonte drying conditions (causing a shortfall in kokonte supply), while the beginning of the major maize harvest usually occurs in August, after which the demand for kokonte falls away as consumers switch their staple diets away from kokonte towards preferred maize based alternatives.
Chart 2. GLSS3 Rural Cycle Kokonte Prices
350
300 :§" 250 ... P. "C £200
~ 150 'i: 100 a..
50
0 ~
() 0::
(") L{) I'- 0> () u () u 0:: 0:: 0:: 0::
~ (") L{) I'- 0> 1'i ~ ~ ~ 0 () () () () u 0:: 0:: 0:: 0:: 0:: 0::
Cycle
-+-ZONE1
--lii-ZONE2
-tr-ZONE 3
Note: The "RC" numbers on the horizontal scale refer to rural cycles. RC 1 took place from 30/9/91 to 15110/91 . Each subsequent cycle also took place over sixteen days, and followed directly on from the previous cycle. The rural survey finished with the 22nd cycle, 31/08/92 to 15/09/92.
Table 3 reports the estimated quantities ofkokonte bought in each of the ten regions during the survey period. The regional quantity figures in the second column of the
8

table were calculated by dividing individual household expenditures by the relevant zonal price and then aggregating the resulting figures to give estimated regional annual totals.
Table 3. Estimated Regional Kokonte Purchases (Kg), Oct '91 to Sept '92 Region ·· Estimated.RegionalQuantity
Purchased(tonnes) %ofEst~mated N~i?q~g .,. Estimated :Per Cap. ita Quantity
· ·Quanl!ty Purchased .•••. •·••·· .Purchased {Kg)
Western 594 0.8% 0.4 Central 11,959 16.4% 8.0 Greater Accra 8,244 11.3% 4.4 Eastern 3,466 4.8% 1.6 Volta 8,114 11.2% 5.1 Ashanti 5,845 8.0% 2.1 BrongAhafo 5,500 7.6% 3.5 .Northern ·· 16,747 23 .0% 11.0 Upper West 69 0.1% 0.1
· U~per East 12,191 16.8% 12.0 Source: GLSS3 datasets and author 's own calculations
The per capita figures in the fourth column of the table may seem rather low. However, remember that the figures were calculated using entire regional populations, which will of course include large numbers of people who did not purchase kokonte during the survey period. This approach permits a more meaningful comparison between the regions.
If we had confidence in the accuracy of the GLSS kokonte price data, the purchase quantity figures in Table 3 would add useful analytical insights to the quantity of kokonte traded in each region. However, given that data gaps even appear in the aggregated price figures, perhaps all we can say with confidence is that the purchase quantity figures in Table 3 do not drastically contradict the expenditure figures in Table 1.
6. Kokonte Expenditure in Accra
Table 4. reports the regional origin of households in Accra according to the region of origin of the head of the household. The third column of the table gives the proportional break down ofthe whole sample (n = 461). Figures are given as a percentage ofthe total number of households in the survey. For instance, we can see that 9.1% of the households in the sample came from Central Region. Given that the sample was random, this figure should have reflected the proportion of Central Region households in the overall population of Accra.
The second column in Table 4 reports the regional origin of the households which purchased kokonte during the survey (or more precisely, households which purchased kokonte during their respective survey cycles). Figures are stated as a percentage of the total number of households in Accra which purchased kokonte. Given that the number of such households was 73 , the proportion of the Accra sample households which reported kokonte purchases was 15 . 8%. As an illustration of the figures in
9

column two, we can see that 8.2% of the households which reported kokonte purchases came from Volta Region.
Table 4. Regional Origin of Kokonte Purchasing Households in Accra I . - · . . I . . . . - - . .
Region
·Western Central Greater Accra Eastern
·Volta Ashanti Brong.Ahafo Northern Upper West Upper East
. Non..:Ghanaians Total
Regional origmotKoKonte purchasing .households.in. Accra* -% of total
2.7 5.5
39.7 21.9
8.2 1.4 1.4 6.8
1.4 4.1 6.8
100
Regional-originofall ·.households·surveyed•inAeci-a duringGLSS3* - o/o·oftotii.l> ··
3.9 9.1
47.3 14.8 9.1 7.6 1.3 2.8 0.4 0.9 2.8 100
* According to the region of origin of the head of the household Number of households surveyed in Accra = 461 Number households in the Accra sample which reported kokonte purchases = 73 Proportion of households which reported purchasing kokonte = 15.8%
By comparing columns two and three, we can tell which regions are under or overrepresented among kokonte consuming households in Accra. The GLSS3 Accra sample was small compared with the overall population of the city, and consequently this analysis will only comment on the kokonte purchasing habits of those regional household groups which diverge substantially from what would be expected if all groups exhibited the same kokonte purchasing behaviour.
The Accra regional groups which fall into the "substantially under-represented" category are Central Region, Greater Accra and Ashanti. Why Accra households of Central Region origin should eschew kokonte is not immediately apparent. However, ifwe look at per capita expenditure in Central Region itself(refer to Table 2), we see that urban consumers spend substantially less on kokonte than their rural counterparts. The answer to our conundrum might therefore be that, given the greater choice of food staples in urban markets, Central Region consumers tend to avoid kokonte.
A similar reason might account for the reluctance of Accra households of Greater Accra Region origin to purchase kokonte (clearly, many such households buy kokonte but they are under-represented as kokonte purchasers relative to their importance in the overall population of Accra) . The per capita figures in Table 2 reveal that the bulk of kokonte purchasing in Greater Accra Region occurs in the rural areas, suggesting that Greater Accra urbanites tend to avoid kokonte by exploiting the greater choice of food staples available in the urban areas.
Unfortunately, there is nothing in the GLSS3 data which might account for the aversion that Ashanti households in Accra hold for kokonte. In their own region,
10

Ashantis are modest but significant purchasers of kokonte, both in urban and rural regions .
Turning the discussion to the Accra based regional groups which are significantly overrepresented among kokonte purchasers in Accra, we see that consumers from Eastern Region, Upper East Region and Northern Region fall into this category. There is no surprise that consumers from Upper East and Northern figure highly among Accra kokonte purchasers. As described in section 3, both regions have strong traditions of kokonte consumption. However, quite why Accra households ofEastern Region origin should be proportionately over-represented is not apparent, especially when data from Table 1. indicates that kokonte expenditure within Eastern Region itself is low.
The figures in Table 5 were calculated to test the hypothesis that lower income families within Accra purchase more kokonte than higher income families. This hypothesis is based on the notion that kokonte is an "inferior good", and therefore more likely to be purchased because it is cheap rather than it is preferred to other food items for reasons oftaste or social status.
bl H ----- ~~-
hold E d" F. dM H holds· Estimated household Estim:atednon•food' Estimated total . ··'.Meanhousehold:·size: /'' ·'" food expenditure·(Mar househoJd,expenditure household eXpenditure '92 Cedis) (Mar '92 Cedis) (Mar '92 Cedls)
Kokonte;purchasing 376,013 117,062 493,075 4.59* households:in:Accra .sampk Non-kokonte" '· 343,673 147,460 491,133 3.45* 'purchasing.households .in .Accra sample
Note. In March 1992, the midpoint of the GLS3 survey, the Cedi exchange rate was approximately US$1 to C400. * Means are statistically different at the 1% significance level
The GLS3 survey gathered no income data and consequently we have to use a proxy variable to estimate household incomes. In our case, total household expenditure is particularly appropriate because other income applications, such as savings and investments, are likely to be small for most Accra households. The information in Table 5 is divided into average household food expenditure, average non-food expenditure and average total expenditure (the sum of average food and average nonfood expenditures) . This information is given both for non-kokonte purchasing households and for those households that did purchase kokonte during the survey period.
In a developing country such as Ghana, where incomes are generally low, we would expect household food expenditure to be substantially greater than household non-food expenditure. This is evidently the case with households in Accra, where average food expenditure for households in the GLS3 survey was approximately two and a third (2.33) times the level of average non-food expenditure.
Comparing the total average household expenditures for the two groups in Table 5, there is very little difference in total household expenditure. However, note that average food-expenditure for the kokonte purchasers is larger than the average figure for the non-kokonte households. A potential explanation for this appears in the fifth
11

column ofTable 5. The average size ofkokonte purchasing households in the Accra sample is approximately one and a third times the average size of non-purchasing households. Moreover, the difference in means is statistically significant at the 1% level (see Appendix for test results), suggesting a very high probability of a real difference between average household sizes in the two categories. A plausible interpretation is that large households in Accra buy kokonte because it is relatively cheap, and therefore can be bought in quantities which ensure that each member of the household has sufficient food to eat. Quite what this says about kokonte's social status is not conclusive. However, the evidence seems to indicate kokonte's role in bolstering family food security in Accra2
. ·
7. Conclusions
For the most part, this research has confirmed our expectations ofkokonte expenditure patterns in Ghana. For instance, anecdotal evidence led us to believe that households in Northern Region and Upper East Region spend large sums of money on kokonte. GLSS3 data, summarised in Table 1, reveals that per capita expenditure in these two regions was higher than in any other region during the survey period. This pattern is also reflected in the Accra expenditure analysis. Accra households whose origins lie in Northern and Upper East regions are substantially over-represented among kokonte purchasing households.
There are however, a few results which confound expectation. For instance, there is no convenient explanation why Accra households of Eastern Region origin should be over-represented among kokonte purchasing households in the Accra sample, and, by the same token, why Accra households of Ashanti origin should be under-represented. These findings contradict evidence from the regional analysis, which suggests that Eastern Region households spend little on kokonte, while their counterparts in Ashanti spend modestly yet significantly on kokonte.
There is no conclusive evidence in this analysis to suggest that kokonte is an inferior good. Given suitable data, this theory could be tested by creating an econometric income/expenditure model. However, the quality of GLSS data, especially the kokonte price series, is not good enough to estimate such a model.
While acknowledging its limitations, the Accra analysis seems to throw light on why specific Accra households purchase kokonte. Larger households appear to exploit the cheapness of kokonte to eke out their incomes and to ensure that enough food is available for household members.
Even though the price data is incomplete, GLSS3 kokonte prices generally followed expected seasonal and geographical patterns. In rural areas, prices in all three price zones peak between the beginning of April and the end ofJuly (refer to Chart 1). This
2 There is a possibility that the ethnicity or regional origin of the household determines both household size and kokonte purchasing habits. However, a one way ANOV A test revealed that in the Accra sample, there is no significant difference between the mean sizes of households from different regional origins (see Appendix for test results).
12

pattern is easily explained: During this period, kokonte supply is usually hampered by poor processing weather, yet kokonte demand remains generally high until maize becomes available in August. Other patterns worthy of note are the geographical price differences encountered between urban areas during the survey. Kokonte is a bulky commodity and is consequently expensive to transport. In towns far from areas of production, kokonte should therefore be relatively more expensive. This pattern is evident in Chart 2: Prices in zone 2 (which contains kokonte producing areas) are lower than prices in zone 3 (where production is considerably lower).
13

References
Ghana Statistical Service (1995), "Ghana Living Standards Survey Report on the Third Round (GLSS3), September 1991 -September 1992".
Ghana Statistical Service ( 1987), "1984 Population Census of Ghana - Demographic and Economic Characteristics" .
Howeler, R. H. , (1991) "Long term effect of cassava on soil productivity", Field Crops Research, Vol. 26, Issue 1, pp. 1-18.
14

Appendix
Statistical tests of significance
1. Mean sizes of household categories in Accrs
H0: There is no statistically significant difference between the mean household sizes of kokonte purchasing households and non-purchasing households in the Accra sample
H1: There is a statistically significant difference.
Mean difference 1.135
s.e. of difference 0.298
p-value 0.000
Conclusion: Reject null hypothesis. There is a statistically significant difference between mean household sizes.
N.B. Levene's test for equality ofvariances returned a p-value of 0.546, thus giving no reason to believe that the assumption of equal means is violated.
2. Mean sizes of households in Accra from different regional origins
H0: There are no statistically significant differences between the mean sizes of Accra households from different regional origins.
H1: There are statistically significant differences.
Analysis of Variance
Sum of Mean F Source D.F. Squares Squares Ratio p-value
Between Groups 10 71.900 7.190 1.281 0.238 Within Groups 450 2524.877 5.611 Total 460 2596 .777
Conclusion: Do not reject null hypothesis.
N.B . Levene's test for equality ofvariances returned a p-value of 0.487, thus giving no reason to believe that the assumption of equal means is violated.
15


