Knowledge Sharing in the Online Social Network of Yahoo ...
14
0018-9340 (c) 2013 IEEE. Personal use is permitted, but republication/redistribution requires IEEE permission. See http://www.ieee.org/publications_standards/publications/rights/index.html for more information. This article has been accepted for publication in a future issue of this journal, but has not been fully edited. Content may change prior to final publication. Citation information: DOI 10.1109/TC.2014.2322598, IEEE Transactions on Computers 1 Knowledge Sharing in the Online Social Network of Yahoo! Answers and Its Implications Haiying Shen*, Senior Member, IEEE , Ze Li, Jinwei Liu, Joseph Edward Grant Abstract—Question and Answer (Q&A) websites such as Yahoo! Answers provide a platform where users can post questions and receive answers. These systems take advantage of the collective intelligence of users to find information. In this paper, we analyze the online social network (OSN) in Yahoo! Answers. Based on a large amount of our collected data, we studied the OSN’s structural properties, which reveals strikingly distinct properties such as low link symmetry and weak correlation between indegree and outdegree. After studying the knowledge base and behaviors of the users, we find that a small number of top contributors answer most of the questions in the system. Also, each top contributor focuses only on a few knowledge categories. In addition, the knowledge categories of the users are highly clustered. We also study the knowledge base in a user’s social network, which reveals that the members in a user’s social network share only a few knowledge categories. Based on the findings, we provide guidance in the design of spammer detection algorithms and distributed Q&A systems. We also propose a friendship-knowledge oriented Q&A framework that synergistically combines current OSN-based Q&A and web Q&A. We believe that the results presented in this paper are crucial in understanding the collective intelligence in the web Q&A OSNs and lay a cornerstone for the evolution of next-generation Q&A systems. Index Terms—Yahoo! Answers, Question and answer platforms, Online social networks, Collective intelligence, User behavior ✦ 1 I NTRODUCTION W EB search engines (e.g., Google and Bing) al- low us to search information by keywords on the Internet. Recently, web search engines have been improved by combining with social networks [1]–[8], enabling friends in social networks to collaborate with each other to determine the relevance of the returned results to their queries. Users use web annotations or bookmarks to indicate the search results they are interested in, which helps their friends sharing the same interests to quickly identify results useful to them as well. However, picking up useful information from the overwhelming amount of returned results still re- mains a challenge. Users sometimes prefer to directly receive the answers rather than going through a long tedious searching process. For example, though the answer of “how to write | = in LaTex?” can be found by searching the LaTex reference manual from Google and then searching the long manual, it is much easier to be directly told about the answer. In addition, al- though the search engine based information retrieval performs very well in answering factual queries for the information already existing in databases, it is not suitable for non-factual or context-aware queries (e.g., suggestions, recommendations and advices), which are more subjective, relative and multi-dimensional in context, especially for information not existing in databases. This remains as a formidable challenge fac- • * Corresponding Author. Email: [email protected]; Phone: (864) 656 5931; Fax: (864) 656 5910. • Haiying Shen, Ze Li and Jinwei Liu are with the Department of Electrical and Computer Engineering, Clemson University, Clemson, SC, 29634. Joseph Edward Grant is with the School of Computing, Clemson University, Clemson, SC, 29634. E-mail: {shenh, zel, jinweil, jegrant}@clemson.edu ing current search engines without big breakthroughs in machine learning and natural language processing techniques. In reality, people are the most “intelligent ma- chines” that are capable of parsing, interpreting and answering questions, provided they are familiar with the topics. Each person has knowledge from his ca- reers, education, life, experience, interests and so on, which forms his knowledge base. By collecting the in- telligence of people to find information, Question and Answer (Q&A) websites such as Yahoo! Answers [9] (YA) and Ask.com [10] have naturally emerged as an alternative to Q&A. These websites provide a plat- form where users can post questions and receive an- swers. To encourage participation, a user pays points for asking a question and earns points from answering a question. A user earns more points if his answer is selected as the “best answer” by the questioner. If user A wants to frequently visit/track all questions and answers of user B, A adds B to its contact list by building a link to B. Then, A becomes B’s fan. Thus, a knowledge-oriented online social network (OSN) with directed links between nodes is formed in the Q&A system. YA classifies knowledge into 26 general knowl- edge categories (KCs) (e.g., Sports, Health). Each general knowledge categories has a number of detailed KCs (e.g., Golf, Tennis). Users with many points are recog- nized as top contributors, whose profiles indicate the general and details KCs they are knowledgeable in. Although Q&A websites are becoming increasingly popular and can provide high quality answers [11], they have some shortcomings in satisfying users’ needs. First, the latency for receiving a satisfying answer is high with the average equals 2:52:30 (hh:mm:ss) even when the number of the registered users is very large (290,000) [12]. This is because most users log in the Q&A website only when they have questions to ask. Even if some users may intend to an- swer others’ questions, since all questions in one topic
Transcript of Knowledge Sharing in the Online Social Network of Yahoo ...

0018-9340 (c) 2013 IEEE. Personal use is permitted, but republication/redistribution requires IEEE permission. Seehttp://www.ieee.org/publications_standards/publications/rights/index.html for more information.
This article has been accepted for publication in a future issue of this journal, but has not been fully edited. Content may change prior to final publication. Citation information: DOI10.1109/TC.2014.2322598, IEEE Transactions on Computers
1
Knowledge Sharing in the Online Social Network ofYahoo! Answers and Its Implications
Haiying Shen*, Senior Member, IEEE , Ze Li, Jinwei Liu, Joseph Edward Grant
Abstract—Question and Answer (Q&A) websites such as Yahoo! Answers provide a platform where users can post questionsand receive answers. These systems take advantage of the collective intelligence of users to find information. In this paper, weanalyze the online social network (OSN) in Yahoo! Answers. Based on a large amount of our collected data, we studied theOSN’s structural properties, which reveals strikingly distinct properties such as low link symmetry and weak correlation betweenindegree and outdegree. After studying the knowledge base and behaviors of the users, we find that a small number of topcontributors answer most of the questions in the system. Also, each top contributor focuses only on a few knowledge categories.In addition, the knowledge categories of the users are highly clustered. We also study the knowledge base in a user’s socialnetwork, which reveals that the members in a user’s social network share only a few knowledge categories. Based on thefindings, we provide guidance in the design of spammer detection algorithms and distributed Q&A systems. We also propose afriendship-knowledge oriented Q&A framework that synergistically combines current OSN-based Q&A and web Q&A. We believethat the results presented in this paper are crucial in understanding the collective intelligence in the web Q&A OSNs and lay acornerstone for the evolution of next-generation Q&A systems.
Index Terms—Yahoo! Answers, Question and answer platforms, Online social networks, Collective intelligence, User behavior
�
1 INTRODUCTION
WEB search engines (e.g., Google and Bing) al-low us to search information by keywords on
the Internet. Recently, web search engines have beenimproved by combining with social networks [1]–[8],enabling friends in social networks to collaborate witheach other to determine the relevance of the returnedresults to their queries. Users use web annotationsor bookmarks to indicate the search results they areinterested in, which helps their friends sharing thesame interests to quickly identify results useful tothem as well.
However, picking up useful information from theoverwhelming amount of returned results still re-mains a challenge. Users sometimes prefer to directlyreceive the answers rather than going through a longtedious searching process. For example, though theanswer of “how to write |= in LaTex?” can be foundby searching the LaTex reference manual from Googleand then searching the long manual, it is much easierto be directly told about the answer. In addition, al-though the search engine based information retrievalperforms very well in answering factual queries forthe information already existing in databases, it is notsuitable for non-factual or context-aware queries (e.g.,suggestions, recommendations and advices), whichare more subjective, relative and multi-dimensionalin context, especially for information not existing indatabases. This remains as a formidable challenge fac-
• * Corresponding Author. Email: [email protected]; Phone: (864) 6565931; Fax: (864) 656 5910.
• Haiying Shen, Ze Li and Jinwei Liu are with the Department ofElectrical and Computer Engineering, Clemson University, Clemson,SC, 29634.Joseph Edward Grant is with the School of Computing, ClemsonUniversity, Clemson, SC, 29634.E-mail: {shenh, zel, jinweil, jegrant}@clemson.edu
ing current search engines without big breakthroughsin machine learning and natural language processingtechniques.
In reality, people are the most “intelligent ma-chines” that are capable of parsing, interpreting andanswering questions, provided they are familiar withthe topics. Each person has knowledge from his ca-reers, education, life, experience, interests and so on,which forms his knowledge base. By collecting the in-telligence of people to find information, Question andAnswer (Q&A) websites such as Yahoo! Answers [9](YA) and Ask.com [10] have naturally emerged as analternative to Q&A. These websites provide a plat-form where users can post questions and receive an-swers. To encourage participation, a user pays pointsfor asking a question and earns points from answeringa question. A user earns more points if his answeris selected as the “best answer” by the questioner. Ifuser A wants to frequently visit/track all questionsand answers of user B, A adds B to its contact list bybuilding a link to B. Then, A becomes B’s fan. Thus, aknowledge-oriented online social network (OSN) withdirected links between nodes is formed in the Q&Asystem. YA classifies knowledge into 26 general knowl-edge categories (KCs) (e.g., Sports, Health). Each generalknowledge categories has a number of detailed KCs(e.g., Golf, Tennis). Users with many points are recog-nized as top contributors, whose profiles indicate thegeneral and details KCs they are knowledgeable in.
Although Q&A websites are becoming increasinglypopular and can provide high quality answers [11],they have some shortcomings in satisfying users’needs. First, the latency for receiving a satisfyinganswer is high with the average equals 2:52:30(hh:mm:ss) even when the number of the registeredusers is very large (290,000) [12]. This is because mostusers log in the Q&A website only when they havequestions to ask. Even if some users may intend to an-swer others’ questions, since all questions in one topic

0018-9340 (c) 2013 IEEE. Personal use is permitted, but republication/redistribution requires IEEE permission. Seehttp://www.ieee.org/publications_standards/publications/rights/index.html for more information.
This article has been accepted for publication in a future issue of this journal, but has not been fully edited. Content may change prior to final publication. Citation information: DOI10.1109/TC.2014.2322598, IEEE Transactions on Computers
2
appear together in one forum, it is difficult for themto identify the questions they can answer. Second, asQ&A websites are normally open to all anonymoususers in Internet, spam is a difficult problem.
In recent years, OSN-based Q&A systems [11], [13]–[17] have been developed. Facebook launched a Q&Aapplication in July, 2010. In an OSN-based Q&A sys-tem, users post and answer questions through theOSN to take advantage of the collective intelligenceof their friends. Specifically, a centralized server iden-tifies possible answers from the questioner’s friendsin his social network, and forwards the questiondirectly to them. Expert location systems [18]–[21]that search experts in specified fields share similaritywith OSN-based Q&A systems in answerer location.Research [15] shows that the answerers in the OSN arewilling to and able to provide more tailored and per-sonalized answers to the questioners since they knowa great deal about the backgrounds and preferenceof the questioners. However, the characteristics of theknowledge of the friends in a user’s social networkmay affect the quality of the answers for the user’squestions. Factual questions such as “what is the timecomplexity of the X algorithm” need the answers fromexperts in the computing theory field, which may notbe offered by the OSN-based Q&A systems.
OSN-based Q&A systems cannot provide expert an-swers while web Q&A systems cannot provide timelypersonalized answers. By synergistically integratingthe web Q&A system and OSN-based Q&A systemthrough building a social network in web Q&A sys-tem, both systems’ shortcomings can be overcome.To achieve this, it is important to understand thenature and impact of collective intelligence in theOSNs of both systems. However, no previous workhas been devoted to studying the OSN in the Q&Awebsites, though previous research investigated theOSN-based Q&A systems. In this paper, we analyzethe OSN in YA, a popular online Q&A website. Forthis effort, we have collected Q&A trace data duringthree months, and a large amount of personal dataand their associated relationship in YA. The maincontribution of this paper is an extensive trace-drivenanalysis of OSN structure, user behavior, user knowl-edge base and their relationships. To the best of ourknowledge, this work is the first to extensively studyvarious aspects of the YA OSN. Our analysis yieldsvery interesting results and the highlights of our workare summarized as follows:• Examination on the structural properties of the YA
OSN shows that though it shares a common prop-erty with other previously studied OSNs in thatthe node indegree and outdegree exhibit power-lawdistribution, it has strikingly distinct properties: (1)It has low link symmetry; (2) It exhibits weak cor-relation between indegree and outdegree; (3) Userstend to connect to other users with different degreesfrom their own; (4) Users exhibit an extremely lowclustering coefficient.
• Investigation on the knowledge base and behaviorsof users in YA reveals that (1) A small portion
of the users (i.e., 10%) contribute to the most ofthe high-quality answers; (2) Users who answeredmore questions tend to receive more points andhave more best answers; (3) The 12 most populargeneral KCs account for 80% of all general KCsin the system; (4) The top contributors consistentlycontribute high-quality answers. Many top contrib-utors focus on one general KC, and 56.5% of themhave multiple general KCs, but all of the them havemultiple detailed KCs; (5) There exists a positivelinear correlation between the number of fans andpoints of a user but no correlation between thenumber of contacts and points of a user; (6) The KCsof the users are highly clustered, and most usershave a single KC interest.
• Analysis on the relationship of knowledge base andOSN structure shows that (1) The size of the knowl-edge base within a user’s one-hop OSN neighborsis small, and it increases, though not significantly,within two-hop OSN neighbors; (2) Reciprocity (i.e.,bidirectional connected) users share more commonKCs than one-way connected users, who share moreKCs than disconnected users; (3) Users with shortersocial distances in the fan network or contact net-work tend to share more common KC interests.
• We finally discuss the implications of our findingson the design of spammer detection algorithms inQ&A systems and a distributed Q&A system thatintegrates both web Q&A system and OSN-basedQ&A system.
• Our analysis provides critical insights regardingthe different properties of the YA OSN and otherfriendship and/or knowledge oriented OSNs. Theanalytical results provide cornerstone for the perfor-mance improvement on current Q&A systems andthe evolution of next-generation Q&A systems.The remainder of the paper is organized as follows.
Section 2 describes the background of YA and mea-surement methodology. We analyze structural prop-erties of the social networks in Section 3 and userknowledge base and Q&A behaviors in Section 4.Section 5 studies the knowledge base of users in thetheir social networks. Section 6 provides insights insystem/algorithem design for spammer detection andfor distributed Q&A systems based on our observa-tions in YA. Section 7 presents related work and weconclude the paper in Section 8.
2 BACKGROUND AND MEASUREMENTMETHODOLOGY
YA, as a knowledge market, was launched by Yahoo!on July 5, 2005. It has an OSN with unidirectionallinks between nodes. The nodes in a user’s contactlist are called outdegree nodes, which form the node’scontact network, and the nodes in a node’s fan listare called indegree nodes, which form the node’s fannetwork. Thus, YA OSN incorporates two directionalnetworks: contact network and fan network. The formerincludes all nodes and their outdegree nodes and thelatter includes all nodes and their indegree nodes.

0018-9340 (c) 2013 IEEE. Personal use is permitted, but republication/redistribution requires IEEE permission. Seehttp://www.ieee.org/publications_standards/publications/rights/index.html for more information.
This article has been accepted for publication in a future issue of this journal, but has not been fully edited. Content may change prior to final publication. Citation information: DOI10.1109/TC.2014.2322598, IEEE Transactions on Computers
3
TABLE 1High level statistic of the crawled YA social network.# of nodes in the social network 119175# of links in the contact network 1,786,036# of links in the fan network 1,265,305Ave. # of contacts per user in the contact network 14.98Ave. # of fans per user in the fan network 10.61Ave. # of general KCs in a user’s contact network 2.1Ave. # of detailed KCs in a user’s contact network 4.2Ave. # of general KCs in a user’s fan network 2.2Ave. # of detailed KCs in a user’s fan network 4.2
We developed a crawler using Python. The crawlerstarted from the first 4000 top contributors and in-serted these users into an initially empty queue. Itfetched the first user from the queue, recorded his pro-file information (i.e., total number of earned points,answers, best answers and questions), retrieved andinserted his public visible contacts and fans to thequeue, and finally removed this user from the queue.This process repeated until the queue became empty.We skipped the users that restricted their profiles toother users. Such users only constitute less than 5% ofour crawled users. Crawling was started on Aug. 17and ended on Oct. 19, 2011. As the crawled OSN datais seeded at 4000 different users with various KCs,it can well represent an actual knowledge-orientedOSN. In addition, for each user, we recorded its profileinformation for the activities during every week fromAug. 17 to Oct. 19 2011. In our trace data, about 8%of the users are top contributors. Table 1 shows thehigh level statistics of the crawled YA OSN.
3 ANALYSIS OF OSN STRUCTUREIn this section, we study the structural characteristicsof the YA OSN. We also are interested in answeringa question: does it show similar structural character-istics as other friendship and/or knowledge orientedOSNs [22], [23]?
3.1 ReciprocityIn an OSN, users create social links between eachother. For instance, user A invites user B to be A’sfriend. If B accepts the invitation, a social link is builtfrom A to B. A social link from B to A is automaticallybuilt in some OSNs such as Facebook, while is builtonly after A accepts B’s friend invitation in someother OSNs. The pairwise bidirectional relationshipbetween two nodes is called reciprocity. We define thereciprocity rate of an OSN as the number of reciprocitylinks over all links of all users. Table 2 shows thereciprocity rate of YA and a number of other OSNsfrom other studies [22], [24]–[27]. We see that thereciprocity rate of YA is 30.7%. It is similar to thereciprocate rate (39.4%) of the content rating web-site Digg. Twitter also has a low reciprocity rate of22.1%. In contrast, Facebook, Flickr and Yahoo!360have high reciprocity rates, and they are 100%, 68%and 84%, respectively. In these OSNs, a large part ofthe users connect with each other by their real socialties (i.e., friendship) in their daily lives. Therefore,most links in these OSNs are bidirectional and theirreciprocity rate is high. On the contrary, Digg, YA,
TABLE 2Reciprocity rate of different OSN.
Social network website Reciprocity rateFacebook [24] 100%Flickr [25] 68%Yahoo!360 [22] 84%Digg [26] 39.4%Yahoo! Answers 30.7%Twitter [27] 22.1%
Twitter are mainly information/knowledge sharingwebsites, in which people are mainly connected ac-cording to their interests. Therefore, most links inthese websites are unidirectional and their reciprocityrate is low. Twitter generates the lowest reciprocityrate. This is because Twitter currently is treated asa social media by large companies and celebrities topublish information [27]. YA has the second lowestreciprocity rate. Our crawled dataset also shows that16.7% of the users only have fans but no contacts. Thisimplies that users prefer to connect to users who areknowledgable in certain categories, and knowledgableusers can attract more fans.
(a) Contact network (b) Fan networkFig. 1. Snapshots of contact network and fan network.
3.2 Power-law Node DegreeOne striking property of the general OSNs is that theirnode degree (indegree or/and outdegree) follows apower-law distribution. That is, the majority of nodeshave small degree while a few nodes have signifi-cantly higher degree. The power-law distribution iscaused by the preferential attach process, in which theprobability of a user A connecting to a user B isproportional to the number of B’s existing connec-tions. Figures 1(a) and (b) show the snapshots of thecontact network and fan network in YA, respectively.We see some nodes do not have either fans or contacts,while a few nodes have a very large degree. Theseresults show that both of node indegree and outdegreefollow a power-law distribution. The results meanthat many nodes prefer to connect to (i.e., becomefans of) power-law indegree nodes and power-lawoutdegree nodes prefer to connect many other nodes(i.e., become others’ fans).
Figure 2 further shows the indegree and outde-gree complementary cumulative distribution func-tions (CCDF). The figures further confirm that theindegree and outdegree approximately conform to apower-law distribution [23], [28], [29]. In other words,the preferential attach process also occurs in the YAknowledge sharing system. This means that somenodes with high indegree attract more nodes to con-nect to them, and some nodes with high outdegree
0018-9340 (c) 2013 IEEE. Personal use is permitted, but republication/redistribution requires IEEE permission. Seehttp://www.ieee.org/publications_standards/publications/rights/index.html for more information.
This article has been accepted for publication in a future issue of this journal, but has not been fully edited. Content may change prior to final publication. Citation information: DOI10.1109/TC.2014.2322598, IEEE Transactions on Computers
4
are easily attracted by more nodes. We also see thatthere is a sharp drop in Figure 2(a) at around x=200.In 2007, YA launched a new policy that each user canhave maximum 200 contacts. As a result, only few oldregistered users have more than 200 contacts, and thesize of most users’ contact lists is close to 200, whichproduces the sharp decrease.
(a) Outdegree (contacts) (b) Indegree (Fans)
Fig. 2. Log-log plot of indegree and outdegree CCDF.We ranked the users based on their number of
earned points. Specifically, we sorted the users basedon their number of points in a descending order andassigned a rank to each node sequentially; rank 1 wasassigned to the top node.
We then plotted the number of points a node hasversus its rank in Figure 3. We see that the num-ber of points of users also conforms to a power-law distribution. This implies that a small amountof users are very active in answering questions andthe rest are not active. Also, some of these nodesmay give high-quality answers so that they can earnmore points quickly. This phenomenon explains thepower-law distribution of node indegree, that is, usersare likely to connect to the users that are active andknowledgable in their interested categories. We willshow the detail of the reason in Section 4.5.
Fig. 3. Distribution ofpoints.
The power-law distribu-tion of node degree is alsocaused by the popularityof the KCs, which affectsthe number of people in-volved in a KC. Users tendto connect to other usersin popular KCs. Also, theusers that are active innon-popular topics maynot attract as much atten-tion and have fewer fans. We will further investigatehow the active answerers and category popularityaffect the node degree in Section 4.
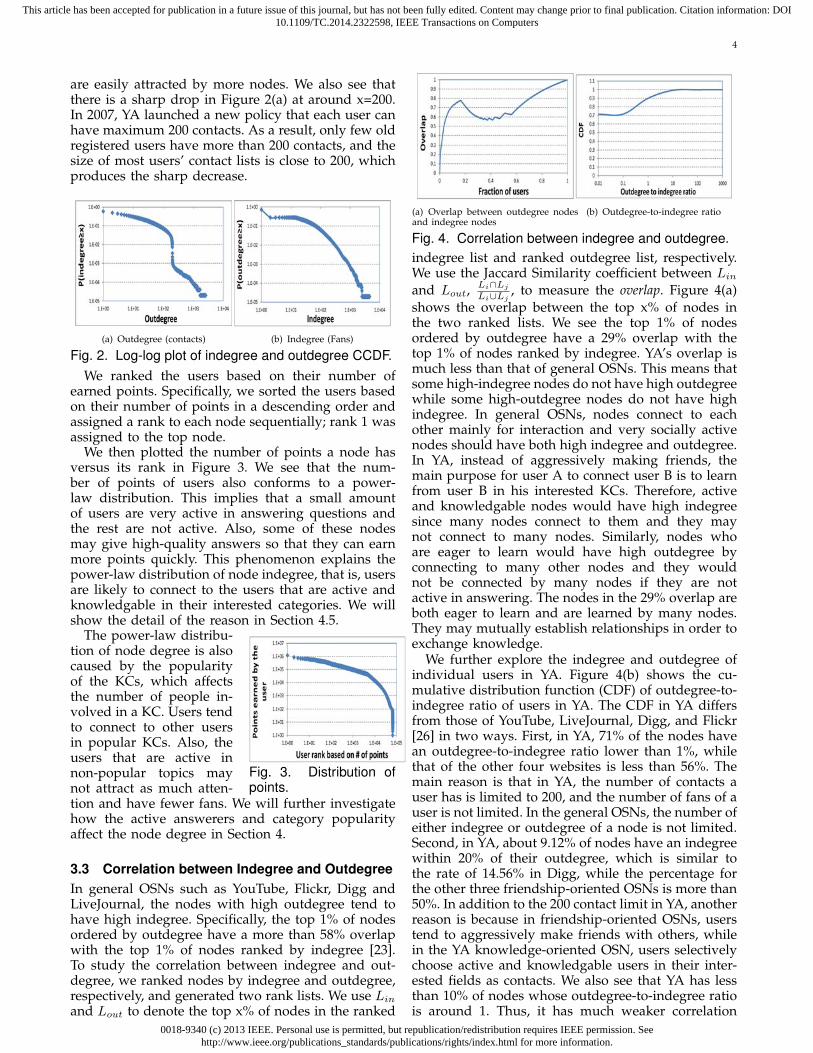
3.3 Correlation between Indegree and OutdegreeIn general OSNs such as YouTube, Flickr, Digg andLiveJournal, the nodes with high outdegree tend tohave high indegree. Specifically, the top 1% of nodesordered by outdegree have a more than 58% overlapwith the top 1% of nodes ranked by indegree [23].To study the correlation between indegree and out-degree, we ranked nodes by indegree and outdegree,respectively, and generated two rank lists. We use Lin
and Lout to denote the top x% of nodes in the ranked
(a) Overlap between outdegree nodesand indegree nodes
(b) Outdegree-to-indegree ratio
Fig. 4. Correlation between indegree and outdegree.indegree list and ranked outdegree list, respectively.We use the Jaccard Similarity coefficient between Lin
and Lout,Li∩Lj
Li∪Lj, to measure the overlap. Figure 4(a)
shows the overlap between the top x% of nodes inthe two ranked lists. We see the top 1% of nodesordered by outdegree have a 29% overlap with thetop 1% of nodes ranked by indegree. YA’s overlap ismuch less than that of general OSNs. This means thatsome high-indegree nodes do not have high outdegreewhile some high-outdegree nodes do not have highindegree. In general OSNs, nodes connect to eachother mainly for interaction and very socially activenodes should have both high indegree and outdegree.In YA, instead of aggressively making friends, themain purpose for user A to connect user B is to learnfrom user B in his interested KCs. Therefore, activeand knowledgable nodes would have high indegreesince many nodes connect to them and they maynot connect to many nodes. Similarly, nodes whoare eager to learn would have high outdegree byconnecting to many other nodes and they wouldnot be connected by many nodes if they are notactive in answering. The nodes in the 29% overlap areboth eager to learn and are learned by many nodes.They may mutually establish relationships in order toexchange knowledge.
We further explore the indegree and outdegree ofindividual users in YA. Figure 4(b) shows the cu-mulative distribution function (CDF) of outdegree-to-indegree ratio of users in YA. The CDF in YA differsfrom those of YouTube, LiveJournal, Digg, and Flickr[26] in two ways. First, in YA, 71% of the nodes havean outdegree-to-indegree ratio lower than 1%, whilethat of the other four websites is less than 56%. Themain reason is that in YA, the number of contacts auser has is limited to 200, and the number of fans of auser is not limited. In the general OSNs, the number ofeither indegree or outdegree of a node is not limited.Second, in YA, about 9.12% of nodes have an indegreewithin 20% of their outdegree, which is similar tothe rate of 14.56% in Digg, while the percentage forthe other three friendship-oriented OSNs is more than50%. In addition to the 200 contact limit in YA, anotherreason is because in friendship-oriented OSNs, userstend to aggressively make friends with others, whilein the YA knowledge-oriented OSN, users selectivelychoose active and knowledgable users in their inter-ested fields as contacts. We also see that YA has lessthan 10% of nodes whose outdegree-to-indegree ratiois around 1. Thus, it has much weaker correlation

0018-9340 (c) 2013 IEEE. Personal use is permitted, but republication/redistribution requires IEEE permission. Seehttp://www.ieee.org/publications_standards/publications/rights/index.html for more information.
This article has been accepted for publication in a future issue of this journal, but has not been fully edited. Content may change prior to final publication. Citation information: DOI10.1109/TC.2014.2322598, IEEE Transactions on Computers
5
between indegree and outdegree than the other threeOSNs. This can be explained by a much lower levelof link symmetry in YA.
3.4 Link Degree CorrelationIn the general OSNs (e.g., Flickr, LiveJournal andOrkut), high-degree nodes tend to connect to otherhigh-degree nodes [23]. It implies that highly socialnodes tend to connect with each other. We are inter-ested to see whether this phenomenon also exists inYA. If so, it means knowledgable users tend to shareknowledge between each other.
To answer this question, we examined how of-ten nodes of different degrees connect to each otherrepresented by joint degree distribution, which can beapproximated by the degree correlation function Knn.It is a mapping between outdegree and the averageindegree of all nodes connected to nodes with thatoutdegree [23]. The Knn of outdegree d is measured asthe average indegree of all nodes connected to nodeswith d outdegree. In a directed graph G(V,E), sup-pose Vd is the set of all nodes connected to nodes withd outdegree, Knn =
|{ejk,vj∈V,vk∈Vd}||Vd| . An increasing
Knn implies a tendency of higher-degree nodes toconnect to other high-degree nodes while a decreasingKnn indicates the opposite trend, that is, high-degreenodes tend to connect to low-degree nodes.
Figure 5(a) depicts Knn for YA associated withits trend line, from which we see that as a user’soutdegree increases to around 200, Knn exhibits asharp decrease. Also, when the outdegree is lowerthan 200, Knn remains significantly higher thanthe outdegree. The watershed of 200 is caused bythe outdegree limit of 200 in YA. Then, we canconclude that YA exhibits different behaviors fromthe general OSNs, where Knn increases as outdegreeincreases. This is caused by the celebrity-drivennature in YA, i.e., there are a few extremely activeand knowledgable users to whom many inactiveusers link to. We can also see that some nodes haveindegree much lower than their outdegree, whichmeans that some inactive users connect to manyother nodes but rarely linked by other nodes. Theseresults are consistent with those in Figures 2 andFigure 3. Combining the observations in Section 3.3,we see there exist three classes of users: learners,experts and users that are both learners and experts.
3.5 Clustering CoefficientWe then explore the connection density of theneighborhood of a node, which is quantifiedby the clustering coefficient for directed graphsG(V,E). The neighbourhood for a node vi isdefined as its immediately connected neighboursas Ni = {vj : eij ∈ E ∧ eji ∈ E}. The clusteringcoefficient of a node with Ni neighbors is definedas the ratio of the number of directed links existingbetween the node’s Ni neighbors and the number ofpossible directed links that could exist between theseneighbors (Ni(Ni − 1)): |{ejk:vj ,vk∈Ni,ejk∈E}|
|Ni|(|Ni|−1) . The
(a) Degree correlation function (b) Average clustering coefficient
Fig. 5. Degree correlation and clustering coefficient.
average of individual nodes’ clustering coefficientsis 0.029 in YA. This value is much lower than thoseof YouTube, Orkut, Flickr, LiveJournal and Digg thatrange from 0.136 to 0.330 [26]. In the friendship-oriented OSNs such as Facebook and Flickr, userstend to be introduced to other users via mutualcontacts, increasing the probability that two contactsof a single user are also contacts to each other. OtherOSNs such as YouTube, Orkut, LiveJournal and Diggare oriented by both friendship and knowledge, andthey should have lower clustering coefficient thanthe pure friendship-oriented OSNs. YA is a pureknowledge-oriented OSN, and a user adds contactsonly when he finds the contacts are knowledgable inthe fields he is interested in.
Figure 5(b) shows the clustering coefficient ofeach node with respect to its outdegree. Nodes oflow outdegree have higher clustering coefficients,indicating significant clustering among low-outdegreenodes. High-outdegree nodes, on the other hand,show much lower clustering coefficients due to theirlarge number of diverse contacts. We conjecture thatthe contacts of low-outdegree nodes are most likelyin a limited number of KCs. Since users in the sameKC tend to connect to each other, low-outdegreenodes have high clustering coefficient. In contrast,the contacts of high-outdegree nodes are likely tobelong to many KCs. As users in different knowledgecommunity are less likely to connect with each other,their clustering coefficients are small.
3.6 SummaryYA OSN shares similar power-law structural property(i.e., the power-law node indegree and outdegreedistribution) with other studied OSNs (Section 3.2).That is, a few power-law indegree nodes are activeand knowledgable answerers that own many fans,and a few power-law outdegree nodes create manycontacts and are active in learning others’ knowledge.However, YA OSN has the following strikinglydifferent properties from other general OSNs:
(1) YA shows a much lower level of link reciprocity,which means that the connection between twonodes tend to be unidirectional from an activelearner to an active answerer. Since a fan-contactlink means the fan’s trust on the contact, thetrust transitivity property along the links can beexploited to identify reputed sources and detectspammers in the Q&A system (Section 3.1).

0018-9340 (c) 2013 IEEE. Personal use is permitted, but republication/redistribution requires IEEE permission. Seehttp://www.ieee.org/publications_standards/publications/rights/index.html for more information.
This article has been accepted for publication in a future issue of this journal, but has not been fully edited. Content may change prior to final publication. Citation information: DOI10.1109/TC.2014.2322598, IEEE Transactions on Computers
6
Fig. 6. The CDF of thebest answers and all an-swers.
Fig. 7. The correla-tion between best an-swers and all answers.
(2) YA exhibits weaker correlation between indegreeand outdegree. Nodes with high outdegree do notnecessarily have high indegree, and nodes withhigh indegree do not necessarily have high out-degree. This means active knowledgable answer-ers are not necessarily active learners, and activelearners are not necessarily active answerers (Sec-tion 3.3).
(3) YA does not have a tendency of higher-degreenodes to connect to other high-degree nodes. In-stead, nodes with a high indegree are connectedby nodes with various outdegree due to celebrity-driven nature, in which many nodes tend to connectto a small number of active and knowledgablenodes (Section 3.4).
(4) The users in YA exhibit an extremely low clusteringcoefficient comparing to other friendship-orientedmajor OSNs due to its tendency of unidirectionalconnections to active and knowledgable answerers(Section 3.5).
4 ANALYSIS OF USER BEHAVIOR ANDKNOWLEDGE DISTRIBUTION
Unlike many other friendship-driven OSNs that arecentered on building social relationships, YA is a Q&Asite that is centered on sharing knowledge. In YA,user A connects to other users that are knowledgablein the topics A is interested in. As the Q&A OSN isknowledge-oriented, it is very important to examinethe user knowledge distribution and associated userbehaviors.
4.1 User BehaviorFigure 6 shows the CDFs of the best answers andall answers versus user rank based on the numberof points. We see both CDFs follow a power-lawdistribution. 80% of the best answers are provided by7628 users who are ranked in the top 10% of all users.Similarly, 80% of the answers are provided by 15739users who are ranked in the 19% of all users. We alsonotice that all of the top contributors are within thetop 10% users, which means that the best answers arefrom them. Therefore, in YA, a small portion of theusers (i.e., 10%) contribute to most of the high-qualityanswers.
Figure 7 shows the number of all answers versusthe number of best answers of each user. We
Fig. 8. Correlation be-tween # of questions andanswers.
Fig. 9. CDF of KCs.
calculated the Pearson correlation coefficient betweenthese two numbers of all users, which is around 0.712.We can see that there is a positive linear relationshipbetween the number of answers and the numberof best answers and the correlation coefficient isvery high. This is because as the number of answersprovided by a user increases, the number of the bestanswers also increases.
Figure 8 shows the correlation between the numberof questions and the number of answers from eachuser with the log-log scale. We also plot the trend linefor the data based on linear regression. From the trendline, we see that users with a small number of answershave a large number of questions. However, as thenumber of answers increases, the number of questionsdecreases linearly and then increases linearly at thepoint of x=1000. We use the ratio of the numberquestions to the number of answers rqa to reflectthe querying and answering activities of the users.rqa > 1 means that a user asked more questions thananswered questions. Our data shows the average rqais 0.437, the variance is 5.61. 23.1% of the users haverqa < 0.01, which are the selfless nodes that answermuch more questions than the questions they ask.13.6% of the users have rqa > 100, which are likely tobe free-riders that ask many questions while answeronly a few questions. All top contributors are in the23.1% of the selfless nodes. It is also very interestingto see that in the top 1409 users who answered morethan 10000 question, 110 (7%) of them did not askany questions. We conjuncture that YA hires expertsto answer others’ questions in order to improve thequality of the Q/A service.
4.2 Relationship between Points and Number ofAsked/Answered QuestionsFigure 10(a) shows the relationship between the num-ber of questions asked by a user and the total pointsof the user. The users are ranked based on the numberof their points in the X axis. We see that users whoasked more questions also have fewer points. Also,there are a few users that asked very few questionsand have extremely high points. This is because anasker needs to pay 5 points for asking one questionin YA. The more questions a user asks, the more pointsthe user needs to pay, and thus the fewer points theuser has. We are interested in finding if the results arealso caused by the reason that users who ask morequestions earn fewer points as they answer fewer

0018-9340 (c) 2013 IEEE. Personal use is permitted, but republication/redistribution requires IEEE permission. Seehttp://www.ieee.org/publications_standards/publications/rights/index.html for more information.
This article has been accepted for publication in a future issue of this journal, but has not been fully edited. Content may change prior to final publication. Citation information: DOI10.1109/TC.2014.2322598, IEEE Transactions on Computers
7
(a) Correlation between # of questionsand # of user points
(b) Correlation between # of answersand # of user points
(c) Correlation between # of best an-swers and # of user points
Fig. 10. The relationship between user questing/answering behaviors and the number of user points.
questions, while users who ask fewer questions earnmore points as they answer more questions. Thus,we drew Figure 10(b) that shows the relationshipbetween the number of answers provided by a userand the total points of the user. We see that mostusers answered no more than 75000 questions andhave no more than 500000 points. There are a fewusers that answered more than 75,000 questions whilehave more than 500000 points. These users contributesignificantly to answering questions. The trend lineshows that a user’s points increases as the number ofhis answers increases. This is reasonable because ananswerer receives 2 points for answering a questionand receives 10 points if his answer is selected as thebest answer in YA. Users with more points are morecapable of answering questions and tend to providemore answers than those who have fewer points.We conjecture that more best answers are from thoseusers that provided more answers since they morefrequently answer questions and are more capableof answering questions. To confirm our conjecture,we drew Figure 10(c) that illustrates the relationshipbetween the number of best answers provided bya user and the total points of the user. In the fig-ure, we can find that more best answers are givenby the users who have relatively more points, andthere are a few users that provided much more bestanswers and earned an extreme amount of points.Basically, the number of a user’s points increases asthe number of his best answers increases. Users withmore points have knowledge in the areas of theiranswered questions and hence are more capable ofproviding answers. Thus, they tend to provide bestanswers more frequently than those who have fewerpoints. An answerer receives 2 points for answeringa question and receives 10 points if his answer isselected as the best answer in YA. As a result, if a useranswers more questions, he earns more points and hisanswers have a higher probability to be selected as thebest answers, which further increase his points.
For each fan ranked by the number of points, Figure11(a) shows his number of points and the averagenumber of points of his contacts. From the figure, wecan find that the average number of contacts’ pointsincreases with the increase of the fan’s points. More-over, the average number of contacts’ points is alwaysgreater than the number of their fan’s points. This im-plies users with fewer points tend to connect to thosewith more points. This is consistent with the realistic
05000
10000150002000025000300003500040000
111
3522
6934
0345
3756
7168
0579
3990
7310
207
1134
112
475
1360
914
743
1587
7
Nu
mb
er o
f p
oin
ts Contacts
Fans
User rank based on # of points
Contacts Fans
(a) Contact network
0100000200000300000400000500000600000700000
138
6077
1911
578
1543
719
296
2315
527
014
3087
334
732
3859
142
450
4630
950
168
Nu
mb
er o
f p
oin
ts
User rank based on # of points
ContactsFans
Contacts Fans
(b) Fan network
Fig. 11. The relationship between the points of fansand contacts in the YA social network.
situation in which users with less knowledge tend tofollow users with more knowledge in certain KCs.
For each contact ranked by the number of points,Figure 11(b) shows his number of points and theaverage number of points of his fans. In the figure, wecan find that the average number of the fans’ pointsincreases with the increase of a contact’s points. Also,the number of a contact’s points is always greaterthan the average number of its fans’ points. Thisresult again implies that users with fewer points tendto connect to those with more points. This complieswith the realistic situation in which users alwayslike to follow users who have more knowledge thanthemselves.
4.3 Distribution of Knowledge Categories
We study the knowledge base of users by examiningthe KCs of the top contributors and average users.Since the system does not specify the KCs in theprofiles of average users, we study their KCs throughthe questions in all the system’s general KCs. Thisis reasonable because as Figure 6 shows, most ofthe average users in the Q&A system are knowledgeconsumers, and they either provide low qualify an-swers or provide only a few answers. We call the KCsappearing in the top contributors’ profiles contributor’sknowledge (CK). We notice that the KCs in CK includeall general knowledge (GK) in the system.
We ranked the KCs in CK based on the appearancefrequency of each KC in CK, and ranked those in GKbased on the number of questions posted in each KCin GK. Figure 9 plots the CDF of the category rank inCK and GK, respectively. The figure shows that 80%of all questions are in the top 12 KCs in GK, and 80%of all contributors’ KCs are also in the top 12 KCs inCK. This result means that users in the system areinterested in the top 12 KCs in GK, and the active

0018-9340 (c) 2013 IEEE. Personal use is permitted, but republication/redistribution requires IEEE permission. Seehttp://www.ieee.org/publications_standards/publications/rights/index.html for more information.
This article has been accepted for publication in a future issue of this journal, but has not been fully edited. Content may change prior to final publication. Citation information: DOI10.1109/TC.2014.2322598, IEEE Transactions on Computers
8
Fig. 12. Distribution ofKCs.
Fig. 13. CCDF of KCs.
and knowledgable answerers also answer questionsfocused on the top 12 KCs in CK.
Each KC i has a pair of CK value and GK value, de-noted by (vci , vgi). A KC’s CK value is defined as thepercent of its appearance frequency in the sum of theappearance frequencies of all categories in CK, andits GK value is the percent of its number of questionsin the total number of questions. Our measurementshows that the Pearson correlation coefficient betweenthe two values of all KCs equals 0.4988, which showsa strong correlation between CK and GK. Each pointin Figure 12 shows (vci , vgi) of each knowledgablecategory i ∈ [1, 26]. We see that the KC that hasa large CK value tends to have a large GK value.The KCs that are popular in top contributors are alsopopular in general knowledge of all users, becausethe KCs in which top contributors frequently answerquestions are also the KCs in which users frequentlyask questions.
4.4 Behavior and Knowledge Base of Top Con-tributorsSection 3.2 shows that the node indegree exhibitsa power-law distribution. The behavior of high-indegree users may greatly affect the attractiveness ofthe application as these users contribute significantlymore than average users. We like to study theseusers’ behaviors including answering frequency andpoint earning, which also indicate the effort neededto attract application users. We quantified the numberof answers submitted and points earned by the 4000top contributors that have the highest indegree fromAug. 17th to Oct. 19th, 2011. Table 3 and Table 4show the maximum, average and minimum numbersof the answers submitted and points earned by theseusers during each week during the time period. Wesee that the average number of submitted answers(around 40) and earned points (around 300) duringeach week remain nearly constant. Also, a few usersare very active in answering questions, the largestnumber of questions answered per week is over 1100.In addition, because the users that provide more bestanswers earn more points, the quality of the answersfrom some users is also very high. The maximumnumber of earned points in the week of maximum1524 submitted questions is 16742. The highest pointsearned by a user is 19975 in a week with 1405 maxi-mum submitted questions.
Given the KCs of users, we are very interestedin how knowledge and expertise are spread acrossdifferent domains. Figure 13 shows the CCDFs of the
general KCs and the detailed KCs of the top contrib-utors. We see that all of the top contributors have 2 ormore detailed KCs. Only 56.5% of the top contributorshave 2 or more general KCs. The result shows thatmany top contributors answer questions within onegeneral KC, in which they may participate in answer-ing questions in at least two detailed categories.
Fig. 14. Number of con-tacts vs. rank.
Fig. 15. Number of fansvs. rank.
4.5 Relationship Between Degree and RankFigure 14 and Figure 15 show the number of eachuser’s contacts and fans versus his rank based onthe number of points, respectively. Figure 14 showsthat in the contact network, there are no correlationsbetween the number of a user’s contacts and hispoints. This result implies that how active a user isin learning is not determined by how active he is inanswering questions. Also, most users have less than200 contacts, and some outliers have more than 200contacts. This is because YA constrains the numberof the contacts of each user within 200 since 2007.We found that the outliers’ account creation times areall in 2007, while all other users’ account creationtimes are after 2007. From Figure 15, we see a userwith higher rank is likely to have larger number offans. This is because active and knowledgable nodeshaving many points are more likely to attract fans.This is one of the most important reason for thepower-law distribution of user indegree.
(a) Detailed KCs (b) General KCs
Fig. 16. Correlation between detailed KCs and be-tween general KCs.
4.6 Relationship Between Knowledge CategoriesWe assigned a numerical ID to each detailed KCso that the detailed KCs in the same general KChave close numerical IDs. We use matrix A[x][y] torepresent the coexistence of two detailed KCs with IDx and ID y in one top contributor. Figure 16(a) showsthe relationship between detailed KCs represented bythe points of A[x][y]. We see that the detailed KCsare highly clustered. The KCs with IDs in [0,200],
0018-9340 (c) 2013 IEEE. Personal use is permitted, but republication/redistribution requires IEEE permission. Seehttp://www.ieee.org/publications_standards/publications/rights/index.html for more information.
This article has been accepted for publication in a future issue of this journal, but has not been fully edited. Content may change prior to final publication. Citation information: DOI10.1109/TC.2014.2322598, IEEE Transactions on Computers
9
TABLE 3The number of answers submitted by top contributors during each week.
Period Aug.17-Aug.22
Aug.23-Aug.30
Aug.31-Sep.08
Sep.09-Sep.14
Sep.15-Sep.21
Sep.22-Sep.29
Sep.30-Otc.06
Otc.07-Otc.13
Oct.13-Otc.19
Max 1367 1105 1306 1410 1500 1405 1235 1445 1524Ave. 28.4 43.7 52.0 41.25 40 36.9 38.7 49.2 51.2Min 0 0 0 0 0 0 0 0 0
TABLE 4The number of points earned by top contributors during each week.
Period Aug.17-Aug.22
Aug.23-Aug.30
Aug.31-Sep.08
Sep.09-Sep.14
Sep.15-Sep.21
Sep.22-Sep.29
Sep.30-Otc.06
Otc.07-Otc.13
Oct.13-Otc.19
Max 8449 15808 13875 14435 15401 19975 14532 15643 16742Ave. 302.8 302.1 301.3 274.1 300.0 322.4 321.2 314.4 309.7Min 0 0 0 0 0 0 0 0 0
Fig. 17. Coexistence of the interests in users.[600,700], [1000, 1200] are very likely to coexist witheach other. However, KCs with IDs in [200, 600],[700, 1000], [1200, 1500] are seldom interested by topcontributors because there KCs have extremely lowpopularity. Using the same way, we plot Figure 16(b)to show the relationship of the general KCs, whichare assigned with ID from 1 to 26. We see that the topcontributors are likely to have knowledge within thesame category. It is also very likely for other kinds ofcategory combinations to exist in a top contributor’sspecialized field.
We would like to see if a node has multiple KCinterests. We draw a graph G(V,E), where v ∈ Vrepresents a KC, and the edge e ∈ E between twovertices exits when there is at least one user who hasthese two interests. Figure 17 shows the connectedvertices in this graph. For simplicity, we did not showthe vertices without any edges. The total number ofvertices is 1681 and the number of connected verticesis 157, which constitutes 9%. Some interests havemore connections with other interests. The degreeof a vertex implies the maximum number of otherinterests that coexist with this interest on a certainuser. This graph means that most users have only oneKC interest and only a very small percent of the KCsco-exist in a user’s interests.
4.7 Summary(1) In YA, a small portion (10%) of the users (i.e., top
contributors) contribute to most of the high qualityanswers. There is a strong correlation between thebest answers and all answers for a user with corre-lation coefficient equals 0.712. At least 13.6% of theusers are very likely to be free-riders (Section 4.1).
(2) Users who answered more questions than askedquestions tend to receive more points. Users who
answered more questions tend to have more bestanswers and then receive more points (Section 4.2).
(3) In both contributor’s knowledge and generalknowledge, the top 12 KCs account for 80% of allknowledge. Meanwhile, there is a strong correlationbetween CK and GK with correlation coefficientequals 0.4988, which means the distribution of KCsin top contributors’ profiles can represent the distri-bution of KCs of questions of all users (Section 4.3).
(4) The top contributors consistently and selflessly con-tribute knowledge to the system. 56.5% of the topcontributors have multiple general KCs, and all ofthe top contributors have multiple detailed KCs(Section 4.4).
(5) There is no correlation between the number ofcontacts and the number of points of a user, butthere is a positive linear relationship between thenumber of fans and the number of points of a user(Section 4.5).
(6) The KCs of the users are highly clustered, andusers are likely to have knowledge within the samegeneral KC. Most users have a single KC interest.Different kinds of general category combinationsare still likely to exist in a top contributor’s spe-cialized field (Section 4.6).
5 ANALYSIS OF KNOWLEDGE BASE IN AUSER’S SOCIAL NETWORKUsers interested in the same KC tend to connect toeach other as contacts and fans to facilitate knowledgesharing. In this section, we are interested in answeringtwo questions: “how many different KCs exist withina certain hops of a user’s contact network and fannetwork?” and “how shared KCs affect the link es-tablishment between users?”
5.1 Relationship between Knowledge Base andSocial Network ScopeWe are interested in answering a question: “howmany KCs are there in a user’s contacts or fans?” Wedefine the size of the general (or detailed) knowledgebase of a user within x hops in his contact (or fan)network as the size of the union of all general (ordetailed) KCs of the contacts (or fans) within x hopsin his contact (or fan) network. Figure 18(a) shows the

0018-9340 (c) 2013 IEEE. Personal use is permitted, but republication/redistribution requires IEEE permission. Seehttp://www.ieee.org/publications_standards/publications/rights/index.html for more information.
This article has been accepted for publication in a future issue of this journal, but has not been fully edited. Content may change prior to final publication. Citation information: DOI10.1109/TC.2014.2322598, IEEE Transactions on Computers
10
CDF of the size of the general knowledge base of userswithin i (1 ≤ i ≤ 3) hops in their contact networks.We see that 80% of the users have a knowledge basewith size <2 within 1 hop, and have a knowledgebase with size <3 within 2 hops in their contactnetworks. The knowledge size distribution within 3hops is approximately the same as that within 2 hops.Figure 18(b) shows the CDF of the size of the generalknowledge base of users within i (1 ≤ i ≤ 3) hops intheir fan networks. The distribution of the knowledgebase in fan networks exhibits the same pattern as thatin contact networks. Although a few users can have aknowledge base with size up to 21, 80% of the usershave a knowledge size <3 within 1 hop, and havea knowledge size < 4 within 2 hops. Figures 19(a)and (b) show the CDF of the size of the detailedknowledge base of users within i (1 ≤ i ≤ 3) hops intheir contact networks and fan networks, respectively.The results exhibit the same pattern as in Figure 18.
The small knowledge base size is caused by thereason that users are clustered at KCs. As YA OSN isknowledge-oriented, users with the same knowledgeinterest are likely to connect to each other. Also, assome of the KCs are highly correlated as shown inFigure 16, some users tend to share multiple KCinterests. The knowledge base size for 3-hop scope isnot significantly increased for both general KCs anddetailed KCs. This is because the knowledge-orientedclusters are likely to be disconnected to each otherand the 3-hop neighbors are still likely to be withinthe same knowledge cluster.
(a) Contact network (b) Fan networkFig. 18. Number of general KCs in the neighbors.
(a) Contact network (b) Fan networkFig. 19. Number of detailed KCs in the neighbors.
5.2 HomophilyHomophily is a tendency that “a contact betweensimilar people occurs at a higher rate than amongdissimilar people” [23]. In this section, we examinethe pattern of homophily among users in the YAsystem by investigating the common KCs betweeneach top contributor with his one-way connected
(a) General KCs. (b) Detailed KCs.
Fig. 20. Common KC interests between users.
(a) Contact network (b) Fan network
Fig. 21. The relationship between average number ofcommon interests and social hop distance.
contacts and fans, reciprocally connected users, andusers without any relationship. Figure 20(a) shows theCDF of the number of common general KCs for userswith one-way relationship, reciprocal relationship andno relationship, respectively. We see that 80% of thereciprocity users share more than 2 common KCs; 80%of the one-way users share more than 1 and less than 2KCs; 80% of the users without relationships share lessthan 1 KC. Figure 20(b) shows the CDF of the numberof common detailed KCs for users with one-way rela-tionship, reciprocal relationship and no relationship,respectively. We can also see that the distribution ofdetailed KCs for different users is similar to that ofthe general KCs. That is, no matter for detailed KC orgeneral KC, reciprocity users share more interests thanusers with one-way relationship, which share moreinterests than users without relationships.
5.3 Relationship between Common Interests andSocial DistanceWe then study the correlation between the distancebetween a node and the nodes in its contact/fannetwork and the number of common interests of thisnode and the nodes in the network. We calculated theaverage number of common interests of a node withits m-hop (m=1, 2, 3, 4) neighbors in its contact/fannetwork, and then calculated the average number ofall nodes. Figure 21(a) shows the correlation betweenthe average number of common interests and thenumber of hops between users in the contact net-works. We find that the average number of commoninterests shared by users decreases as the numberof hops increases and vice versa. Figure 21(b) showsthe correlation between the average number of users’common interests and the number of hops betweenusers in fan networks. We also find that the aver-age number of common interests shared by users

0018-9340 (c) 2013 IEEE. Personal use is permitted, but republication/redistribution requires IEEE permission. Seehttp://www.ieee.org/publications_standards/publications/rights/index.html for more information.
This article has been accepted for publication in a future issue of this journal, but has not been fully edited. Content may change prior to final publication. Citation information: DOI10.1109/TC.2014.2322598, IEEE Transactions on Computers
11
decreases as the number of hops increases and viceversa. The results in Figure 21(a) and Figure 21(b) in-dicate that the shorter the social distance between twousers, the more common interests they tend to sharewith each other. This is reasonable and complies withthe realistic situation in which users prefer to connectto the users who share common interests with them.
5.4 Summary(1) Users in the social network of YA are clustered and
centered by KCs. Some of the KC clusters are likelyto be disjointed. (Section 5.1).
(2) Reciprocity users share more common KCs thanone-way users, who share more common KCs thanusers without relationships (Section 5.2).
(3) Users with shorter social distance in the fan net-work or contact network tend to share more com-mon KC interests (Section 5.3).
6 FURTHER DISCUSSIONSIn this section, we discuss some implications of ourfindings. While our findings are applicable to manydifferent purposes and applications, we concentrateon spammer detection and distributed Q&A systemdesign.
6.1 Implications to Spammer Detection in Q&ASystemsIn YA, every registered users can post answers.Spammers might post commercial spam to earnattentions for their products. An example of spamfrom YA is:Q: what is the capital of Mexico?A: for a free apple iphone go towww.thisisaspamsite.com.
Since the questions and answers in YA have atendency to rank well in Google and other searchengines, YA will be a new spamming ground [30].Currently, YA uses the abuse report policy to en-courage users to report spammers when they noticethem. However, spammers can try to circumvent thedetection. First, several users collude together or auser creates Sybil accounts to boost the reputationlevel (i.e., the number of points) of a spammer. Then,when a user sees a spam-like message from a high-reputed user, he may less likely to report it. Also, auser can post a question in an unpopular KC to reducethe probability of being noticed, but the question isstill searchable in search engines. Users can also hidespam in the ordinary answers for others’ questions.Our study on YA presents two implications in the
spammer detection algorithm design.Best answer percent. Summary 4.7 shows that there
is a linear relationship between the number of bestanswers and the number of all answers of a user withcorrelation coefficient equals 0.712. A spammer tendsto post many answers but few of which would beselected as best answers. Therefore, by monitoring theratio of the two numbers of a user, we can quicklyidentify the users with high ratios as suspicious spam-mers. Although the spammers can collude to rate their
own answers as best answers, as the best answers arehighlighted in the Q&A forum with high visibility tomany other users, the false best answers can be easilyidentified using the abuse report policy.
Trust transitivity-based reputation. Summary 3.6indicates that YA shows a very low level of linksymmetry. Also, nodes with high indegree do notnecessarily have high outdegree. i.e., user A connectsto B only when user A trusts B’s knowledge. Based onthis property, we can evaluate node reputation basedon the rationale that the users with many best answersshould have a high reputation value and the usersin the contact lists of high-reputed nodes should alsobe trustable and have high reputations. Similarly, inthe HITS [31] and PageRank [32] algorithms, a web-page that is linked to by many webpages with highPageRank receives a high rank itself. Leveraging thesealgorithms, we can calculate the reputation value ofusers in order to detect the spammers:
R(ui) =1− d
N+ d ·
∑
uj∈S(ui)
R(uj)
N(uj), (1)
where R(ui) denotes the reputation value of user ui,d is a weight parameter, S(ui) denotes the set of usersin ui’s fan network, and N(uj) denotes the outdegreeof user uj .
We use Pagerank to denote the above reputationcalculation method, and use Percentage to denote themethod that directly uses the percent of a user’sbest answers in all of his answers as his reputa-tion. We then ranked the user in the descendingorder of user reputation. Figure 22 shows the dis-tribution of scaled reputation ([0,1]) of the users in
Fig. 22. Reputation distri-bution of users.
Pagerank and Percentage.We see that Pagerankcan more accurately re-flect the reputations ofusers. Users with highbest question percent-age have high Pagerankreputation values, andusers with high Pagerankreputation values havehigh best question per-centage. However, Percentage results in approximatelythe same reputation values regardless of their dif-ferent best question percentages. Pagerank provides afiner granularity in reputation evaluation. The resultindicates the effectiveness of Pagerank in reflectingnode reputations.
6.2 Implications to Distributed Q&A Systems
Distributed Q&A systems [15]–[17], [33] identify thepossible answerers in a questioner’s social network ina centralized server and directly forward questions tothe possible answerers. Google spent 50 million dol-lars to buy the Aardvark distributed Q&A system [17]on February 11, 2010. However, Google announced itwould discontinue the Aardvark service in Septem-ber 2011. Though we do not know the reasons, ourfindings from YA can help enhance the performanceof distributed Q&A systems, including Aardvark.

0018-9340 (c) 2013 IEEE. Personal use is permitted, but republication/redistribution requires IEEE permission. Seehttp://www.ieee.org/publications_standards/publications/rights/index.html for more information.
This article has been accepted for publication in a future issue of this journal, but has not been fully edited. Content may change prior to final publication. Citation information: DOI10.1109/TC.2014.2322598, IEEE Transactions on Computers
12
Embrace load imbalance. In order to balancethe load between experts, the distributed Q&A sys-tems [15]–[17], [33] use load balancing algorithm toevenly distribute the traffic among different experts.However, the assumption that every expert is willingto answer questions does not hold true. Summary 4.7indicates that most users in the Q&A system are notactively in answering questions or are not be ableto provide satisfying answers, while a small numberof nodes (10%) are very willing to answer questionsand able to offer satisfying answers. Therefore, ratherthan aiming to achieve load balance, forwarding morequestions to those selfless answerers should be moreeffective in performance enhancement. Meanwhile,effective incentives such as reputation system or ser-vice pricing system are needed to encourage users toparticipate in question answering.
Bridge disjoint clusters. Summary 5.4 indicatesthat in the knowledge-oriented OSNs, some of thesocial network clusters centered on KCs are likelyto be disjointed. Therefore, a user may not receivethe answers for his questions in the distributed Q&Asystem because his connected users have a smallknowledge base and they cannot reach other partsof the social network. Therefore, we need to createbridges between social network clusters to preventthe isolation of some users’ social networks. The mostactive nodes in disjointed clusters can be bridges asthey are willing to contribute to the system. Incentivessuch as point rewards or free games can be providedto nodes to encourage them to become bridges.
Hierarchical searching. Summary 4.7 indicates thatusers tend to have knowledge within the same gen-eral KC, and have several detailed KCs. To facilitateanswerer search, users can be first indexed by theirspecialized general KC and then by detailed KC.To search for an answerer, we can first identify thegeneral knowledge cluster, and then use detailed KCto identify the experts.
Global index for unpopular topics. Summary 4.7shows that the number of KCs interested or special-ized by users conforms to the power-law distribution.If the Q&A activity is conducted in a distributedmanner in YA, since a user prefers to connect toexperts, it should be easy to find the experts to answerquestions in popular KCs, but may take a long time toidentify answerers in unpopular KCs. Therefore, wecan use a global index (e.g., distributed hash table) forfast expert identification in unpopular topics.
Figure 23 demonstrates an example of a Q&Asystem framework, incorporating the web YA sys-tem and OSN-based Q&A system with the aboveproposed strategies. In the framework, users invitetheir friends and knowledgable and active answerersto connect to. Such a hybrid friendship-knowledgeoriented framework can leverage the advantage of thefriendship-oriented OSNs that can provide trustableand personalized answers and knowledge-orientedOSNs that guarantee a small delay for answerer iden-tification for both factual and non-factual questions.Bridges are added to isolated users’ social networks
Distributed Hash TableUsers
Social links
BridgeInterest links
Experts withunpopular knowledge
Fig. 23. A example of a friendship-knowledge Q&Aframework design.
to form a connected network. Thus, questions canbe uninterruptedly forwarded along the connectedfriends to find answerers in a distributed manner.During the forwarding process, the probability thata user is identified as answerer should be determinedby the user’s both willingness and ability to answerthe question based on his historical answering activityin the KC of the question. In addition, the expertsin unpopular topics form a DHT structure for easyidentification. To build this structure, the server selectsthe experts and notifies them to join in the DHT. Thejoining process is the same as in DHT networks. It alsoselects the most active nodes in disconnected socialclusters as bridges and notifies them to connect witheach other.
7 RELATED WORK
Online social networks. The rising popularity ofOSN services has spurred a larger amount of researchon OSNs. Most researches studied network structureand growth patterns. Backstrom et al. [34] investi-gated the evolution of network structure and groupmembership in MySpace and LiveJournal and showedthat homophily can be used to improve predictivemodels of group membership. Zhu [26] measuredand analyzed an online content voting network, Digg.He studied the structural properties of Digg OSNand the impact of OSN on user digging activities,and investigated the issues of content promotion andcontent filtering. Kwak et al. [27] studied the OSNstructures in Twitter. Viswanath et al. [35] studied thenetwork structure of Facebook, with an emphasis onthe evolution of activity between users. Mislove etal. [23] analyzed the structures of multiple OSNs:Flickr, YouTube, LiveJournal and Orkut, and foundthey share some similar features. For example, theindegree of user nodes tends to match the outdegree,networks contain a densely connected core of high-degree nodes. Our work is the first that studied theproperties of the pure knowledge-oriented YA OSN.Our study in YA reveals strikingly different propertiessuch as lower degree of link symmetry and weakercorrelation between indegree and outdegree.
Yahoo! Answers (YA). A number of researches havebeen conducted on YA in other aspects. Adamic etal. [36] studied the content characteristics of the an-swers, based on which, they tried to predict whethera particular answer will be chosen as the best answer.Su et al. [37] studied the quality of human revieweddata on the Internet using the answer ratings inYA. By using content analysis and human coding,Kim et al. [38] studied the selection criteria for best

0018-9340 (c) 2013 IEEE. Personal use is permitted, but republication/redistribution requires IEEE permission. Seehttp://www.ieee.org/publications_standards/publications/rights/index.html for more information.
This article has been accepted for publication in a future issue of this journal, but has not been fully edited. Content may change prior to final publication. Citation information: DOI10.1109/TC.2014.2322598, IEEE Transactions on Computers
13
answers in YA. Cao et al. [39] proposed a category-based framework for search in YA. The frameworkuses language models to exploit categories of ques-tions for improving answer search. Gyongyi et al. [40]performed an analysis on the YA data focusing onthe user base, and studied several aspects of userbehavior, such as activity levels, roles, interests, con-nectedness and reputation. Liu et al. [41] presented ageneral prediction model with a variety of content,structure, and community-focused features to predictwhether a question author will be satisfied with theanswers submitted by the community participants. Asfar as we know, our work is the first to study thestructure, user behavior, and user knowledge in theYA OSN from the perspective of knowledge sharingoriented OSN.
Knowledge sharing. Knowledge sharing has beenstudied for a long time. Initially, it was largely studiedwithin organizational settings (e.g., Davenport [42]).The Internet gave rise to OSNs that aim at facil-itating collaboration between people by providingan environment for mutual sharing and interaction(e.g., Wikipedia). Expert location systems [18]–[21]have been proposed to facilitate users to identify theexperts of interests. Numerous online Q&A systemsalso have emerged in the Internet [9], [10], in whichthe anonymous users post and respond to others’questions. However, the latency in receiving a sat-isfying answer to a question is high. Some worksfocus on finding similar questions in the archivefor a given question to retrieve historical high qual-ity answers in Q&A systems [43]–[45]. Some worksstudied Q&A behaviors in OSNs. Morris and Tee-van [13], [14] studied how people use status messagesin an OSN to ask questions. Similar to the statusmessage, Hsieh et al. [11] proposed a market-basedQ&A service called MiMir, in which all questionsare broadcasted to all users in the system. However,by using status messages, only direct friends of auser can see the questions. Also, the broadcastinggenerates high overhead. White and Richardson [15],[16] developed a synchronous Q&A system called IM-an-Expert, which automatically identifies experts viainformation retrieval techniques and facilitates real-time dialog via instant messaging without broad-casting. However, IM-an-Expert focuses on the di-rect friends of a user. Meanwhile, the synchronouscommunication may face challenges with interruptioncosts and the availability of knowledge at the questiontime. Aardvark [17] tries to automatically route thequestion from a user to the most appropriate personin the Aardvark community. Yang et al. [33] pro-posed a social network-based system for supportinginteractive collaboration in knowledge sharing over apeer-to-peer network. They found that applying socialnetwork-based collaboration support to knowledgesharing helps people find relevant content and knowl-edgable collaborators who are willing to share theirknowledge with. Adamic et al. [36] analyzed the YAcategories and sought to understand YA’s knowledgesharing activity. They clustered categories according
to content characteristics and patterns of interactionamong the users. They found that some users focusnarrowly on specific topics, while others participateacross categories. This work focuses on analyzing YA’sknowledge sharing activity from the perspective ofYA categories, while our work is from the perspectiveof YA OSN.
8 CONCLUSIONSRegarding YA as a knowledge-oriented OSN, wehave investigated the collective intelligence in theYA OSN in terms of OSN structure, user behaviorand knowledge, and the knowledge base in a user’ssocial network. Our study shows that the YA OSNhas some very distinct features compared to othermajor OSNs. It has low level link symmetry, exhibitsweak correlation between indegree and outdegree,and nodes tend to connect to nodes with differentdegree from their own. By studying the knowledgebase and behaviors of users, we find that 10% of theusers contribute to 80% of the best answers and 70%of the all answers. The first 12 most popular KCsinclude 80% of the questions among all questions. Thetop contributors consistently and selflessly contributeknowledge to the system. The KCs of the users arehighly clustered since users are likely to have knowl-edge within the same general KC. By studying theknowledge base in a user’s social network, we findthat the knowledge base of a user’s social networkis small because common-interest users are likely tobe clustered. Also, a strong pattern of homophilyis observed. We have outlined how these observedproperties can be leveraged for spammer detectionand distributed Q&A system design. In the future,we will further extract the knowledge base of thenon-top contributors by data mining their questionand answer traces and investigate the relationshipbetween their knowledge base and behaviors.ACKNOWLEDGEMENTSThis research was supported in part by U.S. NSFgrants CNS-1254006, CNS-1249603, CNS-1049947,CNS-1156875, CNS-0917056 and CNS-1057530, CNS-1025652, CNS-0938189, CSR-2008826, CSR-2008827,Microsoft Research Faculty Fellowship 8300751. Anearly version of this work was presented in the Proc.of CIKM’12 [46]. The authors would like to thank Mr.Guangyan Wang for his valuable help.
REFERENCES[1] B. M. Evans and E. H. Chi. An elaborated model of social
search. IPM, 46(6):656–678, 2010.[2] L. Terveen, W. Hill, B. Amento, D. McDonald, and J. Creter.
Phoaks: A system for sharing recommendations. Comm. of theACM, 40(3):59–62, 1997.
[3] M.S. Ackerman. Augmenting organizational memory: a fieldstudy of answer garden. ACM TOIS, 1998.
[4] L. G. Terveen, P. G. Selfridge, and M. D. Long. Livingdesign memory: Framework, implementation, lessons learned.Human-Computer Interaction, 10(1):1–37, 1995.
[5] E. Amitay, D. Carmel, N. Har’El, Ofek-Koifman, and et al.Social search and discovery using a unified approach. In Proc.of HT, pages 199–208, Torino, 2009.
[6] D. Carmel, N. Zwerdling, I. Guy, S. Ofek-Koifman, and et al.Personalized social search based on the user’s social network.In Proc. of CIKM, pages 1227–1236, Hong Kong, 2009.

0018-9340 (c) 2013 IEEE. Personal use is permitted, but republication/redistribution requires IEEE permission. Seehttp://www.ieee.org/publications_standards/publications/rights/index.html for more information.
This article has been accepted for publication in a future issue of this journal, but has not been fully edited. Content may change prior to final publication. Citation information: DOI10.1109/TC.2014.2322598, IEEE Transactions on Computers
14
[7] S. Kolay and A. Dasdan. The value of socially tagged urls fora search engine. In Proc. of WWW, pages 1203–1204, Madrid,2009.
[8] S. Bao, G. Xue, X. Wu, Y. Yu, B. Fei, and Z. Su. Optimizingweb search using social annotations. In Proc. of WWW, pages501–510, Banff, 2007.
[9] http://answers.yahoo.com.[10] Ask. http://www.ask.com.[11] F. M. Harper, D. Raban, S. Rafaeli, and J. A. Konstan. Predic-
tors of answer quality in online q&a sites. In Proc. of SIGCHI,pages 865–874, Florence, 2008.
[12] G. Hsieh and S. Counts. mimir: A market-based real-timequestion and answer service. In Proc. of SIGCHI, pages 769–778, Boston, 2009.
[13] M. R. Morris, J. Teevan, and K. Panovich. What do peopleask their social networks, and why?: a survey study of statusmessage Q&A behavior. In Proc. of CHI, pages 1739–1748,Atlanta, 2010.
[14] J. Teevan, M. R. Morris, and K. Panovich. Factors affectingresponse quantity, quality, and speed for questions asked viasocial network status messages. In Proc. of AAAI, pages 630–633, Barcelona, 2011.
[15] R. W. White, M. Richardson, and Y. Liu. Effects of communitysize and contact rate in synchronous social Q&A. In Proc. ofSIGCHI, pages 2837–2846, Vancouver, 2011.
[16] M. Richardson and R. W. White. Supporting synchronoussocial q&a throughout the question lifecycle. In Proc. of WWW,pages 755–764, Hyderabad, 2011.
[17] D. Horowitz and S. D. Kamvar. The anatomy of a large-scalesocial search engine. In Proc. of WWW, pages 431–440, Raleigh,2010.
[18] H. H. Chen, L. Gou, X. Zhang, and C. L. Giles. Collabseer:A search engine for collaboration discovery. In Proc. of JCDL,pages 231–240, Ottawa, 2011.
[19] C. Y. Lin, N. Cao, S. X. Liu, S. Papadimitriou, J. Sun, andX. Yan. Smallblue: Social network analysis for expertise searchand collective intelligence. In Proc. of ICDE, pages 1483–1486,Shanghai, 2009.
[20] H. Kautz, B. Selman, and M. Shah. Referral web: combiningsocial networks and collaborative filtering. Communications ofthe ACM, 40(3):63–65, 1997.
[21] D. W. McDonald and M. S. Ackerman. Expertise recom-mender: a flexible recommendation system and architecture.In Proc. of CSCW, pages 231–240, Philadelphia, 2000.
[22] R. Kumar, J. Novak, and et al. Structure and evolutionof online social networks. In Proc. of KDD, pages 611–617,Philadelphia, 2006.
[23] A. Mislove, M. Marcon, K. P. Gummadi, P. Druschel, andB. Bhattacharjee. Measurement and analysis of online socialnetworks. In Proc. of IMC, pages 29–42, San Diego, 2007.
[24] Facebook. http://www.facebook.com.[25] A. Mislove M. Cha and K. P. Gummadi. A measurement-
driven analysis of information propagation in the flickr socialnetwork. In Proc. of WWW, pages 721–730, Madrid, 2010.
[26] Y. Zhu. Measurement and analysis of an online content votingnetwork: a case study of Digg. In Proc. of WWW, pages 1039–1048, Raleigh, 2010.
[27] H. Kwak, C. Lee, H. Park, and S. Moon. What is twitter, asocial network or a news media? In Proc. of WWW, pages591–600, Raleigh, 2010.
[28] M. E. J. Newman. Power laws, pareto distributions and zipf’slaw. Contemporary Physics, 46:323–351, 2005.
[29] Power-law Distributions in Empirical Data.http://tuvalu.santafe.edu/ aaronc/powerlaws/.
[30] Yahoo!Answers, The new spamming ground.http://www.seroundtable.com/archives/014730.html.
[31] J. M. Kleinberg. Authoritative sources in a hyperlinked envi-ronment. Journal of ACM, 46(5):604–632, 1999.
[32] L. Page, S. Brin, R. Motwani, and T. Winograd. The pagerankcitation ranking: bringing order to the web. Technical report,Stanford Digital Library Technologies Project, 1998.
[33] S. J. H. Yang and I. Y. L. Chen. A social network-based systemfor supporting interactive collaboration in knowledge sharingover peer-to-peer network. IJHCS, 66(1):36–50, 2008.
[34] L. Backstrom, D. Huttenlocher, and et al. Group formation inlarge social networks: membership, growth, and evolution. InProc. of SIGKDD, pages 44–54, Philadelphia, 2006.
[35] B. Viswanath, A. Mislove, M. Cha, and K. P. Gummadi. On theevolution of user interaction in facebook. In Proc. of WOSN,pages 37–42, Barcelona, 2009.
[36] L. A. Adamic, J. Zhang, E. Bakshy, and M. S. Ackerman.Knowledge sharing and yahoo answers: everyone knowssomething. In Proc. of WWW, pages 665–674, Beijing, 2008.
[37] Q. Su, D. Pavlov, J. Chow, and W. Baker. Internet-scalecollection of human-reviewed data. In Proc. of WWW, pages231–240, Banff, 2007.
[38] S. Kim, J. S. Oh, and S. Oh. Best-answer selection criteria in asocial q&a site from the user-oriented relevance perspective.In Proc. of ASIST’07, 2007.
[39] X. Cao, G. Cong, B. Cui, C. S. Jensen, and C. Zhang. The useof categorization information in language models for questionretrieval. In Proc. of CIKM, pages 265–274, Hong Kong, 2009.
[40] Zoltan Gyongyi, Georgia Koutrika, Jan Pedersen, and HectorGarcia-Molina. Questioning yahoo! answers. In Proc. of WWWWorkshop on Question Answering on the Web, Beijing, 2008.
[41] Y. Liu, J. Bian, and E. Agichtein. Predicting information seekersatisfaction in community question answering. In Proc. ofSIGIR, pages 483–490, Singapore, 2008.
[42] T. Davenport and L. Prusak. Working knowledge: how or-ganizations manage what they know. Harvard Business SchoolPress, 1998.
[43] A. Shtok, G. Dror, Y. Maarek, and I. Szpektor. Learning fromthe past: Answering new questions with past answers. In Proc.of WWW, number 759-768, Lyon, 2012.
[44] F. Riahi, Z. Zolaktaf, and M. Shafiei. Finding expert users incommunity question answering. In Proc. of WWW, pages 791–798, Lyon, 2012.
[45] Y. Liu, J. Bian, and E. Agichtein. Predicting information seekersatisfaction in community question answering. In Proc. ofSIGIR, pages 483–490, Singapore, 2008.
[46] Z. Li, H. Shen, and J. Grant. Collective intelligence in theonline social network of yahoo!answers and its implications.In Proc. of CIKM, pages 455–464, Maui, 2012.
Haiying Shen received the BS degree inComputer Science and Engineering fromTongji University, China in 2000, and the MSand Ph.D. degrees in Computer Engineeringfrom Wayne State University in 2004 and2006, respectively. She is currently an Asso-ciate Professor in the Department of Elec-trical and Computer Engineering at Clem-son University. Her research interests includedistributed computer systems and computernetworks, with an emphasis on P2P and con-
tent delivery networks, mobile computing, wireless sensor networks,and cloud computing. She is a Microsoft Faculty Fellow of 2010, asenior member of the IEEE and a member of the ACM.
Ze Li received the BS degree in Electronicsand Information Engineering from HuazhongUniversity of Science and Technology, Chinain 2007, and the Ph.D. degree in ComputerEngineering from Clemson University. His re-search interests include distributed networks,with an emphasis on peer-to-peer and con-tent delivery networks. He is currently a datascientist in the MicroStrategy Incorporation.
Jinwei Liu received the BS degree in Com-puter Science from Guangxi University ofScience and Technology, China in 2009, andthe MS degree in Computer Science fromClemson University in 2012. He is currentlya Ph.D. student in Department of Electricaland Computer Engineering of Clemson Uni-versity. His research interests include wire-less sensor networks, data mining and socialnetwork.
Joseph Edward Grant received the BS de-gree in Computer Science from ClemsonUniversity in 2012. He currently is a MSstudent in the the School of Computing atClemson University. His research interestsinclude question/answer systems.