Knowledge Management & E-Learningl3d.cs.colorado.edu/~ctg/pubs/MoS14.pdf · Antranig Basman...
17
Knowledge Management & E-Learning, Vol.6, No.2. Jun 2014 Knowledge Management & E-Learning ISSN 2073-7904 Math on a sphere: Making use of public displays in mathematics and programming education Michael Eisenberg University of Colorado, Boulder, CO, USA Antranig Basman University of Colorado, Boulder, CO, USA Sherry Hsi Lawrence Hall of Science University of California, Berkeley, CA, USA Recommended citation: Eisenberg, M., Basman, A., & Hsi, S. (2014). Math on a sphere: Making use of public displays in mathematics and programming education. Knowledge Management & E-Learning, 6(2), 140–155.
-
Upload
nguyencong -
Category
Documents
-
view
213 -
download
0
Transcript of Knowledge Management & E-Learningl3d.cs.colorado.edu/~ctg/pubs/MoS14.pdf · Antranig Basman...

Knowledge Management & E-Learning, Vol.6, No.2. Jun 2014
Knowledge Management & E-Learning
ISSN 2073-7904
Math on a sphere: Making use of public displays in
mathematics and programming education
Michael Eisenberg University of Colorado, Boulder, CO, USA
Antranig Basman University of Colorado, Boulder, CO, USA
Sherry Hsi Lawrence Hall of Science
University of California, Berkeley, CA, USA Recommended citation: Eisenberg, M., Basman, A., & Hsi, S. (2014). Math on a sphere: Making use of public displays in mathematics and programming education. Knowledge Management & E-Learning, 6(2), 140–155.

Knowledge Management & E-Learning, 6(2), 140–155
Math on a sphere: Making use of public displays in
mathematics and programming education
Michael Eisenberg*
Department of Computer Science
University of Colorado, Boulder, CO, USA
E-mail: [email protected]
Antranig Basman
Department of Computer Science
University of Colorado, Boulder, CO, USA
E-mail: [email protected]
Sherry Hsi
Lawrence Hall of Science
University of California, Berkeley, CA, USA
E-mail: [email protected]
*Corresponding author
Abstract: Science on a Sphere (SoS) is a compelling educational display installed at numerous museums and planetariums around the world; essentially the SoS display is a large spherical surface on which multicolor high-resolution depictions of (e.g.) planetary weather maps may be depicted. Fascinating as the SoS display is, however, it is in practice restricted to the use of museum professionals; students (and for that matter, older museum visitors) are unable to create their own displays for the surface. This paper describes a working software system, Math on a Sphere (MoS), that democratizes the SoS display by providing a simple programming interface to the public, over the World Wide Web. Briefly, our system allows anyone to write programs for spherical graphics patterns, and then to upload those programs at a planetarium or museum site and see the result on the giant sphere. This paper describes the implementation of the MoS system; sketches a sample project; and concludes with a more wide-ranging discussion of our user testing to date, as well as strategies for empowering children and students with greater control of public displays.
Keywords: Math on a sphere; Spherical geometry; Mathematics and programming education
Biographical notes: Michael Eisenberg is a Professor in the Department of Computer Science and Institute of Cognitive Science at the University of Colorado, Boulder. His research interests focus on the integration of children's crafts and construction activities with novel technologies.
Antranig Basman received his Ph.D. in Information Engineering from the University of Cambridge in 2000. For the last 5 years he has been a Visiting Scholar at the University of Colorado, Boulder, working with Professor

Knowledge Management & E-Learning, 6(2), 140–155 141
Clayton Lewis on accessibility for the Web. His interests include machine learning, declarative programming, and doing things correctly.
Dr. Sherry Hsi is the Research Director for the Center for Technology Innovation at the University of California's Lawrence Hall of Science. Working at the intersection of learning, design, and technology, her research focuses on how to effectively design social contexts for science learning, facilitation, and deeper reflection mediated by new media, online environments, and networked technologies.
1. Introduction
When educational technologists refer to "display devices", there is usually a tacit assumption that they are talking about flat screens–perhaps on a desktop or laptop computer, or mobile phone. Not all educational displays, however, fit this description. This paper focuses on one such unorthodox example–a particularly remarkable one called Science on a Sphere (SoS), created by the United States National Oceanic and Atmospheric Administration (NOAA), and installed in over 80 museum and planetarium settings around the world. (NOAA, 2013) The SoS display, shown in Fig. 1, is a large (1.73m diameter) solid-white spherical surface accompanied by four synchronized projectors; these four projectors are directed at the surface from distinct surrounding positions to produce a seamless, continuous "spherical picture". Typically, the SoS system is used to display (e.g.) planetary weather maps, animations of continental drift, the surface of the Moon, and other "spherical" graphics.
Fig. 1. SoS display surface at the Fiske Planetarium in Boulder, Colorado
The graphics projected on the SoS surface are multi-color, high-resolution, and smoothly animated–in short, stunning. Still, the surface is "closed to the public" in the sense that while museum audiences can watch and enjoy graphics on the sphere, they have no accessible medium with which to create their own patterns for display on the sphere. One might therefore think of the SoS system as a "broadcast" medium, with professionals providing canned content for audiences to enjoy. In the case of the SoS display, this inaccessibility to public creativity is particularly regrettable, since

142 M. Eisenberg et al. (2014)
youngsters could gain a provocative introduction to non-Euclidean geometry through interactive programming on a spherical surface. By producing their own patterns on the SoS surface, children (and interested adults as well) could encounter notions such as geodesics, intrinsic curvature, and spherical coordinates in the course of compelling, personalized projects.
This paper describes a working and publically available system, called Math on a Sphere (MoS), that allows users to create graphical patterns that may later be displayed on an actual SoS surface in a planetarium. By writing short programs in a relatively simple language (based loosely on the syntax of the early Logo language), people can create beautiful graphical patterns on their own personal computer screen; these patterns, such as the design shown in Fig. 1, may then be retrieved and displayed on the giant public surface in a planetarium or museum. Currently, our project is conducted with the collaboration of the Fiske Planetarium in Boulder, Colorado; the NOAA offices in Boulder; and the Lawrence Hall of Science in Berkeley, California. Eventually we hope to solicit the cooperation of many more institutions so that larger numbers of planetarium visitors can be given at least temporary control of these remarkable spherical public display surfaces.
The remainder of this paper is structured as follows: the following section will provide a structural overview of our software system and an explanation of how it can be used to communicate with an installed SoS system. The third section begins with a brief description of the MoS language in its current, still evolving, implementation. The section then sketches a scenario for creating a spherical design; in the course of this scenario we will touch upon some of the interesting aspects of spherical (as opposed to planar) geometry that are highlighted by designing graphics for a sphere. The third section concludes with a summary of our experiences with users. The fourth section focuses on several more recent steps in our development of the MoS system, discussing ongoing work in extending the spherical language to accommodate more advanced programming projects. The final section mentions key related work, and in effect is a more wide-ranging discussion of one of the key motivating ideas behind this project: namely, that large-scale, unusual, and (often) public displays can be made accessible to children for education and play. It should be noted that, we have previously discussed the MoS system in (Eisenberg, 2012; Hsi & Eisenberg, 2012); those papers focused on spherical geometry and an evaluation of our first student workshop. This article is an extension of (Eisenberg, Basman, & Hsi, 2013); in that paper (and this article) we provide a full explanation of the system architecture. This article also extends the earlier work in providing an introduction to more advanced spherical geometry projects, and in elaborating on our earlier discussion of central educational issues raised by the MoS system.
2. The MoS system
It is probably most straightforward to describe the MoS system starting with what the user sees: namely, the MoS Web interface, freely available through the site www.mathsphere.org. A screenshot of the Web interface in the midst of an ongoing programming project can be seen in Fig. 2. The major components of the interface are the three windows seen in the figure: at upper left, an editor allows the user to compose programs and define new procedures for creating graphical designs; at bottom left, a command interpreter allows the user to type in lines directly (e.g., procedure calls that draw patterns on the sphere); and at right, an interactive sphere view window allows the user to see a graphical rendering of the sphere display itself. The sphere in this window,

Knowledge Management & E-Learning, 6(2), 140–155 143
parenthetically, may be "grabbed" and rotated by mouse button presses and movements, so that the user can view all portions of the surface.
We will briefly discuss the end-user graphics language (the one shown in the editor window) in the following section. For the present, one additional element of Fig. 2 is worth noting here: the button labeled "Connect" toward the bottom of the figure. When the MoS website is loaded onto a suitably prepared machine at a local planetarium, this button can be used to activate a connection between the MoS Web client and the giant spherical display at the museum. (As noted, the project currently has the cooperation of three participating sites equipped with the SoS display; and as the MoS system progresses to completion we plan to solicit collaboration from many more sites.)
The Web interface of Fig. 2, and the original SoS system (running the sphere in the planetarium) constitute the two major "end portions" of the system: the first, written in HTML5 and JavaScript, is our own creation, while the second is the creation of NOAA. Sitting between these two end portions is the final element of the Math on a Sphere system: the local server. This element (our own creation, like the Web interface) sits between the Web client and the planetarium sphere, and communicates programs to the sphere. In order to do its job, the local server must be installed "on site", on the same device as the planetarium's SoS system itself.
Fig. 2. The Web interface to the MoS system (see description of the windows in the text)
In effect, the job of the local server is to act as the "glue" between the end-user programs written in the language interface of Fig. 2, and the SoS system that displays the results of the program commands on the sphere. The local server sends to the SoS a "movie" of constant frame-rate composed of a number of individual frames in a standard image format (JPG, PNG, etc.). Each frame of this movie consists of a view of the sphere

144 M. Eisenberg et al. (2014)
rendered into a 2:1 aspect rectangular flat image in the ECE (Equatorial Cylindrical Equidistant) projection (SoS, 2013). With the current implementation based on initial Canvas rendering, we use images of dimensions 1024x512 pixels, which (while not optimal) is visually adequate for the SoS system.
The strategy used by the local server to send this "movie" is to maintain a circular buffer of images (100-200 has proved a reasonable choice) as concrete files in a certain directory on the server machine. The SOS system treats these files as an animated movie to play even though their contents are being constantly rewritten dynamically (in circular order - the "local server" keeps in step with the SOS system and rewrites the image files on disk as they arrive from the client).
The overall architecture of the MoS system is summarized in Fig. 3, which sketches (at right) the Web client, (at left) the pre-existing SoS system and (toward the center) the local server and its functions.
Fig. 3. An architectural sketch of the MoS system (see text for details)
3. Creating a spherical design using MoS
In this section, we illustrate the use of the MoS system through a scenario in which a user creates an icosahedral pattern in the language interface, and then projects that pattern onto the planetarium sphere. In the course of working through this scenario, we will touch upon some of the interesting ways in which spherical geometry differs from the planar variety. Since earlier papers have discussed spherical programming at greater length, this section will be kept brief; the intention here is merely to provide sufficient background to motivate the discussion of the following section. Later in this paper we will explore several more advanced ideas in spherical programming, beyond the scope of this introductory section.
Knowledge Management & E-Learning, 6(2), 140–155 145
Fig. 4. At left (4a) an icosahedral design created by the MoS language system; at right (4b), a planar tiling of equilateral triangles
3.1. Turtle commands on the sphere
The central elements of our language system are based on the "turtle commands" of the Logo language, in which a programmable pen (the "turtle") can be steered about a computer screen through commands such as forward and right. An excellent introduction to the mathematics of turtle geometry can be found in the classic text by Abelson and diSessa (1980), while Papert (1980) gives an eloquent philosophical introduction to the Logo language design. For our purposes, we can imagine a scenario with a student who wishes to create an icosahedral pattern on her local planetarium sphere, as shown at left in Fig. 4. (Specifically, the design in Fig. 4a is the projection on the sphere of an inscribed regular icosahedron.) The student is going to create this design using forward and right commands, just like she would using standard Logo commands on the plane; except in the case of the MoS system, a forward command moves the turtle along a great circle path on the sphere (rather than in a straight planar line). The scale of a forward movement is chosen so that a command of forward 360 would move the turtle, from any starting position, in a complete great circle around the surface of the sphere, thus leaving it in the same spot as it originated.
The Fig. 4a design consists of twenty equilateral spherical triangles, arranged about the spherical surface. One immediate point to note, however, is that on a sphere–unlike the plane–triangles do not have interior angles that sum to 180 degrees. In particular, for the spherical triangles in Fig. 4a, the reader might note that there are five (not six) congruent equilateral triangles arranged around each vertex of the design; thus, each interior angle of each triangle is 72 degrees, and each of the equilateral triangles in the figure has interior angles that total 3*72 = 216 degrees. (If one were to draw a tiling pattern of equilateral triangles on the plane, in contrast, each triangle would have interior angles that sum to 180 degrees as shown in Fig. 4b; each interior angle would thus measure 60 degrees; and each planar vertex would be surrounded by six triangles rather than five as in the figure. For more description of the surprising differences between spherical and planar geometry, see the aforementioned text (Abelson & diSessa, 1980) and the discussions in (Eisenberg, 2010, 2012).).
The upshot of these considerations is simply that we need to create an equilateral triangle on the sphere with interior angles of 72 degrees (and exterior angles of 108

146 M. Eisenberg et al. (2014)
degrees). Space considerations preclude a fuller discussion (and again, these issues are discussed in earlier papers), but as it happens the expression for creating an "icosahedral spherical triangle" (as seen in Fig. 5a, at left) is:
repeat 3 {forward 63.5 right 108}
The student can now extend her design by creating five icosahedral triangles arranged around a single point:
repeat 5 {repeat 3 {forward 63.5 right 108} right 72}
This will produce the set of five triangles shown in Fig. 5b, second from left.
Fig. 5. Creating the icosahedral display. 5a (left): a single spherical triangle. 5b: five triangles surrounding a point. 5c: creating still more triangles. 5d (right): the entire
icosahedron displayed in Fig. 4
Now, the student could, if she wished, create the full icosahedral pattern by carefully moving the turtle along already-created lines and repeating the command that generated Fig. 5b. Continuing with this strategy (albeit carefully) could in fact produce the pattern in Fig. 5c and, eventually, the entire icosahedral pattern shown in Fig. 5d. Finally, the last step of the scenario is for the student to produce the pattern from 5d on her local planetarium display; by visiting the planetarium (which by assumption is a cooperating institution that has installed the local server to send images to its own SoS system), the student can now produce the image shown in Fig. 4 earlier.
3.2. Creating a more elaborate design
Having created a "standard" icosahedral design on the sphere, it is now straightforward to use the features of the MoS language to extend or elaborate that pattern. Fig. 6a and 6b illustrate this notion: by adding additional lines to the basic triangles of the previous example, one can create a more decorative icosahedral design, and display that design on the NOAA sphere (as in Fig. 6c). This example represents, of course, a tiny initial fraction of the types of explorations that can be conducted with the MoS system. The purpose of this scenario has been merely to suggest the sorts of projects that one can realistically undertake. The larger point–to which we return in the final section of this paper–is that we have now made a gorgeous spherical public display available for experimental use by anyone–children included–with access to a Web browser (and a cooperating local institution).

Knowledge Management & E-Learning, 6(2), 140–155 147
Fig. 6. Elaborating the basic icosahedral design on the screen (6a, at left; 6b, center), and on the planetarium sphere (6c, at right)
Fig. 7. Student-created designs (by children ranging from 10 to 12 years old) at the Lawrence Hall, Berkeley
3.3. Current state of the MoS system
The current MoS system is publically available through the website www.mathsphere.org. This version (see also (Eisenberg, 2012)) represents a substantially improved and extended successor to an early prototype system (described in (Eisenberg, 2010)). In particular, all of the elements shown in Fig. 2–the language editor, interactive sphere view, and command interpreter–are new to this version, and the local server has been
148 M. Eisenberg et al. (2014)
substantially redesigned. Currently, it should be noted that our MoS system is still a "work-in-progress", with many elements still under construction for future public releases. (There are also, not unexpectedly, occasional bugs in the current version still to be tracked and corrected.) The following section of this paper explores some further extensions that we are currently developing for a future iteration of the MoS system, suited to more advanced topics in spherical programming.
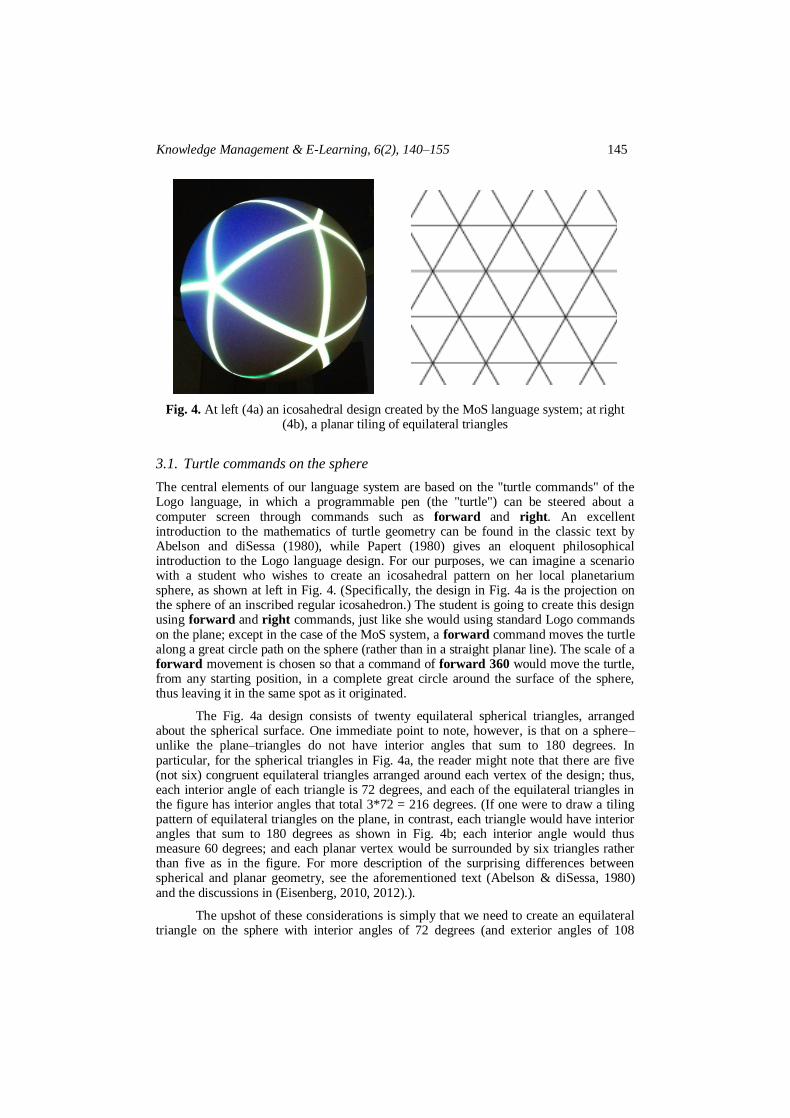
Our initial pilot tests of the current system were conducted in spring 2012 at the Lawrence Hall of Science in Berkeley, California (Fig. 7). Two separate workshops were held for elementary- and middle-school-aged children in the San Francisco area, focusing on both spherical geometry and programming with the MoS system (see also (Hsi & Eisenberg, 2012)). In 2013, additional pilot tests were conducted with eight middle school students in Boulder; the students had 3 one-hour-long lessons in using the system (spaced over three consecutive weeks), and then created designs that were displayed for them and their parents at the NOAA labs (Fig. 8); another, similar round of pilot tests will be conducted this spring as a result of the enthusiastic response to the 2013 classroom tests. Our experience to date indicates that students are indeed able to make use of the MoS system for creating and displaying attractive (if mathematically simple) spherical programs. Our next steps will be to work toward longer-term interactions with students and to use MoS to introduce somewhat more advanced concepts in spherical geometry (conceivably for high school or even undergraduate-level students), as suggested by the discussion in Section 4 below.
Fig. 8. Student-created designs created by Boulder middle school students, and displayed at NOAA Labs in Boulder
Knowledge Management & E-Learning, 6(2), 140–155 149
4. Ongoing work: Beyond "Elementary" mathematics and programming
There are two respects in which we are currently extending the basic MoS system described thus far in this paper. First, the programming projects shown in Fig. 7 and 8 were suited to younger students, and as a result they display only relatively introductory concepts in spherical geometry; in particular, these younger students have generally not encountered planar geometry at the high school level, and are thus less attuned to the interesting and profound differences between standard Euclidean geometry and the spherical variety. We are currently working on documentary materials for embarking on somewhat more advanced projects, then, geared toward high school and undergraduate students who are better able to appreciate the novel (and sometimes startling) ideas of spherical geometry. Second, we are working on extending the programming language itself so that it is capable of realizing more advanced and interesting graphical ideas than those achievable by the current "basic" system. The two subsections that follow explore these developments in somewhat greater depth.
4.1. A more advanced example of spherical geometry: The spherical law of sines
Just to illustrate the manner in which the MoS system could be used for high school or undergraduate spherical geometry, we can illustrate its value as an experimental tool in verifying the Spherical Law of Sines. Readers who recall their trigonometry from high school might remember the planar Law of Sines (see for example (Maor, 1988), chapter 6), stated as follows:
( a / sin A) = ( b / sin B) = ( c / sin C)
Briefly, the symbols a, b, and c denote the lengths of the three sides of any given planar triangle; and the symbols A, B, and C denote the measures of the angles opposite those sides.
The Law of Sines is one of those basic laws of planar trigonometry that must be tossed out the window in the case of the sphere. In spherical trigonometry, there is a new Spherical Law of Sines (cf. (Van Brummelen, 2013), chapter 4):
(sin a / sin A) = (sin b / sin B) = (sin c / sin C)
At first blush, it might not even seem that the Spherical Law of Sines could possibly make sense: what does it mean to take the sine of a length (like a)? The key insight is to note that on the sphere, lengths and angles in fact mean similar (or at least related) things. Imagine an arc on the unit sphere of length, say, l; if you now draw lines from the center of the sphere to the endpoints of the arc, the angle between those lines will also be l. (For example, using 360 as the circumference of the sphere's diameter, an arc of length 60 units would correspond to an angle of 60 degrees drawn from the center of the sphere to the two endpoints.)
With this in mind, we can now measure our lengths in degrees, with 360 corresponding to the circumference of a complete great circle; and using degrees as our measure, both lengths and angles now are measured in the same sorts of units. With the MoS system, we can experiment with the Spherical Law of Sines by drawing a spherical triangle as in Fig. 9. (There are numerous ways of accomplishing this using the basic MoS language, including a bit of trial-and-error in adjusting the turtle's position; to go into the details of this process here, however, would be something of a detour.) Once our triangle has been drawn, we can measure the lengths of its three sides in the MoS system, and the size of its three angles; these measurements are shown in Fig. 10 (and again, note

150 M. Eisenberg et al. (2014)
that the three angles sum to a value well above the planar standard of 180 degrees). Now we can use a calculator to verify the Spherical Law of Sines from the six numbers shown in Fig. 10: the ratio of (sin 53 degrees)/(sin 60 degrees), for instance, is about the same (0.92, given our level of accuracy) as the ratio (sin 67 degrees)/(sin 90 degrees).
Fig. 9. A spherical triangle drawn in the MoS system using the turtle and a bit of trial-and-error to find appropriate lengths and angles
Fig. 10. The spherical triangle of Fig. 9, augmented at left with length measures of the three sides (in degrees, with 360 corresponding to a complete great circle), and at right
with measures of the three angle values (likewise in degrees)
4.2. A more advanced programming example: Predator-prey pursuit on the sphere
The basic MoS programming language described in the earlier sections of this paper is capable of supporting a large variety of beautiful graphical projects; but at the same time,

Knowledge Management & E-Learning, 6(2), 140–155 151
we have been working in the past year to extend the expressive power of the language, to facilitate more advanced geometric and programming concepts. In particular, the basic language does not support compound data structures (arrays and lists), or data objects other than a limited set (prominently including integers and floating point numbers). By adding a more extended set of data types to a newer version of the language, we are now able to support programming projects that would have been impossible (or at least highly unwieldy) before.
As an example, consider the following basic programming idea (see (Abelson & diSessa, 1980) for a similar example on the plane): imagine that we have not just one, but two turtles moving on the sphere. One turtle (we'll call it Prey) starts at the North Pole and moves at a steady rate along a longitude line; Prey is thus moving along on a particular great circle of the sphere. The other turtle (we'll call it Predator) starts on the equator and also moves steadily, choosing its heading at each small step to point toward the current position of Prey. In other words, the Predator turtle is "chasing" the Prey turtle about on the sphere, repeatedly updating its heading to pursue the latest known position of the Prey.
Fig. 11. A predator-prey example on the sphere; the sphere's orientation has been adjusted for a better view
The essential programming technique necessary for this project is one in which the sphere turtle can simulate the behavior of both Prey and Predator repeatedly. We save the current position and heading corresponding to both Prey and Predator; then we move Prey along the longitude line (and re-update the Prey position and heading), and move Predator towards Prey (and re-update the Predator position and heading). By repeating this basic process over and over, we emerge with two drawn paths on the sphere. The key step here–the step that would have been impossible in the earlier version of the system–is the ability to save and restore position values (which are represented as pairs of numbers, and hence compound data structures). A full version of the (surprisingly brief) program is given in the appendix to this paper; the predator-prey paths for a particular run of the program are shown in Fig. 11. In the figure, the predator turtle starts toward the top of the
152 M. Eisenberg et al. (2014)
picture (actually a spot on the sphere's equator), and is chasing a prey turtle that is moving along a longitude line (seen toward the bottom of the sphere). The prey turtle is moving in a clockwise path as viewed from the top of Fig. 11; while the predator's path can be seen "swooping" in a spiral-like pattern toward the ever-changing position of the prey.
5. Toward democratized public displays
Having discussed some of the current and ongoing work on the MoS system, we can now take a step back and talk, not just about the "how" of the system (how it works, how it can be used), but rather the "why". Our motivation for creating the MoS system is really twofold. On the one hand, we are interested in providing an aesthetically appealing medium for introducing non-Euclidean geometry for middle- and high-school students; the examples of the previous sections, brief as they necessarily were, indicate the sorts of mathematical issues highlighted by the system. A second reason for creating the system, however, is less specific to mathematics per se, and more aimed at expanding the landscape of display devices (and display settings) available to students.
We can begin this reflection with the subject of "making public displays available to children". Earlier researchers such as Brignull and Rogers (2003) and Peltonen et al. (2008) have reported on pioneering work investigating users' activities with large-scale interactive public displays. Our MoS system has particular features that make it distinct from that earlier work: it highlights specific educational (in particular, mathematical) issues, it is replicated in many sites worldwide (suggesting that a user could in principle create a pattern to be displayed at various public sites over time, or simultaneously), and it offers a dimension of programming (as opposed to "direct interaction", as in Brignull and Rogers' "Opinionizer" or Peltonen et al.'s "CityWall" projects).
The MoS strategy described here¬–the strategy for giving students control of public display devices–is really a flexible mixture of "remote" and "present" interaction. Conceivably, students can spend a significant amount of time learning spherical programming on their own, and then (only later) display their ideas publically; this is, in effect, the strategy of the middle school pilot tests that we have conducted in Boulder, where students spend time in the classroom experimenting with spherical geometry and then, for a final meeting, display their programs on the giant sphere. Alternatively, one could imagine scenarios in which students explore ideas immediately (as in our workshops at Lawrence Hall), at the museum or planetarium space itself. One might, of course, repurpose this latter fundamental strategy for other public displays. For example, one might create a "public opinion" space, analogous to the "Speaker's Corner" at London's Hyde Park, through which students (e.g., for the purposes of debate or political participation) can project text, graphics, and video on high-resolution screens in large public spaces; or students might be given (temporary) control over a scoreboard display at a sporting event. Naturally, there is a sociological and political dimension to such a suggestion: students might elect to project (e.g.) controversial or even offensive content through such a system. The issues raised by a public display of this sort touch upon fundamental issues of privacy and free speech. Indeed, it should be noted that even in our own MoS system, the capability exists for a user to create (e.g.) turtle-drawn text messages to display on the giant sphere; and conceivably, a diligent user could employ the system to project words on the sphere that other museum-goers might not wish to read. Once programmable public displays are made available to children (and to the public), that decision is attended by all the benefits and risks of free and open speech in other settings as well.

Knowledge Management & E-Learning, 6(2), 140–155 153
Of course, there are many more examples of this sort of idea that might be tried, not all of them as politically sensitive. For instance, one might return to a planetarium setting, and create an interface through which visiting school groups can project patterns on the interior of a planetarium dome. Theatrical sets might include display elements that can be controlled by audience members. Art museums might include specialized surfaces of various sorts, perhaps using geometric forms other than the SoS sphere; for instance, one might create an "SoS-like" cube, cylinder, or cone-shaped display surface (just to name a few examples), and allow visitors to create designs for those surfaces through their own "MoS-like" Web interface. These last scenarios highlight once more the specifically mathematical aspects of the MoS project.
There are many other technological challenges that could emerge from experiments along these lines. For example, the MoS system is based on a default scenario in which a single programmer creates a design to send to a particular sphere. We might imagine an alternative in which several programmers, working from several distinct Web interfaces, each contributes a portion of a spherical design; for instance, one programmer might create a "background" design for the sphere, while others create programs for animated "foreground" figures that move over the background graphics. Another variation of this idea might permit one user to (e.g.) create graphics for the "northern hemisphere" while another creates graphics for the "southern hemisphere"; and yet another variation might include cooperative or competitive programming games designed for the spherical display, in which players create or improvise graphical elements in real time.
Yet another element of our default scenario is that the user is writing programs intended for a specific SoS sphere (most likely at a local institution), and that they will be immediately present when the program is actually run on the SoS surface. We might vary this, and try implementing an MoS system in which users could write programs at the Web interface and then broadcast those to one or more distant spherical surfaces; in this variant, it would no longer be necessary to be physically present at the local planetarium in order to run one's program on the giant sphere (or on multiple spheres). Conceivably, the user in this case might be able to watch the results of his running program via a webcam or similar remote viewing device; indeed we recently held a "pilot-testing showcase event" at the Lawrence Hall (see www.mathsphere.org) to illustrate just this sort of scenario. Yet another possibility would be to employ lightweight handheld projectors (held by students themselves) that can be overlapped or superimposed to create large-scale displays or animations under distributed control from multiple users. Or–to imagine still another alternative–one might create an MoS-like interface to display graphics on a moving or dynamic surface (such as a hanging mobile).
The intent of these examples is simply to illustrate the ways in which a strategy like that employed in the MoS system can be adapted to all sorts of other public and pervasive displays. The control of such displays can now be distributed; even a complex, large, or expensive display associated with a particular physical location can now be made available for Web-based graphics and programming. We look forward to the day when museums and planetariums (among many other institutions) routinely install beautiful, specialized displays that have relatively "open access" for their visitors.
Acknowledgements
The MoS system was implemented in our lab with the invaluable contributions of Michelle B. Redick and Michael MacFerrin. Many thanks to Michael Biere, Hilary

154 M. Eisenberg et al. (2014)
Peddicord and their colleagues at NOAA; thanks also to Hilarie Nickerson for helpful conversations. The work described in this paper was supported in part by a grant from the National Science Foundation, DRL1114388.
References
Abelson, H., & diSessa, A. (1980). Turtle geometry: The computer as a medium for exploring mathematics. Cambridge, MA: MIT Press.
Brignull, H., & Rogers, Y. (2003). Enticing people to interact with large public displays in public spaces. In Proceedings of INTERACT (pp. 17–24).
Eisenberg, M. (2010). Computational diversions: Turtle really and truly escapes the plane. International Journal of Computers in Mathematical Learning, 15(1), 73–79.
Eisenberg, M. (2012). Computational diversions: The return of the spherical turtle. Technology, Knowledge, and Learning, 17(3), 115–122.
Eisenberg, M., Basman, A., & His, S. (2013). Math on a sphere: Making use of public displays in education. In Proceedings of Cognition and Exploratory Learning in Digital Age (CELDA) (pp. 217–224).
Hsi, S., & Eisenberg, M. (2012). Math on a sphere: Using public displays to support children's creativity and computational thinking on 3D surfaces. In Proceedings of Interaction Design and Children (IDC) (pp. 248–251).
Maor, E. (1998). Trigonometric delights. Princeton, NJ: Princeton University Press. National Oceanic and Atmospheric Administration (NOAA). (2013). NOAA website for
SoS. Retrieved from http://sos.noaa.gov/index.html Papert, S. (1980). Mindstorms: Children, computers, and powerful ideas. NY: Basic
Books. Peltonen, P., Kurvinen, E., Salovaara, A., Jacucci, G., Ilmonen, T., Evans, J., Oulasvirta,
A., & Saarikko, P. (2008). It's Mine, Don't Touch!: Interactions at a large multi-touch display in a city centre. In Proceedings of the SIGCHI Conference on Human Factors in Computing Systems (pp. 1285–1294).
Science on a Sphere (SoS). (2013). Science on a Sphere projection requirements. Retrieved from http://sos.noaa.gov/docs/faq.html
Van Brummelen, G. (2013). Heavenly mathematics: The forgotten art of spherical trigonometry. Princeton, NJ: Princeton University Press.

Knowledge Management & E-Learning, 6(2), 140–155 155
Appendix A: Predator-prey program example
// The predator turtle starts at the equator
position1 = [0, 0]
heading1 = 0
position2 = [0, 0]
heading2 = 0
// These steps initialize the prey turtle to the North Pole
pu
forward 90
right 90
position2 = getposition
heading2 = getheading
// Now we will repeatedly move each turtle.
// Some vocabulary:
//"pu" means "pick up the pen and don't draw"
// "pd" means "put down the pen and draw when you move"
// "setpos" means "set the turtle position
// to the given point"
// "setheading" means "set the turtle heading
// to the given value"
// "towards" means "set the heading towards the given point"
repeat 64 {
// move the predator turtle toward the prey
pu
setpos position1
towards position2
pd
forward 2.68
// update stored position and heading for the predator
position1 = getposition
heading1 = getheading
// move the prey turtle
pu
setpos position2
setheading heading2
pd
forward 4.05
// update stored position and heading for the prey
position2 = getposition
heading2 = getheading
}