Knowing Your Data - Packt Publishing · 3 Drawing Your First Plots and Customizing Them Defining...
60
2 Knowing Your Data Cleaning up data from outliers
Transcript of Knowing Your Data - Packt Publishing · 3 Drawing Your First Plots and Customizing Them Defining...

2Knowing Your Data
Cleaning up data from outliers


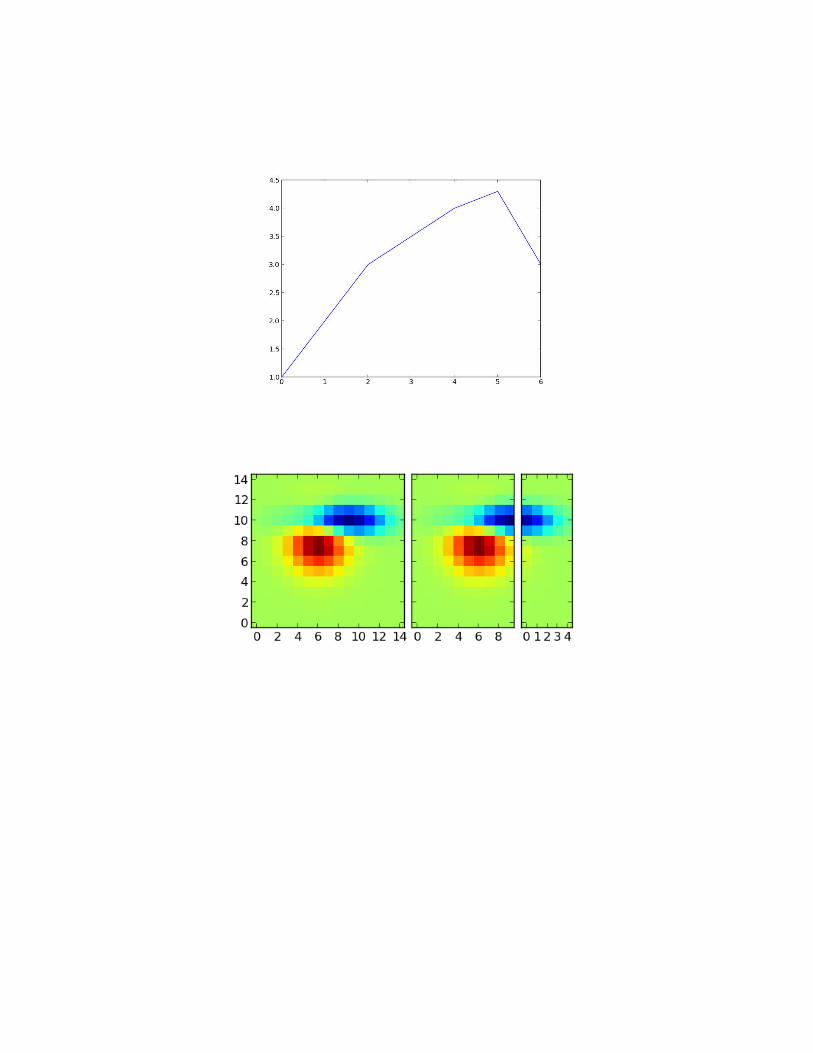
Importing image data into NumPy arrays


Generating controlled random datasets

Smoothing the noise in real-world data


3Drawing Your First Plots and
Customizing Them
Defining plot types – bar, line, and stacked charts


Drawing a simple sine and cosine plot

Defining axis lengths and limits

Setting ticks, labels, and grids

Adding a legend and annotations

Moving spines to the center

Making histograms

Making bar charts with error bars

Making pie charts count

Plotting with filled areas

Making stacked plots

Drawing scatter plots with colored markers

4More Plots and Customizations
Adding a data table to the figure

Using subplots

Customizing grids

Creating contour plots
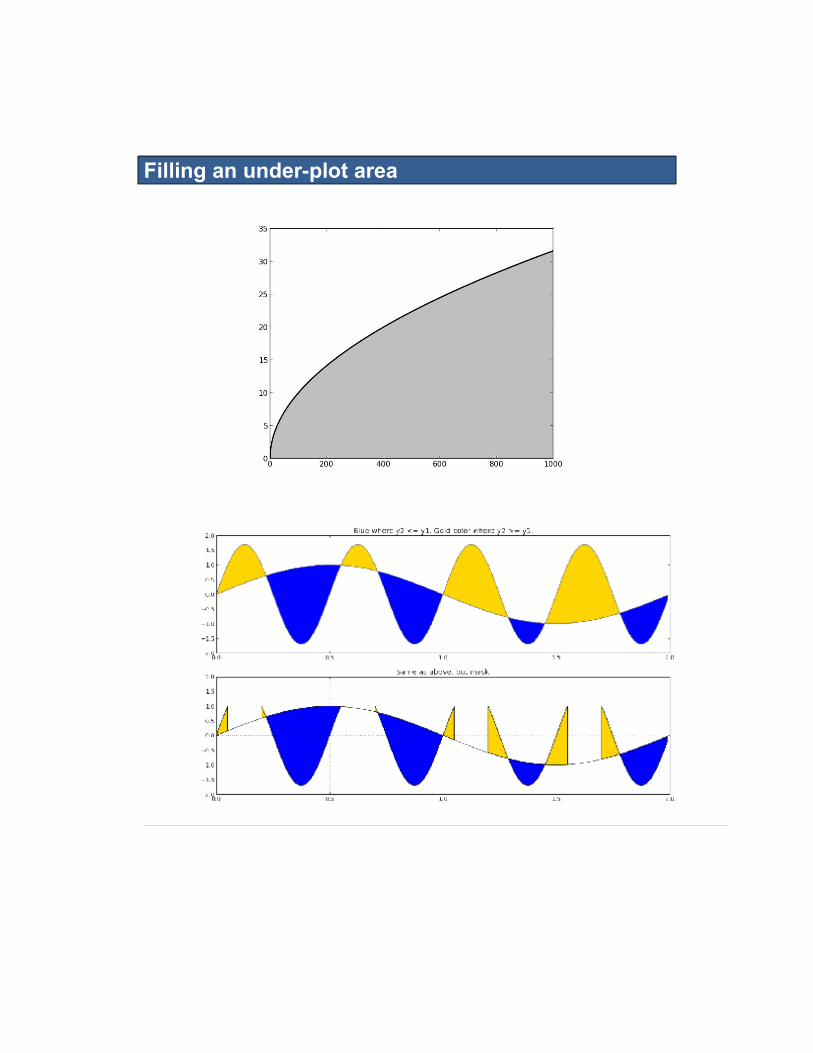
Filling an under-plot area

Drawing polar plots

Visualizing the filesystem tree using a polar bar

Customizing matplotlib with style

5Making 3D visualizations
Creating 3D bars


Creating 3D histograms
Animating in matplotlib

Animating with OpenGL

6Plotting Charts with Images and
Maps
Plotting with images

Displaying an image with other plots in the figure

Plotting data on a map using Basemap

Plotting data on a map using Google Map API

Generating CAPTCHA images

7Using the Right Plots to
Understand Data
Understanding logarithmic plots

Understanding spectrograms

Creating stem plot

Drawing streamlines of vector flow

Using colormaps

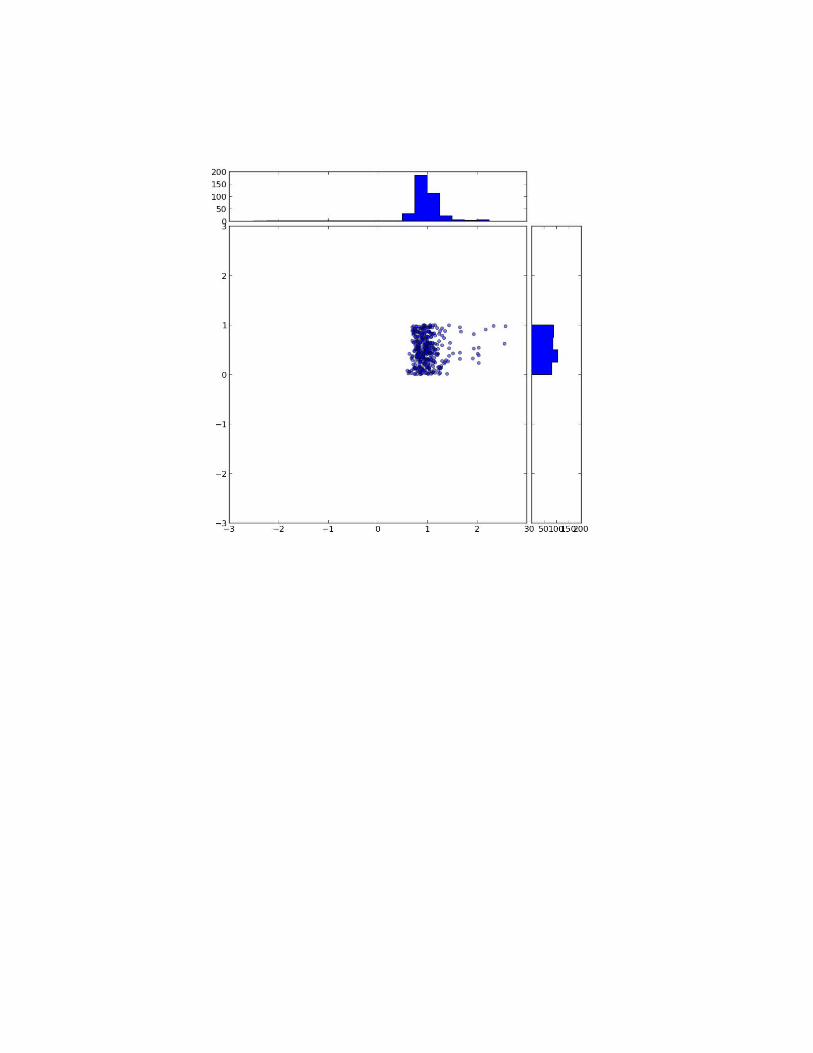
Using scatter plots and histograms

Plotting the cross correlation between two variables

Importance of autocorrelation
8More on matplotlib Gems

Drawing barbs
Making a box and a whisker plot
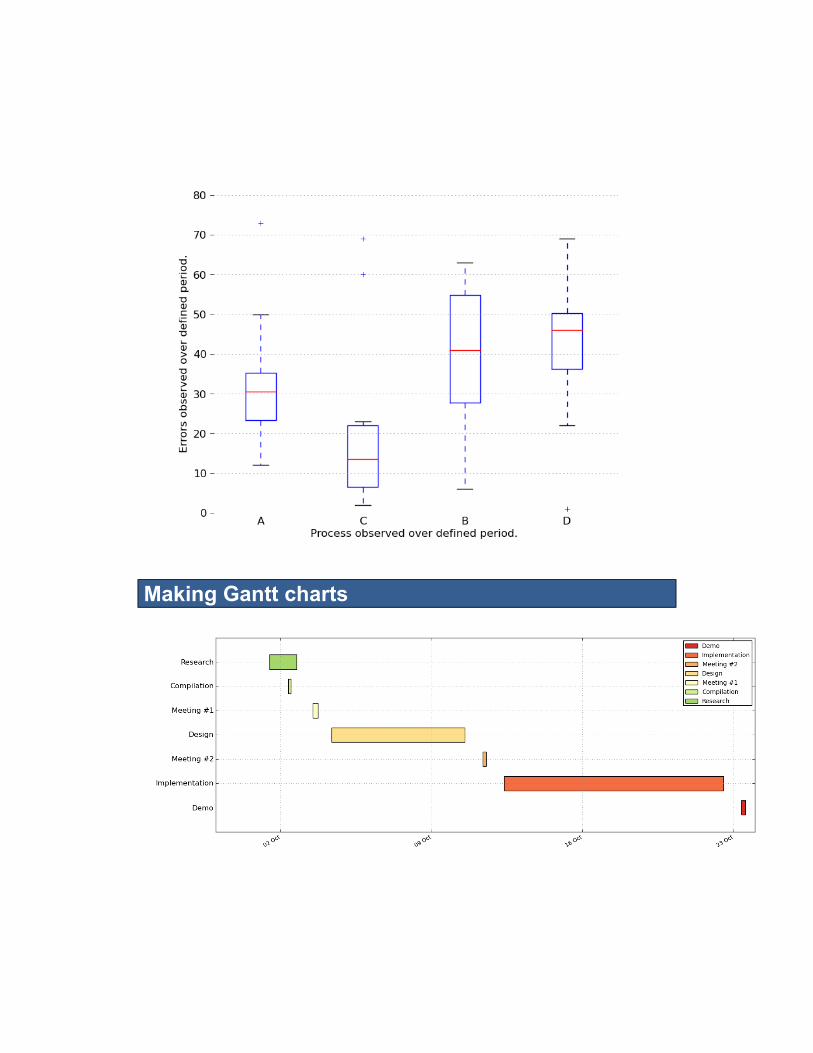
Making Gantt charts

Making error bars

Making use of text and font properties

Rendering text with LaTeX

Understanding the difference between pyplot and OO API

9Visualizations in the clouds with
Plot.ly
Creating line charts


Creating bar charts

Plotting a 3D trefoil knot

Visualizing maps and bubbles