KnowBorders: Scottish Borders Community Planning ... · Scottish Borders Community Planning...
94
KnowBorders: Scottish Borders Community Planning Partnership 2016 Strategic Assessment: Eildon Extract
Transcript of KnowBorders: Scottish Borders Community Planning ... · Scottish Borders Community Planning...

KnowBorders: Scottish Borders Community Planning Partnership 2016 Strategic Assessment: Eildon Extract

SB-SA2016 - Eildon - V1 2
Version Control
No. Action Start Date Complete Date Result
1 Eildon SA based on full SA2016 01/07/2016 18/08/2016 SA2016-Eildon –
V1
Contact details for Strategic Assessment 2016:
Strategic Policy Unit
Scottish Borders Council
Email: [email protected]
Tel: 01835 824000

SB-SA2016 - Eildon - V1 3
Table of Contents
Table of Contents .............................................................................................................................................. 3
Introduction and Summary of Key Findings – Eildon Extract ............................................................................ 4
Strategic Assessment 2016 Development ......................................................................................................... 6
Eildon: Area Profile ............................................................................................................................................ 7
Summary of Population Trends ..................................................................................................................... 7
Population ..................................................................................................................................................... 8
Life Expectancy ............................................................................................................................................ 20
Migration, Ethnicity and National Identity .................................................................................................. 24
Household Profile ........................................................................................................................................ 30
Scottish Borders and the Scottish Index of Multiple Deprivation (SIMD) ................................................... 35
Economy and Income ...................................................................................................................................... 42
Town Centre Retail Activity ......................................................................................................................... 42
Economic Inequalities .................................................................................................................................. 48
Education and Learning ................................................................................................................................... 55
School Leavers ............................................................................................................................................. 55
Life Stages / Health and Wellbeing.............................................................................................................. 57
Maternity / Early Years ................................................................................................................................ 57
Children ....................................................................................................................................................... 60
Adults ........................................................................................................................................................... 62
Older People ................................................................................................................................................ 67
Substance Use ............................................................................................................................................. 68
Mental Health .............................................................................................................................................. 70
Physical Activity ........................................................................................................................................... 73
Reducing Risk ............................................................................................................................................... 74
Community and Environment ......................................................................................................................... 76
Community Safety ....................................................................................................................................... 76
Built and Physical Environment ................................................................................................................... 81
Environmental Impact ................................................................................................................................. 83
Community Support and Community Resilience ........................................................................................ 86
Cultural Activity ........................................................................................................................................... 89
Physical and Digital Access .......................................................................................................................... 90
Public Services ................................................................................................................................................. 92
Public Priorities ............................................................................................................................................ 92
Satisfaction with Public Services ................................................................................................................. 93
Influence / involvement in public sector ..................................................................................................... 94
SB-SA2016 - Eildon - V1 4
Introduction and Summary of Key Findings – Eildon Extract
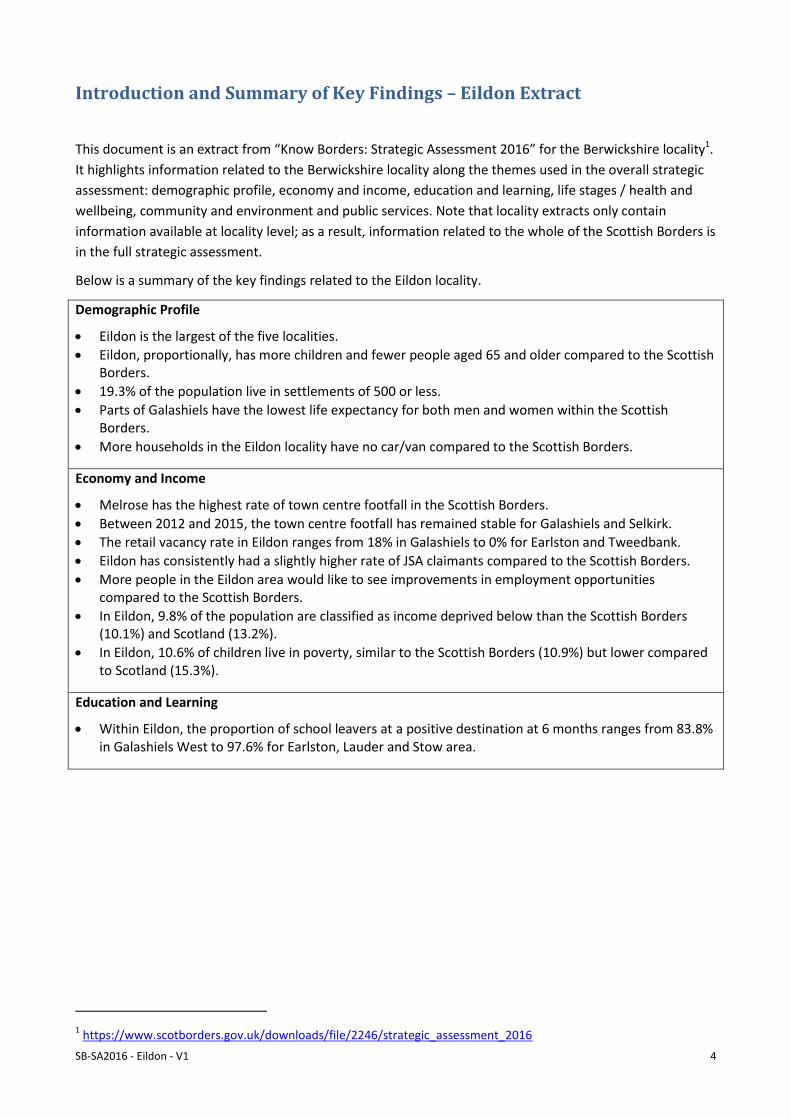
This document is an extract from “Know Borders: Strategic Assessment 2016” for the Berwickshire locality1.
It highlights information related to the Berwickshire locality along the themes used in the overall strategic
assessment: demographic profile, economy and income, education and learning, life stages / health and
wellbeing, community and environment and public services. Note that locality extracts only contain
information available at locality level; as a result, information related to the whole of the Scottish Borders is
in the full strategic assessment.
Below is a summary of the key findings related to the Eildon locality.
Demographic Profile
Eildon is the largest of the five localities.
Eildon, proportionally, has more children and fewer people aged 65 and older compared to the Scottish Borders.
19.3% of the population live in settlements of 500 or less.
Parts of Galashiels have the lowest life expectancy for both men and women within the Scottish Borders.
More households in the Eildon locality have no car/van compared to the Scottish Borders.
Economy and Income
Melrose has the highest rate of town centre footfall in the Scottish Borders.
Between 2012 and 2015, the town centre footfall has remained stable for Galashiels and Selkirk.
The retail vacancy rate in Eildon ranges from 18% in Galashiels to 0% for Earlston and Tweedbank.
Eildon has consistently had a slightly higher rate of JSA claimants compared to the Scottish Borders.
More people in the Eildon area would like to see improvements in employment opportunities compared to the Scottish Borders.
In Eildon, 9.8% of the population are classified as income deprived below than the Scottish Borders (10.1%) and Scotland (13.2%).
In Eildon, 10.6% of children live in poverty, similar to the Scottish Borders (10.9%) but lower compared to Scotland (15.3%).
Education and Learning
Within Eildon, the proportion of school leavers at a positive destination at 6 months ranges from 83.8% in Galashiels West to 97.6% for Earlston, Lauder and Stow area.
1 https://www.scotborders.gov.uk/downloads/file/2246/strategic_assessment_2016

SB-SA2016 - Eildon - V1 5
Life Stages / Health and Wellbeing
In Eildon, more mothers were smoking during pregnancy compared to Scottish Borders and Scotland.
In Eildon, the proportion of babies that were exclusively breastfed at 6-8 weeks was similar to the Scottish Borders and above Scotland.
Eildon had a higher proportion of P1 pupils with “no obvious dental decay” compared to the Scottish Borders and Scotland.
Almost 10% of P1 pupils in the Eildon areas are obese similar to the level for Scotland.
There were more coronary heart disease (CHD) hospitalisations in the Eildon area compared to Scottish Borders and Scotland.
The Eildon locality has the highest rate of early deaths from cancer compared the other Scottish Borders localities but below Scotland.
The Eildon locality had the highest rate of emergency hospitalisations for all and for those aged 65+ compared to the other localities, Scottish Borders and Scotland.
The Eildon locality has the highest rate of alcohol related hospitalisations and deaths compared to the other Scottish Borders localities, although the Scottish rate.
The Eildon locality has a highest rate of drug-related hospital stays compared to the other localities and the Scottish Borders although lower than Scotland.
The Eildon locality had the highest levels of suicide within the Scottish Borders.
A lower proportion of adults exercise daily compared to the Scottish Borders level.
Community and Environment
‘Rubbish and litter lying around’, ‘people using or dealing drugs’, and ’people being drunk or rowdy in public places’ are more common neighbourhood problem for people of the Eildon area compared to the Scottish Borders.
Within the Eildon locality 15.3% of respondents indicated there were places they felt unsafe above the 12.5% for the Scottish Borders.
More people in Eildon witnessed or experienced anti-social behaviour compared to the Scottish Borders.
Compared to the Scottish Borders, Eildon had higher rates of Serious Assault, Minor Assault, Supply of Drugs, Possession of Drugs, and Shoplifting.
Compared to the Scottish Borders the Eildon area has a higher rate of ‘fires in homes’.
The Eildon area had a lower proportion of adults involved in voluntary work compared to the Scottish Borders.
Over 1,240 have signed up for “SBAlert”2 in Eildon.
Fewer people in the Eildon locality do not use internet or email 14.1% compared to Scottish Borders 14.9%.
Public Services
More respondents in the Eildon area considered ‘raising educational attainment and achievement’, ‘making more affordable housing available’ and ‘reinstatement of the Borders Railway to Hawick and Carlisle’ to be a top 5 priorities compared to the Scottish Borders.
Eildon had a lower rate of satisfaction related to opportunities to participate in the local decision making process provided by Scottish Borders Council compared to Scottish Borders.
2 http://www.sbalert.co.uk/

SB-SA2016 - Eildon - V1 6
Strategic Assessment 2016 Development
Know Borders: Strategic Assessment 2016 provides the Scottish Borders Community Planning Partnership
an opportunity to evaluate how the Scottish Borders is meeting the 16 National Outcomes and identify the
priorities for the Scottish Borders’s Local Outcome Improvement Plan (LOIP) and Locality Plans.
For each theme (Economy and Income, Education and Learning, Life Stages / Health and Wellbeing,
Community and Environment, and Public Services), accommodating the 16 national outcomes, the national
and local drivers have been identified as has evidence to show how the Scottish Borders is contributing to
the national outcomes. The table below show the themes and the associated national outcomes.
Theme No. National Outcome Description
Demographic and
Household Profile 0 Population and Household Profile with Deprivation 'baseline' SIMD2012
Economy and Income
1 We live in a Scotland that is the most attractive place to do business in
Europe
2 We realise our full economic potential with more and better employment
opportunities for our people
Education and
Learning
3 We are better educated, more skilled and more successful, renowned for
our research and innovation
4 Our young people are successful learners, confident individuals, effective
contributors and responsible citizens
Life Stages / Health
and Wellbeing
5 Our children have the best start in life and are ready to succeed
6 We live longer, healthier lives
7 We have tackled the significant inequalities in Scottish society
8 We have improved the life chances for young people and families at risk
15 Our people are able to maintain their independence as they get older and
are able to access appropriate support when they need it
Community and
Environment
9 We live our lives safe from crime, disorder and danger
10 We live in well-designed, sustainable places where we are able to access
amenities and services we need
11 We have strong, resilient and supportive communities where people take
responsibility for their own actions and how they affect others
12 We value and enjoy our built and natural environment and protect and
enhance it for future generations
13 We take pride in a strong, fair and inclusive national identity (Local identity)
14 We reduce the local and global environmental impact of our consumption
and production
Public Services 16 Our public services are high quality, continually improving, efficient and
responsive to local people's needs

SB-SA2016 - Eildon - V1 7
Eildon: Area Profile
Summary of Population Trends
Eildon is the largest of the five localities, almost twice the size of the smallest
Its main towns are Galashiels and Selkirk.
Its larger villages are Melrose, Tweedbank, Lauder, Earlston, Newtown St Boswells and Stow
Lauder has the second highest proportion of children of any larger settlement in Scottish Borders
The Gattonside and Darnick datazone has the second lowest proportion of children in Scottish
Borders
Galashiels has the highest proportion of working-age people of any larger settlement in SBC area
Eildon has a below-average share of Scottish Borders’ pensioners.
Around 1,500 pensioners in Eildon live in small and more isolated villages
The Darnick & Gattonside datazone has the highest proportion of pensioners in Eildon
Tweedbank, Melrose and Lauder have seen substantial housing development since 2001
The most rural areas in the locality and Selkirk have seen population loss in the same period
The population-age structure in Eildon is more typical of the Scottish average than other localities
Before the Borders Railway, Eildon’s population was projected to stagnate and age
Selkirshire was expected to be the worst affected out of the three multi-member Wards
It is too early to say whether or not these projected population estimates will still happen
Although numbers of births are rising in Eildon, the birth rate is currently fluctuating downwards
Eildon has the highest proportions of single people of the 5 localities
Death rates and numbers of deaths are continuing to decline in Eildon
Galashiels has amongst the lowest Male Life Expectancy in Scottish Borders
Only the most rural 2 of Eildon’s 8 Intermediate Zones have above-average Male Life Expectancy
Female Life Expectancy shows a different pattern, with only parts of Galashiels the worst-affected
Again, Female Life Expectancy is better in the rural parts of the locality
Eildon has the second most homogeneous White Scottish population of the 5 localities
Most of the remainder are Anglo-Scottish or English, reflecting Eildon’s Scottish Borders setting
Non-UK White minorities represent less than 4% of the population in Eildon.
Non-White minorities represent less than 1% of Eildon’s population
Eildon has the highest proportion of people who stated they have “no religion” of the 5 localities
Around 1,246 people in Eildon stated thay had little or no proficiency in English
Small levels of ethnic and cultural diversity are evident in the locality and vary by neighbourhood
Household structures in Eildon are more typical of the Scottish average than other localities
Proportions of working-age single person households are higher, older households are lower
Eildon also has amongst the highest proportions of larger households of the 5 localities
Eildon has the highest proportion of homeowners with a mortgage or loan but the lowest who own
their home outright
Eildon has 3,852 householders who are social tenants, the second highest rate of the 5 localities
Eildon has the second highest proportion of people with no access to a car of the 5 localities
Gas Central Heating uptake is surprisingly low and its reliance on Electric Central Heating is the
highest in Scottish Borders
Uptake of oil, solid fuel and other types of central heating are lower than average for SBC area
SB-SA2016 - Eildon - V1 8
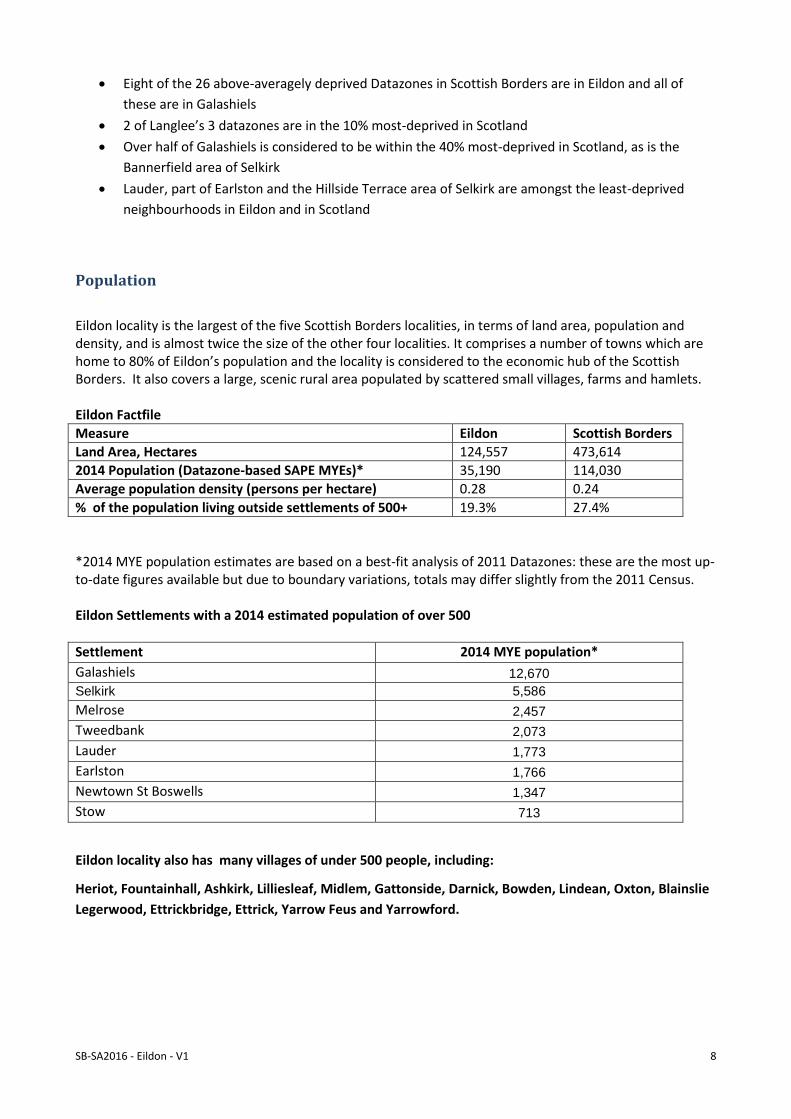
Eight of the 26 above-averagely deprived Datazones in Scottish Borders are in Eildon and all of
these are in Galashiels
2 of Langlee’s 3 datazones are in the 10% most-deprived in Scotland
Over half of Galashiels is considered to be within the 40% most-deprived in Scotland, as is the
Bannerfield area of Selkirk
Lauder, part of Earlston and the Hillside Terrace area of Selkirk are amongst the least-deprived
neighbourhoods in Eildon and in Scotland
Population
Eildon locality is the largest of the five Scottish Borders localities, in terms of land area, population and density, and is almost twice the size of the other four localities. It comprises a number of towns which are home to 80% of Eildon’s population and the locality is considered to the economic hub of the Scottish Borders. It also covers a large, scenic rural area populated by scattered small villages, farms and hamlets. Eildon Factfile
Measure Eildon Scottish Borders
Land Area, Hectares 124,557 473,614
2014 Population (Datazone-based SAPE MYEs)* 35,190 114,030
Average population density (persons per hectare) 0.28 0.24
% of the population living outside settlements of 500+ 19.3% 27.4%
*2014 MYE population estimates are based on a best-fit analysis of 2011 Datazones: these are the most up-to-date figures available but due to boundary variations, totals may differ slightly from the 2011 Census. Eildon Settlements with a 2014 estimated population of over 500
Settlement 2014 MYE population*
Galashiels 12,670
Selkirk 5,586
Melrose 2,457
Tweedbank 2,073
Lauder 1,773
Earlston 1,766
Newtown St Boswells 1,347
Stow 713
Eildon locality also has many villages of under 500 people, including:
Heriot, Fountainhall, Ashkirk, Lilliesleaf, Midlem, Gattonside, Darnick, Bowden, Lindean, Oxton, Blainslie
Legerwood, Ettrickbridge, Ettrick, Yarrow Feus and Yarrowford.
SB-SA2016 - Eildon - V1 9
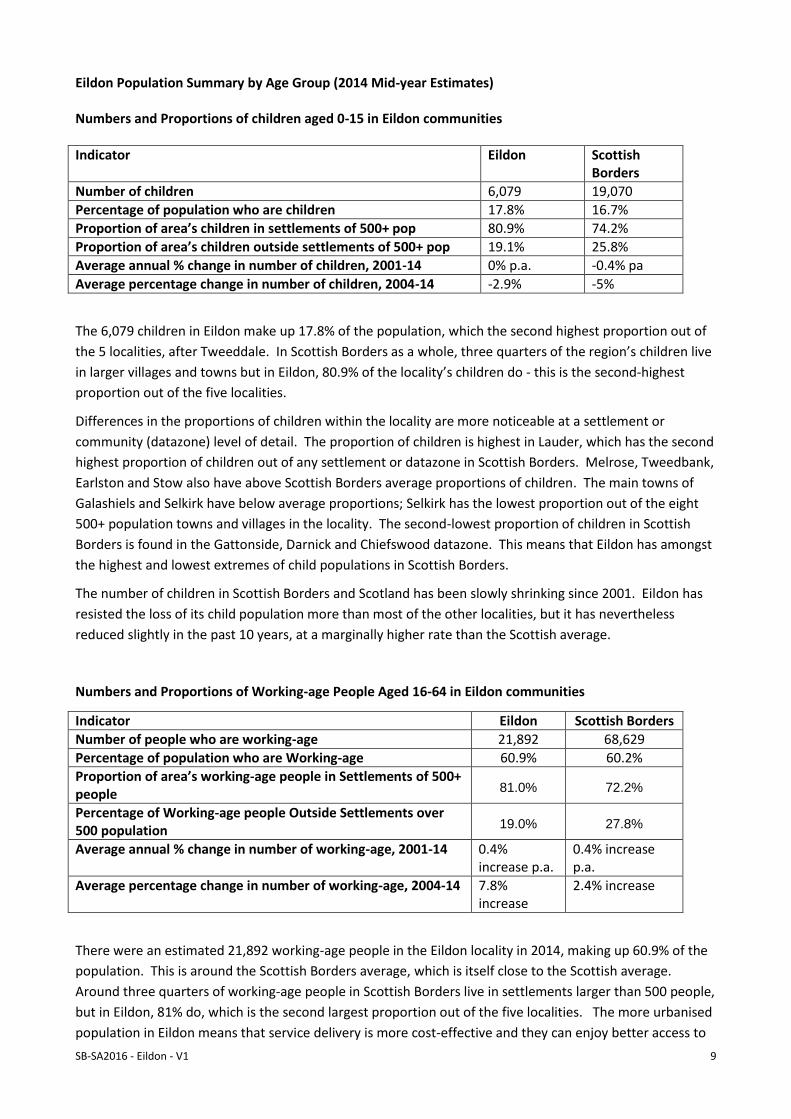
Eildon Population Summary by Age Group (2014 Mid-year Estimates) Numbers and Proportions of children aged 0-15 in Eildon communities
Indicator Eildon Scottish Borders
Number of children 6,079 19,070
Percentage of population who are children 17.8% 16.7%
Proportion of area’s children in settlements of 500+ pop 80.9% 74.2%
Proportion of area’s children outside settlements of 500+ pop 19.1% 25.8%
Average annual % change in number of children, 2001-14 0% p.a. -0.4% pa
Average percentage change in number of children, 2004-14 -2.9% -5%
The 6,079 children in Eildon make up 17.8% of the population, which the second highest proportion out of
the 5 localities, after Tweeddale. In Scottish Borders as a whole, three quarters of the region’s children live
in larger villages and towns but in Eildon, 80.9% of the locality’s children do - this is the second-highest
proportion out of the five localities.
Differences in the proportions of children within the locality are more noticeable at a settlement or
community (datazone) level of detail. The proportion of children is highest in Lauder, which has the second
highest proportion of children out of any settlement or datazone in Scottish Borders. Melrose, Tweedbank,
Earlston and Stow also have above Scottish Borders average proportions of children. The main towns of
Galashiels and Selkirk have below average proportions; Selkirk has the lowest proportion out of the eight
500+ population towns and villages in the locality. The second-lowest proportion of children in Scottish
Borders is found in the Gattonside, Darnick and Chiefswood datazone. This means that Eildon has amongst
the highest and lowest extremes of child populations in Scottish Borders.
The number of children in Scottish Borders and Scotland has been slowly shrinking since 2001. Eildon has
resisted the loss of its child population more than most of the other localities, but it has nevertheless
reduced slightly in the past 10 years, at a marginally higher rate than the Scottish average.
Numbers and Proportions of Working-age People Aged 16-64 in Eildon communities
Indicator Eildon Scottish Borders
Number of people who are working-age 21,892 68,629
Percentage of population who are Working-age 60.9% 60.2%
Proportion of area’s working-age people in Settlements of 500+ people 81.0% 72.2%
Percentage of Working-age people Outside Settlements over 500 population 19.0% 27.8%
Average annual % change in number of working-age, 2001-14 0.4% increase p.a.
0.4% increase p.a.
Average percentage change in number of working-age, 2004-14 7.8% increase
2.4% increase
There were an estimated 21,892 working-age people in the Eildon locality in 2014, making up 60.9% of the
population. This is around the Scottish Borders average, which is itself close to the Scottish average.
Around three quarters of working-age people in Scottish Borders live in settlements larger than 500 people,
but in Eildon, 81% do, which is the second largest proportion out of the five localities. The more urbanised
population in Eildon means that service delivery is more cost-effective and they can enjoy better access to
SB-SA2016 - Eildon - V1 10
services and better internet access than if they lived in a more remote area, but at the risk of greater
inequality between them and their rural counterparts.
Although the proportions of working-age people vary little between the five localities, there are differences
within the localities at datazone or settlement level. Galashiels has the highest proportion of working-age
people of any town of 500+ people in Eildon and Scottish Borders, due to its status as a regional economic
hub and centre of employment. Proportions of working-age people are also well above average in
Tweedbank and Newtown St Boswells. Outside the settlements of 500+ population, the datazones covering
Oxton, Ettrick Valley and the rural area around Earlston and Melrose have well above-average proportions
of working-age people.
The lowest proportions of working-age people are in the datazones covering Gattonside, Darnick and
Chiefswood and the Yarrow Valley. Earlston and Melrose have the lowest proportions out of any 500+ town
in Eildon, although these are not particularly low by Scottish Borders standards.
Scottish Borders faces continued challenges with working-age people migrating out of the area to find
employment, so raising the proportion of working-age people in the locality is an indication of wellbeing
towards maintaining the vibrancy and future survival of local communities. There are positive signs in
Eildon that numbers of working-age people are increasing. Numbers have been increasing by an above-
average trickle of 0.9% per annum since 2001 which amounts to a 7.8% increase since 2004. This is well
above the Scottish Borders and Scottish rate of increase of working-age people.
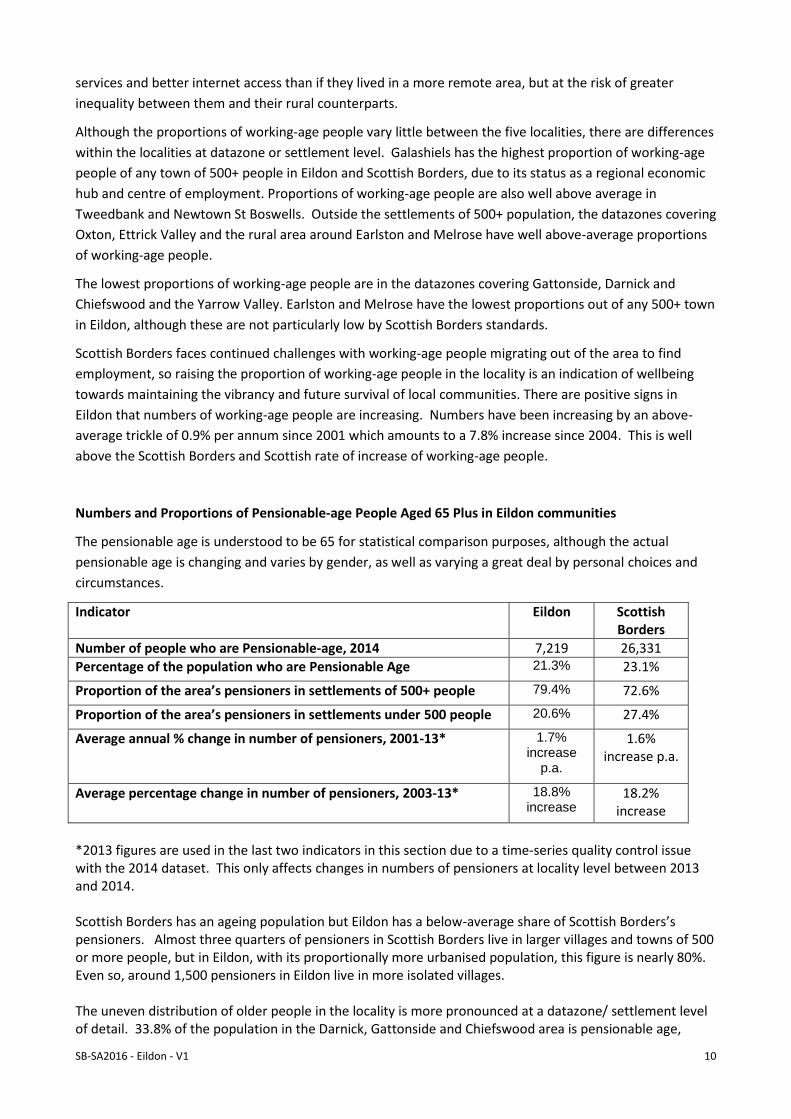
Numbers and Proportions of Pensionable-age People Aged 65 Plus in Eildon communities
The pensionable age is understood to be 65 for statistical comparison purposes, although the actual
pensionable age is changing and varies by gender, as well as varying a great deal by personal choices and
circumstances.
Indicator Eildon Scottish Borders
Number of people who are Pensionable-age, 2014 7,219 26,331
Percentage of the population who are Pensionable Age 21.3% 23.1%
Proportion of the area’s pensioners in settlements of 500+ people 79.4% 72.6%
Proportion of the area’s pensioners in settlements under 500 people 20.6% 27.4%
Average annual % change in number of pensioners, 2001-13* 1.7% increase
p.a.
1.6% increase p.a.
Average percentage change in number of pensioners, 2003-13* 18.8% increase
18.2% increase
*2013 figures are used in the last two indicators in this section due to a time-series quality control issue with the 2014 dataset. This only affects changes in numbers of pensioners at locality level between 2013 and 2014. Scottish Borders has an ageing population but Eildon has a below-average share of Scottish Borders’s pensioners. Almost three quarters of pensioners in Scottish Borders live in larger villages and towns of 500 or more people, but in Eildon, with its proportionally more urbanised population, this figure is nearly 80%. Even so, around 1,500 pensioners in Eildon live in more isolated villages. The uneven distribution of older people in the locality is more pronounced at a datazone/ settlement level of detail. 33.8% of the population in the Darnick, Gattonside and Chiefswood area is pensionable age,

SB-SA2016 - Eildon - V1 11
which is by far the highest proportion of any datazone in the locality and is amongst the highest in Scottish Borders. The town with the highest proportion of pensioners in the locality is Selkirk, which has levels above, but closer to, the Scottish Borders average. Proportions of pensioners in Galashiels are average for the Scottish average. The datazone with the lowest proportion of pensioners is the Fountainhall, Heriot and around Stow area which has amongst the lowest rates in Scottish Borders. Very low proportions of pensioners are also found in Tweedbank Between 2001 and 2013, numbers of pensioners in Eildon have increased at a steady average rate of 1.7% per annum, amounting to a 18.8% increase between 2003 and 2013, around average for Scottish Borders.
Population Change in Eildon The population of Eildon is increasing at an average rate of 0.7% per annum, based on the trend since the 2001 Census. This is slightly higher than the Scottish Borders (0.5% p.a.) and Scottish (0.4% p.a.) averages.
In the past 10 years (from 2004 to 2014), the rate of population change in Scotland and Scottish Borders has fluctuated, and the pattern in Eildon closely matches the Scottish Borders pattern. Overall, the population of Eildon has increased by 5.6%, which is above the Scottish (5.2%) and Scottish Borders (4.2%) averages. It should be remembered Eildon is twice the size of the other four localities which would have a “smoothing” effect on time-series statistics, removing the sharp peaks and troughs found in the population change timelines of the other localities. Based on these trends, the population of Eildon would be expected to continue increasing roughly at the same rate as average for Scottish Borders into the future, unless events or circumstances cause the situation to change.

SB-SA2016 - Eildon - V1 12
Geographical Variations in Population Change in Eildon The rate of population change varies considerably at datazone level, showing the impact a phase of new house-building can have on the population of a small area and also show the problems of using datazone geography to represent rural areas. The largest population change between 2004 and 2014 has been in the Oxton area and around the outskirts of Lauder, where the population has increased by 45%. Similar population growth is noted in the Gattonside, Darnick and Dingleton datazone and in the Heriot, Fountainhall and Stow datazone. In all cases, there has been new housebuilding in some parts of the datazone (for example, on the edge of the settlement boundary in Lauder and around the former Dingleton Hospital in Melrose) but the datazones in which they fall represent a much larger area than just the affected communities in order to reach the minimum population threshold, so the results are somewhat misleading. Collectively, the largest areas of population growth in Eildon have been the smaller settlements under 500 people, where the population has increased by an average of 15.4% since 2001. Of the settlements over 500 people, the largest population growth has been in Tweedbank which has grown by 13.5% since 2004. Not all parts of the locality have enjoyed population growth. The Ettrick Valley, around the villages of Ettrick and Ettrickbridge, has seen a loss of 7.4%, the third-equal largest population loss in Scottish Borders. Ettrick Primary school is currently mothballed and only 17 pupils were registered at Kirkhope Primary School in Ettrickbridge in September 2015. The Bowden, Charlesfield and surrounding rural area has also seen a population loss, as has the Yarrow Valley. Of the towns over 500 people, Selkirk has seen a slow but steady population loss and Stow has also suffered a slight net loss. Stow has undergone a radical change since these figures were collected as it now has its own railway station, so its fortunes are expected to change in future.
Age and Gender Distribution: Eildon and Scottish Borders
In Scotland as a whole, the number of births reached a peak around 50 years ago, corresponding with the
post-Second World War “baby-boom” which eventually declined in the 1970s. This generation is now
reaching retiring age, leading to a large increase in the proportion of older working-age and young retiring-
age people. There are significant minorities of single and widowed people, particularly women, who are
surviving into extreme old age. This trend is likely to accelerate in the next two decades.
The images below show the age-gender distribution of the 2014 population in Scottish Borders and Eildon.
The Scottish Borders pattern on the left broadly reflects the Scottish pattern but with more gaps in the
working-age section, representing population loss through outmigration from the region. There is a
sizeable gap in both genders throughout the younger working-age population, representing those who
have left in recent years, and a spike in the number of people in their mid-sixties who arrived or returned,
to enjoy their retirement in the region. As the largest locality and the “economic hub” of the region, the
population pyramid of Eildon is less typical of the rural localities and more akin to somewhere between the
Scottish Borders and Scottish averages. Its loss of young working age people and swell of older people is
less evident, showing that it has a younger and more economically active population profile than is typical
for a Scottish Borders locality.

SB-SA2016 - Eildon - V1 13
Population Projections for Eildon Wards
The overall population of Scotland is expected to increase by 8.8% between 2012 and 2037 but the overall
population of Scottish Borders is not expected to change significantly in the same period.
The Eildon locality is served by three Multi-member Wards: Galashiels & District, Leaderdale & Melrose and
Selkirkshire. An experimental 2012-based Multi-member Ward-level population projection release by
National Records of Scotland in March 2016 provides a unique insight in into the shape of projected
population change in the next 25 years at a sub-Locality level of detail. These projections are highly
speculative and do not take into account the impact of the Borders Railway or any planned changes to the
housing stock or the economy in the locality that have occurred since 2012, or any that have yet to be
implemented. It is merely a snapshot of what is most likely to happen if the birth rates, death rates and
rates of migration experienced in 2012 continue to happen at the same rate as they had been for the
previous 10 years.
Projected Population 2012 – 2037: All People
The experimental Ward-level population projections indicate that, despite the modest increases in Eildon’s
population over the past 10 years, only the Leaderdale & Melrose ward is expected to see population
growth in the next 25 years. The modest growth has been sustained in the past decade by new
developments in the more rural parts of the locality but this alone is not expected to sustain the population
in the Galashiels and Selkirkshire areas. This projection does not account for the recent economic growth
and the impact of the Borders Railway in the locality, the effects of which are yet to filter through to the
official population statistics. It is anticipated that the scenario in the chart below will become an example
of “what might have been” had the Borders Railway not been built, and that the impact on population
growth of economic development in the locality will turn out to be quite different.

SB-SA2016 - Eildon - V1 14
Projected Population 2012 – 2037: Children
According to the experimental Sub-Regional Population Projection figures released by NRS in 2016, the
population of children is projected to decrease everywhere except the Leaderdale and Melrose Ward and is
expected to drop substantially in Selkirkshire, based on past trends. Galashiels & district is projected to lose
8.1% of its children by 2037, which is above the Scottish Borders trend of 7.5% loss in the same period.
The numbers of children in the Selkirkshireward is projected to shrink by a massive 53.6% in the same
period, which is by far the highest rate of loss out of all 11 Multi-member Wards in Scottish Borders. This
projection is speculative and gives a view of what could happen if the current and past trends continue into
the future.
SB-SA2016 - Eildon - V1 15
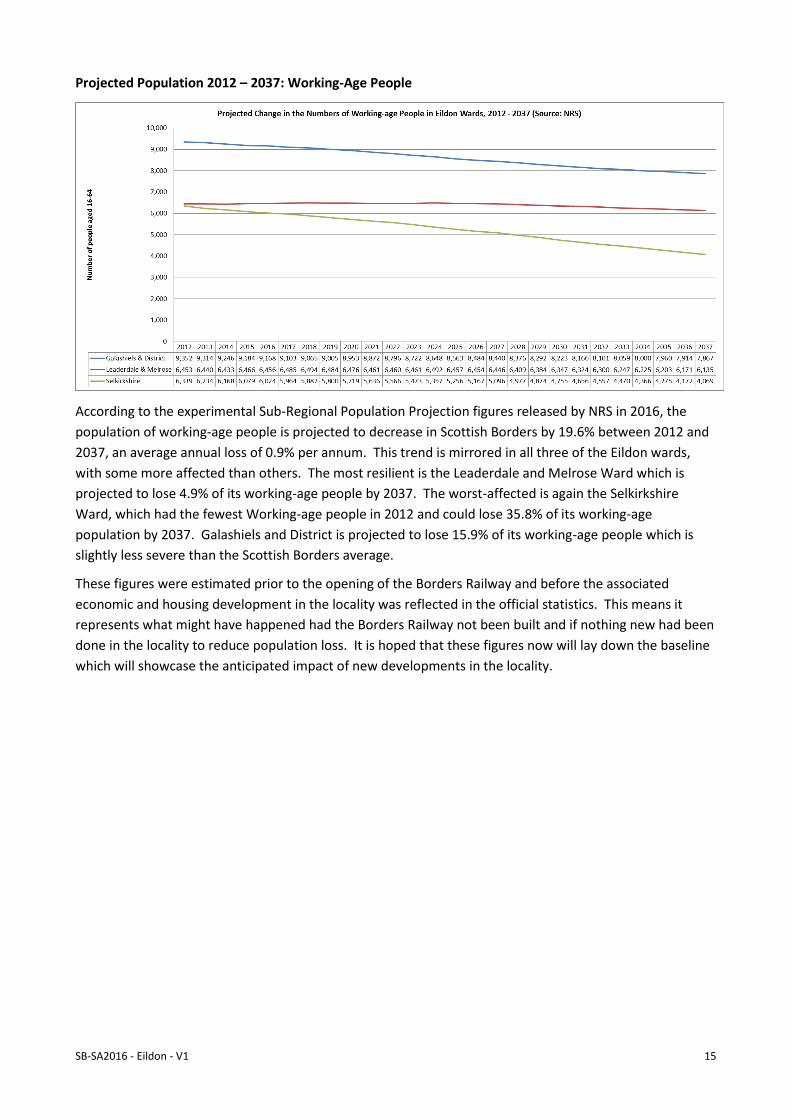
Projected Population 2012 – 2037: Working-Age People
According to the experimental Sub-Regional Population Projection figures released by NRS in 2016, the
population of working-age people is projected to decrease in Scottish Borders by 19.6% between 2012 and
2037, an average annual loss of 0.9% per annum. This trend is mirrored in all three of the Eildon wards,
with some more affected than others. The most resilient is the Leaderdale and Melrose Ward which is
projected to lose 4.9% of its working-age people by 2037. The worst-affected is again the Selkirkshire
Ward, which had the fewest Working-age people in 2012 and could lose 35.8% of its working-age
population by 2037. Galashiels and District is projected to lose 15.9% of its working-age people which is
slightly less severe than the Scottish Borders average.
These figures were estimated prior to the opening of the Borders Railway and before the associated
economic and housing development in the locality was reflected in the official statistics. This means it
represents what might have happened had the Borders Railway not been built and if nothing new had been
done in the locality to reduce population loss. It is hoped that these figures now will lay down the baseline
which will showcase the anticipated impact of new developments in the locality.

SB-SA2016 - Eildon - V1 16
Projected Population 2012 – 2037: Pensionable-Age People
According to the experimental Sub-Regional Population Projection figures released by NRS in 2016, the
pensionable-age population in Scottish Borders is forecast to increase by 60.5% between 2012 and 2037, an
average increase of 1.9% per annum. This means that, in this scenario, the numbers of over 65s might be
more than half as great again by 2037 as they are now, which would have a considerable impact on
provision of health and welfare services for older people in the region.
This trend is reflected in all three Wards in Eildon which are projected to see increases in their pensionable-
age populations by between 48% in Selkirkshire and a massive 91.7% in Leaderdale and Melrose, which
could see its number of pensioners almost double between 2012 and 2037. Numbers of pensioners could
increase in Galashiels and District by 57.8% in the same time period, again a substantial although slightly
below Scottish Average increase. These numbers are projected to occur because people are living longer
and Scottish Borders is arguably an attractive region in which to retire. However, the impact of the
increasing number of pensioners in the region can be mitigated by planning in advance to ensure that
services are in place to meet the anticipated need and by attracting more under 65s to the area to
rebalance the population age structure.

SB-SA2016 - Eildon - V1 17
Births
The overall Birth Rate in Scottish Borders has remained consistently below, but roughly in line with, the
Scottish trend since 1991. This is because a higher proportion of the Scottish Borders population is above
childbearing age than is normal for Scotland. The “Standardised” rate removes the effects of age and
shows that, considering just the population which is of childbearing age, Scottish Borders actually has a
higher birth rate than the Scottish average. However, the birth rate varies by locality and is currently
undergoing a downward fluctuation.
Birth rates are not released at locality level but the following timeline shows the crude number of births by
locality between 2001 and 2014. It shows that the number of births in Eildon has generally risen from 401
to 485 but that the downward trend is also evident in the most recent (2013) dataset. Slightly more girls
are born than boys, which is usual in a typical population distribution. This patterns is typical of several of
the localities in Scottish Borders.

SB-SA2016 - Eildon - V1 18
Marriages and Civil Partnerships
Scottish Borders has an older population structure than the Scottish average and this is reflected in the
marital status of its people. In general, Scottish Borderers are more likely to be married, divorced or
widowed than the Scottish average and less likely to be single. Numbers who are in a Civil Partnership are
proportionate with the Scottish average.
Annual information on numbers of marriages and Civil Partnerships are not publically available at Locality
level from National Records of Scotland but the 2011 Census provides detailed information on family and
households characteristics. As shown in the chart below, patterns of marital status in Eildon reflect a
younger population structure, with proportions of single people slightly higher than the Scottish Borders
average and proportions of married people correspondingly lower, although still not as much so as the
Scottish average.

SB-SA2016 - Eildon - V1 19
Deaths
Overall, death rates in Scotland have decreased between 1991 and 2014 as people continue to live longer,
with Scottish Borders mirroring the national trend. However, the overall death rate has been consistently
higher in Scottish Borders than the Scottish average due to the above-average age of the population in the
region. This is particularly true for females, due to the higher numbers and proportions of older women in
the population. When the Death Rate is standardised for the effects of age, the Death Rate in Scottish
Borders is actually lower than average as older people are living longer now than at any time in history.
Death rates are not available at Locality level but the table below shows that the crude numbers of deaths
in Eildon are showing a slight downward trend, particularly for females. The pattern in Eildon is slightly
different from the other localities, reflecting the younger age structure and the larger number of cases,
which has a smoothing effect on the timeline.

SB-SA2016 - Eildon - V1 20
Life Expectancy
Life Expectancy At Birth figures are calculated by using Mid-year Estimates and Mortality data to estimate
of how long, on average, a person born in a certain year would be expected to live for. They are subject to
random fluctuations in the number of deaths and the age at death in any given year, which can cause an
apparent “blip” in a time series trend. Also, estimates can vary depending on the section of data and the
geographical level used, and also on any revisions or corrections that are occasionally made to the base
data. Therefore, they are a useful summary of mortality rates and trends actually experienced over a given
time period but are not “set in stone” and should not be taken too literally.
According to the most recent figures released by National Records of Scotland for 2012-14 at Scottish
Borders level, female life expectancy at birth (82.5 years) was higher than male life expectancy (79.3 years),
and both were greater than the Scottish averages of 81.1 for female and 76.9 for male. Male life
expectancy at birth is improving more rapidly than female life expectancy at birth.
National Records of Scotland (NRS) routinely publishes figures on Life Expectancy on a 3-year rolling
average is Parliamentary Constituency level, of which two cover the Scottish Borders. However, more
useful figures were released on a 5-year rolling average at Intermediate Datazone, which were used by
Scottish Public Health Observatory (ScotPHO) for the purpose of informing health inequalities, as part of
the Health & Wellbeing Online Profiles Tool (OPT). Due to small numbers of cases, five years’ worth of data
were taken together in order to provide a viable statistical base at an Intermediate Datazone level of detail.
Inequalities in Male Life Expectancy within Eildon
Male Life Expectancy At birth is higher in Scottish Borders than the Scottish average and has improved since
2001.
Within the Scottish Borders, the male life expectancy by Intermediate Zone ranges from 74.7 years and
83.6 years, a difference of 8.9 years. The chart below shows disparities in male Life Expectancy at Birth
between the 29 Intermediate Datazones in Scottish Borders.
The five Intermediate Datazones with the lowest Male Life Expectancy in Scottish Borders are all wholly or
partially within Eildon and the bottom four are in Galashiels. This means that Galashiels has the lowest
SB-SA2016 - Eildon - V1 21
male life expectancy of any town in Scottish Borders and this is also well below the Scottish average. The
part of Galashiels with the lowest Male Life Expectancy, at only 74.7 years, is Galashiels West, which
includes the Balmoral, Gala Park and Scott Street/ Scott Crescent areas of the town. The residential
community of Langlee, which has high levels of Multiple Deprivation, has the second lowest Male Life
Expectancy in Scottish Borders.
Only one of the top 9 Intermediate Datazones with the best Male Life Expectancy scores is in Eildon: this is
Ettrick, Yarrow and Yair, with a score of 82.5 years. This means that there is a 7.8 year difference in Male
Life Expectancy between people living in the Ettrick and Yarrow Valleys and those living in the Galashiels
West area. The zone with the next best Male Life Expectancy in Eildon is the Earlston, Lauder and Stow
area, followed by the Melrose and Tweedbank area, which are adjacent rural areas. This indicates a split in
Male Life Expectancy between the town and the rural parts of the locality, which is a typical pattern for
Scottish Borders. Reasons for differences in Life Expectancy are not always clear as people tend to move
between localities during their lifetime. However, in areas where the turnover of residents is low and
proportions of pensioners are high, these health inequalities could have built up over a long period of time.
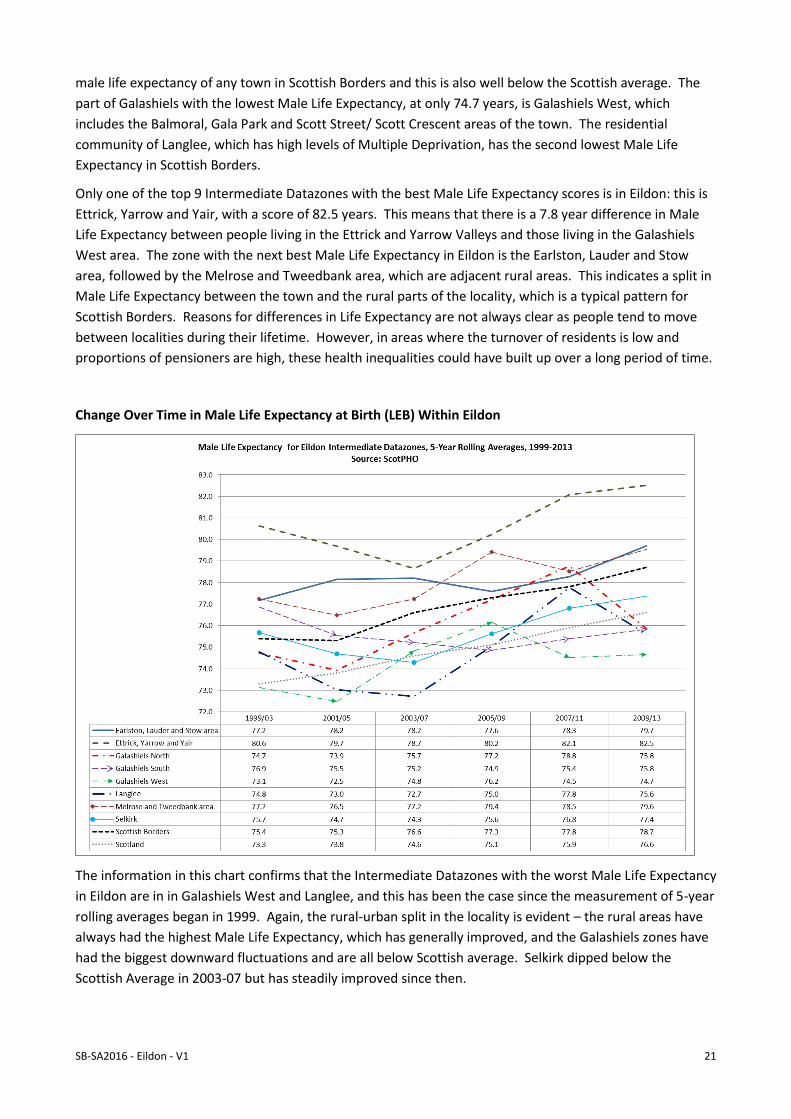
Change Over Time in Male Life Expectancy at Birth (LEB) Within Eildon
The information in this chart confirms that the Intermediate Datazones with the worst Male Life Expectancy
in Eildon are in in Galashiels West and Langlee, and this has been the case since the measurement of 5-year
rolling averages began in 1999. Again, the rural-urban split in the locality is evident – the rural areas have
always had the highest Male Life Expectancy, which has generally improved, and the Galashiels zones have
had the biggest downward fluctuations and are all below Scottish average. Selkirk dipped below the
Scottish Average in 2003-07 but has steadily improved since then.
SB-SA2016 - Eildon - V1 22
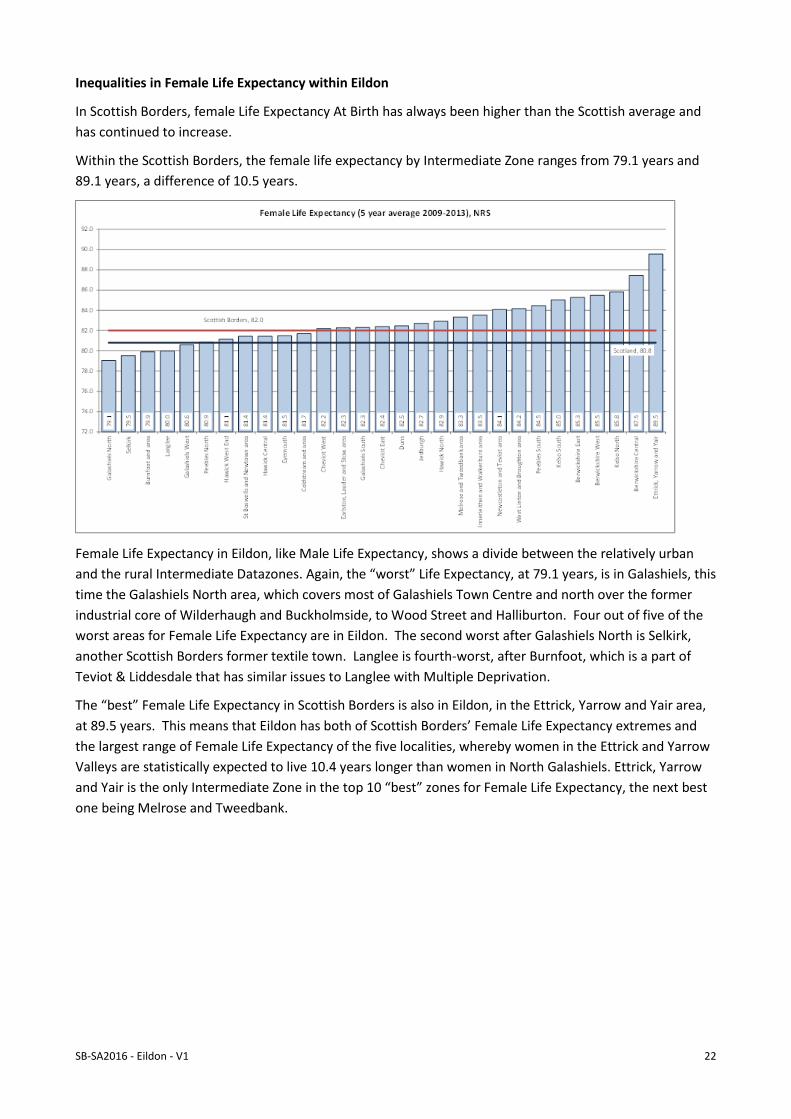
Inequalities in Female Life Expectancy within Eildon
In Scottish Borders, female Life Expectancy At Birth has always been higher than the Scottish average and
has continued to increase.
Within the Scottish Borders, the female life expectancy by Intermediate Zone ranges from 79.1 years and
89.1 years, a difference of 10.5 years.
Female Life Expectancy in Eildon, like Male Life Expectancy, shows a divide between the relatively urban
and the rural Intermediate Datazones. Again, the “worst” Life Expectancy, at 79.1 years, is in Galashiels, this
time the Galashiels North area, which covers most of Galashiels Town Centre and north over the former
industrial core of Wilderhaugh and Buckholmside, to Wood Street and Halliburton. Four out of five of the
worst areas for Female Life Expectancy are in Eildon. The second worst after Galashiels North is Selkirk,
another Scottish Borders former textile town. Langlee is fourth-worst, after Burnfoot, which is a part of
Teviot & Liddesdale that has similar issues to Langlee with Multiple Deprivation.
The “best” Female Life Expectancy in Scottish Borders is also in Eildon, in the Ettrick, Yarrow and Yair area,
at 89.5 years. This means that Eildon has both of Scottish Borders’ Female Life Expectancy extremes and
the largest range of Female Life Expectancy of the five localities, whereby women in the Ettrick and Yarrow
Valleys are statistically expected to live 10.4 years longer than women in North Galashiels. Ettrick, Yarrow
and Yair is the only Intermediate Zone in the top 10 “best” zones for Female Life Expectancy, the next best
one being Melrose and Tweedbank.

SB-SA2016 - Eildon - V1 23
Changes Over Time in Female Life Expectancy At Birth (LEB) in Eildon Intermediate Datazones
This Female Life Expectancy Timeline chart confirms similar patterns to Male Life Expectancy. Rural areas
have generally had the best Female Life Expectancy and are improving. Urban areas have often had below-
average Female Life Expectancy. Female Life Expectancy in Galashiels South has always had a slightly higher
Life Expectancy than other parts of Galashiels – this is the area south of the town centre, including
Glenfield, Netherdale and Abbotsford Road area, extending over Gala Hill and Boleside. It includes some
areas such as Mercat Cross/ Church Square and Huddersfield Street, which are areas of with relatively high
levels of Multiple Deprivation, showing that the relationship between Life Expectancy and location alone is
complicated.

SB-SA2016 - Eildon - V1 24
Migration, Ethnicity and National Identity
Migration
Information on migration is scarce and particularly difficult to measure at a sub-regional level. National
Records of Scotland recorded that, on a 3-year average between 2012-14, 4,047 people per year entered
the Scottish Borders and 3,845 left. This meant there was a net inflow of 202 people into Scottish Borders
per year. The 16-29 age-group accounted for the largest group of movers, both in and out of the region.
Ethnicity
The 2011 Census shows that the population of Scottish Borders is overwhelmingly White Scottish or White
Other British, with the latter (English, Welsh or Northern Irish) making up a significantly above-average
16.4% of the population. A below-average minority (3.5%) are White Non-British, and a further 1.2% are
from non-White groups, again well below the Scottish average. Eildon has the second lowest proportion of
White Other British out of the five localities and a slightly higher proportion of White Scottish but is
otherwise similar to the Scottish average in terms of its ethnic make-up.

SB-SA2016 - Eildon - V1 25
Country of Birth
The 2011 Census found that the Scottish Borders population’s country of birth corresponds with its
ethnicity, with the vast majority of the population coming either from Scotland or England. A small but
around average minority were born elsewhere in the UK and the proportion born in other EU countries is
also around average. The proportion coming from outside the EU is smaller than average.
The pattern within Eildon corresponds with its ethnicity, with a slightly higher proportion of the population
born in Scotland than the Scottish Borders average and a slightly lower proportion born in England. Other
nationalities are around the Scottish average.

SB-SA2016 - Eildon - V1 26
Length of Residence in UK
5,802 people in Scottish Borders households recorded in the 2011 Census that they were born outside the
UK. Of these, almost half have been resident in Scottish Borders for more than 10 years, well above the
Scottish average. Only around 600 have been resident in the UK for less than 2 years which is a much lower
proportion than the Scottish average. This suggests that, on the whole, people who arrived in the Scottish
Borders as migrants are more integrated and more likely to be long-term residents in the community than
on the Scottish average.
The non-UK population in the Eildon locality is less likely to be in very long-term residence and more likely
to be in very short-term residence than the Scottish Borders average. Of the 1,974 people who were born
outside the UK, an above-average 24.5% had been resident for 2 - 5 years and the proportion who have
been resident for less than 2 years is also higher than average. This provides some evidence that pockets of
economic migration exist in the locality.

SB-SA2016 - Eildon - V1 27
National Identity
The findings on National Identity mirror the ethnicity of the region, with the vast majority identifying with a
UK identity. Scottish Borders has a stronger Anglo-Scottish identity than other parts of Scotland, reflecting
the region’s location on the Scotland-England border. An above-average proportion of Eildon residents
identified as Scottish only and a below-average proportion identified as English only. The proportion with a
non-UK identity is slightly above the Scottish Borders average, which reflects the findings on ethnicity and
national identity in the locality.

SB-SA2016 - Eildon - V1 28
Religion
Although 60% of the Scottish population in the 2011 Census regarded themselves as Christians, a higher
proportion stated that they had no religion than stated they belonged to the Church Of Scotland. In
Scottish Borders, this trend is reversed, with a higher proportion reporting that they belonged to Church Of
Scotland than reporting to have no religion. Proportions of Roman Catholics are much lower in Scottish
Borders than the Scottish Average.
Eildon had an above-average proportion of people in the 2011 Census who said they had no religion and
the second-smallest proportion who stated they were Church Of Scotland. Like other parts of Scottish
Borders, other religions such as Muslim, Buddhist, Hindu and Jewish were very much in the minority and
Sikhs were not represented at all. This reflects the Anglo-Scottish religious and secular diversity in the
Scottish Borders region and its lack of multicultural diversity.

SB-SA2016 - Eildon - V1 29
Use of English and Scottish languages
The vast majority of people aged 3 and over in Scottish Borders recorded in the 2011 Census that they
spoke English very well. Around 1,246 people recorded little or no proficiency in English; nevertheless,
Scottish Borders has lower proportions of non-English speakers than the Scottish average and higher
proportions who use only English in the home. There is some overlap in the responses between those who
speak English and those who use other languages in the home, suggesting that most of those who use a
language other than English in the home are still able to speak English well. Polish accounts for about a
third of the speakers of languages other than English, Scots or Gaelic listed in the Census and there are
1,161 Polish speakers in Scottish Borders. 228 people use British Sign language in Scottish Borders, about
1.1% of the population, similar to the Scottish average.
The vast majority of people aged over 3 in Eildon are proficient in English and use it in the home.
Nevertheless, 749 people said that they had little or no proficiency in English. 453 people use Polish in the
home and 77 use British Sign Language (BSL). The Census shows that Gaelic is barely present in Eildon,
with 112 people able to speak it at all and only 10 being fluent enough to use it in the home. 800 people
said in the Census that they speak a language in the home other than Scots, Gaelic, Polish or BSL, showing
that there is some cultural diversity in the locality, although at a very low level.

SB-SA2016 - Eildon - V1 30
Household Profile
Household Structure
The most prevalent type of household structure in Scottish Borders and Scotland recorded in the 2011
Census was the household headed by a married (or Civil Partnered) couple, followed by the one-person
household of any age. However, Scottish Borders has higher proportions of households where the resident
is/ all residents are aged over 65 than the Scottish average and lower proportions of single resident
households aged under 65.
In Eildon, the different demographic, larger population base and different pattern of economic activity
mean that the locality is less typical of the older and more traditional family structures of other Scottish
Borders localities and is more typical of the Scottish average. Proportions of single pensioner households,
households where everybody is aged 65 plus and households led by a married couple are all lower than the
Scottish average. Proportions of single person households of any age but particularly aged under 65 and
cohabiting couples with children are all higher. Some traits of Eildon, like the Scottish Borders average,
remain different from the Scottish average, with lower proportions of lone parent families and higher rates
of marriage amongst couples without children.

SB-SA2016 - Eildon - V1 31
Household Size
Eildon has the second highest proportion of one person households of the five localities and the lowest
proportion of two person households than the Scottish average. Along with Tweeddale, it has amongst the
highest proportions of households with three or four people out of the five localities.

SB-SA2016 - Eildon - V1 32
Tenure of Households
61.5% of households in Scottish Borders are owner-occupiers: this is the most typical tenure type in the
region, although around average for Scotland. Scottish Borders has a more active private rented sector
than the Scottish average and also a higher proportion who live “rent free”, according to the 2011 Census.
This may include those in tied housing, whose accommodation is provided with their job; this arrangement
is typically found in the agricultural and rural estate communities that are more common in Scottish
Borders than elsewhere in Scotland.
Eildon has the lowest percentage of householders out of the 5 localities who own their home outright, the
highest proportion who own with a mortgage or loan and the second highest who rent from a social
housing provider. This reflects the younger age structure of its households and the larger social rented
sector in the locality. 3,852 Eildon householders are social tenants, which is, as expected, by far the highest
number of the five localities.

SB-SA2016 - Eildon - V1 33
Car or Van Availability
In a region where 47% of the population live in a rural community and with limited public transport, car
ownership is considered a necessary for most families in Scottish Borders to access an adequate range of
services for their needs. Correspondingly, the 2011 Census found that levels of car ownership in Scottish
Borders were higher than the Scottish average, although not as universally high as might be expected, with
20% of households still having no access to a car or van. A further 45.3% of households in Scottish Borders
have one car per household, which invariably limits access of spouses and other family members to the
vehicle. This means that, despite high levels of car ownership in the region, up to 62% of households in
Scottish Borders contain family members who are at least partially dependent on public transport or lift-
sharing for their transport needs.
Eildon is a relatively urbanised locality by Scottish Borders standards, even though its accessible small
towns are in a rural setting and it has large tracts of farmland and isolated valleys. Accordingly, it has the
second highest proportion of households out of the 5 localities with no access to a car and the second
lowest proportion of households with one or more cars although car ownership is still high by Scottish
standards.

SB-SA2016 - Eildon - V1 34
Central Heating Type
Although the vast majority of domestic homes in Scotland now have some form of Central Heating, the
choice of fuels available to householders differs greatly between urban and rural parts of the country and
can significantly affect the affordability of the household to adequately heat their home.
Gas central heating is the fuel of choice for 75% of Scottish households as it is the cheapest and most
convenient to run. It is generally available in urban areas but, in smaller settlements, tends to be restricted
to the main streets and older parts of the settlement. In Scottish Borders, only 60% of households use
mains gas, reflecting the larger proportion of households that are not on the mains gas network.
For the remaining 40%, the choice is split predominantly between electric and oil-fired heating: oil, in
particular, is more than twice as commonly used in Scottish Borders than elsewhere in Scotland. Electric
heating, although the cheapest to install, is the most expensive heating type to run, even on an economy
tariff.
A higher-than average minority of households in Scottish Borders are increasingly investing in other types
of heating such as wood, biofuels and solar or wind power, sometimes in combination with more
traditional fuels, in an effort to reduce their heating bills and their consumption of fossil fuels.
A small minority of households in Scottish Borders have no central heating and rely on portable heaters or
coal fires to heat individual rooms in their home, which is a more expensive and less adequate method of
heating the house and protecting it from damp than central heating.
Eildon has a slightly above-average proportion of occupied households with Gas Central Heating for
Scottish Borders, which is surprisingly low given that the main towns would be expected to be on the gas
network. Eildon has the highest reliance on electric central heating of the five localities and by far the
lowest use of oil and of solid fuel central heating systems of the five localities. These figures do not include
the option that many older properties might still have use of a working coal fire and there are no
“Smokeless Zones” in the Scottish Borders.

SB-SA2016 - Eildon - V1 35
Scottish Borders and the Scottish Index of Multiple Deprivation (SIMD)
The Scottish Index of Multiple Deprivation (SIMD) identifies small area concentrations of multiple
deprivation in Scotland.
The SIMD uses administrative units of geography called “datazones” as a standard measure to count the
population at a neighbourhood level of detail. A datazone is a neighbourhood containing around 750
people and there is a complete network of 6,505 datazones which cover all parts of Scotland, meaning that
every neighbourhood in Scotland can be measured with equal parity. 130 of these datazones are in the
Scottish Borders. The datazone geography and the SIMD are in the process of being updated for 2016, so
the 2012 SIMD based on the original 2001 datazones is still in current use.
The 2012 SIMD collected 38 demographic indicators associated with all measurable aspects of social
deprivation across 7 domains: Income Deprivation, Employment Deprivation, Health Deprivation, Education
Deprivation, Geographic Access to Services Deprivation, Housing Deprivation and Deprivation Due to Crime.
The data were collected, scored and combined for each domain, then the combined scores were factored
down to a single weighted Overall Deprivation score. Some of the domains were comparable with previous
releases of SIMD, although some were not, due to changes in methodology as the SIMD has evolved since
2002.
The summarised, weighted scores for each datazone in Scotland, for Overall Deprivation and for each of the
7 domains, were then ranked between 1 and 6,505, where the most deprived datazone in Scotland is
ranked 1 and the least deprived datazone is ranked 6,505. The rankings reflect only relative deprivation
and the SIMD cannot be used to determine how much more deprived one data zone is than another: for
example, it is not necessarily true to say that datazone X, ranked 50, is twice as deprived as data zone Y,
ranked 100.
The results of this process, although condensed, nevertheless yield a large quantity of data for each
datazone. In order to manage this further, the rankings are grouped into fifths (quintiles), tenths (deciles)
or twentieths (vigintiles) and Local Authority areas are summarised in terms of their share of the most-
deprived vigintiles, deciles and quintiles (or multiples thereof) in Scotland.
Using this process, the 2012 SIMD showed that the most deprived areas in Scottish Borders were still as
deprived as they were in 2009, relative to the rest of Scotland. Furthermore, as other regions in Scotland
succeed in decreasing inequality in their more deprived localities (particularly in Glasgow City), this had a
displacement effect that can make localities in Scottish Borders appear relatively more deprived than
before. As relative deprivation in other regions has decreased, relative deprivation in a number of Scottish
Borders localities has shown a small increase since the SIMD started in 2002. In 2012, Scottish Borders had
5 (or 0.5%) of Scotland’s “most-deprived 15%” data zones, compared with 5 (0.5%) in 2009, 3 (0.3%) in
2006 and 2 (0.2%) in 2004.
This concept of relative deprivation adds impetus for Scottish Borders to tackle deprivation and reduce
inequalities with at least the same level of commitment as is being deployed in other regions. The most
deprived data zone in Scottish Borders is still S01005382 (Central Burnfoot, Hawick). The other 4 “15% most
deprived in Scotland” datazones in Scottish Borders are also in Burnfoot, Hawick and in Langlee, Galashiels.
This is the same as SIMD 2009.
The table below lists the most deprived data zones in the Scottish Borders. As a guide, datazones in Decile 1
are within the 10% most-deprived in Scotland, datazones in Vigintile 1 are within the 5% most-deprived in
Scotland and datazones in vigintiles 1-3 are within the 15% most-deprived in Scotland. Most notable are
the 5 datazones in the Scottish Borders that are recognised by Scottish Government as being amongst the
15% most deprived in Scotland. These 5 datazones account for 3.2% of the Scottish Borders population.

SB-SA2016 - Eildon - V1 36
Eight of the more-deprived datazones in Scottish Borders listed below are in Eildon and all of these are in
Galashiels. Additionally, two out of Langlee’s three datazones are in the top 10% most-deprived in
Scotland. This shows that over half of Galashiels is considered to be within the 20% most-deprived
localities in Scotland. This does not mean there is no multiple deprivation elsewhere in Eildon. However,
the SIMD works best in urban areas where there are concentrations of people with indications of multiple
deprivation. The dispersal of the population in rural parts of the locality means that any indications of
multiple deprivation can be difficult to detect.
Data Zone Data Zone Name SIMD 2012
Rank
SIMD
2012 -
Decile
SIMD
2012 -
Vigintile
Total
Census
Population
: 2011
S01005382 Hawick - Central Burnfoot* 279 1 1 834
S01005426 Galashiels - Langlee Dr* 481 1 2 769
S01005425 Galashiels - Kenilworth Ave
Langlee*
487 1 2 980
S01005378 Hawick - South Burnfoot* 607 1 2 808
S01005381 Hawick - West Burnfoot* 694 2 3 641
S01005369 Hawick - Drumlanrig/ Wellogate 1012 2 4 974
S01005380 Hawick - East Burnfoot 1199 2 4 671
S01005400 Selkirk – Bannerfield 1305 3 5 1078
S01005427 Galashiels – Huddersfield 1596 3 5 779
S01005373 Hawick - Princes St / Wilton 1639 3 6 724
S01005367 Hawick - The Motte 1653 3 6 751
S01005428 Galashiels - Hawthorn Rd Langlee 1669 3 6 1049
S01005431 Galashiels - Balmoral Rd 1681 3 6 667
S01005429 Galashiels - Old Town 1770 3 6 719
S01005368 Hawick – Crumhaugh 1860 3 6 675
S01005377 Hawick - Silverbuthall Rd 1970 4 7 863
S01005487 Eyemouth - Seafront/ harbour 2097 4 7 733
S01005416 Kelso - Poynder Park 2188 4 7 978
S01005434 Galashiels - Town Centre 2229 4 7 807
S01005374 Hawick – Trinity 2329 4 8 870
S01005488 Eyemouth - Haymons Cove 2378 4 8 792
S01005485 Eyemouth – Gunsgreen 2396 4 8 851
S01005372 Hawick - Bridge St/ Town Centre 2464 4 8 864
S01005458 Peebles - Dalatho St 2493 4 8 716
S01005408 Newtown St Boswells - East 2575 4 8 579
S01005433 Galashiels - Thistle St 2578 4 8 850
* Part of the 15% most deprived data zones in Scotland

SB-SA2016 - Eildon - V1 37
Eildon Datazones by Deprivation Vigintile
The following table gives more details from the 2012 Scottish Index Of Multiple Deprivation for the Eildon
locality. Numbers of 10 or below indicate that the datazone has above-average Multiple Deprivation for
Scotland. Numbers of 11 or above indicate below-average relative Multiple Deprivation for Scotland. The
higher the number, the less relatively-deprived the datazone in each domain. Vigintiles 1-3 indicate that
the datazone is within the 15% most-deprived in Scotland for that domain. Vigintiles 18-20 indicate that
the datazone is within the 15% least-deprived in Scotland.
The root of inequality is generally understood to be poverty and the SIMD interrelates what it considers to
be the key causes and effects of poverty, such as lack of income or employment, poor health and poor
educational outcomes. These have a compounding effect and lead to a further spiral of multiple
deprivation, until the affected groups are less able to enjoy being included in everyday activities and life
choices that other people take for granted.
A low Vigintile score in one of the domains does not necessarily mean that the datazone is “deprived”, nor
is it necessary a bad thing, particularly with reference to the “Access Deprivation” domain. The purpose of
the SIMD is to “flag up” domains and small areas where a deprivation indicator may give rise to inequalities
for vulnerable residents, or those suffering from other indications of deprivation.

SB-SA2016 - Eildon - V1 38
Datazone Name (2001)
Over
-all
Inc-
ome
Employ-
ment Health
Education
Skills &
Training Crime
Hous
-ing
Acc-
ess
Kenilworth Ave Langlee 2 2 3 1 1 3 8 12
Langlee Dr 2 3 2 2 2 5 5 10
Selkirk - Bannerfield 5 7 5 2 6 6 6 5
Galashiels Huddersfield St 5 7 5 2 6 3 12 18
Hawthorn Rd Langlee 6 7 6 4 5 10 8 5
Galashiels - Balmoral Rd 6 7 6 5 5 6 6 9
Galashiels - Old Town 6 9 8 1 10 1 6 20
Galashiels - Town Centre 7 8 10 5 7 1 6 20
Newtown St Boswells - East 8 9 6 7 10 18 10 10
Galashiels - Thistle St 8 9 8 4 8 16 7 17
Selkirk - Town Centre 9 8 9 5 11 9 15 20
Selkirk - Shawburn Rd 9 11 8 5 11 10 11 12
Galashiels - Wood St 9 11 9 6 9 10 14 8
Tweedbank - North 10 14 10 5 11 20 15 4
Earlston - East 11 11 9 8 12 15 12 14
Tweedbank - South 11 13 12 6 13 15 18 3
Galashiels - Balmoral Pl 12 11 13 7 10 11 9 17
Selkirk - Heatherlie 13 11 12 10 14 14 15 16
Selkirk - Shawpark Rd 13 12 12 6 15 14 11 16
Galashiels -St Peters Sch area 13 12 12 8 15 8 17 15
Stow 13 14 13 9 17 12 15 4
Yarrowford/ Yarrow Feus area 13 15 17 16 14 18 12 1
Oxton & Lauder Landward 13 16 18 12 16 19 14 1
Ettrick Ettrickbridge & around 13 18 17 14 17 16 16 1
Melrose - Market Square &
Dingleton Rd 14 13 11 10 19 18 15 11
Newtown St Boswells – West 14 13 13 13 14 18 13 8
Melrose Greenyards &
Newstead 14 13 14 8 17 17 17 11
Heriot/ Fountainhall/ Stow
Landward 14 18 17 16 17 19 14 1
Galashiels - E – Glenfield 15 15 13 11 13 6 16 15
Gattonside/Darnick/Dingleton
Apts & Fairways area 15 15 15 11 19 19 19 3
Bowden/ Charlesfield area 15 17 17 14 15 15 11 2
Earlston Landward 15 17 18 12 18 20 14 2
Midlem/ Lilliesleaf/Ashkirk 15 18 17 12 20 20 17 1
Galashiels – Netherdale 16 14 18 10 15 16 16 8
Lauder – North 17 15 18 15 16 20 19 7
Selkirk - Hillside Terr 18 17 16 12 18 20 18 17
Earlston -West 18 17 18 11 13 18 15 15
Lauder – South 18 17 19 11 17 18 14 17
SB-SA2016 - Eildon - V1 39
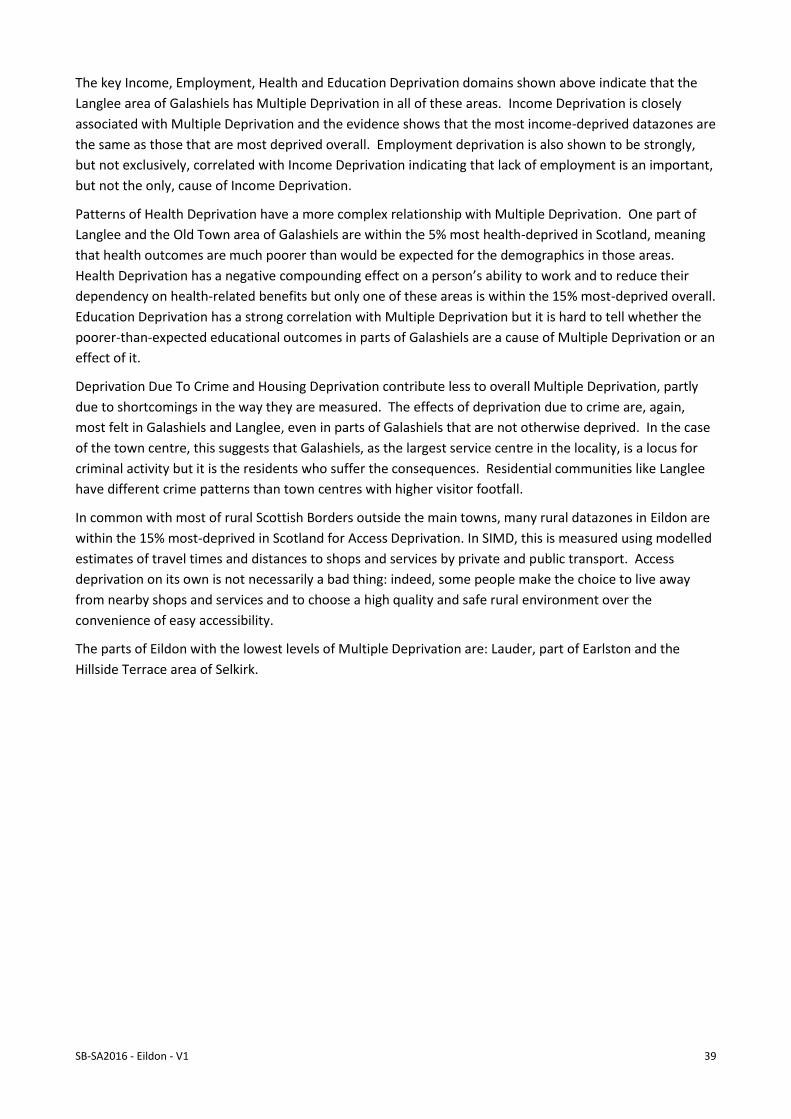
The key Income, Employment, Health and Education Deprivation domains shown above indicate that the
Langlee area of Galashiels has Multiple Deprivation in all of these areas. Income Deprivation is closely
associated with Multiple Deprivation and the evidence shows that the most income-deprived datazones are
the same as those that are most deprived overall. Employment deprivation is also shown to be strongly,
but not exclusively, correlated with Income Deprivation indicating that lack of employment is an important,
but not the only, cause of Income Deprivation.
Patterns of Health Deprivation have a more complex relationship with Multiple Deprivation. One part of
Langlee and the Old Town area of Galashiels are within the 5% most health-deprived in Scotland, meaning
that health outcomes are much poorer than would be expected for the demographics in those areas.
Health Deprivation has a negative compounding effect on a person’s ability to work and to reduce their
dependency on health-related benefits but only one of these areas is within the 15% most-deprived overall.
Education Deprivation has a strong correlation with Multiple Deprivation but it is hard to tell whether the
poorer-than-expected educational outcomes in parts of Galashiels are a cause of Multiple Deprivation or an
effect of it.
Deprivation Due To Crime and Housing Deprivation contribute less to overall Multiple Deprivation, partly
due to shortcomings in the way they are measured. The effects of deprivation due to crime are, again,
most felt in Galashiels and Langlee, even in parts of Galashiels that are not otherwise deprived. In the case
of the town centre, this suggests that Galashiels, as the largest service centre in the locality, is a locus for
criminal activity but it is the residents who suffer the consequences. Residential communities like Langlee
have different crime patterns than town centres with higher visitor footfall.
In common with most of rural Scottish Borders outside the main towns, many rural datazones in Eildon are
within the 15% most-deprived in Scotland for Access Deprivation. In SIMD, this is measured using modelled
estimates of travel times and distances to shops and services by private and public transport. Access
deprivation on its own is not necessarily a bad thing: indeed, some people make the choice to live away
from nearby shops and services and to choose a high quality and safe rural environment over the
convenience of easy accessibility.
The parts of Eildon with the lowest levels of Multiple Deprivation are: Lauder, part of Earlston and the
Hillside Terrace area of Selkirk.

SB-SA2016 - Eildon - V1 40
The table below shows the number of data zones and 2011 Census population by each of the deciles in the
Scottish Borders. It shows that 5.4% of the datazones in Scottish Borders and 5% of the Scottish Borders
population are located within the 20% most-deprived in Scotland. This does not necessarily mean that
everyone in these deprived areas is deprived but it gives an indication of the size and scale of the areas in
Scottish Borders that could be targeted in interventions aimed at reducing inequality in the region.
SIMD 2012 Data zones 2011 Census Population
Decile Count % Number %
1 (most deprived) 4 3.10% 3,391 3.0%
2 3 2.30% 2,286 2.0%
3 8 6.20% 6,442 5.7%
4 11 8.50% 8,903 7.8%
5 19 14.60% 16,804 14.8%
6 24 18.50% 20,484 18.0%
7 26 20.00% 23,970 21.1%
8 26 20.00% 24,320 21.4%
9 8 6.20% 6,371 5.6%
10 (least deprived) 1 0.80% 899 0.8%
Scottish Borders 130 100.00% 113,870 100.0%
The graph below shows the distribution of the population by each decile.
The map on the following page shows the 130 data zones in the Scottish Borders by their SIMD decile
ranking within the Scottish context.
3,3912,286
6,442
8,903
16,804
20,484
23,970 24,320
6,371
899
0
5,000
10,000
15,000
20,000
25,000
30,000
1 (4) 2 (3) 3 (8) 4 (11) 5 (19) 6 (24) 7 (26) 8 (26) 9 (8) 10 (1)
SIMD Decile (Number of Data zone in decile)
2011 Census Population in the Scottish Borders by Scottish Index of Multiple Deprivation 2012 Decile
Most Deprived Least Deprived

SB-SA2016 - Eildon - V1 41

SB-SA2016 - Eildon - V1 42
Economy and Income
Road Conditions
The Scottish Borders Household Survey 2015 found that almost 70% of the respondents were ‘Very
Dissatisfied / Fairly Dissatisfied’ with the speed of repair to their local damaged roads. People in Eildon had
a slightly lower level of satisfaction compared to the Scottish Borders.
Town Centre Retail Activity
Scottish Borders Council has undertaken a range of work to support our town centres, including investing in
recent major projects such as the Selkirk Conservation Area Regeneration Scheme, Kelso Townscape
Initiative, and the Galashiels Inner Relief Road project. The Council also undertakes a range of monitoring
work, and some of the results of our monitoring are set out below.
Whilst retail is a key component of our town centres’ offer, other uses are key to town centre vitality. To
reflect this, the council has recently reviewed its town centres policies to support a mix of footfall
generating uses.
Footfall
The Scottish Borders Council conducts an annual survey of footfall in the main towns within the Scottish
Borders. The table below shows weekly footfall between 2012 and 2015 for Galashiels, Peebles, Kelso,
Hawick, Melrose, Jedburgh, Selkirk, Eyemouth and Duns. Between 2015 and 2015, the footfall in town
centres dropped by 7%. The greatest changes were in Kelso with an increase of 27%, this may be due to
major town centre generation, the and in Hawick with a drop of 42%. In 2014, Melrose experienced a
significant drop in footfall, which recovered in 2015.
Berwickshire Cheviot Eildon Teviot Tweeddale Scottish Borders
Very Satisfied / Fairly Satisfied 21.8% 26.8% 20.3% 19.1% 17.2% 21.1%
Very Dissatisfied / Fairly Dissatisfied 68.8% 64.5% 69.3% 71.7% 74.7% 69.7%
0.0%
20.0%
40.0%
60.0%
80.0%
Satisfaction with: Speed of repair to
your local damaged roads
Source: SBHS 2015

SB-SA2016 - Eildon - V1 43
The graph below shows the weekly footfall as a rate per 1000 town population for 2015. The average for
Scottish Borders towns was 713 in 2015. The graph shows that Melrose had the highest higher footfall rate
per 1000 (1,445) and that Hawick experienced the lowest rate (311). The towns with the highest rates,
Melrose, Peebles and Kelso are associated with tourist activity.
https://www.scotborders.gov.uk/info/20051/plans_and_guidance/124/planning_research
Galashiels Peebles Kelso Hawick Melrose Jedburgh Selkirk Eyemouth Duns
2012 8380 7940 4360 7480 3430 2900 2660 2220 1710
2013 8220 7140 4130 6200 3390 2700 2420 1880 1600
2014 7930 7610 4980 3750 990 2610 2090 2150 1780
2015 8180 7930 5550 4360 3550 2460 2350 2270 1630
0
1000
2000
3000
4000
5000
6000
7000
8000
9000
Average Weekly Footfall 2012-2015, SBC
1,445 924 814 646 641 621 599 421 311
Town Average: 713
0
200
400
600
800
1,000
1,200
1,400
1,600
Melrose Peebles Kelso Galashiels Eyemouth Jedburgh Duns Selkirk Hawick
Average Weekly Footfall in 2015 per 1000 Town Population, SBC and NRS

SB-SA2016 - Eildon - V1 44
Retail Vacancies
Scottish Borders Council conducts a bi-annual survey of retail vacancies for the towns with a population of
1,000 or more. In summer 2015 there were 152 vacant units out of 1,434 in the Scottish Borders, equal to
11%. This was a slight improvement in the vacancy rate compared to the 12% vacancy rate recorded in the
winter 2014 survey. In summer 2015 Chirnside had the highest vacancy rate of 30% whereas Earlston, West
Linton, St. Boswells and Tweedbank had no vacancies. For both winter 2014 and summer 2015, the largest
towns, Hawick and Galashiels, had a vacancy rate of 11% or more.
https://www.scotborders.gov.uk/download/downloads/id/1639/retail_survey.pdf
Settlement Number of
units
Number of
vacant units
Summer 2015
retail unit
vacancy rate
Winter 2014
retail unit
vacancy rate
Chirnside 10 3 30% 27%
Galashiels 243 43 18% 18%
Newtown St Boswells 11 2 18% 25%
Galashiels 2nd * 45 7 16% 11%
Hawick 251 35 14% 16%
Duns 63 6 13% 8%
Coldstream 48 6 12% 12%
Jedburgh 91 10 11% 9%
Selkirk 91 10 11% 16%
Lauder 19 2 11% 11%
Eyemouth 70 5 7% 9%
Peebles 145 9 6% 7%
Kelso 165 9 5% 9%
Melrose 83 3 4% 3%
Innerleithen 51 2 4% 4%
Earlston 22 0 0% 0%
West Linton 12 0 0% 0%
St Boswells 11 0 0% 0%
Tweedbank 3 0 0% 0%
TOTAL 1434 152 11% 12%
* Two centres are monitored in Galashiels, the town centre, and a second centre at Wilderhaugh.
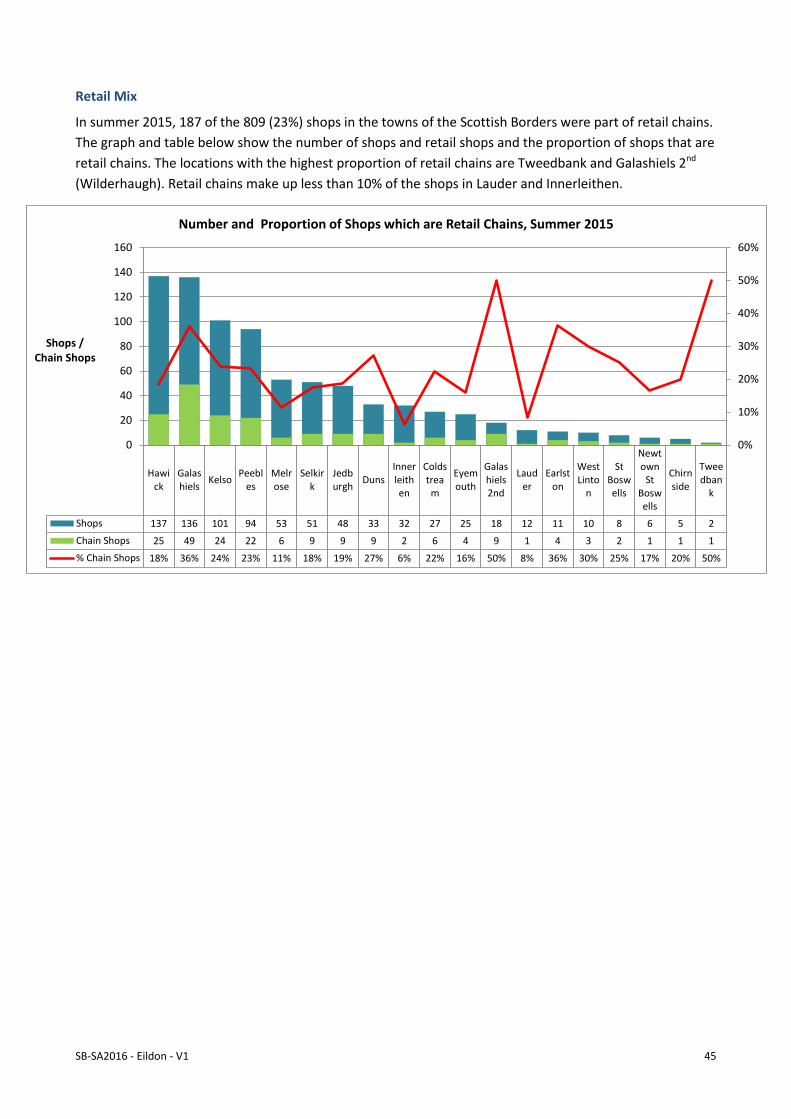
SB-SA2016 - Eildon - V1 45
Retail Mix
In summer 2015, 187 of the 809 (23%) shops in the towns of the Scottish Borders were part of retail chains.
The graph and table below show the number of shops and retail shops and the proportion of shops that are
retail chains. The locations with the highest proportion of retail chains are Tweedbank and Galashiels 2nd
(Wilderhaugh). Retail chains make up less than 10% of the shops in Lauder and Innerleithen.
Hawick
Galashiels
KelsoPeebl
esMelrose
Selkirk
Jedburgh
DunsInnerleithen
Coldstream
Eyemouth
Galashiels2nd
Lauder
Earlston
WestLinto
n
StBoswells
Newtown
StBoswells
Chirnside
Tweedban
k
Shops 137 136 101 94 53 51 48 33 32 27 25 18 12 11 10 8 6 5 2
Chain Shops 25 49 24 22 6 9 9 9 2 6 4 9 1 4 3 2 1 1 1
% Chain Shops 18% 36% 24% 23% 11% 18% 19% 27% 6% 22% 16% 50% 8% 36% 30% 25% 17% 20% 50%
0%
10%
20%
30%
40%
50%
60%
0
20
40
60
80
100
120
140
160
Shops / Chain Shops
Number and Proportion of Shops which are Retail Chains, Summer 2015

SB-SA2016 - Eildon - V1 46
Claimant Count
Within the Scottish Borders, the proportion of working age people claiming either JSA or the
unemployment related UC in March 2016 ranged from 0.9% for the Leaderdale and Melrose ward to 2.7%
for Galashiels and District, Hawick and Hermitage and Hawick and Denholm. Within the Eildon area,
Galashiels and District had 250 claimants (2.7%), Selkirkshire had 110 claimants (1.7%) and Leaderdale and
Melrose with 55 claimants (0.9%).
Claimant count by multi-member ward, March 2016
Source: ONS
The chart below shows the changes in JSA claimants for each of the localities between 2007 and 2016.
Across the localities the numbers claiming jobseeker’s allowance has fluctuated over the past ten years,
with the highest rates consistently in Teviot and Liddesdale and the lowest in Tweeddale. Unemployment
peaked in 2011-2012 owing to the recession. Eildon has consistently had a slightly higher rate of JSA
claimants compared to the Scottish Borders.
Number Rate (%) Number Rate (%)
Galashiels and District 250 2.7 East Berwickshire 105 1.5
Hawick and Hermitage 170 2.7 Mid Berwickshire 90 1.5
Hawick and Denholm 160 2.7 Jedburgh and District 75 1.5
Scottish Borders 1,260 1.8 Tweeddale West 75 1.3
Selkirkshire 110 1.7 Tweeddale East 65 1.0
Kelso and District 100 1.7 Leaderdale and Melrose 55 0.9
2007 2008 2009 2010 2011 2012 2013 2014 2015 2016
Berwickshire 1.7 1.3 2.2 3.1 2.7 2.8 2.7 2.3 1.5 1.1
Cheviot 1.4 1.1 2.0 3.0 3.0 2.8 2.6 2.6 1.8 1.1
Eildon 1.4 1.3 2.6 3.3 3.4 3.7 3.5 3.0 1.9 1.4
Teviot and Liddesdale 2.2 1.5 3.2 3.8 4.3 4.3 3.8 3.4 2.7 2.1
Tweeddale 1.0 0.8 1.5 2.2 2.4 2.5 2.1 1.8 1.1 1.0
Scottish Borders 1.5 1.2 2.3 3.1 3.2 3.3 3.0 2.7 1.8 1.4
0
0.5
1
1.5
2
2.5
3
3.5
4
4.5
5
Re
sid
en
ce-b
ase
d p
rop
ort
ion
(%
)
Localities based Jobseeker's Allowance claimants, 2007-2016

SB-SA2016 - Eildon - V1 47
Public View of Scottish Borders Employment Opportunities
The 2015 Scottish Borders Household Survey asked respondents how important they thought certain
actions would be to improving employment opportunities in the Scottish Borders. Within Eildon slightly
more people were interested in ‘Bringing jobs to the area’, ‘Getting more young people in to work’, and
‘Getting more adults in to work’ compared to the Scottish Borders.
A higher proportion of people identify ‘barriers’ to getting a job or securing a better job in Eildon compared
to the Scottish Borders.
Bringing jobs to the areaGetting more young
people into workCreating more
apprenticeshipsGetting more adults in to
workAssistance with startingup your own business
Eildon 73.3% 61.7% 49.0% 52.0% 30.5%
Scottish Borders 72.8% 61.1% 51.5% 49.8% 30.7%
0.0%
10.0%
20.0%
30.0%
40.0%
50.0%
60.0%
70.0%
80.0%
Proportion of people who think the following actions are VERY IMPORTANT/ IMPORTANT to improving employment opportunities in the Scottish Borders
Source: SBHS 2015
Lack of jobopportunities with
decent pay
Lack of relevant jobopportunities
Transport problemsLack of affordable
childcareLack of training Lack of qualification
Eildon 25.7% 25.5% 5.7% 8.9% 7.0% 5.0%
Scottish Borders 21.8% 21.4% 7.1% 6.1% 5.3% 4.4%
0.0%
5.0%
10.0%
15.0%
20.0%
25.0%
30.0%
Proportion of people who think the following barriers to you getting a job or securing a better job
Source: SBHS 2015

SB-SA2016 - Eildon - V1 48
Economic Inequalities
Income Deprived
The term “Income Deprivation” was coined by SIMD (Scottish Index of Multiple Deprivation) to represent
individuals of all ages living in households with low income, regardless of employment status. It is
presented as a percentage of the total population in the following welfare benefit categories: Adults and
Children in Income Support (IS) or Income-based Employment and Support Allowance Households; Adults
and Children in Job Seekers Allowance (JSA) households; Adults in Guarantee Pension Credit Households;
Adults and Children in Tax Credit Households on low incomes. By using Tax Credits data, the indicator is
designed to include both in-work and out-of-work claimants on low incomes.
According to the Scottish Government’s classification of income deprivation the Scottish Borders has a
lower proportion of population classified as income deprived compared to Scotland. It can be seen that
there has been little change in the proportion of people classified as income deprived.
In Eildon, 9.8% of the population are classified as income deprived below than the Scottish Borders (10.1%)
and Scotland (13.2%).
2004 2005 2006 2007 2008 2009 2010 2011 2012 2013 2014
Scottish Borders 9.3 9.2 9.2 11.3 11.2 11.2 10.1 10.1 10.1 10.1 10.1
Scotland 13.9 13.8 13.8 15.1 15.0 14.9 13.3 13.2 13.2 13.1 13.1
0.0
2.0
4.0
6.0
8.0
10.0
12.0
14.0
16.0
Percentage of total population classified as income deprived within SIMD income domain, SG
5.0 10.4 9.4 9.8 14.3 7.0 23.4
Scottish Borders, 10.1
Scotland, 13.2
0.0
5.0
10.0
15.0
20.0
25.0
Lowest Berwickshire Cheviot Eildon Teviot &Liddesdale
Tweeddale Highest
Percentage of total population classified as income deprived within SIMD income domain.2013 - SG (SIMD)

SB-SA2016 - Eildon - V1 49
Employment Deprived
The term “Employment Deprivation” is designed, more specifically than “Income Deprivation”, to
summarise those of working age who lack employment, whether due to unemployment, incapacity or
disability. Jobseekers Allowance is awarded based on National Insurance contributions, rather than levels
of savings so a lack of employment does not necessarily indicate low household income. The two types of
deprivation correlate closely but not completely, indicating that there is more to Income Deprivation than a
lack of employment and that economically inactive people are most vulnerable from the effects of low
household income.
Compared to Scotland the Scottish Borders has consistently had a lower proportion of working age
population employment deprived. However, over time there has been a slight increase in the Scottish
Borders compared to a slight decrease for Scotland.
In Eildon, 9.8% of the population are classified as employment deprived similar to the Scottish Borders
(9.3%) and lower than Scotland (12.2%).
2004 2005 2006 2007 2008 2009 2010 2011 2012 2013 2014
Scottish Borders 8.6 8.5 8.5 8.4 8.3 8.3 9.1 9.1 9.2 9.3 9.3
Scotland 12.9 12.8 12.7 11.5 11.4 11.4 12.2 12.1 12.2 12.2 12.2
0.0
2.0
4.0
6.0
8.0
10.0
12.0
14.0
Percentage of Working age population employment deprived , SG
4.7 9.2 8.2 9.8 12.5 6.4 21.2
Scottish Borders, 9.3
Scotland, 12.2
0.0
5.0
10.0
15.0
20.0
25.0
Lowest Berwickshire Cheviot Eildon Teviot &Liddesdale
Tweeddale Highest
Percentage of Working age population employment deprived 2013 - SG (SIMD)

SB-SA2016 - Eildon - V1 50
Out of Work Benefits
The “Key Benefits” dataset is a useful source of information from the Department of Work and Pensions
that attempts to summarise working-age benefits dependency at locality level into one key variable, and to
explore the socio-demographic circumstances of its claimants. The data are derived from 100% source: the
Work and Pensions Longitudinal Study (WPLS). The dataset provides counts of benefits claimants
categorised by their statistical group (their main reason for interacting with the benefit system), gender and
age. Double counting of claimants of multiple benefits has therefore been removed. Each claimant can only
be assigned to one of the 8 groups, in the following priority order: Job Seekers Allowance claimants;
Incapacity Benefit or Severe Disablement Allowance claimants; Lone Parents Income support claimants
with a child under 16 and no partner; Carers Allowance claimants; Others on Income Related Benefit; Other
income support (including IS Disability premium) or Pension Credit claimants under State Pension age;
Disabled Disability Living Allowance (DLA); Bereaved Widows Benefit, Bereavement Benefit or Industrial
Death Benefit claimants.
Compared to Scotland the Scottish Borders has consistently has a lower proportion of working age
population claiming ‘Out of Work Benefits’.
In Eildon, 10.5% of the working age population were claiming ‘Out of Work Benefits’ similar to the Scottish
Borders (10.0%) and below Scotland (13.0%).
2002 2003 2004 2005 2006 2007 2008 2009 2010 2011 2012 2013 2014
Scottish Borders 10.8 10.5 10.2 9.8 9.8 9.5 9.6 10.9 10.1 10.1 10.3 10.0 9.4
Scotland 16.8 16.6 15.9 15.2 14.8 14.0 13.5 14.9 14.0 13.7 13.7 13.0 12.0
0.02.04.06.08.0
10.012.014.016.018.0
Percentage of Working age population claiming Out of Work benefits, SG
4.4 9.8 8.9 10.5 13.6 7.2 24.1
Scottish Borders, 10.0
Scotland, 13.0
0.0
5.0
10.0
15.0
20.0
25.0
30.0
Lowest Berwickshire Cheviot Eildon Teviot &Liddesdale
Tweeddale Highest
Percentage of Working age population claiming Out of Work benefits2013 - SG (SIMD)
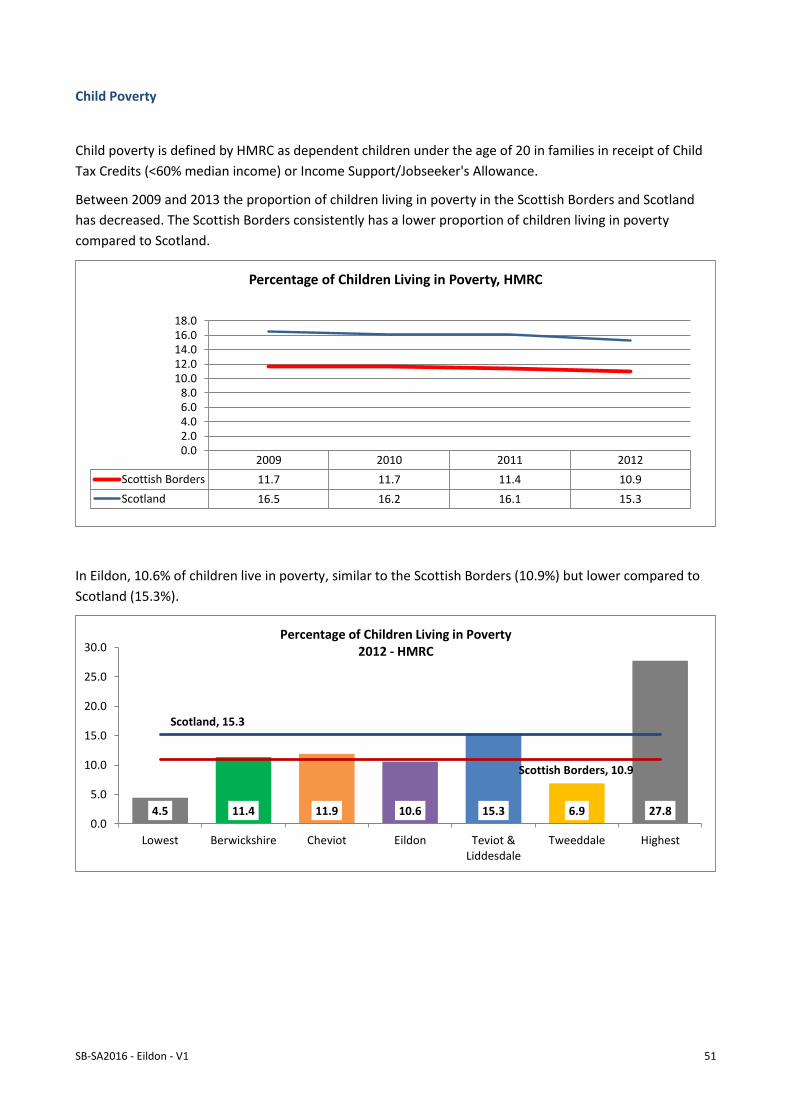
SB-SA2016 - Eildon - V1 51
Child Poverty
Child poverty is defined by HMRC as dependent children under the age of 20 in families in receipt of Child
Tax Credits (<60% median income) or Income Support/Jobseeker's Allowance.
Between 2009 and 2013 the proportion of children living in poverty in the Scottish Borders and Scotland
has decreased. The Scottish Borders consistently has a lower proportion of children living in poverty
compared to Scotland.
In Eildon, 10.6% of children live in poverty, similar to the Scottish Borders (10.9%) but lower compared to
Scotland (15.3%).
2009 2010 2011 2012
Scottish Borders 11.7 11.7 11.4 10.9
Scotland 16.5 16.2 16.1 15.3
0.02.04.06.08.0
10.012.014.016.018.0
Percentage of Children Living in Poverty, HMRC
4.5 11.4 11.9 10.6 15.3 6.9 27.8
Scottish Borders, 10.9
Scotland, 15.3
0.0
5.0
10.0
15.0
20.0
25.0
30.0
Lowest Berwickshire Cheviot Eildon Teviot &Liddesdale
Tweeddale Highest
Percentage of Children Living in Poverty2012 - HMRC

SB-SA2016 - Eildon - V1 52
Adults claiming incapacity benefit/severe disability allowance/ employment and support allowance
The Scottish Borders consistently has a lower proportion of adults claiming incapacity benefit / severe
disability allowance / employment sand support allowance compared to Scotland.
In Eildon, 3.8% of adults claiming incapacity benefit / severe disability allowance / employment and support
allowance similar to the Scottish Borders (3.7%) and below Scotland (5.1%).
2009 2010 2011 2012 2013 2014
Scottish Borders 4.0 3.9 3.8 3.8 3.7 3.7
Scotland 5.7 5.5 5.3 5.3 5.1 5.1
0.0
1.0
2.0
3.0
4.0
5.0
6.0
Percent of Adults claiming incapacity benefit/severe disability allowance/ employment and support allowance, DWP
1.9 4.1 3.1 3.8 4.9 2.7 6.8
Scottish Borders, 3.7
Scotland, 5.1
0.0
1.0
2.0
3.0
4.0
5.0
6.0
7.0
8.0
Lowest Berwickshire Cheviot Eildon Teviot &Liddesdale
Tweeddale Highest
Percent of Adults claiming incapacity benefit/severe disability allowance/ employment and support allowance May 2013, DWP

SB-SA2016 - Eildon - V1 53
Pension Credit
Pension Credit is a welfare benefit paid to pensioners with the core aim of lifting the poorest pensioners
out of poverty. Similar to Scotland the proportion of people claiming pension credits (aged 60+) has
declined between 2006 and 2014.
In Eildon, 6.1% of pensioners claim pension credit slightly above the Scottish Borders (5.8%) and below
Scotland (7.7%).
Fuel Poverty
According to the “Fuel Poverty Delivery Plan 2013-16” produced by Scottish Borders Council’s Housing
Strategy Service, the term “fuel poverty” is used to describe the inability of households to afford to heat
the home to a satisfactory standard at a reasonable cost. The Scottish Fuel Poverty Statement (August
2002) sets out the Scottish definition:
“A household is in fuel poverty if, in order to maintain a satisfactory heating regime, it would be required to
spend more than 10% of its (net) income (including Housing Benefit or Income Support for Mortgage
Interest) on all household fuel use (i.e. not just that for heating and hot water).’
2004 2005 2006 2007 2008 2009 2010 2011 2012 2013 2014
Scottish Borders 11.0 11.3 11.1 10.3 9.3 8.9 8.6 7.9 6.4 5.8 5.1
Scotland 12.7 13.1 13.2 12.7 11.7 11.1 10.8 10.1 8.3 7.7 6.9
0.0
2.0
4.0
6.0
8.0
10.0
12.0
14.0
Proportion of people claiming pension credits (aged 60+), DWP
2.2 7.0 5.8 6.1 8.4 4.9 10.7
Scottish Borders, 5.8
Scotland, 7.7
0.0
2.0
4.0
6.0
8.0
10.0
12.0
Lowest Berwickshire Cheviot Eildon Teviot &Liddesdale
Tweeddale Highest
Proportion of people claiming pension credits (aged 60+) 2013 - DWP

SB-SA2016 - Eildon - V1 54
Furthermore 'Extreme Fuel Poverty' can be defined as a household having to spend more than 20% of its
income on fuel.”
Three main factors influence whether a household is in fuel poverty:
Household Income – The costs of heating a property form a greater proportion of total income for
those on low incomes.
Fuel Costs – Higher prices reduce the affordability of fuel. Prices of different types of fuels can vary
considerably, as can the availability of different fuels in different areas, and of different types of heating
systems. This affects the ability of consumers to exercise choice. It should be noted that even with high
levels of investment in energy efficiency measures, the recent upward trend in fuel prices has pushed
many families back into fuel poverty.
Energy Efficiency – The thermal quality of the building and the efficiency of the heating source
determine the amount of energy that must be purchased to heat the home adequately.
According to the Scottish House Conditions Survey (SHCS), 43% of dwellings in the Scottish Borders
experience fuel poverty, higher than the 36% for Scotland. Fuel poverty is more common for dwellings built
before 1945 and pensioner households.
For the development of the Local Housing Strategy (LHS), Changeworks created a map of the Scottish
Borders showing the estimation of fuel poverty density based on factors that increase the likelihood of
households living in fuel poverty. These factors include single pensioners, unemployed residents, central
heating type (access to the gas grid), and home efficiency ratings.
Estimate of Fuel Poverty for the Scottish Borders

SB-SA2016 - Eildon - V1 55
Education and Learning
School Leavers
Skills Development of Scotland (SDS) publishes the school leaver destination reports. For the 2014/15
school year there were 1,203 school leavers for Scottish Borders secondary schools of which 95.3% were
entering a positive destination compared to the Scottish average of 92.9%. The graph below shows the
initial destination for school leavers in the Scottish Borders compared to Scotland for 2014/15. In 2014/15,
the Scottish Borders had a higher proportion of school leavers going to Higher Education and Further
Education compared to Scotland.
The proportion of Scottish Borders school leavers going to an initial positive destination has increased by
7.3% from 88% in 2005/06 to 95.3% in 2014/15. The trend experienced in the Scottish Borders reflects the
changes nationally.
From 2011/12, the proportion of school leavers in a positive destination after six months has increased for
the Scottish Borders from 89.3% to 94.0%. From 2012/13, the Scottish Borders had a higher proportion of
school leavers at a positive destination at six months compared to Scotland.
HigherEducation
FurtherEducation
Training EmpoymentVountary
WorkActivity
AgreementUnemployed
SeekingUnemployedNot Seeking
Unconfirmed
ScottishBorders
42.3% 29.8% 1.5% 19.4% 1.6% 0.7% 4.0% 0.7% 0.1%
Scotland 38.3% 27.8% 3.8% 21.7% 0.4% 0.9% 5.4% 1.1% 0.5%
0.0%
5.0%
10.0%
15.0%
20.0%
25.0%
30.0%
35.0%
40.0%
45.0%
School Leaver - Initial Destination 2014/15, SDS
2005/06 2006/07 2007/08 2008/09 2009/10 2010/11 2011/12 2012/13 2013/14 2014/15
Scottish Borders 88.0% 90.3% 87.0% 87.4% 88.3% 92.3% 90.9% 92.0% 94.2% 95.3%
Scotland 85.0% 87.0% 86.5% 85.7% 86.8% 88.9% 89.9% 91.4% 92.3% 92.9%
78.0%80.0%82.0%84.0%86.0%88.0%90.0%92.0%94.0%96.0%98.0%
Proportion of School Leavers at an Initial Positive Destination, SDS

SB-SA2016 - Eildon - V1 56
Within the Scottish Borders, for 2012/13, there were 6 intermediate zones (2001 based) where less than
85% of the school leavers were in a positive destination at 6 months. The results for Eildon Intermediate
Zones ranged from 83.8% in Galashiels North to 97.6% for Earlston, Lauder and Stow area.
2011/12
2012/13
2013/14
2014/15
Number of leavers - Scottish Borders 1145 1196 1052 1192
% Positive Desintation - Scottish Borders 89.3% 92.7% 94.0% 94.0%
% Positive Desintation - Scotland 89.6% 90.4% 91.7% 92.0%
86.0%
88.0%
90.0%
92.0%
94.0%
96.0%
0200400600800
100012001400
Number of School Leavers
Number of School Leavers and Percent at at Positive Destinations at 6 months, SG
78
.3
81
.4
82
.1
83
.3
83
.8
84
.6
86
.3
87
.2
87
.5
88
.9
89
.7
90
.9
91
.1
92
.7
93
.3
93
.8
94
.2
94
.3
94
.4
95
.2
95
.5
95
.6
96
.8
97
.3
97
.4
97
.6
98
.0
10
0.0
10
0.0
Scottish Borders , 92.7
Scotland, 90.4
60.0
65.0
70.0
75.0
80.0
85.0
90.0
95.0
100.0
Haw
ick
Cen
tral
Inn
erle
ith
en
an
d W
alke
rbu
rn a
rea
Eyem
ou
th
Co
ldst
ream
an
d a
rea
Gal
ash
iels
No
rth
Lan
glee
Bu
rnfo
ot
and
are
a
Gal
ash
iels
Wes
t
Ber
wic
ksh
ire
East
Selk
irk
Haw
ick
Wes
t En
d
New
cast
leto
n a
nd
Tev
iot
are
a
Ettr
ick,
Yar
row
an
d Y
air
Jed
bu
rgh
Kel
so S
ou
th
St B
osw
ells
an
d N
ewto
wn
are
a
Pe
eble
s So
uth
Du
ns
Ch
evio
t W
est
Mel
rose
an
d T
we
edb
ank
are
a
Kel
so N
ort
h
Wes
t Li
nto
n a
nd
Bro
ugh
ton
are
a
Gal
ash
iels
So
uth
Pe
eble
s N
ort
h
Ber
wic
ksh
ire
We
st
Earl
sto
n, L
aud
er
and
Sto
w a
rea
Ch
evio
t Ea
st
Haw
ick
No
rth
Ber
wic
ksh
ire
Cen
tral
% of School Leavers at a Positive Destination at 6 Months 2012/2013, SNS

SB-SA2016 - Eildon - V1 57
Life Stages / Health and Wellbeing
Maternity / Early Years
Mothers Smoking During Pregnancy
Smoking is recognised by NHS Scotland and Scottish Government as the biggest single cause of preventable
ill-health and premature death. Smoking in pregnancy is higher in Scottish Borders than the Scottish
average and is particularly high in the most deprived areas compared with the least deprived.
Between 2002/03 – 2004/05 and 2012/13 – 2014/15 the proportion of mothers smoking in Scotland
dropped by 7.7%, however, during the same period there was only a 3.4% drop for the Scottish Borders.
The Scottish Borders has consistently had more mothers smoking during pregnancy compared to Scotland.
In Eildon, 26.1% of mothers were smoking during pregnancy, above the Scottish Borders (25.3%) and
Scotland (20.0%).
2002/03-
2004/05
2003/04-
2005/06
2004/05-
2006/07
2005/06-
2007/08
2006/07-
2008/09
2007/08-
2009/10
2008/09-
2010/11
2009/10-
2011/10
2010/11-
2012/13
2011/12-
2013/14
2012/13-
2014/15
Scottish Borders 26.2 27.9 27.7 26.2 24.2 24.2 24.1 25.0 25.3 24.8 22.9
Scotland 26.2 24.7 24.0 23.3 22.4 21.5 20.8 20.5 20.0 19.3 18.5
10.0
15.0
20.0
25.0
30.0
Percent of Mothers smoking during pregnancy: 3-year average, ISD
4.7 24.5 24.4 26.1 32.6 15.8 46.8
Scottish Borders, 25.3
Scotland, 20.0
0.0
10.0
20.0
30.0
40.0
50.0
Lowest Berwickshire Cheviot Eildon Teviot & Liddesdale Tweeddale Highest
Percent of Mothers smoking during pregnancy 3-year average 2011/12 to 2013/14 - ISD

SB-SA2016 - Eildon - V1 58
Low Birth Weight
Low birth weight is defined as a birth weight of less than 2.5kg for a live single baby. Low birth weight is
the result either of a premature birth or of slow growth in the womb, or a combination of both. Low birth
weight is associated with causing fatal or serious complications such as birth defects, cot death, reduced
lung function, childhood asthma and ear infections in the child’s early years and with obesity,
cardiovascular disease and Type 2 diabetes in later life, although these two complications are also
associated with parental influences and maternal obesity. Low birth weight is strongly associated with
maternal smoking and with poor maternal nutrition. Babies with a normal or higher birth weight are more
likely to experience healthy childhood and adult lives and to have higher intelligence, but are more likely to
develop autism.
Scottish Government research has found that low birth weight is more common in deprived areas, but this
gap is beginning to narrow, due mostly to improvements in rates in the most deprived areas, rather than to
any change in the less deprived areas or in the population as a whole.
The Scottish Borders has a similar level of low weight singletons births to that for Scotland.
The Eildon locality had a slightly lower proportion of low weight singleton births compared to the Scottish
Borders and Scotland.
2002/03-
2004/05
2003/04-
2005/06
2004/05-
2006/07
2005/06-
2007/08
2006/07-
2008/09
2007/08-
2009/10
2008/09-
2010/11
2009/10-
2011/10
2010/11-
2012/13
2011/12-
2013/14
2012/13-
2014/15
Scottish Borders 2.3 2.4 2.3 2.3 2.6 2.5 2.3 1.8 1.9 2.0 1.7
Scotland 2.4 2.5 2.4 2.4 2.2 2.2 2.0 2.0 2.0 2.0 2.0
0.0
0.5
1.0
1.5
2.0
2.5
3.0
Percent of low weight singleton births (<2,500g); 3-year average, ISD
0.0 1.9 2.4 1.7 1.8 1.5 5.0
Scottish Borders, 1.9
Scotland, 2.0
0.0
1.0
2.0
3.0
4.0
5.0
6.0
Lowest Berwickshire Cheviot Eildon Teviot &Liddesdale
Tweeddale Highest
Percent of low weight singleton births (<2,500g)3-year average 2011/12 to 2013/14 - ISD
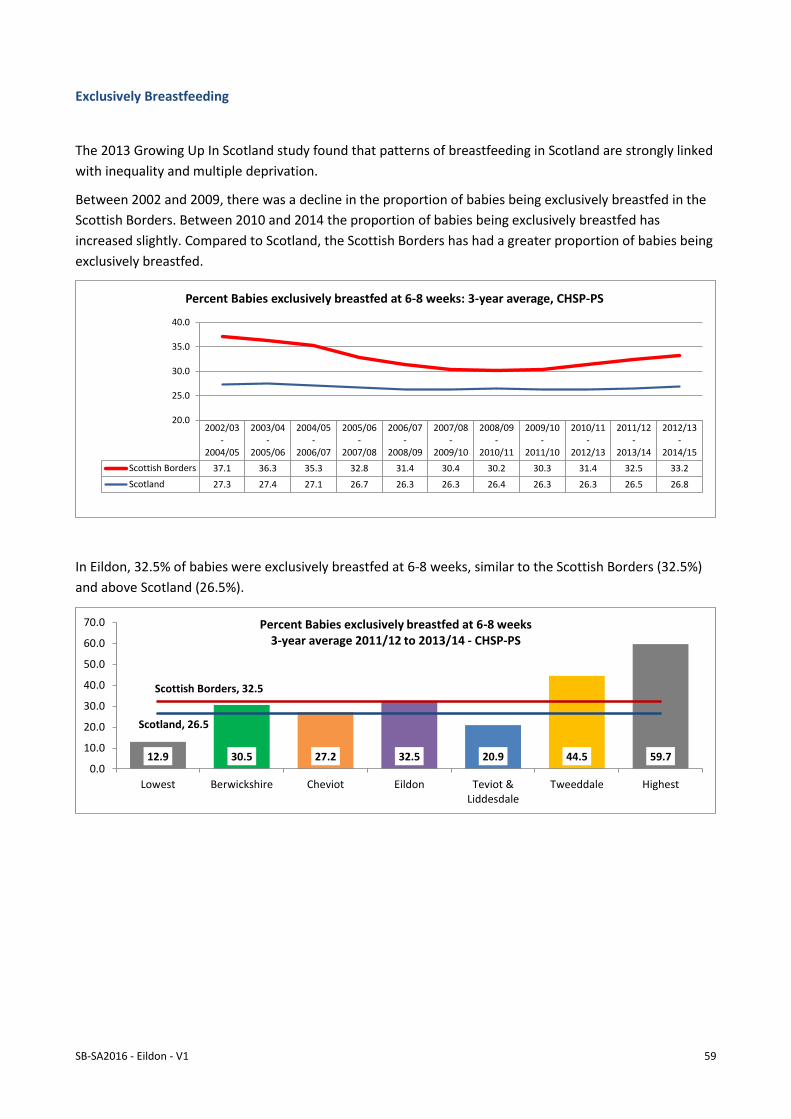
SB-SA2016 - Eildon - V1 59
Exclusively Breastfeeding
The 2013 Growing Up In Scotland study found that patterns of breastfeeding in Scotland are strongly linked
with inequality and multiple deprivation.
Between 2002 and 2009, there was a decline in the proportion of babies being exclusively breastfed in the
Scottish Borders. Between 2010 and 2014 the proportion of babies being exclusively breastfed has
increased slightly. Compared to Scotland, the Scottish Borders has had a greater proportion of babies being
exclusively breastfed.
In Eildon, 32.5% of babies were exclusively breastfed at 6-8 weeks, similar to the Scottish Borders (32.5%)
and above Scotland (26.5%).
2002/03-
2004/05
2003/04-
2005/06
2004/05-
2006/07
2005/06-
2007/08
2006/07-
2008/09
2007/08-
2009/10
2008/09-
2010/11
2009/10-
2011/10
2010/11-
2012/13
2011/12-
2013/14
2012/13-
2014/15
Scottish Borders 37.1 36.3 35.3 32.8 31.4 30.4 30.2 30.3 31.4 32.5 33.2
Scotland 27.3 27.4 27.1 26.7 26.3 26.3 26.4 26.3 26.3 26.5 26.8
20.0
25.0
30.0
35.0
40.0
Percent Babies exclusively breastfed at 6-8 weeks: 3-year average, CHSP-PS
12.9 30.5 27.2 32.5 20.9 44.5 59.7
Scottish Borders, 32.5
Scotland, 26.5
0.0
10.0
20.0
30.0
40.0
50.0
60.0
70.0
Lowest Berwickshire Cheviot Eildon Teviot &Liddesdale
Tweeddale Highest
Percent Babies exclusively breastfed at 6-8 weeks3-year average 2011/12 to 2013/14 - CHSP-PS

SB-SA2016 - Eildon - V1 60
Children
Dental Health
Children in Primary 1 and Primary 7 are assessed for dental health the graphs below show the proportion of
children with “no obvious decay experience, but child should continue to see the family dentist on a regular
bases”. Overall, for both P1 and P7 the Scottish Borders has a greater portion of children with no obvious
dental decay.
Eildon had a higher proportion of P1 pupils with “no obvious dental decay” (76.0%) compared to the
Scottish Borders (73.8%) and Scotland (66.7%).
2004 2006 2008 2010 2012 2014
Scottish Borders 63.6 59.8 70.8 77.2 69.2 77.0
Scotland 50.7 54.1 57.7 64.0 67.0 68.0
40.0
50.0
60.0
70.0
80.0
Precentage of Primary 1 children with no obvious tooth decay, ISD - NDIP
2005 2007 2009 2011 2013 2015
Scottish Borders 59.5 65.2 70.9 71.6 78.0 84.0
Scotland 52.9 59.1 63.6 69.4 72.8 75.0
40.0
50.0
60.0
70.0
80.0
90.0
Precentage of Primary 7 children with no obvious tooth decay, ISD - NDIP
51.4 64.5 71.1 76.0 70.5 81.2 93.7
Scottish Borders, 73.8
Scotland, 66.7
0.0
20.0
40.0
60.0
80.0
100.0
Lowest Berwickshire Cheviot Eildon Teviot &Liddesdale
Tweeddale Highest
Percent of Primary 1 children with "No obvious dental decay experience"2013/14 - NDIP

SB-SA2016 - Eildon - V1 61
In Eildon, 49.7% of P1 pupils have “no obvious dental decay”, below the Scottish Borders (51.6%) but above
Scotland (47.7%).
Child Obesity
Child obesity is an indicator of health inequalities, the measure is the proportion of children in an area
whose BMI (Body Mass Index) is within the top 5% of the 1990 UK reference range for their age and sex.
From 2005/06 the percent of child obesity in primary 1 in the Scottish Borders has been below the level
experienced for Scotland.
In Eildon, 9.9% of P1 pupils were obese, above the Scottish Borders (9.1%) but slightly below Scotland
(10.1%).
32.6 57.5 52.1 49.7 48.9 51.7 66.7
Scottish Borders, 51.6
Scotland, 47.7
0.0
10.0
20.0
30.0
40.0
50.0
60.0
70.0
Lowest Berwickshire Cheviot Eildon Teviot &Liddesdale
Tweeddale Highest
Percent of Primary 7 children with "No obvious dental decay experience"2013/14 - NDIP
2003/04 2004/05 2005/06 2006/07 2007/08 2008/09 2009/10 2010/11 2011/12 2012/13 2013/14
Scottish Borders 8.1 10.9 11.0 9.2 8.8 8.5 9.4 8.5 8.9 8.4 9.1
Scotland 10.3 10.5 10.5 9.9 9.3 9.2 9.5 9.6 9.8 9.3 10.1
0.0
2.0
4.0
6.0
8.0
10.0
12.0
Percent of Child Obesity in Primary 1, CHSP-S
0.0 13.2 5.7 9.9 9.4 6.9 21.4
Scottish Borders, 9.1
Scotland, 10.1
0.0
5.0
10.0
15.0
20.0
25.0
Lowest Berwickshire Cheviot Eildon Teviot &Liddesdale
Tweeddale Highest
Percent of Child Obesity in Primary 12013/14 - CHSP-S

SB-SA2016 - Eildon - V1 62
Adults
Coronary Heart Disease
The main risk factors associated with coronary heart disease (CHD) are high cholesterol, physical inactivity,
smoking, high blood pressure, obesity, poor diet and diabetes. Between 2002 and 2013, the rate of people
hospitalised with CHD decreased for both the Scottish Borders and Scotland. However, from 2007 the
Scottish Borders has had a slightly higher rate of CHD hepatisations compared to Scotland.
For 2011-2013 Scottish Borders has a slightly high rate of people hospitalised with CHD compared to
Scotland. However, the Scottish Borders has a lower rate of early deaths from CHD; this seems to indicate
that although people are experience CHD they are not dying early as a result. Within the Scottish Borders,
the only locality to have a lower rate of hospitalisations for CHD per 100,000 than Scotland was Cheviot.
All localities within the Scottish Borders had a lower rate of early deaths from CHD (under 75 years)
compared to Scotland, Eildon was the same as to the Scottish Borders.
2002-2004
2003-2005
2004-2006
2005-2007
2006-2008
2007-2009
2008-2010
2009-2011
2010-2012
2011-2013
Scottish Borders 566 556 540 550 537 526 503 479 461 452
Scotland 648 625 598 572 540 509 486 468 456 440
400
450
500
550
600
650
700
Patients discharged from hospital with coronary heart disease: 3-year rolling average age-sex standardised rate per 100,000 , ISD
234 480 411 527 581 485 638
Scottish Borders, 452
Scotland, 440
0
100
200
300
400
500
600
700
Lowest Berwickshire Cheviot Eildon Teviot &Liddesdale
Tweeddale Highest
Patients discharged from hospital with coronary heart disease: age- sex standardised rate per 100,000 population 3-year rolling average 2011-2013, ISD
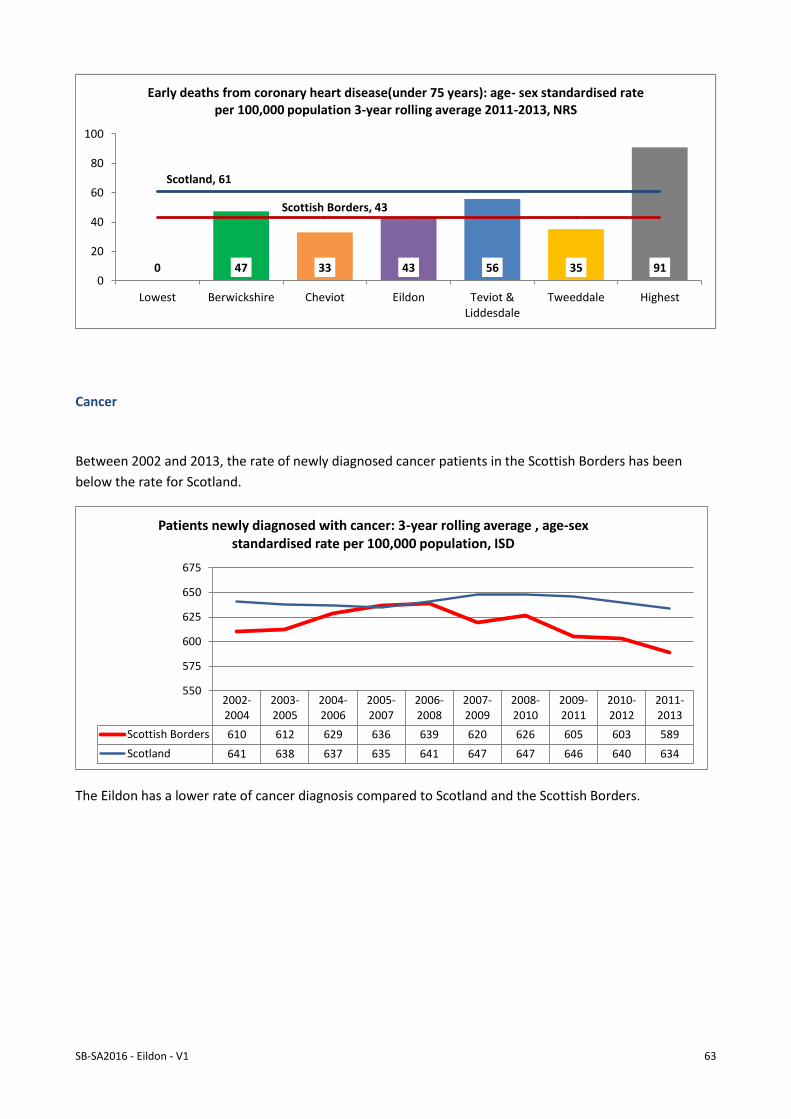
SB-SA2016 - Eildon - V1 63
Cancer
Between 2002 and 2013, the rate of newly diagnosed cancer patients in the Scottish Borders has been
below the rate for Scotland.
The Eildon has a lower rate of cancer diagnosis compared to Scotland and the Scottish Borders.
0 47 33 43 56 35 91
Scottish Borders, 43
Scotland, 61
0
20
40
60
80
100
Lowest Berwickshire Cheviot Eildon Teviot &Liddesdale
Tweeddale Highest
Early deaths from coronary heart disease(under 75 years): age- sex standardised rate per 100,000 population 3-year rolling average 2011-2013, NRS
2002-2004
2003-2005
2004-2006
2005-2007
2006-2008
2007-2009
2008-2010
2009-2011
2010-2012
2011-2013
Scottish Borders 610 612 629 636 639 620 626 605 603 589
Scotland 641 638 637 635 641 647 647 646 640 634
550
575
600
625
650
675
Patients newly diagnosed with cancer: 3-year rolling average , age-sex standardised rate per 100,000 population, ISD

SB-SA2016 - Eildon - V1 64
The Eildon locality has the highest rate of early deaths from cancer compared the other Scottish Borders
localities but below Scotland.
Chronic Obstructive Pulmonary Disease (COPD)
ScotPho describes COPD as a long- term lung disease that causes cough and breathlessness; previously
referred to chronic bronchitis or emphysema. It is a progressive disease that not only affects breathing but
also causes weight loss, nutritional disturbances and muscle problems. The most significant risk factor for
COPD is cigarette smoking. The Scottish Borders has consistently had a lower rate of patients hospitalised
428 617 564 572 610 594 787
Scottish Borders, 589
Scotland, 634
0
100
200
300
400
500
600
700
800
900
Lowest Berwickshire Cheviot Eildon Teviot &Liddesdale
Tweeddale Highest
Patients newly diagnosed with cancer: age- sex standardised rate per 100,000 population3- year rolling average 2011-2013, ISD
61 105 135 158 144 119 268
Scottish Borders, 134
Scotland, 173
0
50
100
150
200
250
300
Lowest Berwickshire Cheviot Eildon Teviot &Liddesdale
Tweeddale Highest
Early deaths from cancer (under 75s): age- sex standardised rate per 100,000 population3- year rolling average 2011-2013, NRS

SB-SA2016 - Eildon - V1 65
with chronic obstructive pulmonary disease (COPD) compared to Scotland.
Within the Scottish Borders, the rate of hospitalisations from COPD by Intermediate Zone ranges from 226
to 923 (above the Scottish rate) per 100,000. The Eildon area has a similar rate to the Scottish Borders but
below Scotland.
Asthma
ScotPho describes asthma as chronic disease of the small airways in the lung. Airway inflammation and
associated bronchoconstriction leads to recurrent attacks of cough, wheezing, breathlessness or chest
tightness. Compared to Scotland the Scottish Borders has consistently had a slightly higher rate of people
hospitalised with asthma.
2002-2004
2003-2005
2004-2006
2005-2007
2006-2008
2007-2009
2008-2010
2009-2011
2010-2012
2011-2013
Scottish Borders 423 444 459 498 522 532 501 476 472 498
Scotland 561 578 587 601 613 621 629 640 653 660
300350400450500550600650700
Patients hospitalised with chronic obstructive pulmonary disease (COPD), 3-year rolling average, age- sex standardised rate per 100,000 population, ISD
226 480 411 527 581 485 923
Scottish Borders, 498
Scotland, 660
0
100
200
300
400
500
600
700
800
900
1000
Lowest Berwickshire Cheviot Eildon Teviot &Liddesdale
Tweeddale Highest
Patients hospitalised with chronic obstructive pulmonary disease (COPD): age- sex standardised rate per 100,000 population - 3- year rolling average 2011-2013, ISD

SB-SA2016 - Eildon - V1 66
The Eildon locality has a similar rate of asthma hospitalisation when compared to Scottish Borders and
Scotland.
Emergency Hospitalisations
The rate of emergency hospitalisations for the Scottish Borders has increased by 11% between 2002 and
2013 compared to a 1% increase for Scotland.
2002-2004
2003-2005
2004-2006
2005-2007
2006-2008
2007-2009
2008-2010
2009-2011
2010-2012
2011-2013
Scottish Borders 105 106 110 107 111 106 104 101 102 99
Scotland 100 100 104 104 106 103 100 95 92 91
50
75
100
125
Patients discharged from hospital (annually) diagnosed with asthma, 3-year rolling average number and directly age-sex standardised rate per 100,000
population, ISD
29 86 92 100 142 82 257
Scottish Borders, 99
Scotland, 91
0
50
100
150
200
250
300
Lowest Berwickshire Cheviot Eildon Teviot &Liddesdale
Tweeddale Highest
Patients hospitalised with asthma: age- sex standardised rate per 100,000 population3-year rolling average 2011-2013, ISD
2002-2004
2003-2005
2004-2006
2005-2007
2006-2008
2007-2009
2008-2010
2009-2011
2010-2012
2011-2013
Scottish Borders 7554 7587 7865 8020 8070 8096 7956 8010 8107 8357
Scotland 7436 7393 7408 7472 7580 7619 7565 7489 7466 7500
6800
7000
7200
7400
7600
7800
8000
8200
8400
8600
Patients with emergency hospitalisations: 3-year rolling average, age- sex standardised rate per 100,000 population, ISD

SB-SA2016 - Eildon - V1 67
The Eildon locality had the highest rate of emergency hospitalisations for all the localities and compared to
Scotland.
Older People
Multiple Emergency Hospitalisations for people 65+
A range of factors influence the number of multiple emergency hospitalisations some personal and some
systems-related. At a personal level, these would include the particular form of the current problem, the
individual's own health and well-being and whether the person looks after themselves or needs a carer.
Their immediate housing environment is also important; can they, for example, reach an upstairs toilet.
Systems-related aspects include: the habits of GPs in referring patients directly to hospital; the availability
of alternative forms of care such as short term rapid response services; and whether local systems are
linked in a way that supports older people at these critical times.
Between 2002 and 2013 the rate of patients (65+) with multiple emergency hospitalisations has increased
for both Scotland and the Scottish Borders. There has been a more dramatic increase for the Scottish
Borders in more recent years.
Within the Scottish Borders, the rate of patients (65+) multiple hospitalisations by Intermediate Zone range
from 3,250 and 8,992 per 100,000 population. The Eildon locality has a higher rate of patients (65+)
multiple hospitalisations compared to Scottish Borders and Scotland.
6317 7871 7514 9259 8716 8028 11523
Scottish Borders, 8357
Scotland, 7500
0
2000
4000
6000
8000
10000
12000
14000
Lowest Berwickshire Cheviot Eildon Teviot &Liddesdale
Tweeddale Highest
Patients with emergency hospitalisations: age- sex standardised rate per 100,000 population3- year rolling average 2011-2013, ISD
2002-2004
2003-2005
2004-2006
2005-2007
2006-2008
2007-2009
2008-2010
2009-2011
2010-2012
2011-2013
Scottish Borders 4804 4749 4801 4909 4879 4813 4728 4732 4885 5122
Scotland 4589 4600 4644 4743 4915 5018 5055 5050 5118 5159
43004400450046004700480049005000510052005300
Patients (65+) with multiple emergency hospitalisations: 3-year rolling average, age- sex standardised rate per 100,000 population, ISD

SB-SA2016 - Eildon - V1 68
Substance Use
Alcohol
According to Information Services Division (ISD), the Scottish Borders has consistently had a lower rate of
alcohol related hospital stays per 100,000 compared to Scotland.
Within the Scottish Borders, the rate of alcohol related hospital stays by Intermediate Zone ranges from
well below the Scottish rate (123) to well above the Scottish rate (1490) per 100,000 population. The Eildon
locality has the highest rate of all Scottish Borders localities, slightly below the Scottish rate.
3250 4611 3972 5685 5463 5410 8992
Scottish Borders, 5123 Scotland, 5160
0
2000
4000
6000
8000
10000
Lowest Berwickshire Cheviot Eildon Teviot &Liddesdale
Tweeddale Highest
Patients (65+) with multiple emergency hospitalisations: age- sex standardised rate per 100,000 population 3- year rolling average 2011-2013, ISD
2002/03 2003/04 2004/05 2005/06 2006/07 2007/08 2008/09 2009/10 2010/11 2011/12 2012/13 2013/14 2014/15
Scottish Borders 576 539 546 567 644 673 630 594 542 627 559 566 465
Scotland 743 741 796 780 810 856 828 772 759 750 699 707 672
300
400
500
600
700
800
900
Alcohol related hospital stays: age- sex standardised rate per 100,000 population, ISD
123 463 386 700 646 518 1490
Scottish Borders, 566
Scotland, 705
0
500
1000
1500
2000
Lowest Berwickshire Cheviot Eildon Teviot &Liddesdale
Tweeddale Highest
Alcohol related hospital stays: age- sex standardised rate per 100,000 population2013/2014, ISD

SB-SA2016 - Eildon - V1 69
According to the National Records of Scotland (NRS) the Scottish Borders has consistently had a lower rate
of alcohol related deaths compared to Scotland. However, in recent years the rate in the Scottish Borders
has increased opposite to the downward trend for Scotland.
Within the Scottish Borders, the rate of alcohol related deaths by Intermediate Zone ranges from 0 to 44
per 100,000 population. Eildon had the highest rate of Scottish Borders localities but below Scotland.
Drugs
The Scottish Borders has consistently had a lower rate of drug-related hospital stays compared to Scotland.
2002-2006 2003-2007 2004-2008 2005-2009 2006-2010 2007-2011 2008-2012 2009-2013 2010-2014
Scottish Borders 13.6 13.8 13.2 11.3 12.3 13.3 12.5 13.4 14.9
Scotland 32.1 31.4 30.4 29.2 28.1 26.7 25.2 23.8 23.1
0.0
5.0
10.0
15.0
20.0
25.0
30.0
35.0
Alcohol related deaths: 5-year rolling average, age- sex standardised rate per 100,000 population, NRS
0 13 10 17 11 13 44
Scottish Borders, 13
Scotland, 24
0
10
20
30
40
50
Lowest Berwickshire Cheviot Eildon Teviot &Liddesdale
Tweeddale Highest
Alcohol related deaths: age- sex standardised rate per 100,000 population5-year rolling average 2009-2013, NRS
2002/03-2004/05
2003/04-2005/06
2004/05-2006/07
2005/06-2007/08
2006/07-2008/09
2007/08-2009/10
2008/09-2010/11
2009/10-2011/10
2010/11-2012/13
2011/12-2013/14
2012/13-2014/15
ScottishBorders
48.4 46.3 48.0 58.5 64.6 67.3 67.3 77.3 84.6 88.1 79.6
Scotland 85.4 84.5 86.7 92.5 101.3 106.8 111.4 113.9 114.0 116.7 122.0
0.0
20.0
40.0
60.0
80.0
100.0
120.0
140.0
Drug-related hospital stays: 3-year rolling average 2011-2013, age- sex standardised rate per 100,000 population, ISD

SB-SA2016 - Eildon - V1 70
The Eildon locality has a highest rate of drug-related hospital stays compared to the other localities and the
Scottish Borders although lower than Scotland.
Mental Health
Hospitalisations
From 2002, the Scottish Borders has had a higher rate of psychiatric hospitalisations compared to Scotland.
Between 2002 and 2013, the rate of psychotic hospitalisations in the Scottish Borders has decreased by
36% compared to a 28% decrease for Scotland.
0 58 73 109 94 86 236
Scottish Borders, 88
Scotland, 117
0
50
100
150
200
250
Lowest Berwickshire Cheviot Eildon Teviot &Liddesdale
Tweeddale Highest
Drug-related hospital stays: age- sex standardised rate per 100,000 population3-year rolling average 2011-2013, ISD
2002-2004
2003-2005
2004-2006
2005-2007
2006-2008
2007-2009
2008-2010
2009-2011
2010-2012
2011-2013
Scottish Borders 467.3 455.3 435.4 411.1 399.8 387.6 364.7 348.8 335.3 300.2
Scotland 404.9 389.6 373.1 353.9 343.6 333.1 322.3 307.0 297.7 291.6
200.0
250.0
300.0
350.0
400.0
450.0
500.0
Patients with a psychiatric hospitalisation: 3-year rolling average, age- sex standardised rate per 100,000 population, ISD
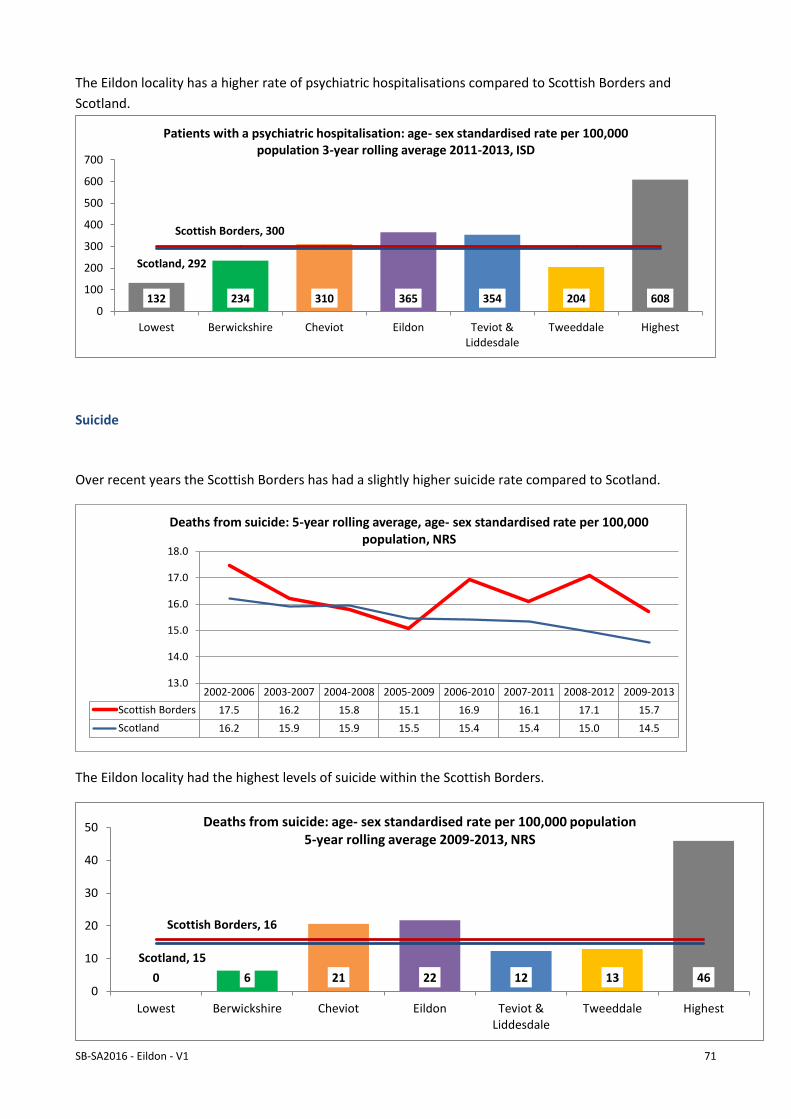
SB-SA2016 - Eildon - V1 71
The Eildon locality has a higher rate of psychiatric hospitalisations compared to Scottish Borders and
Scotland.
Suicide
Over recent years the Scottish Borders has had a slightly higher suicide rate compared to Scotland.
The Eildon locality had the highest levels of suicide within the Scottish Borders.
132 234 310 365 354 204 608
Scottish Borders, 300
Scotland, 292
0
100
200
300
400
500
600
700
Lowest Berwickshire Cheviot Eildon Teviot &Liddesdale
Tweeddale Highest
Patients with a psychiatric hospitalisation: age- sex standardised rate per 100,000 population 3-year rolling average 2011-2013, ISD
2002-2006 2003-2007 2004-2008 2005-2009 2006-2010 2007-2011 2008-2012 2009-2013
Scottish Borders 17.5 16.2 15.8 15.1 16.9 16.1 17.1 15.7
Scotland 16.2 15.9 15.9 15.5 15.4 15.4 15.0 14.5
13.0
14.0
15.0
16.0
17.0
18.0
Deaths from suicide: 5-year rolling average, age- sex standardised rate per 100,000 population, NRS
0 6 21 22 12 13 46
Scottish Borders, 16
Scotland, 15
0
10
20
30
40
50
Lowest Berwickshire Cheviot Eildon Teviot &Liddesdale
Tweeddale Highest
Deaths from suicide: age- sex standardised rate per 100,000 population5-year rolling average 2009-2013, NRS

SB-SA2016 - Eildon - V1 72
Feeling Lonely or Isolated
The Scottish Borders Household Survey 2015 asked respondents if they felt lonely or isolated as a result of
living in a rural area. The graph with table below shows that 6.1% of the people in the Scottish Borders feel
lonely or isolated, Eildon had a lower rate of 5.1%.
Berwickshire Cheviot Eildon Teviot Tweeddale Scottish Borders
Yes 7.9% 5.1% 5.5% 8.4% 3.5% 6.1%
0.0%
2.0%
4.0%
6.0%
8.0%
10.0%
Proportion of people feel lonely or isolated as a result of living in a rural area Source: SBHS 2015

SB-SA2016 - Eildon - V1 73
Physical Activity
Children’s Physical Education and Activity
Children’s physical education is part of the overarching target of 5 hours of physical activity per week for
children. The active schools programme complemented by sport clubs and community activity adds a
significant contributes towards this target. In 2014/15, 54% of children in the Scottish Borders participated
in extra curricular physical activity; the proportion varied across the school clusters. The Eildon clusters are
Earlston at 58%, Galashiels 51%, and Selkirk 49%.
Adult Physical Activity
According to the Scottish Borders Household Survey 2015, almost 30% of respondents take part in 30
minutes of moderate physical activity daily. Eildon had a similar proportion of people who exercise daily.
37% 58% 43% 51% 60% 66% 56% 58% 49%
Scottish Border, 54%
0%
10%
20%
30%
40%
50%
60%
70%
Duns Earlston Eyemouth Galashiels Hawick Jedburgh Kelso Peebles Selkirk
Participation in Extra Curriular Pysical Activity by School Cluster for 2014/15, SBC
Berwickshire Cheviot Eildon Teviot TweeddaleScottishBorders
Daily 29.9% 32.9% 28.5% 26.4% 27.6% 29.0%
4-6 times a week 15.2% 16.2% 14.1% 15.2% 16.6% 15.5%
2-3 times a week 25.2% 23.0% 23.7% 23.8% 29.9% 25.4%
Once a week 8.5% 9.2% 10.9% 8.4% 9.2% 9.3%
Less than once a week 4.3% 6.1% 8.2% 6.4% 7.6% 6.5%
Never 10.7% 8.5% 11.1% 15.0% 5.3% 9.9%
0.0%
5.0%
10.0%
15.0%
20.0%
25.0%
30.0%
35.0%
Proportion of people who take
part in 30 minof moderate
physcial activity by frequency
Source: SBHS 2015

SB-SA2016 - Eildon - V1 74
Reducing Risk
Adult Protection
Adult at risk, as defined by the Adult Support & Protection (Scotland) Act 2007, are individuals aged 16 or
over who:-
Are unable to safeguard their own wellbeing, property, rights or other interests;
Are at risk of harm;
Because they are affected by disability, mental disorder, illness or physical or mental infirmity, are
more vulnerable to being harmed than adults who are not so affected.
If adults meet all three of the above criteria, often referred to as the three point test, then they can be
considered to be adults at risk as defined by the Act.
Harm includes physical and sexual harm, neglect, financial exploitation and harassment.
Referrals occur when any person knows or believes an adult is at risk of harm. During the course of 2014-
2015 a total of 1,432 referrals were received, this compared with a total of 1,253 during the previous year
2013-2014.
The number of cases progressing to adult protection concerns, as defined by the Act, showed a slight
decline on the previous year with 169 cases progressing in 2014-2015, compared to 190 progressing the
previous period. The graph below shows the number of adult protections concerns by the social work
locality teams in 2014-15.
28
17
26 26
20
38
14
0
10
20
30
40
Central Duns Hawick Kelso Peebles LearningDisablity Team
Mental Health
Adult Protection Concerns in 2014-15 by Locality Team, APC
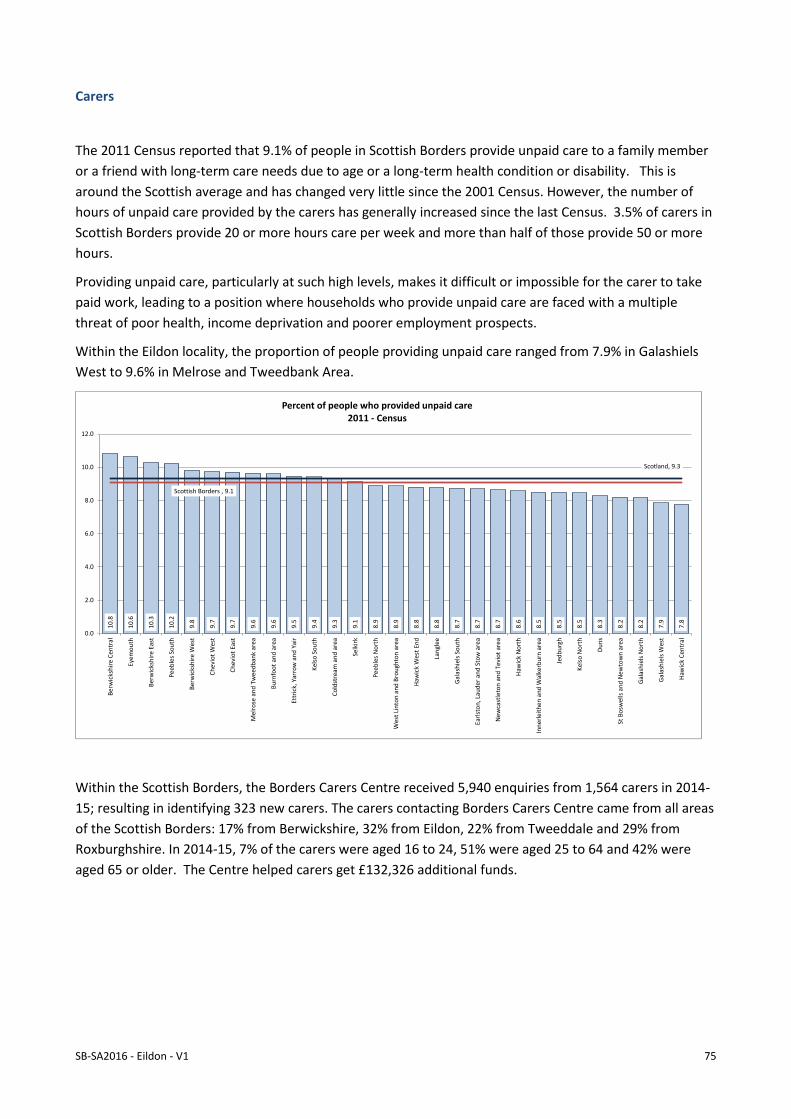
SB-SA2016 - Eildon - V1 75
Carers
The 2011 Census reported that 9.1% of people in Scottish Borders provide unpaid care to a family member
or a friend with long-term care needs due to age or a long-term health condition or disability. This is
around the Scottish average and has changed very little since the 2001 Census. However, the number of
hours of unpaid care provided by the carers has generally increased since the last Census. 3.5% of carers in
Scottish Borders provide 20 or more hours care per week and more than half of those provide 50 or more
hours.
Providing unpaid care, particularly at such high levels, makes it difficult or impossible for the carer to take
paid work, leading to a position where households who provide unpaid care are faced with a multiple
threat of poor health, income deprivation and poorer employment prospects.
Within the Eildon locality, the proportion of people providing unpaid care ranged from 7.9% in Galashiels
West to 9.6% in Melrose and Tweedbank Area.
Within the Scottish Borders, the Borders Carers Centre received 5,940 enquiries from 1,564 carers in 2014-
15; resulting in identifying 323 new carers. The carers contacting Borders Carers Centre came from all areas
of the Scottish Borders: 17% from Berwickshire, 32% from Eildon, 22% from Tweeddale and 29% from
Roxburghshire. In 2014-15, 7% of the carers were aged 16 to 24, 51% were aged 25 to 64 and 42% were
aged 65 or older. The Centre helped carers get £132,326 additional funds.
10
.8
10
.6
10
.3
10
.2
9.8
9.7
9.7
9.6
9.6
9.5
9.4
9.3
9.1
8.9
8.9
8.8
8.8
8.7
8.7
8.7
8.6
8.5
8.5
8.5
8.3
8.2
8.2
7.9
7.8
Scottish Borders , 9.1
Scotland, 9.3
0.0
2.0
4.0
6.0
8.0
10.0
12.0
Ber
wic
ksh
ire
Cen
tral
Eyem
ou
th
Ber
wic
ksh
ire
East
Pe
eble
s So
uth
Ber
wic
ksh
ire
We
st
Ch
evio
t W
est
Ch
evio
t Ea
st
Mel
rose
an
d T
we
edb
ank
are
a
Bu
rnfo
ot
and
are
a
Ettr
ick,
Yar
row
an
d Y
air
Kel
so S
ou
th
Co
ldst
ream
an
d a
rea
Selk
irk
Pe
eble
s N
ort
h
Wes
t Li
nto
n a
nd
Bro
ugh
ton
are
a
Haw
ick
Wes
t En
d
Lan
glee
Gal
ash
iels
So
uth
Earl
sto
n, L
aud
er
and
Sto
w a
rea
New
cast
leto
n a
nd
Tev
iot
are
a
Haw
ick
No
rth
Inn
erle
ith
en
an
d W
alke
rbu
rn a
rea
Jed
bu
rgh
Kel
so N
ort
h
Du
ns
St B
osw
ells
an
d N
ewto
wn
are
a
Gal
ash
iels
No
rth
Gal
ash
iels
Wes
t
Haw
ick
Cen
tral
Percent of people who provided unpaid care2011 - Census

SB-SA2016 - Eildon - V1 76
Community and Environment
Community Safety
Neighbourhood Problems
The Scottish Borders Household Survey 2015 indicates that more people in Eildon area identify several
neighbourhood problems as ‘very common / fairly common’ including ‘rubbish and litter lying around’,
‘people using or dealing drugs’, and ’people being drunk or rowdy in public places’.
Feeling Safe
The Scottish Borders Household Survey 2015 asked, “are they any places in your local area that you feel
unsafe?” Within the Eildon locality 15.3% of respondents indicated there were places they felt unsafe
above the 12.5% for the Scottish Borders.
The graphs below show the proportion of people feeling safe at home at night, waking alone during the day
and walking alone at night in their local area for the Scottish Borders and by the localities from the Scottish
Borders Household Survey 2015. The graphs clearly show that the proportion of people that feel ‘a bit
unsafe’ or ‘very unsafe’ is higher for ‘walking alone at night in their local area’. People in the Eildon area
indicated that they felt slightly less safe compared to the Scottish Borders.
Parkingproblems
Anti-SocialDriving
Behaviourincludingspeeding
Rubbishand litter
lyingaround
Unwantedcallers atthe door
Peopleusing ordealingdrugs
Peoplebeing drunkor rowdy in
publicplaces
Youthscausing
annoyance
Out ofcontrol
dogs
Noisyneighbours
or loudparties
Off roadmotorbikes
Vandalismor graffiti toproperty or
vehicles
Groups orindividualsintimidatin
g orharassing
others
Peoplesetting fires
to causedamage
Raciallymotivated
attacks
Abandonedor burntout cars
Eildon 41.4% 31.7% 38.7% 21.9% 22.5% 17.3% 11.2% 9.6% 9.4% 5.0% 8.7% 6.6% 1.1% 0.4% 1.1%
Scottish Borders 40.1% 35.3% 35.2% 20.7% 18.1% 13.8% 10.8% 10.1% 8.9% 7.2% 6.7% 5.8% 1.2% 0.8% 0.7%
0.0%
5.0%
10.0%
15.0%
20.0%
25.0%
30.0%
35.0%
40.0%
45.0%
Proportion of people who feel the following are Very Common / Fairly Common in their local areaSource: SBHS 2015
Berwickshire Cheviot Eildon Teviot Tweeddale Scottish Borders
No 87.8% 85.5% 79.7% 76.2% 85.0% 83.0%
Yes 8.1% 11.0% 15.3% 17.0% 11.5% 12.5%
0.0%10.0%20.0%30.0%40.0%50.0%60.0%70.0%80.0%90.0%
100.0%
Are there any places in your local area that
you feel unsafe?
Source: SBHS 2015

SB-SA2016 - Eildon - V1 77
Berwickshire Cheviot Eildon Teviot Tweeddale Scottish Borders
Very safe 66.7% 65.4% 65.1% 59.2% 69.4% 65.4%
Fairly safe 29.3% 30.5% 29.2% 35.4% 28.0% 30.3%
A bit unsafe 1.3% 1.8% 2.3% 2.6% 1.1% 1.8%
Very unsafe 0.6% 0.9% 0.2% 0.6% 0.4% 0.6%
0.0%
10.0%
20.0%
30.0%
40.0%
50.0%
60.0%
70.0%
80.0%
Proportion of people feeling
safe:Alone
in your home at night
Source: SBHS 2015
Berwickshire Cheviot Eildon Teviot Tweeddale Scottish Borders
Very safe 75.4% 72.2% 71.3% 65.0% 78.6% 72.8%
Fairly safe 19.9% 22.6% 22.3% 26.8% 16.8% 21.5%
A bit unsafe 0.8% 1.5% 0.7% 3.2% 1.1% 1.4%
Very unsafe 0.2% 0.9% 1.1% 0.6% 0.9% 0.8%
0.0%
10.0%
20.0%
30.0%
40.0%
50.0%
60.0%
70.0%
80.0%
90.0%
Proportion of people feeling
safe:Walking
alone in your local area
during the day
Source: SBHS 2015
Berwickshire Cheviot Eildon Teviot Tweeddale Scottish Borders
Very safe 35.3% 31.6% 32.6% 30.3% 39.1% 34.1%
Fairly safe 44.2% 44.9% 41.2% 39.3% 44.4% 42.6%
A bit unsafe 11.7% 14.5% 16.2% 17.4% 10.1% 13.9%
Very unsafe 3.2% 4.8% 3.7% 7.5% 2.3% 4.2%
0.0%
5.0%
10.0%
15.0%
20.0%
25.0%
30.0%
35.0%
40.0%
45.0%
50.0%
Proportion of people feeling
safe:Walking alone
in your local area after dark
Source: SBHS 2015

SB-SA2016 - Eildon - V1 78
Neighbourhood Crime
Neighbourhood crime also known as the SIMD crime grouping includes crimes of violence; drug offences;
domestic house breaking; minor assault; and vandalism. The Scottish Borders has consistently had a lower
neighbourhood crime rate per 1,000 population compared to Scotland.
Within the Scottish Borders, the rate of neighbourhood crimes by Intermediate Zone ranges from 5.0 to
71.3 per 1,000 population. The Eildon locality has a lower rate of neighbourhood crime per 1,000
population compared Scotland, however the above the Scottish Borders level.
Anti-Social Behaviour
The Scottish Borders Household Survey asked, “if people had witnessed or experienced antisocial behaviour
in the last year?” Overall, 20% of respondents indicated that they witnessed or experienced antisocial
behaviour; Eildon had the second highest level (24.4%).
2004 2005 2006 2007 2008 2009 2010 2011 2012 2013 2014
Scottish Borders 37.1 36.8 36.6 29.0 28.7 28.7 22.1 22.0 22.0 22.0 22.0
Scotland 53.4 53.2 52.9 49.2 48.9 48.6 41.0 40.7 40.6 40.5 40.4
0.0
10.0
20.0
30.0
40.0
50.0
60.0
Neighbourhood crime rate per 1,000 population (violence; drug offences; domestic house breaking; minor assault; and vandalism), SG
5.0 17.0 16.4 25.1 35.6 14.7 71.3
Scottish Borders, 22.0
Scotland, 40.5
0.0
20.0
40.0
60.0
80.0
Lowest Berwickshire Cheviot Eildon Teviot &Liddesdale
Tweeddale Highest
Neighbourhood crime rate per 1,000 population (violence; drug offences; domestic house breaking; minor assault; and vandalism) 2013, SG
Berwickshire Cheviot Eildon Teviot Tweeddale Scottish Borders
Yes 13.7% 18.9% 24.4% 27.5% 19.5% 20.8%
0.0%
5.0%
10.0%
15.0%
20.0%
25.0%
30.0%
Proportion of people who have witnessed or experienced anti-social behaviour in the last year Source: SBHS 2015

SB-SA2016 - Eildon - V1 79
Community Safety by Locality
Crime and Disorder
This section looks at the community safety information by the five localities within the Scottish Borders.
The table below shows 2014-15 crime and disorder for each locality as a rate per 1,000. Compared to the
Scottish Borders, Eildon had higher rates of Serious Assault, Minor Assault, Supply of Drugs, Possession of
Drugs, and Shoplifting.
Crime and Disorder by Locality for 2014-15 as a rate per 1,000 Population
Locality Scottish Borders
Berwickshire Cheviot Eildon Teviot Tweeddale
Serious Assault 0.24 0.18 0.31 0.38 0.10 0.25
Robbery 0.00 0.06 0.10 0.32 0.00 0.10
Rape 0.58 0.43 0.10 0.48 0.05 0.29
Sexual Assault 0.29 0.91 0.46 0.54 0.21 0.47
Minor Assault 4.65 4.94 5.95 10.21 2.61 5.70
Housebreaking (Dwelling) 1.05 0.67 0.54 1.67 0.83 0.89
Housebreaking (Non-Dwelling) 0.38 0.49 0.15 0.75 0.73 0.44
Vandalism 3.98 6.16 5.67 13.54 3.54 6.36
Fire-raising 0.29 0.18 0.21 0.43 0.16 0.25
Supply of Drugs 0.05 0.49 0.41 0.59 0.10 0.33
Possession of Drugs 1.82 1.65 2.71 3.98 1.35 2.37
Theft Of Motor Vehicle 0.72 0.37 0.34 0.81 0.68 0.54
Theft From Motor Vehicle 0.62 0.98 0.82 0.97 0.52 0.78
Shoplifting 0.58 2.86 5.26 3.39 0.57 2.96
Racially Aggravated Conduct 0.00 0.24 0.21 0.27 0.05 0.16
Antisocial Behaviour3 71.52 96.97 107.33 194.40 65.55 106.46
Total 86.76 117.57 130.57 232.71 77.06 128.35
The graph shows the crime and disorder incidents by locality for 2014-15 per 1,000 population.
3 Antisocial behaviour incidents publicly reported, higher than ASB recorded on closure after investigation.
Berwickshire Cheviot Eildon Teviot TweeddaleScottishBorders
Total Crime and Disorder 86.76 117.57 130.57 232.71 77.06 128.35
Antisocial Behaviour 71.52 96.97 107.33 194.40 65.55 106.46
Recorded Crimes 15.24 20.60 23.25 38.31 11.52 21.88
0
50
100
150
200
250
Rate per 1,000
Crime and Antisocial Behaviour by Locality for 2014-15 as a rate per 1,000 Population, Police Scotland
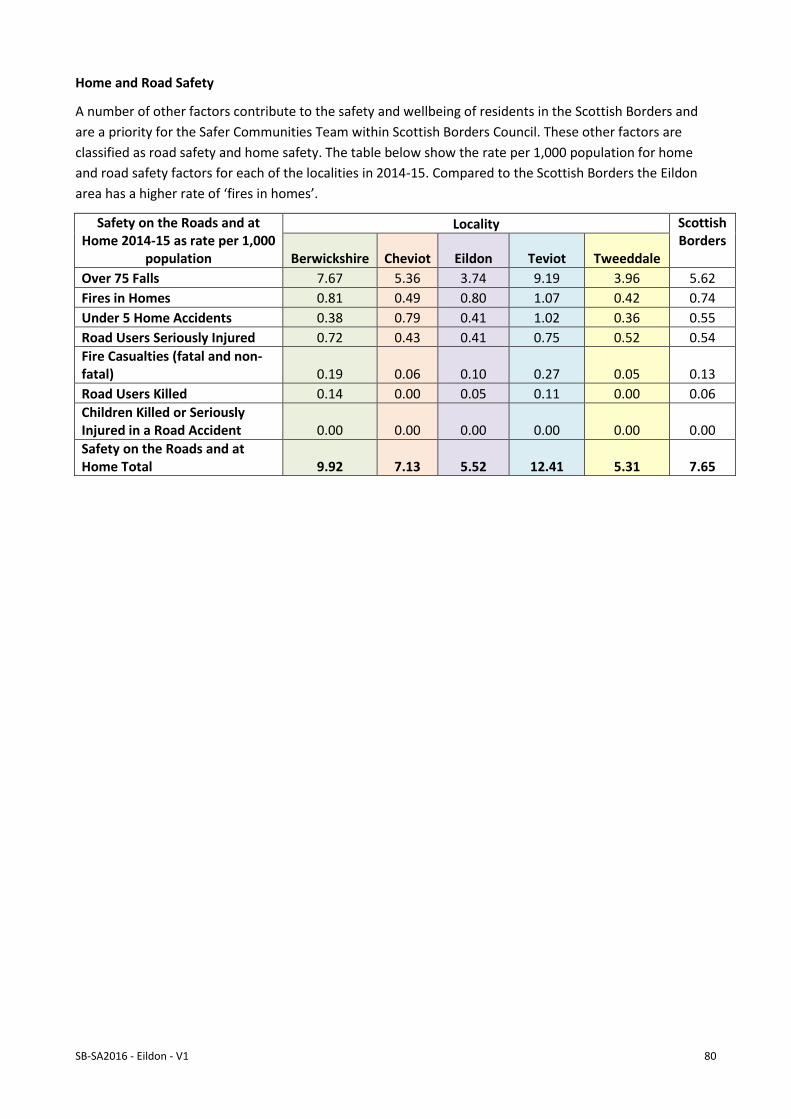
SB-SA2016 - Eildon - V1 80
Home and Road Safety
A number of other factors contribute to the safety and wellbeing of residents in the Scottish Borders and
are a priority for the Safer Communities Team within Scottish Borders Council. These other factors are
classified as road safety and home safety. The table below show the rate per 1,000 population for home
and road safety factors for each of the localities in 2014-15. Compared to the Scottish Borders the Eildon
area has a higher rate of ‘fires in homes’.
Safety on the Roads and at Home 2014-15 as rate per 1,000
population
Locality Scottish Borders
Berwickshire Cheviot Eildon Teviot Tweeddale
Over 75 Falls 7.67 5.36 3.74 9.19 3.96 5.62
Fires in Homes 0.81 0.49 0.80 1.07 0.42 0.74
Under 5 Home Accidents 0.38 0.79 0.41 1.02 0.36 0.55
Road Users Seriously Injured 0.72 0.43 0.41 0.75 0.52 0.54
Fire Casualties (fatal and non-fatal) 0.19 0.06 0.10 0.27 0.05 0.13
Road Users Killed 0.14 0.00 0.05 0.11 0.00 0.06
Children Killed or Seriously Injured in a Road Accident 0.00 0.00 0.00 0.00 0.00 0.00
Safety on the Roads and at Home Total 9.92 7.13 5.52 12.41 5.31 7.65

SB-SA2016 - Eildon - V1 81
Built and Physical Environment
Derelict Sites
The Scottish Borders consistently has a higher proportion of people living within 500 metres of a derelict
site compared to Scotland.
Within the Scottish Borders, the proportion of people living within 500 metres of a derelict site by
Intermediate Zone ranges from 0% to 99%. Within Eildon 59.9% of the population lived within 500 metres
of derelict sites.
2007 2008 2009 2010 2011 2012 2013
Scottish Borders 48.4 45.9 45.4 44.3 43.3 43.6 40.9
Scotland 27.3 29.4 30.8 29.8 30.1 30.9 29.7
0.0
10.0
20.0
30.0
40.0
50.0
60.0
Percentage of population living within 500 metres of a derelict site, SVDLS
0.0 31.5 17.1 59.9 67.6 30.9 98.5
Scottish Borders, 40.9
Scotland, 29.7
0.0
20.0
40.0
60.0
80.0
100.0
120.0
Lowest Berwickshire Cheviot Eildon Teviot &Liddesdale
Tweeddale Highest
Percentage of population living within 500 metres of a derelict site2013, SVDLS/SNS

SB-SA2016 - Eildon - V1 82
Cleanliness of the Scottish Borders
The Scottish Borders Household Survey 2015 shows that overall satisfaction with the cleanliness of their
area was 79%. Eildon had the lowest proportion of people ‘very satisfied / fairly satisfied’ compared to the
other localities.
The Scottish Borders Household Survey asks about the satisfaction with the maintenance of local public
conveniences. The graph below shows the proportions for ‘very satisfied/ fairly satisfied’ compared to ‘very
dissatisfied / fairly dissatisfied’; the Eildon results were similar to the Scottish Borders average.
Berwickshire Cheviot Eildon Teviot TweeddaleScottishBorders
Very Satisfied / Fairly Satisfied 81.6% 82.4% 74.2% 74.7% 81.8% 79.0%
Very Dissatisfied / Fairly Dissatisfied 11.5% 11.9% 18.5% 20.0% 13.6% 15.0%
0.0%
20.0%
40.0%
60.0%
80.0%
100.0%
Satisfaction with: The cleanliness
of the area in which you live
Source: SBHS 2015
Berwickshire Cheviot Eildon Teviot Tweeddale Scottish Borders
Very Satisfied / Fairly Satisfied 31.0% 50.4% 35.7% 35.8% 40.4% 38.7%
Very Dissatisfied / Fairly Dissatisfied 19.9% 16.5% 23.7% 30.0% 20.4% 22.0%
0.0%
20.0%
40.0%
60.0%
Satisfaction with: Maintenance of your
local publicconveniences
Source: SBHS 2015

SB-SA2016 - Eildon - V1 83
Environmental Impact
Waste and Recycling Satisfaction
The Scottish Borders Household Survey 2015 showed 77.4% of respondents being ‘Very Satisfied/ Fairly
Satisfied’ with the kerbside waste and recycling collection, it was slightly lower in Eildon (75.4%).
The Scottish Borders Household Survey 2015 asked about satisfaction of the community recycling centres
and the recycling ‘bring sites’. Eildon had a slightly higher level of satisfaction compared to the Scottish
Borders.
Over 60% of respondents are ‘very satisfied / fairly satisfied’ with the recycling ‘bring sites’ (glass and
textiles) situated across the Scottish Borders.
Berwickshire Cheviot Eildon Teviot Tweeddale Scottish Borders
Very Satisfied / Fairly Satisfied 81.0% 78.7% 75.4% 77.0% 75.4% 77.4%
Very Dissatisfied / Fairly Dissatisfied 8.1% 10.1% 13.5% 13.3% 14.7% 12.0%
0.0%
10.0%
20.0%
30.0%
40.0%
50.0%
60.0%
70.0%
80.0%
90.0%
Satisfaction withyour kerbside waste
and recycling collectionservices overall
Source: SBHS 2015
Berwickshire Cheviot Eildon Teviot Tweeddale Scottish Borders
Very Satisfied / Fairly Satisfied 69.4% 64.0% 72.0% 70.2% 63.9% 67.6%
Very Dissatisfied / Fairly Dissatisfied 7.3% 5.3% 5.7% 7.5% 11.0% 7.5%
0.0%
10.0%
20.0%
30.0%
40.0%
50.0%
60.0%
70.0%
80.0%
Satisfaction withthe service offeredat the Community Recycling Centres
Source: SBHS 2015
Berwickshire Cheviot Eildon Teviot Tweeddale Scottish Borders
Very Satisfied / Fairly Satisfied 60.5% 64.9% 61.5% 64.6% 60.2% 62.0%
Very Dissatisfied / Fairly Dissatisfied 8.1% 8.3% 9.6% 7.9% 10.4% 9.1%
0.0%
10.0%
20.0%
30.0%
40.0%
50.0%
60.0%
70.0%
Satisfaction withthe recycling bring sites
(glass and textiles) that are situated
across the Borders
Source: SBHS 2015

SB-SA2016 - Eildon - V1 84
Energy Consumption
Gas Consumption
According to the Department of Environment and Climate Change (DECC), the total gas consumption in the
Scottish Borders has decreased by 23% from 1,013 GWh in 2005 to 784 GWh in 2014. Between 2005 and
2014 Industrial and Commercial consumption decreased by 31% whereas the domestic consumption
decreased by 17%.
The graph below shows the average domestic gas consumption per meter in 2013 by the 2011 based
Intermediate Zones for the Scottish Borders.
2005 2006 2007 2008 2009 2010 2011 2012 2013 2014
Industrial and Commercial 406 378 352 333 313 313 279 297 288 280
Domestic Consumption 607 607 621 602 551 553 520 526 512 504
Total Gas Sales (GWh) 1013 985 973 935 864 865 799 824 800 784
0
200
400
600
800
1000
1200
0
200
400
600
800
1000
1200
Gas Sales (GWh)
Gas Consumption (GWh) - in the Scottish Borders 2005 to 2014, DECC
0
5000
10000
15000
20000
25000
kWh per meter
Average Domestic Gas Consumption (kWh per meter) in 2013 for Intermediate Zones (2011 based) in the Scottish Borders, DECC

SB-SA2016 - Eildon - V1 85
Electricity Consumption
According to DECC, the total electricity consumption in the Scottish Borders decreased by 5.7% from 635
GWh in 2005 to 599 GWh in 2014. The domestic electricity use contributes decreased by 11.6% whereas
the industrial and commercial use only decreased by 0.4%.
The graph below shows the average domestic electricity consumption per meter in 2013 by the 2011 based
Intermediate Zones for the Scottish Borders. It shows higher domestic electricity consumption in the more
rural areas of the Scottish Borders compared to the towns.
2005 2006 2007 2008 2009 2010 2011 2012 2013 2014
Industrial and Commercial 331 328 332 305 309 322 315 320 315 330
Domestic Consumption 304 294 295 285 285 282 273 273 262 268
Total Electricity Sales (GWh) 635 622 627 590 594 605 588 593 577 599
0
100
200
300
400
500
600
700
0
100
200
300
400
500
600
700
Electricity Sales (GWh)
Electricity Consumption (GWh) - in the Scottish Borders 2005 to 2014, DECC
0
1000
2000
3000
4000
5000
6000
7000
kWh per meter
Average Domestic Electricity Consumption (kWh per meter) in 2013 for Intermediate Zones (2011 based) in the Scottish Borders, DECC

SB-SA2016 - Eildon - V1 86
Community Support and Community Resilience
Rating of neighbourhood as a place to live
The Scottish Household Survey (SHS) asks respondents to rate their neighbourhood as place to live. The
Scottish Borders consistently has a higher proportion of people rating their neighbourhood as a Very Good
or Fairly Good place to live compared to Scotland.
The Scottish Borders Household Survey 2015 (SBHS2015) also asked respondents to rate their
neighbourhood as a place to live. Eildon had a similar proportion of respondents rating their
neighbourhood as Very Good or Fairly Good compared to the Scottish Borders.
The SBSH2015 asked respondents if their neighbourhood had ‘got better or worse’ over the past three
years. 74.2% of the respondents for the Scottish Borders thought their neighbourhood ‘got better or stayed
the same’. The Eildon area had the lowest proportion who felt their area got ‘better’.
1999-2000
2001-2002
2003-2004
2005-2006
2007-2008
2009-2010
2012 2013 2014
Scottish Borders 95% 97% 95% 95% 95% 97% 97% 96% 98%
Scotland 91% 92% 92% 92% 92% 94% 94% 94% 94%
86%
88%
90%
92%
94%
96%
98%
100%
Proportion of People Who Rate Their Neighbourhood as Very/Fairly Good: Scottish Borders vs. Scotland, SHS
Berwickshire Cheviot Eildon Teviot TweeddaleScottishBorders
Very Good / Fairly Good 91.9% 93.6% 90.9% 86.1% 93.6% 91.2%
Very Poor / Fairly Poor 2.4% 2.9% 3.6% 7.3% 2.7% 3.8%
0.0%
20.0%
40.0%
60.0%
80.0%
100.0%
Thinking about yourneighbourhood, how
would you rate it as a place to live?
Source: SBHS 2015
Berwickshire Cheviot Eildon Teviot Tweeddale Scottish Borders
Better 9.2% 7.2% 7.0% 7.3% 9.4% 8.1%
Stayed the same 65.0% 71.7% 68.8% 62.2% 64.1% 66.1%
Worse 15.4% 11.2% 15.0% 19.5% 12.2% 14.7%
0.0%
10.0%
20.0%
30.0%
40.0%
50.0%
60.0%
70.0%
80.0%
Has your neighbourhood
got better or worseover the pastthree years?
Source: SBHS 2015

SB-SA2016 - Eildon - V1 87
Maximising External Funding Investment in the Scottish Borders
Scottish Borders Council aims to maximise external funding investment in the Scottish Borders and to
achieve best value for the Council’s own grant schemes. Key funding sources include LEADER, Landfill
Communities Fund, National Lottery and Scottish Borders Council’s Community Grant Scheme.
A focus on small grants provides significant support to small, local groups working with volunteers at small
community level. Small community groups are a vital part of the fabric of community life. They play a key
role in helping to uncover, understand and address local need and they help unlock community action in a
way that considerably adds to the quality of life in the area.
LEADER Projects 2007-2013
LEADER is a part European, part nation state funded programme that has been giving grants to grow,
diversify and develop the rural economy since the mid-1990’s. Each LEADER programme has slightly
different emphases aimed at locally identified priorities with decisions on who to fund being made by a
group of local volunteers from the business, public and third sectors. LEADER is one of the few funding
programmes dedicated to Community Led Local Development. LEADER can fund private businesses
including agricultural businesses, community groups and charities, social enterprises and public sector
projects.
The tables below provide a summary of the LEADER programme in the Scottish Borders between 2007 and
2013. Overall, there were 70 projects receiving over £3.5 million for the Scottish Borders. The majority of
the projects were ‘Borders Wide’, although each locality had at least 3 projects.
Number of LEADER Projects in the Scottish Borders for 2007 to 2013 by Area
Category Berwick-
shire
Cheviot Eildon Teviot &
Liddesdale
Tweeddale Borders
Wide
Borders
Total
%
Broadband 3 1 4 6%
Capital 2 2 1 5 7%
Community 1 2 3 4 10 14%
Environmental 9 9 13%
Micro business 1 2 6 9 13%
Tourism 4 1 1 2 5 7 20 29%
Youth 1 1 1 10 13 19%
Grand Total 10 4 6 3 11 36 70 100%
% by Area 14% 6% 9% 4% 16% 51% 100%
Funding of LEADER Projects in the Scottish Borders for 2007 to 2013 by Area
Category
Berwick-
shire Cheviot Eildon
Teviot &
Liddesdale Tweeddale
Borders
Wide
Borders
Total
%
Broadband £187,643
£28,908
£216,551 6%
Capital £402,862 £217,456 £166,590
£786,908 22%
Community
£29,304 £97,822
£39,656 £47,709 £214,491 6%
Environmental
£467,702 £467,702 13%
Micro business
£15,700
£35,000 £261,430 £312,130 9%
Tourism £152,113 £21,000 £14,750 £71,278 £168,650 £454,744 £882,534 25%
Youth £8,921
£12,045 £34,092 £580,302 £635,359 18%
Grand Total £751,539 £267,760 £323,770 £83,323 £277,398 £1,811,886 £3,515,675 100%
% by Area 21% 8% 9% 2% 8% 52% 100%

SB-SA2016 - Eildon - V1 88
Voluntary Work
Self-Reported Volunteering
According to the Scottish Borders Household Survey 2015 27.4% of the adults responding to the survey said
they were involved in voluntary work. The Eildon area had a lower level compared to the Scottish Borders.
Scottish Borders Alert
The SB Alert system provides up to date information to communities, individuals and businesses on
emergencies, weather warnings, utility failure updates, road closures, crimes and trading standards issues.
SBC and partners including Police Scotland, Scottish Fire and Rescue Service and NHS Borders launched the
service in October 2014. As of March 2016, there were 3,788 SB Alert customers located throughout the
Scottish Borders. The table below shows the number of SB Alert users and the rate per 1,000 population;
the Cheviot area has the highest rate of membership.
http://www.sbalert.co.uk
/
Berwickshire Cheviot Eildon Teviot Tweeddale Scottish Borders
Yes 28.6% 27.6% 23.7% 23.4% 33.6% 27.4%
0.0%
20.0%
40.0%Proportion of people who are involved in any voluntary work Source: SBHS 2015
SB Alerts at March 2016 Area Number Rate per 1,000
Berwickshire 639 31
Cheviot 710 43
Eildon 1241 32
Teviot 435 23
Tweeddale 763 40
Scottish Borders 3788 33
Source: SBC

SB-SA2016 - Eildon - V1 89
Cultural Activity
Public Sector Culture and Sport Facilities
The table and map below shows the culture and sport facilities operated by the public sector.
Facility Type / Area Berwickshire Cheviot Eildon Teviot and
Liddesdale
Tweeddale Scottish
Borders
Arts Centre 1 1 2
Community Centre 3 5 1 1 10
Hall 1 2 6 1 3 13
Library 1 5 1 1 8
Library Contact
Centre
2 2 1 5
Museum 3 3 3 3 2 14
Sport-Leisure 2 2 9 1 3 17
Total 12 9 28 8 12 69
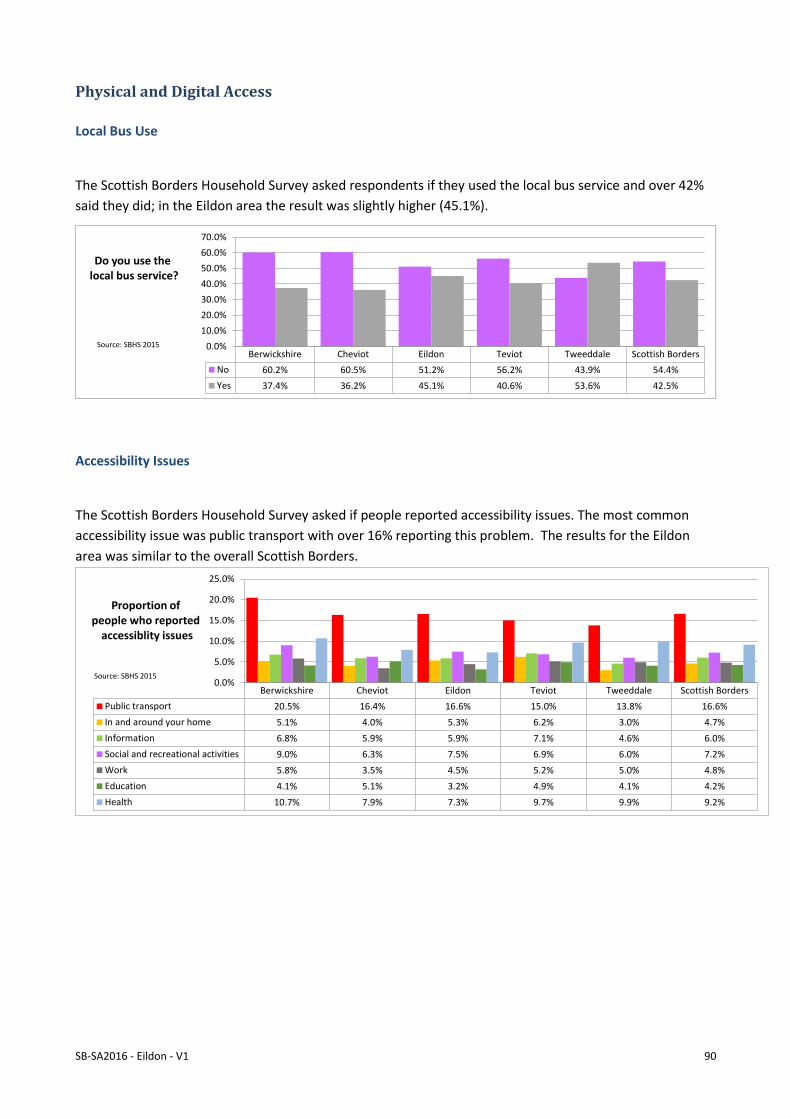
SB-SA2016 - Eildon - V1 90
Physical and Digital Access
Local Bus Use
The Scottish Borders Household Survey asked respondents if they used the local bus service and over 42%
said they did; in the Eildon area the result was slightly higher (45.1%).
Accessibility Issues
The Scottish Borders Household Survey asked if people reported accessibility issues. The most common
accessibility issue was public transport with over 16% reporting this problem. The results for the Eildon
area was similar to the overall Scottish Borders.
Berwickshire Cheviot Eildon Teviot Tweeddale Scottish Borders
No 60.2% 60.5% 51.2% 56.2% 43.9% 54.4%
Yes 37.4% 36.2% 45.1% 40.6% 53.6% 42.5%
0.0%
10.0%
20.0%
30.0%
40.0%
50.0%
60.0%
70.0%
Do you use thelocal bus service?
Source: SBHS 2015
Berwickshire Cheviot Eildon Teviot Tweeddale Scottish Borders
Public transport 20.5% 16.4% 16.6% 15.0% 13.8% 16.6%
In and around your home 5.1% 4.0% 5.3% 6.2% 3.0% 4.7%
Information 6.8% 5.9% 5.9% 7.1% 4.6% 6.0%
Social and recreational activities 9.0% 6.3% 7.5% 6.9% 6.0% 7.2%
Work 5.8% 3.5% 4.5% 5.2% 5.0% 4.8%
Education 4.1% 5.1% 3.2% 4.9% 4.1% 4.2%
Health 10.7% 7.9% 7.3% 9.7% 9.9% 9.2%
0.0%
5.0%
10.0%
15.0%
20.0%
25.0%
Proportion of people who reported
accessiblity issues
Source: SBHS 2015

SB-SA2016 - Eildon - V1 91
Internet Use
The Scottish Borders Household Survey asks respondents how they normally access the internet. Over two
thirds of the Scottish Borders population normally access the internet through their own mobile device. A
slightly lower proportion of respondents ‘do not use internet or email’ in Eildon (14.1%) compared to the
Scottish Borders (14.9%).
Berwickshire Cheviot Eildon Teviot TweeddaleScottishBorders
Own mobile device e.g. laptop, mobile phone,smart phone, tablet
66.2% 66.7% 66.3% 67.6% 70.3% 67.6%
Own home device computer or smart TV 40.2% 39.9% 42.6% 33.3% 44.4% 40.5%
Library or other Council facility internet access PC 3.9% 3.3% 3.4% 4.3% 2.8% 3.5%
Public internet access e.g. internet café 0.4% 1.7% 1.1% 1.9% 1.6% 1.4%
Do not use internet or email 15.2% 16.0% 14.1% 16.5% 13.8% 14.9%
0.0%
10.0%
20.0%
30.0%
40.0%
50.0%
60.0%
70.0%
80.0%
How do younormally access the internet ?
Source: SBHS 2015

SB-SA2016 - Eildon - V1 92
Public Services
Public Priorities
The Scottish Borders Household Survey 2015 (SBHS2015) asked respondents to rank a variety of issues in
order of importance. Over 70% of the respondents identified ‘growing the economy of the Borders, and
supporting retailers and businesses’ as a top 5 priority. The other issues that had the highest ranking of
importance were ‘providing high quality care for older people’ and ‘tackling poverty and inequality’. More
respondents in the Eildon area considered ‘raising educational attainment and achievement’, ‘making more
affordable housing available’ and ‘reinstatement of the Borders Railway to Hawick and Carlisle’ to be a top
5 priorities compared to the Scottish Borders.
Growing theeconomy ofthe Borders,
andsupporting
retailers andbusinesses
Providinghigh quality
care for olderpeople
Tacklingpoverty andinequality
Raisingeducationattainment
andachievementand helpingpeople of allages obtain
the skillsthey need forlearning, life
and work
Providingactivities andfacilities for
youngerpeople
Providingsustainabletransport
linksincludingdemand
responsivetransport
Making moreaffordable
housingavailable
Improvingmobilephone
coverage inthe Borders
Improvingaccess tosuperfast
broadband inthe Borders
Reinstatement of Bordersrailway linkto Hawick
and Carlisle
Increaseenergy
efficiency atwork and inthe home
Providingarts, cultureand heritageactivities for
all ages
Eildon 70.6% 53.3% 52.2% 46.5% 38.3% 33.9% 33.2% 26.7% 25.8% 27.1% 20.5% 18.4%
Scottish Borders 70.5% 53.0% 47.3% 45.8% 39.6% 37.8% 31.0% 29.7% 29.0% 24.2% 20.0% 16.6%
0.0%
10.0%
20.0%
30.0%
40.0%
50.0%
60.0%
70.0%
80.0%
Proportion of people who rank these issues in the TOP 5 priorities for the Scottish BordersSource: SBHS 2015

SB-SA2016 - Eildon - V1 93
Satisfaction with Public Services
Scottish Borders Household Survey
The Scottish Borders Household Survey 2015 (SBHS2015) asked about satisfaction with the service provided
by the Fire and Rescue Service and 67.4% are very or fairly satisfied with the service in Eildon compared to
68.7% for all areas.
A higher proportion people in Eildon (50.1%) ‘strongly agree / agree’ with “taking everything into account, I
have confidence in the police in by local area” compared to the Scottish Borders (46.1%).
The SBHS2015 asked respondents to rate the Scottish Borders Council overall. Less people in Eildon rate
the council as excellent or good compared to all of the Scottish Borders.
Berwickshire Cheviot Eildon Teviot Tweeddale Scottish Borders
Very Satisfied / Fairly Satisfied 64.5% 70.6% 67.4% 75.3% 67.3% 68.7%
Very Dissatisfied / Fairly Dissatisfied 2.1% 0.9% 1.2% 0.9% 1.1% 1.2%
0.0%
10.0%
20.0%
30.0%
40.0%
50.0%
60.0%
70.0%
80.0%
Satisfaction withthe service provided
by the Fire and Rescue Service in your
local area?
Source: SBHS 2015
Berwickshire Cheviot Eildon Teviot Tweeddale Scottish Borders
Strongly Agree / Agree 49.1% 46.1% 50.1% 42.1% 43.5% 46.1%
Strongly Disagree / Disagree 13.7% 18.9% 19.1% 26.6% 19.3% 19.6%
0.0%
20.0%
40.0%
60.0%
Taking everything into account,
I have confidence in the police in my local area
Source: SBHS 2015
Berwickshire Cheviot Eildon Teviot Tweeddale Scottish Borders
Excellent / Good 65.6% 62.3% 57.0% 55.6% 61.8% 60.3%
Very Poor/ Poor 12.8% 19.1% 23.9% 27.7% 18.4% 20.5%
0.0%
20.0%
40.0%
60.0%
80.0%
How would you rate Scottish Borders
Council overall?
Source: SBHS 2015

SB-SA2016 - Eildon - V1 94
Influence / involvement in public sector
The Scottish Borders Household Survey 2015 asked respondents about their satisfaction with opportunities
to participate in the local decision making process provided by Scottish Borders Council. Overall in the
Scottish Borders 38.2% were ‘Very / Fairly Satisfied’ compared to 27.9% stating they were ‘Very/ Fairly
Dissatisfied’. Eildon had a lower of level satisfaction compared to Scottish Borders.
The Scottish Borders Household Survey 2015 asked if respondents had taken part in any consultations run
by the Council (other than the SBHS2015). In Eildon 12.5% of respondents stated they had participated in a
consultation slightly below to the 12.9% for the Scottish Borders.
Berwickshire Cheviot Eildon Teviot Tweeddale Scottish Borders
Very Satisfied / Fairly Satisfied 42.5% 34.6% 36.7% 39.7% 39.1% 38.2%
Very Dissatisfied / Fairly Dissatisfied 23.7% 27.0% 29.6% 28.1% 29.6% 27.9%
0.0%
5.0%
10.0%
15.0%
20.0%
25.0%
30.0%
35.0%
40.0%
45.0%
Source: SBHS 2015
Satisfaction withthe opportunitiesfor participating in the local decision making process
provided by Scottish Borders
Berwickshire Cheviot Eildon Teviot Tweeddale Scottish Borders
Yes 11.3% 13.1% 12.5% 9.9% 17.0% 12.9%
0.0%2.0%4.0%6.0%8.0%
10.0%12.0%14.0%16.0%18.0%
Have you takenpart in any
consultations run by the Council?
Source: SBHS 2015