KNOCKING - Squarespace of High School Graduates • December 2016 WICHE Western Interstate...
160
Projections of High School Graduates • December 2016 WICHE Western Interstate Commission for Higher Education KNOCKING AT THE COLLEGE DOOR Peace Bransberger Demarée K. Michelau with support from
Transcript of KNOCKING - Squarespace of High School Graduates • December 2016 WICHE Western Interstate...

Projections of High School Graduates • December 2016
WICHEWestern Interstate Commission
for Higher Education
KNOCKINGAT THE COLLEGE DOOR
Peace Bransberger Demarée K. Michelau
with support from


Projections of High School GraduatesDecember 2016
WICHEWestern Interstate Commission
for Higher Education
KNOCKINGAT THE COLLEGE DOOR
Peace Bransberger Demarée K. Michelau
with support from

Projections of High School Graduatesii
AT THE COLLEGE DOORKNOCKING
Western Interstate Commission for Higher Education
The Western Interstate Commission for Higher Education (WICHE) is a federal compact of the 15 Western states and U.S. Pacific Territories and Freely Associated States established to promote and facilitate resource sharing, collaboration, and cooperative planning. WICHE’s mission is to expand educational access and excellence for all citizens of the West. Members are:
Alaska Montana Utah Arizona Nevada Washington California New Mexico Wyoming Colorado North Dakota U.S. Pacific Territories Hawai‘i Oregon and Freely Associated
Idaho South Dakota States
WICHE’s broad objectives are to:
• Strengthen educational opportunities for students through expanded access to programs.
• Assist policymakers in dealing with higher education and human resource issues through research and analysis.
• Foster cooperative planning, especially that which targets the sharing of resources.
This publication was prepared by the Policy Analysis and Research Unit, which is involved in the research, analysis, and reporting of information on public policy issues of concern in the WICHE states. Inquiries regarding these data should be directed to Peace Bransberger, senior research analyst, at [email protected] or 303.541.0257. To download a copy of this report and access related data resources, please visit www.wiche.edu/knocking. Additional WICHE resources are available at www.wiche.edu.
Suggested Citation:
Peace Bransberger and Demarée K. Michelau. Knocking at the College Door: Projections of High School Graduates, 9th Edition. Boulder, CO: Western Interstate Commission for Higher Education, 2016.
©Copyright December 2016Printed in the United States of America
Western Interstate Commission for Higher Education3035 Center Green Drive, Suite 200
Boulder, CO 80301WICHE Publication Number 2A366
Revised February 2017
December 2016 iii
AT THE COLLEGE DOORKNOCKING TABLE OF CONTENTS
TABLE OF CONTENTS
Foreword ..............................................................................................................................................................................vii
Acknowledgements ..............................................................................................................................................................ix
Executive Summary ...............................................................................................................................................................1
Chapter 1. Introduction ........................................................................................................................................................7
Chapter 2. National Projections ..........................................................................................................................................11
U.S. High School Graduating Classes Have Reached a Plateau ...................................................................................11
Swift Change in the Racial/Ethnic Composition of Public High School Graduates .....................................................13
National Projections Summary ....................................................................................................................................18
Chapter 3. Regional and State Variation .............................................................................................................................19
Growth in the South and West ....................................................................................................................................19
Decline in the Northeast and Midwest ........................................................................................................................21
Declines are the Result of Decreasing Numbers of White Graduates ........................................................................21
Other Factors Contributing to Declining Numbers ......................................................................................................25
Growth is the Result of Increasing Numbers of Non-White Graduates ......................................................................26
State Variation ..............................................................................................................................................................27
First-Time Projections for U.S. Pacific Territories and Freely Associated States .........................................................30
Regional and State Variation Summary .......................................................................................................................31
Chapter 4. Enrollment Projections .....................................................................................................................................33
Trends with Younger Youth Drive High School Graduate Production..........................................................................33
Progress Through the K-12 Pipeline.............................................................................................................................34
Enrollment Projections Summary ................................................................................................................................41
Chapter 5. Implications .......................................................................................................................................................43
Policy Questions and Implications ...............................................................................................................................43
Implications Summary..................................................................................................................................................47
Appendices
Appendix A. High School Graduate Data Tables ..........................................................................................................49
Appendix B. High School Enrollment Data Tables .....................................................................................................109
Appendix C. Technical Information and Methodology ..............................................................................................117
References.........................................................................................................................................................................143
List of Tables
Table 3.1. Top 10 States that Produce a Majority of U.S. High School Graduates .............................................................20
Table C.1. Percent Difference of Projected Total Graduates Compared to Graduates Reported to NCES CCD ..............121
Table C.2. States Included in the Simulated Comparison Projection (Percent of National Public Total Graduates and Number of Graduates) .............................................................................................................................124
Errata List..........................................................................................................................................................................147

Projections of High School Graduatesiv
AT THE COLLEGE DOORKNOCKING
Table C.3. 2015 U.S. Census Black Population Estimates .................................................................................................128
Table C.4. States by Years of Overlapping Births and School Data ...................................................................................131
Table C.5. Comparison of Official Graduation Rate and Computed Ninth-to-Graduation Ratios ...................................133
Table C.6. Estimation of Suppressed Births Counts..........................................................................................................135
Table C.7. Public School Data and Methodology Adjustments ........................................................................................137
Table C.8. Private School Data and Methodology Adjustments .......................................................................................139
List of Figures
Figure 1.1. Total U.S. Public and Private High School Graduates (Actual and Projected) 1979 to 2032 ............................. 7
Figure 2.1. Total U.S. Public and Private High School Graduates, School Years 2000-01 to 2012-13 (Actual) through 2013-14 to 2031-32 (Projected) .........................................................................................................................................11
Figure 2.2. U.S. High School Graduating Classes, Percent Change from 2013 (Public Total) ............................................12
Figure 2.3. U.S. Private High School Graduates, School Years 2000-01 to 2010-11 (Actual) through 2011-12 to 2031-32 (Projected) ............................................................................................................................................................13
Figure 2.4. Total U.S. Public and Private High School Graduates, by Race/Ethnicity, School Years 2000-01 to 2012-13 (Actual) through 2013-14 to 2031-32 (Projected) ...............................................................................................14
Figure 2.5. Projected Cumulative Change in U.S. High School Graduates after School Year 2012-13, by Race/Ethnicity (White) ...................................................................................................................................................15
Figure 2.6. Projected Cumulative Change in U.S. High School Graduates after School Year 2012-13, by Race/Ethnicity (Hispanic) ...............................................................................................................................................16
Figure 2.7. Projected Cumulative Change in U.S. High School Graduates after School Year 2012-13, by Race/Ethnicity (Asian/Pacific Islander) ..........................................................................................................................16
Figure 2.8. Projected Cumulative Change in U.S. High School Graduates after School Year 2012-13, by Race/Ethnicity (Black) ....................................................................................................................................................17
Figure 2.9. Projected Cumulative Change in U.S. High School Graduates after School Year 2012-13, by Race/Ethnicity (American Indian/Alaska Native) ...........................................................................................................17
Figure 3.1. Regional Divisions of the U.S. ...........................................................................................................................19
Figure 3.2. Total Public and Private High School Graduates, by Region, 2000-01 through 2031-32 ................................19
Figure 3.3. Change in High School Graduates from School Year 2012-13, by Region .......................................................20
Figure 3.4. Annual Percent Change in Total High School Graduates, by Region and Number of Graduates, School Years 2000-01 to 2012-13 (Actual) to School Years 2013-14 to 2031-32 (Projected) ...........................................22
Figure 3.5. High School Graduates by Region and Race/Ethnicity, Midwest .....................................................................24
Figure 3.6. High School Graduates by Region and Race/Ethnicity, Northeast ...................................................................24
Figure 3.7. High School Graduates by Region and Race/Ethnicity, West ...........................................................................25
Figure 3.8. High School Graduates by Region and Race/Ethnicity, South ..........................................................................25
Figure 3.9. Projected High School Graduates 2013-14 to 2031-32, Public by Race/Ethnicity and Private .......................28
Figure 3.10. Guam Public High School Graduates, 2003-04 to 2031-32 ...........................................................................30
Figure 3.11. Puerto Rico Public High School Graduates, 2000-01 to 2031-32 ..................................................................31
TABLE OF CONTENTS

December 2016 v
AT THE COLLEGE DOORKNOCKING TABLE OF CONTENTS
Figure 4.1. Births in the U.S., 1990-2014 ...........................................................................................................................33
Figure 4.2. Births by Race/Ethnicity, by Region, 1992-2014 ..............................................................................................34
Figure 4.3. U.S. School Enrollment by Level and Race/Ethnicity, 2000-01 to 2028-29 .....................................................36
Figure 4.4. Progression of Students Through the Grades, by Race/Ethnicity, School Years 2000-01 to 2020-21 (Projected) ..........................................................................................................................................................................40
Figure 5.1. National Assessment of Educational Progress Scores in Math for 8th Graders, 1992-2015 ..........................43
Figure 5.2. National Assessment of Educational Progress Scores in Reading for 8th Graders, 1992-2015 ......................44
Figure 5.3. Postsecondary Educational Attainment Level, Associate's Degree and Above, by Race/Ethnicity, Adults aged 25-64 (2014) ...................................................................................................................................................46
Figure C.1. Comparison of Knocking and NCES Projections, United States Public Schools Total ....................................122
Figure C.2. Partial Simulated Projections Compared to Official, Published Projections ..................................................125
Figure C.3. Availability of Data in New Race/Ethnicity Categories ...................................................................................125
Figure C.4. Snapshot of Available Data for New Race Categories, United States ............................................................129
Figure C.5. Long-Term Graduate Trends Reflect Births 18 Years Prior, 2007-2032 .........................................................131

Projections of High School Graduatesvi
AT THE COLLEGE DOORKNOCKING

December 2016 vii
AT THE COLLEGE DOORKNOCKING FOREWORD
FOREWORD
As a former community college and university president, as well as the former executive director of the Colorado Department of Higher Education, I have spent a lot of time thinking about how best to serve Colorado residents and their need for high-quality, postsecondary programs. Some of our state colleges and universities had excess capacity while others turned away scores of applicants every year. Students from some demographic populations seemed to enroll and graduate at high rates, while others were consistently underrepresented in our institutions. As I worked to ensure that our institutions were meeting our short-term needs, it was easy to overlook the important planning that was necessary to create the capacity to serve not just the students who were already at our doors, but those who would be coming next year, five years, and 10 years in the future. That is why I relied on the critically important information provided in the Knocking at the College Door reports that have been produced by the Western Interstate Commission for Higher Education (WICHE) for the last four decades.
This latest report, like the ones before it, provides an important predictive analysis of future high school graduates, including not just the anticipated number of graduates but also the demographic composition of those graduates and the geographic areas in which we will see growth, stagnation, or decline. The data tell us that even when the number of graduates does not change dramatically, the same cannot be
said of the racial and ethnic composition of those graduating classes. Nor are there consistent patterns in the geographic areas that produce those graduates. Regions, states, and communities reflect very different growth rates, and similarly, we see very different growth rates among our racial and ethnic demographic populations, with the strongest growth rates among Asians and Hispanics. With the right planning and focus, people from all demographic populations can help us meet the workforce challenges all states will face in the future as a result of our changing economy.
Because every state has limited resources for K-12 and higher education, and because every state faces a need for a more educated workforce, we must ensure that we are targeting our resources effectively. This report will help all of us, as it helped me in my previous roles, to do exactly that. We can meet the education and workforce needs of the future, but only if we know whom we must serve effectively in our postsecondary institutions. New student populations may require new approaches and new techniques – from the time, place, and manner of instructional delivery to the non-instructional support systems that improve enrollment and outcomes. This edition of Knocking at the College Door, like all those that preceded it, provides a roadmap to help guide us through the demographic changes that will define our future.
Joseph A. GarciaPresident Western Interstate Commission for Higher Education

Projections of High School Graduatesviii
AT THE COLLEGE DOORKNOCKING
December 2016 ix
AT THE COLLEGE DOORKNOCKING ACKNOWLEDGEMENTS
ACKNOWLEDGEMENTS
WICHE is grateful to the many colleagues and organizations who contributed to the production of the 9th edition of Knocking at the College Door: Projections of High School Graduates. In particular, WICHE would like to acknowledge the financial support and partnership of ACT, Inc. and The College Board, for without their collaboration and guidance this report and related resources would not have been possible. WICHE also thanks members of the Knocking at the College Door Advisory Group for their wise counsel and advice over the past year. Members include:
Patricia Barth, director, Center for Public Education, National School Boards Association (NSBA)
Jack Buckley, senior vice president, research, The College Board
Emily Calderon Galdeano, senior associate, Excelencia in Education
Andrew Carlson, senior policy analyst, State Higher Education Executive Officers (SHEEO)
Matthew Crellin, senior associate, National Center for Higher Education Management Systems (NCHEMS)
Will Doyle, associate professor, Vanderbilt University
Nate Easley, executive director, Denver Scholarship Foundation
Steve Kappler, vice president, brand experience, ACT, Inc.
Jeffrey Passel, senior demographer, Pew Research Center
Kent Rinehart, assistant vice president of enrollment managment/dean of admission, Marist College
José Rios, director, multicultural communications, The College Board
David Sanders, research director, American Indian College Fund
Brian Sponsler, director, postsecondary institute, Education Commission of the States (ECS)
Jeff Strohl, director of research, Georgetown Center on Education and the Workforce
Christina Whitfield, associate vice president, State Higher Education Executive Officers (SHEEO)
Several individuals were instrumental to the production and dissemination of this report. Colleen Falkenstern, WICHE’s intern in the Policy Analysis and Research unit, assisted with data collection and analysis, and Candy Allen, WICHE’s senior graphic designer, provided her support, talent, and patience throughout the entire process. Paul Lagasse of Active Voice Editorial Consulting edited the print publication, while Boulder Insight developed the online data visualization tool, and Bross Group designed the Knocking at the College Door website. Finally, we want to thank Christina Sedney, Patrick Lane, Sarah Ohle Leibrandt, and Jere Mock for their review of the projections, contributions along the way, and copyediting of everything we asked them to review. This has truly been a group effort, and we appreciate all the hard work and dedication of everyone involved.

Projections of High School Graduatesx
AT THE COLLEGE DOORKNOCKING

December 2016 1
AT THE COLLEGE DOORKNOCKING EXECUTIVE SUMMARY
EXECUTIVE SUMMARY
For nearly 40 years, the Western Interstate Commission for Higher Education (WICHE) has produced projections of high school graduates. The purpose of Knocking at the College Door: Projections of High School Graduates is to equip decision-makers at all levels with information about how the numbers of high school graduates are likely to change in the years ahead. These projections inform a broad audience; stakeholders including policymakers, elected officials and their staffs, state departments of education and higher education, postsecondary system heads, K-12 and school district leaders, administrators at public and private colleges and universities, researchers, policy organization staff, media, and others rely on them for a broad variety of uses.
This 9th edition of Knocking at the College Door spans school years 2000-01 through 2031-32. As in previous editions, it examines data on public and private schools and projects the number of high school graduates for the nation, four geographic regions, the 50 states, and the District of Columbia. And, for the first time, WICHE also includes projections for Guam and Puerto Rico. Finally, Knocking also presents projections for public high school graduates, disaggregated by race/ethnicity.
U.S. High School Graduating Classes Have Reached a PlateauAfter steady increases in the overall number of high school graduates over the last 15 years, the U.S. is headed into a period of stagnation. WICHE’s projections indicate that the number of graduates in each graduating class will average around 3.4 million through 2023, before peaking at 3.56 million prior to 2026. At the same time, the number of high school graduates from private religious and nonsectarian schools is projected to decline.
Key points include:
ff The nation is projected to produce fewer high school graduates in all of the 10 graduating classes between 2014 and 2023, compared to the highest recorded number of graduates in 2013. The year of greatest decline is projected to be 2017, with about 81,000 fewer graduates (2.3 percent). Three years of growth are projected for 2024 to 2026, reaching about 94,000 more graduates in 2025 (2.7 percent) than in 2013. Between 2027 and 2032, the average size of graduating classes is expected to be smaller than those in 2013.
ff The number of high school graduates from private religious and nonsectarian schools is projected to decline at an even greater rate than the overall trend, from 302,000 in 2011 (the last year for which confirmed graduate counts are available for private schools) to about 220,000 by the early 2030s – a decrease of 80,000 graduates, or 26 percent. Furthermore, graduates from private schools will represent a gradually smaller share of the total by the end of the projection period, from 10 percent of all graduates nationally in 2000 to 9 percent in 2010 to 7 percent by the early 2030s.
Swift Change in the Racial/Ethnic Composition of Public High School GraduatesThe pending national plateau is largely fueled by a decline in the White student population and counterbalanced by growth in the number of non-White public school graduates – Hispanics and Asian/Pacific Islanders in particular. Overall, there will be consistent declines in the number of White public high school graduates and robust growth in the number of public high school graduates of color (or, technically speaking, "non-White" graduates) in the coming years.
Visit www.wiche.edu/knocking to access data, individual state profiles, presentations, and
copies of the report.

Projections of High School Graduates2
AT THE COLLEGE DOORKNOCKING EXECUTIVE SUMMARY
Key points include:
ff White public high school graduates. By 2030, the number of White public school graduates is projected to decrease by 14 percent compared to 2013. Even in 2024-26, when the nation is projected to see some overall increase in the number of high school graduates, there will be about 110,000 fewer White public high school graduates than there were in 2013. The pace of the decline in the number of White public high school graduates is projected to further accelerate after 2025. By 2032, the number of White public high school graduates is projected to be 1.6 million, which is about 252,000 fewer than in 2013. Between the first (2013-14) and last (2031-32) projected years, the share of total high school graduates represented by White high school graduates is projected to drop six percentage points, and over the three decades between the first historical year (2000-01) and the last projected year (2031-32) included in this edition, that share is projected to drop 19 percent.
ff Non-White public high school graduates. Between 2018 and 2028, growth in the number of non-White public high school graduates is projected to replace the numerical decrease in White graduates to a varying extent. In the first five of those years, between 2018 and 2023, the projected increase in the number of non-White public high school graduates could replace the decline in the number of White high school graduates (public and private combined) almost one-to-one. In the years of rapid increase in the number of non-White public high school graduates from 2024 to 2028 – when non-White public high school graduates are projected to number between 1.5 and 1.6 million – for every 100 White high school graduates "lost," there will be an increase of 150 non- White high school graduates. However, in the last years of the projections (2029 to 2032), the number of non-White high school graduates will then fall back to below 1.5 million, which is about the same level as 2020 but still 12 percent higher than in 2013 – an effect of the overall decline in birth rates that began after 2007.
ff Hispanic public high school graduates. The number of Hispanic high school graduates is projected to increase by 50 percent or more from the first projected year, 2014, to the high point of 920,000 graduates around 2025.
ff Asian/Pacific Islander public high school graduates. About 58,000 more Asian/Pacific Islander public high graduates are expected by the early 2030s compared with 2013, representing an increase of up to 30 percent.
ff Native Hawai‘ian/Pacific Islander public high school graduates. Although it was not possible to produce reliable projections for Native Hawai‘ian/Pacific Islander public high school graduates, the data indicate that between 2010-11 and 2013-14, Hawai‘ian/ Pacific Islanders represented about 7 percent of the total combined number of Asian/Pacific Islander students, or about 10,000 public high school graduates on average in these years.
ff Black public high school graduates. The number of Black public high school graduates recently reached a high of about 480,000 in 2010 through 2012. But between now and the early 2030s, the number of Black, non-Hispanic public high school graduates is projected to gradually decline by about 6 percent.
ff American Indian/Alaska Native public high school graduates. American Indian/Alaska Native public high school graduates represent only about 1 percent of the total number of public high school graduates currently, or about 32,000 graduates annually in recent years. This group is projected to decline in number in every year of the projections, to about 25,000 by 2025 and 23,000 by the early 2030s, at which point it will make up only about 0.7 percent of all public high school graduates.
ff Two or More Races public high school graduates. It was not possible to produce reliable projections from the available data for public high school graduates of Two or More Races. The data, however, indicate that students of Two or More Races represented 1 to 3 percent of all non-Hispanic public high school students in the years between 2010-11 and 2013-14.

December 2016 3
AT THE COLLEGE DOORKNOCKING EXECUTIVE SUMMARY
Regional VariationThe national projections of the total number of public and private high school graduates mask significant variations among the nation’s four geographic regions. In general, two overriding patterns have been identified among the four regions throughout the years projected: growth in the number of high school graduates in the South and West, and continuing declines in the number of high school graduates in the Midwest and Northeast. Key points include:
ff The South. The South is the only region that is projected to experience an increase in the number of high school graduates for every year of the projections, although that number is expected to contract after 2025. In the early 2000s, about one-third (33 percent) of the nation’s high school graduates were located in the South, and the region’s share of the national total grew to 43 percent, or 1.23 million high school graduates, by 2013. During the few years of high growth that are expected to end around 2025, it is projected that Southern states will generate almost 47 percent of the nation’s high school graduates, or 1.35 million graduates. By that point, it is projected that the number of graduates in the region will be about 10 percent more than the 2012-13 figure. After this high point, the South is projected to produce about 45 percent of the nation’s high school graduates through the end of the projection period – an annual average of 1.25 million high school graduates.
ff The West. The West generated 25 percent of the nation’s high school graduates in the early 2000s. By 2010, high school graduates from the West represented about 29 percent of the national total (813,400 graduates); that number is projected to be about 30 percent of the total throughout the projection period. The West is projected to reach its new high point in 2024 with about 860,000 high school graduates. It will remain the second-highest-producing region behind the South during the course of the projections, although it is expected to drop back slightly to 28 percent of the total (about 784,000 graduates) by the early 2030s.
ff The Midwest. In 2013, the Midwest generated 22 percent of the nation’s high school graduates (about 762,000). That share is projected to decrease to 19 percent by 2030, meaning 93,000 fewer high school graduates by that time (a decline of 12 percentage points compared to 2013).
ff The Northeast. The trend is broadly the same for the Northeast, which produced around 639,000 graduates in 2013, or 18 percent of the national total. By 2030, the number of high school graduates in the Northeast is projected to decrease to around 567,000 graduates. This number will represent 72,000 fewer graduates by 2030 (a decline of 11 percentage points compared to 2013), and will lead to the Northeast contributing only 16 percent of the nation’s high school graduates by the early 2030s.
First-Time Projections for U.S. Pacific Territories and Freely Associated StatesFor the first time, WICHE attempted projections for Guam and Puerto Rico (data limitations prevented WICHE from making projections for the Commonwealth of the Northern Mariana Islands). Key points include:
ff Guam. Projections indicate that Guam will continue to steadily produce an average of 1,500 public high school graduates per year through the Class of 2023, after which it appears there will be an uptick in high school graduates to about 1,800 on average, per year, related to growth in the number of births from 2006 to 2012 and solid enrollment progression.
ff Puerto Rico. Puerto Rico public schools produced between 29,000 and 32,000 high school graduates in the years between 2000-01 and 2008-09. Declines in births and enrollments begins to show at the high school level most notably beginning in 2009-10, and continuing in each subsequent year. The projections indicate that the Class of 2020 public high school graduates will fall below 20,000. And that by the Class of 2028, there will be less than half the number of public high school graduates as 20 years prior, below 15,000.

Projections of High School Graduates4
AT THE COLLEGE DOORKNOCKING EXECUTIVE SUMMARY
Trends with Younger Youth Drive High School Graduate ProductionWICHE relies on data about the number of recent births and recent K-12 enrollment counts to generate the high school graduate projections in Knocking at the College Door. While these births and enrollment data are not the focus of this publication, WICHE does generate K-12 enrollment projections and makes them available because they provide useful information about the young children who will ultimately move through the educational pipeline and emerge as high school graduates over the course of the next 15 years or so. Key points include:
ff White public school students. The greatest declines are among the numbers of White public school students, whose enrollments declined 8 percent (from 26.3 million to 24.2 million) between 2000-01 and 2010-11, and are projected to decline another 7 percent (to 22.4 million) by 2020-21. White students comprised 54 percent of total public school enrollments in the 2010-11 school year, and 56 percent of middle and high school enrollments, respectively. By school year 2020-21, White students are projected to represent just 50 percent of public school enrollments overall, and this number is projected to dip below 50 percent in the middle and high school grades by school year 2028-29, the last year of WICHE’s high school enrollment projections.
ff Hispanic public school students. Data show just how substantial the contribution of Hispanic students was to public school enrollments overall between 2000 and 2010, increasing from 6.8 million in 2000-01 to 10.1 million in 2020-21 – an increase from 16 percent to 23 percent of all public school students. By grade level, the number of Hispanic public elementary school students increased by 39 percent, 49 percent at the middle school level, and 68 percent at the high school level. The number of Hispanic middle and high school students is projected to continue increasing at a swift pace, by 29 percent and 35 percent, respectively, between 2010-11 and 2020-21. However, the previous rates of increase do not appear to be sustained at the elementary school level, at which the number of Hispanic elementary
school students is projected to increase by only 1 percent through 2020-21. Past 2020-21, trends in the number of Hispanic public high school students will follow the overall trend downward. By school year 2020-21, Hispanic students are projected to account for 26 percent of all public school first- through fifth-graders. Also by school year 2020-21 and going forward throughout the projections, Hispanic students are projected to account for 26 to 28 percent of all public middle school and high school students.
ff Black public school students. The total number of Black public school students is expected to remain relatively steady compared with the other student populations. The number of Black public elementary school students is projected to decline by 3 percent from 3.01 million in 2010-11 to around 2.93 million by 2020-21. The number of Black public middle school students will increase by 2 percent from 1.82 million in 2010-11 to 1.86 million students by 2020-21, and then decline by about 7 percent, to about 1.74 million students, by 2025-26. The number of Black public high school students is projected to decline by 7 percent from 2.47 million in 2010-11 to 2.31 million by 2020-21, and then decline another 2 percent by 2028-29. Between 2000-01 and 2010-11, the number of Black public high school students declined by a percentage point among total enrollments, in part due to small numerical declines but primarily as a result of the strong increase in the number of Hispanic students. By 2010-11, Black public high school students comprised 16 percent of public school elementary and middle school enrollments and 17 percent of public high school enrollments. The percentage of Black students enrolled in public high school is expected to remain at or very near this number throughout the course of the projections.
ff Asian/Pacific Islander public school students. Asian/Pacific Islander public school students are the only student population that is projected to consistently add K-12 public school enrollments throughout the projections, at all school levels. Between 2010-11 and 2020-21, Asian/Pacific Islander public school elementary enrollments are projected to increase by 7 percent (an increase

December 2016 5
AT THE COLLEGE DOORKNOCKING EXECUTIVE SUMMARY
of about 308,000 students), middle school students by 12 percent (155,000), and high school students by 11 percent (224,000). Even in the later years of the projections, when all other student populations are expected to decline in number, the number of Asian/Pacific Islander students is expected to increase. The projections show there will be an additional 7 percent of Asian/Pacific Islander middle school students between 2020-21 and 2025-26, and 10 percent more Asian/Pacific Islander public high school students between 2020-21 and 2028-29. The total number of Asian/Pacific Islander public high school students is projected to increase past 1 million by 2028-29.
ff Native Hawai‘ian/Pacific Islander public school students. Due to data limitations, WICHE was unable to produce reliable projections for Native Hawai‘ian/Pacific Islander public high school students. The available data, however, indicate that between 2010-11 and 2013-14, Hawai‘ian/Pacific Islanders represented about 7 percent of the total combined number of Asian/Pacific Islander students at each school level – elementary, middle, and high school (the number of Native Hawai‘ian/Pacific Islander public school students decreased about 2 percent between school year 2012-13 and 2013-14, which is somewhat contrary to the expected trend).
ff American Indian/Alaska Native public school students. American Indian/Alaska Native students make up roughly 1 percent of all public school students at all levels. Overall, the number of American Indian/Alaska Native students is projected to decrease over the course of the projections. The number of American Indian/Alaska Native public elementary school students is projected to decline by 14 percent between 2010-11 and 2020-21, from about 215,000 to about 184,500 students. At the middle school level, the number is projected to decline by 13 percent by 2020-21 and another 11 percent by 2025-26, from about 131,000 students in 2010-11 to 101,500 students by 2025-26. The number of American Indian/Alaska Native public high school students is projected to decline by 28 percent (from about 175,000 to about 125,000 students) between 2010-11 and 2028-29.
ff Two or More Races public school students. Due to data limitations, WICHE was not able to produce reliable projections for public school students in the Two or More Races category. Students of Two or More Races represented 3 percent of non-Hispanic students in the first through fifth grades in 2010-11, and 5 percent by 2013-14, a 33 percent increase over these four years. In 2013-14, they represented 4 percent of non-Hispanic sixth to eighth graders, and 3 percent of high school students. Nationally, the number of reported students increased by 10 percent or more each year between 2010-11 and 2013-14. These are unusually high rates of growth, which make the accuracy of extrapolated results questionable.
ff Private school students. The number of private school students dipped below 10 percent of total high school enrollments by 2010-11, and this population is projected to decline in both number and share throughout the projection period – ultimately down to 6 to 8 percent of total enrollments across school levels in the later years of the projections. The declines are projected to be steepest over the next few years, and then should level off somewhat. The number of private elementary and middle school students is projected to decrease 9 percent and 14 percent, respectively, from 2010-11 through 2020-21. Private high school enrollment is expected to decline 22 percent over this period. Private school enrollment at the middle school and high school levels is projected to decline at about the same rate as overall enrollments in the later years of the projections.
Policy Questions and ImplicationsMany public policy questions and implications arise from an examination of the data in Knocking at the College Door, including short- and long-term considerations to be addressed all along the educational pathway, from the K-12 achievement and postsecondary attainment gaps between certain populations of students to related implications for the workforce.

Projections of High School Graduates6
AT THE COLLEGE DOORKNOCKING
December 2016 7
AT THE COLLEGE DOORKNOCKING CHAPTER 1. INTRODUCTION
CHAPTER 1. INTRODUCTION
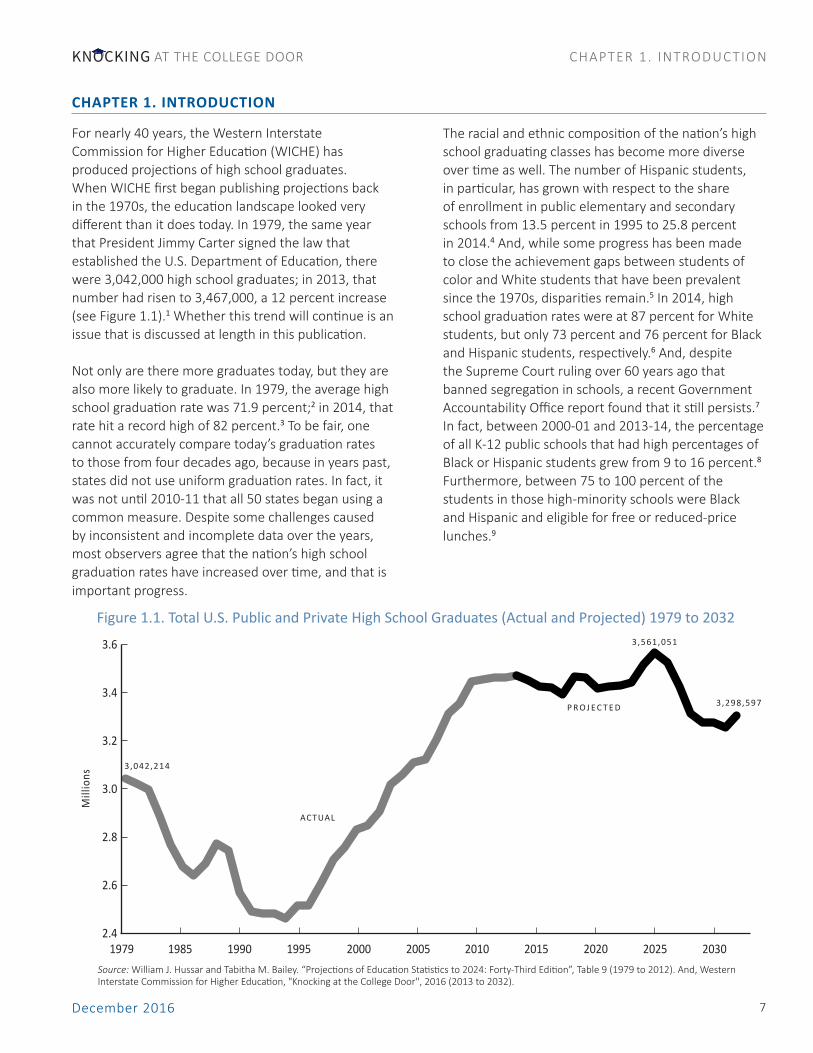
For nearly 40 years, the Western Interstate Commission for Higher Education (WICHE) has produced projections of high school graduates.When WICHE first began publishing projections back in the 1970s, the education landscape looked very different than it does today. In 1979, the same year that President Jimmy Carter signed the law that established the U.S. Department of Education, there were 3,042,000 high school graduates; in 2013, that number had risen to 3,467,000, a 12 percent increase (see Figure 1.1).1 Whether this trend will continue is an issue that is discussed at length in this publication.
Not only are there more graduates today, but they are also more likely to graduate. In 1979, the average high school graduation rate was 71.9 percent;2 in 2014, that rate hit a record high of 82 percent.3 To be fair, one cannot accurately compare today’s graduation rates to those from four decades ago, because in years past, states did not use uniform graduation rates. In fact, it was not until 2010-11 that all 50 states began using a common measure. Despite some challenges caused by inconsistent and incomplete data over the years, most observers agree that the nation’s high school graduation rates have increased over time, and that is important progress.
The racial and ethnic composition of the nation’s high school graduating classes has become more diverse over time as well. The number of Hispanic students, in particular, has grown with respect to the share of enrollment in public elementary and secondary schools from 13.5 percent in 1995 to 25.8 percent in 2014.4 And, while some progress has been made to close the achievement gaps between students of color and White students that have been prevalent since the 1970s, disparities remain.5 In 2014, high school graduation rates were at 87 percent for White students, but only 73 percent and 76 percent for Black and Hispanic students, respectively.6 And, despite the Supreme Court ruling over 60 years ago that banned segregation in schools, a recent Government Accountability Office report found that it still persists.7 In fact, between 2000-01 and 2013-14, the percentage of all K-12 public schools that had high percentages of Black or Hispanic students grew from 9 to 16 percent.8 Furthermore, between 75 to 100 percent of the students in those high-minority schools were Black and Hispanic and eligible for free or reduced-price lunches.9
2,400,000
2,600,000
2,800,000
3,000,000
3,200,000
3,400,000
3,600,000
1 4 7 10 13 16 19 22 25 28 31 34 37 40 43 46 49 521979
3.6
3.4
3.2
3.0
2.8
2.6
2.4
Mill
ions
Figure 1.1. Total U.S. Public and Private High School Graduates (Actual and Projected) 1979 to 2032
ACTUAL
P R O J E C T E D
1985
3,042,214
3,561,051
3,298,597
1990 1995 2000 2005 2010 2015 2020 2025 2030Source: William J. Hussar and Tabitha M. Bailey. “Projections of Education Statistics to 2024: Forty-Third Edition”, Table 9 (1979 to 2012). And, Western Interstate Commission for Higher Education, "Knocking at the College Door", 2016 (2013 to 2032).
Projections of High School Graduates8
AT THE COLLEGE DOORKNOCKING CHAPTER 1. INTRODUCTION
At the same time, research shows the importance of obtaining an education in order to keep up with the changing global economy. Data from the Georgetown Center on Education and the Workforce projects that, nationwide, 65 percent of all jobs will require postsecondary training beyond high school by 2020.10 So, although much has changed over the last 40 years, there is still more work to be done to create and maintain a more equitable education system that will serve an evolving population.
The purpose of Knocking at the College Door is to equip decision-makers at all levels with information about how the numbers of high school graduates are likely to change in the years ahead. These projections inform a broad audience; stakeholders including policymakers, elected officials and their staffs, state departments of education and higher education, postsecondary system heads, K-12 and school district leaders, administrators at public and private colleges and universities, researchers, policy organization staff, media, and others rely on them for a broad variety of uses. Now more than ever, these key stakeholders expect reliable data to be available to inform their decisions. Information, evaluation, and accountability are now part of education conversations, policy, and practice at all levels, and WICHE will continue to contribute to these important decisions by producing reliable projections of high school graduates through the Knocking at the College Door series of products for years to come.
For Knocking at the College Door to be as useful as possible and for the data to be used appropriately, it is important to understand the basic methodological approach to these projections (Appendix C provides detailed technical information and a description of the methodology). This 9th edition of Knocking at the College Door spans school years 2000-01 through 2031-32. As in previous editions, it examines data on
public and private schools and projects the number of high school graduates for the nation, four geographic regions, the 50 states, and the District of Columbia. For the first time, WICHE is also providing projections for Guam and Puerto Rico. And, finally Knocking also includes projections for public high school graduates that have been disaggregated by race/ethnicity.
WICHE relies on data from the National Center for Education Statistics’ (NCES) Common Core of Data (CCD) for public school data. The Private School Universe Survey (PSS), a biannual survey conducted in odd years by NCES that provides data for religious and nonsectarian private/nonpublic elementary and secondary schools in all 50 states and the District of Columbia, is WICHE’s source for private school data.
WICHE produces its projections using the cohort survival ratio (CSR) method, which observes the progression of individuals from birth to first grade, through the grades each year, and from the 12th grade to graduation. WICHE uses these ratios, which have been calculated from all available data, to project the number of enrollments and graduates in each of the subsequent years. WICHE uses a five-year smoothed average ratio when making its projections, which places relatively greater weight on the most recent year’s data without eliminating any trends that would be evident by taking a longer view. It is important to note that the results are not graduation rates, and while there is an implied rate of progression in this methodology, there is not a set cohort.
At the time of publication, the most recent available CCD data were for enrollments through school year 2013-14 and graduates through 2012-13. WICHE analyzed select state data to determine whether the lack of more recent data would significantly impact its projections. Based on available information, WICHE determined that this data lag would not meaningfully
Visit www.wiche.edu/knocking to access data, individual state profiles, presentations, and copies of
the report.

December 2016 9
AT THE COLLEGE DOORKNOCKING CHAPTER 1. INTRODUCTION
impact its projections (refer to Appendix C for a detailed summary of the process that WICHE used to make this determination).In addition to the basic methodology, there are several cautions that must be understood when interpreting and applying these projections. First, Knocking at the College Door exclusively projects the numbers of high school graduates and by extension, high school enrollments (as discussed in Chapter 4). While many stakeholders who rely on these projections use them to forecast future demand for postsecondary enrollment, the projections encompass only those students who are in the traditional educational pipeline. With the number of adult students enrolling in postsecondary education often fluctuating based on the performance of the U.S. economy, these projections provide an important but limited view of the general characteristics of the students who will be entering the nation’s colleges and universities over the next 15 years.
Second, WICHE considered whether it was possible to make projections in the seven expanded race/ethnicity categorizations, which are now the required convention in most federal data sources. After exploring options and consulting several experts, WICHE ultimately determined that it was impossible to make reliable projections in the expanded race/ethnicity categories primarily because the data on reported births and school enrollments using these new categories remain insufficient. Therefore, in this edition, WICHE provides projections by the historical racial/ethnic categories (see Appendix C for a detailed discussion). The reported actual counts of students in the additional race/ethnicity categories are published in Appendix A for informational purposes.
Finally, as with any set of projections, the longer into the future one looks, the more possibility there is for the projected numbers to deviate from future actual numbers. Furthermore, there may be less numerical precision for smaller states and smaller subgroups. That being said, WICHE’s projections of U.S. total public high school graduates from the 2003, 2008, and 2012 editions of Knocking have been determined to be, on average, within 2 to 3 percent of the actual graduate numbers subsequently reported for the first four years of projections. Appendix C describes in
detail WICHE’s efforts to analyze the historical accuracy of past projections.
The 9th edition of Knocking at the College Door will show that the context of K-12 education is continuing to evolve. The latest projections once again reflect the continual change that the nation has been experiencing over the last 40 years. This edition takes a deep dive into the national projections in Chapter 2, and Chapter 3 examines regional variation and changes at the state level. Once again, Knocking at the College Door highlights projections by race/ethnicity in the public schools. Chapter 4 focuses on current high school enrollments and projections. This edition also includes an exploration and discussion of policy implications, which is featured in Chapter 5.
Just as societal changes over the last 40 years have resulted in better student academic outcomes overall and even some improvement within specific racial/ethnic groups, the demographic changes that are projected for the future will reveal similar untapped potential and new visions. It is up to policymakers, practitioners, academics, and other stakeholders in K-12 and higher education to chart the path forward and decide how to take advantage of the opportunities before them.

Projections of High School Graduates10
AT THE COLLEGE DOORKNOCKING CHAPTER 1. INTRODUCTION
Endnotes1 William J. Hussar and Tabitha M. Bailey, “Projections of Education Statistics to 2024: Forty-Third Edition,” Washington, D.C.: National Center for Education Statistics, September 2016, accessed October 27, 2016, http://nces.ed.gov/pubs2015/2015073.pdf, Table 9, 49.2 National Center for Education Statistics, Digest of Education Statistics, Table 100-High School Graduates, By Sex and Control of School: Selected Years, 1869-70 through 2007-2008, accessed October 7, 2016, https://nces.ed.gov/programs/digest/d07/tables/dt07_100.asp.3 National Center for Education Statistics, “Public High School Graduation Rates,” May 2016, accessed October 27, 2016, http://nces.ed.gov/programs/coe/indicator_coi.asp.4 Hussar and Bailey, Table 6, 44. 5 National Center for Education Statistics, “The Nation’s Report Card: Trends in Academic Progress 2012,” June 2013, accessed October 27, 2016, http://nces.ed.gov/nationsreportcard/pubs/main2012/2013456.aspx. 6 National Center for Education Statistics, “Public High School Graduation Rates,” May 2016, accessed October 27, 2016, http://nces.ed.gov/programs/coe/indicator_coi.asp.7 United States Government Accountability Office, “K-12 Education: Better Use of Information Could Help Agencies Identify Disparities and Address Racial Concerns,” GAO-16-345, April 2016, accessed October 27, 2016, www.gao.gov/assets/680/676745.pdf. 8 Ibid.9 Ibid.10 Anthony Carnevale, Nicole Smith, and Jeff Strohl, “Recovery: Job Growth and Requirements through 2020,” Washington, D.C.: Georgetown Center on Education and the Workforce, June 2013, accessed October 27, 2016, https://cew.georgetown.edu/wp-content/uploads/2014/11/Recovery2020.FR_.Web_.pdf.
December 2016 11
AT THE COLLEGE DOORKNOCKING CHAPTER 2. NATIONAL PROJECTIONS
CHAPTER 2. NATIONAL PROJECTIONS
The 9th edition of Knocking at the College Doorprovides national projections of and describes overallchanges in the numbers of high school graduates inyears to come. This perspective gives a bird's eye viewof what the changing demographics will look like interms of both public and private high school graduatesand by race/ethnicity (in public schools only).
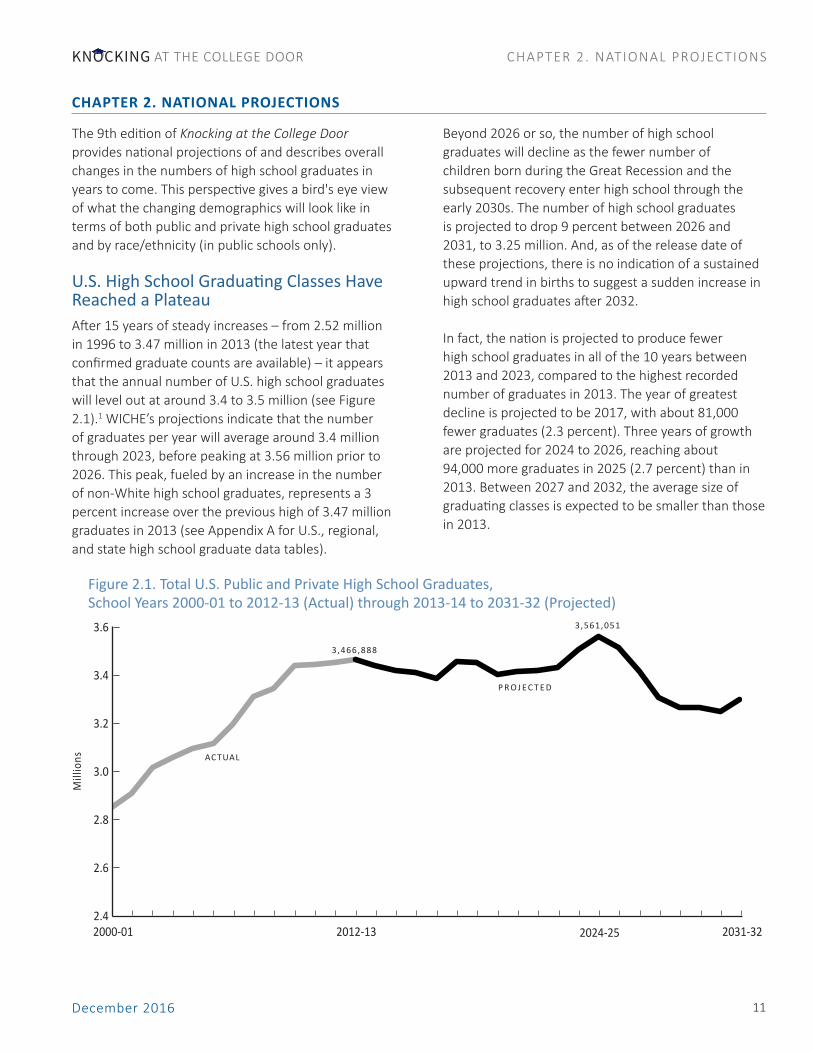
U.S. High School Graduating Classes Have Reached a PlateauAfter 15 years of steady increases – from 2.52 million in 1996 to 3.47 million in 2013 (the latest year that confirmed graduate counts are available) – it appears that the annual number of U.S. high school graduates will level out at around 3.4 to 3.5 million (see Figure 2.1).1 WICHE’s projections indicate that the number of graduates per year will average around 3.4 million through 2023, before peaking at 3.56 million prior to 2026. This peak, fueled by an increase in the number of non-White high school graduates, represents a 3 percent increase over the previous high of 3.47 million graduates in 2013 (see Appendix A for U.S., regional, and state high school graduate data tables).
Beyond 2026 or so, the number of high school graduates will decline as the fewer number of children born during the Great Recession and the subsequent recovery enter high school through the early 2030s. The number of high school graduates is projected to drop 9 percent between 2026 and 2031, to 3.25 million. And, as of the release date of these projections, there is no indication of a sustained upward trend in births to suggest a sudden increase in high school graduates after 2032.
In fact, the nation is projected to produce fewer high school graduates in all of the 10 years between 2013 and 2023, compared to the highest recorded number of graduates in 2013. The year of greatest decline is projected to be 2017, with about 81,000 fewer graduates (2.3 percent). Three years of growth are projected for 2024 to 2026, reaching about 94,000 more graduates in 2025 (2.7 percent) than in 2013. Between 2027 and 2032, the average size of graduating classes is expected to be smaller than those in 2013.
2.4
2.6
2.8
3.0
3.2
3.4
3.6
2000-01 2010-11 2020-21 2030-31
Mill
ions
2000-01 2012-13 2024-25 2031-32
3.6
3.4
3.2
3.0
2.8
2.6
2.4
Mill
ions
Figure 2.1. Total U.S. Public and Private High School Graduates, School Years 2000-01 to 2012-13 (Actual) through 2013-14 to 2031-32 (Projected)
ACTUAL
P R O J E C T E D
3,466,888
3,561,051

Projections of High School Graduates12
AT THE COLLEGE DOORKNOCKING CHAPTER 2. NATIONAL PROJECTIONS
Figure 2.2. U.S. High School Graduating Classes, Percent Change from 2013 (Public Total)
To provide a snapshot of the percentage change from 2013 in typical planning timeframes, the maps in Figure 2.2 show the graduating classes of 2020, 2025, and 2030 compared to 2013 (for public schools total only).
By comparing the public high school graduating classes in approximately five-, 10-, and 15-year ranges, several findings emerge:
ff By 2020 – less than five years from now – the number of public high school graduates nationally is projected to be about 3,000 fewer than in 2013 (a decline of 0.1 percent). In almost half of the states the number of graduates is projected to stay the same or even increase. The slight national decrease is due to the large projected decline (3 percent) in California, which has a large percentage of high school students in the overall population, as well as to deep declines in the number of high school students in states in the Midwest and Northeast. Meanwhile, the number of students in many states in the South and West will be stable or even increase significantly during this timeframe.
ff By 2025 – about 10 years from now – the overall number of public high school graduates is expected to increase moderately, culminating in a projected new high of 3.37 million graduates. This growth is reflected in the map for 2025, in which most of the states show growth except, once again, for California and some of the states in the Northeast and Midwest.
ff By 2030 – about 15 years from now – the annual number of public high school graduates is expected to decline by about 120,000 compared with 2013 (a 4 percent decrease). This is primarily a result of the decline in birth rates. California alone is projected to produce 12 percent fewer graduates (about 52,000) than it had roughly 15 years earlier. Virtually all the Midwest and Northeast states will continue to experience declines in the number of graduates, with a number of these states seeing graduating classes 15 to 25 percent smaller than just 15 years earlier. On the other hand, the sizes of graduating classes in Texas and several Midwestern states, and many of the Western states, are projected
2013-2020Nation: -0.1%
2013-2025Nation: 4.7%
2013-2030Nation: -4.0%
-10% or less -5% to -10% -5% to 5% 5% to 10% 10% or greaterffDecrease Increase

December 2016 13
AT THE COLLEGE DOORKNOCKING CHAPTER 2. NATIONAL PROJECTIONS
to continue increasing, thereby mitigating the overall trend toward a decline in the number of graduates. The number of graduates in many of the Southern states will be relatively stable during this timeframe, while other states in the region will experience declines.
Private Schools Continue Losing ShareWhen considering projections of the number of high school graduates, it is important to distinguish between public and private schools. Specifically, it is important to note that public high school graduates (as opposed to those who graduate from private schools) currently comprise 91 percent of the total number of high school graduates in the nation, and therefore, drive the projection trends.2
The number of high school graduates from private religious and nonsectarian schools is projected to decline at an even greater rate than the overall trend, from 302,000 in 2011 (the last year for which confirmed graduate counts are available for private schools) to about 220,000 by the early 2030s – a decrease of 80,000 graduates, or 26 percent (see Figure 2.3). Furthermore, graduates from private schools will represent a gradually smaller share of the total by the end of the projection period, from 10 percent of all graduates nationally in 2000 to 9
percent in 2010 to 7 percent by the early 2030s. The decline in private school student enrollments is driven by declines in students at religious schools of all affiliations, but underpinned by large declines in the number of Catholic school students, which represents the longstanding majority of private school students. The National Center for Education Statistics (NCES) reports that the number of students enrolled in nonsectarian schools decreased somewhat between 2005-06 and 2011-12, but has rebounded and remains about the same as it was in the early 2000s.3
Swift Change in the Racial/Ethnic Composition of Public High School GraduatesUnderstanding the full picture of WICHE’s high school graduate projections involves an exploration of trends by race/ethnicity. Due to data limitations, however, projections by race/ethnicity are limited to public high school graduates. As mentioned above, public high school graduates (as opposed to those who graduate from private schools) currently comprise 91 percent of the total number of high school graduates, and therefore provide a reasonably comprehensive representation of the racial/ethnic composition of future high school graduating classes. Overall, there will be consistent declines in the number of White public high school graduates and robust growth of
2000-01 2010-11 2024-25 2031-32
320
300
280
260
240
220
200
Thou
sand
s
Figure 2.3. U.S. Private High School Graduates, School Years 2000-01 to 2010-11 (Actual) through 2011-12 to 2031-32 (Projected)
ACTUAL
P R O J E C T E D
200
220
240
260
280
300
320
302,168
222,087

Projections of High School Graduates14
AT THE COLLEGE DOORKNOCKING CHAPTER 2. NATIONAL PROJECTIONS
public high school graduates of color (or, technically speaking, "non-White" graduates) in the coming years.4 Figure 2.4 illustrates these trends in the composition of graduating classes in U.S. high schools from 2001 to 2032 by race/ethnicity, including magnitude of change.
White High School Graduates in DeclineWhite students have long been the determinant force driving high school graduate trends. Barely a decade and a half ago, Whites represented 70 percent of all high school graduates (69 percent of public high school graduates, plus approximately 76 percent of private high school graduates).5 A long-predicted decline in the number of White public high school graduates began in 2007, and by 2030 the number of White public school graduates is projected to decrease by 14 percent compared to 2013 (see Figure 2.5). Even between 2024 and 2026, when the nation is projected to see some overall increase in the number of high school graduates, there will be about 110,000 fewer White public high school graduates than there were in 2013. The pace of the decline in the number of White public high school graduates is projected to further accelerate after 2025. By 2032, the number of White public high school graduates is projected to be 1.6 million, which is about 252,000 fewer than in 2013. As a result of these consistent declines and
the concomitant growth in the number of non-White students, by the early 2030s, White high school graduates are projected to comprise 53 percent of high school graduates (52 percent of public high school graduates and 71 percent of private high school graduates).6
Between the first (2013-14) and last (2031-32) projected years, the share of total high school graduates represented by White high school graduates is projected to drop six percentage points, and over the three decades between the first historical year (2000-01) and the last projected year (2031-32) included in this edition, that share is projected to drop 19 percent. With the share of White public high school graduates projected to hover around 52 percent in the last projected years, or 53 percent when including White private high school graduates, the racial/ethnic makeup of the nation's high school graduating classes is nearing the tipping point between majority and minority. Unforeseen increases in the number of non-White high school graduates could tip the balance within the span of these projections.
Growth Comes from Non-White Public GraduatesRobust growth in the number of non-White public school graduates – Hispanics and Asian/Pacific
2,849,243
3,466,875 3,550,549
2001 2006 2011 2016 2021 2026 20312000-01 2012-13 2031-32
Figure 2.4. Total U.S. Public and Private High School Graduates, by Race/Ethnicity, School Years 2000-01 to 2012-13 (Actual) through 2013-14 to 2031-32 (Projected)
2,850,006
2024-25
3,466,8883,561,051
American Indian/Alaska Native Asian/Pacific Islander Black Hispanic White Nonpublic
3,298,597

December 2016 15
AT THE COLLEGE DOORKNOCKING CHAPTER 2. NATIONAL PROJECTIONS
Islanders in particular – will act as a counterbalance to the declining numbers of White graduates, even though they are starting from a substantially smaller numerical base compared to Whites (1.33 million and 1.84 million, respectively, in 2013) and as a result will not mitigate the overall flattening of growth driven by the decreases in the number of Whites. In the years between 2018 and 2028, growth in the number of non-White public high school graduates is projected to replace the numerical decrease in White graduates to a varying extent. In the first five of those years, between 2018 and 2023, the projected increase in the number of non-White public high school graduates could replace the decline in the number of White high school graduates (public and private combined) almost one-to-one. In the years of rapid increase in the number of non-White public high school graduates from 2024 to 2028 – when non-White public high school graduates are projected to number between 1.5 and 1.6 million – for every 100 White high school graduates "lost," there will be an increase of 150 non-White high school graduates. However, in the last years of the projections (2029 to 2032), the number of non-White high school graduates will then fall back to below 1.5 million, which is about the same level as 2020 but still 12 percent higher than in 2013 – an effect of the overall decline in birth rates that began after 2007.
Greater Numbers of Graduates in the Short Term Than Previously Projected
Overall, current data reflecting the number of high school graduates are 2 to 5 percent higher for the 2009-12 school years than what the 8th edition of Knocking at the College Door projected in 2012.7 This is due in large part to much stronger growth and retention in the high school grades after 2010-11, and in some part to slightly greater graduation rates from 12th grade, than was previously indicated in the data. Much of this difference is accounted for by the states that contribute the greatest numbers of students to the national total and that have large Hispanic high school populations, California and Texas in particular – although the unpredictably strong number of graduates is not limited to Hispanic graduates. In fact, it was reasonable to expect that the conversion to counting students as Hispanic over other races, as required for all federal data, would have provided a boost to the number of Hispanic graduates, and it appears that it consistently has. However, the significant increase in the number of Hispanic graduates between 2010 and 2013, which represents a large part of the overall higher number of graduates who were not previously predicted at their actual levels, appear to be real increases.
While it was impossible to confirm the precise reasons for this strong growth, background research suggests it may have to some extent arisen from Deferred Action for Childhood Arrivals (DACA), a federal immigration policy implemented in 2012 that provides temporary relief from deportation and a two-year work permit to certain individuals who were brought to the U.S. illegally as children.8 DACA requires individuals to be currently enrolled in school, have graduated or obtained a certificate of completion from high school, have obtained a general education development (GED) certificate, or be an honorably discharged veteran of the Armed Forces or Coast Guard of the U.S. The implementation of DACA therefore may have increased high school graduation numbers among certain student populations. Other policy changes (e.g., related to students with disabilities or changes in high school exit exam requirements) and any other number of policy innovations may have resulted in higher graduate numbers, not to mention more accurate student tracking through state longitudinal data systems. It is worth noting that notwithstanding the slightly greater number of high school graduates, colleges across the country have been posting enrollment declines that are consistent with the overall slowing of high school graduate production that is underway.9
(300)
(200)
(100)
-
100
200
300
400
Th
ou
san
ds
2012-13 2024-25 2031-32
300
200
100
0
-100
-200
-300
Thou
sand
s
Figure 2.5. Projected Cumulative Change in U.S. High School Graduates after School Year 2012-13, by Race/Ethnicity (White)
1,838,951
-113,979
-252,054
Number of graduates in School Year 2012-13

Projections of High School Graduates16
AT THE COLLEGE DOORKNOCKING CHAPTER 2. NATIONAL PROJECTIONS
Hispanic public high school graduates. Numerically speaking, Hispanic high school graduates are the primary growth engine. The number of Hispanic high school graduates is projected to increase by 50 percent or more from the first projected year, 2014, to the high point of 920,000 graduates around 2025 (see Figure 2.6). This is an increase of almost 280,000 in the 12 years between 2013 and 2025. The number of Hispanic public high school graduates is then projected to decline from about 900,000 in 2025-26 to 780,000 to 790,000 in the early 2030s, a 14 percent contraction over these five to seven years. This decline is, once again, related to the decline in birth rates described in this report, which was sharpest among Hispanics. The number of Hispanic public high school graduates is not projected to reach 1 million in any of the projected years, but it is not inconceivable that they could reach this milestone in the 15-year span if higher numbers of Hispanic youth make it successfully through the pipeline to high school graduation.
Asian/Pacific Islander public high school graduates. There is also a steady increase projected for the number of Asian/Pacific Islander public high school graduates. About 58,000 more Asian/Pacific Islander public high school graduates are expected by the early 2030s compared with 2013, representing an increase of up to 30 percent (see Figure 2.7). This represents a relatively smaller increase than the magnitude of growth projected for Hispanic public high school graduates; by the end of the projections, however, Asian/Pacific Islander public high school graduates are the only student population projected to continue to gain, while all other populations are expected to begin declining after the high point around 2025. The number of Asian/Pacific Islander graduates is projected to increase from 185,000 in 2014 to 240,000 in 2032, representing a gain in share of about 2 percent of the total.
Native Hawai‘ian/Pacific Islander public high school graduates. Although it was not possible to produce reliable projections for Native Hawai‘ian/Pacific Islander public high school graduates, the data indicate that between 2010-11 and 2013-14, Hawai‘ian/Pacific Islanders represented about 7 percent of the total combined number of Asian/Pacific Islander students, or about 10,000 public high school graduates
on average in these years.10 Of course, Hawai‘ian/Pacific Islanders are a substantial part of some states' populations, with education outcomes that are distinct from the overall Asian/Pacific Islander population. Forty percent of Hawai‘i's Asian/Pacific Islander public high school graduates are Native Hawai‘ian/Pacific Islanders (3,300 graduates on average from 2010-11 to 2012-13). Other states in which Hawai‘ian/Pacific Islanders comprised a notable portion of Asian/Pacific Islander public high school graduates from 2010-11 to 2012-13 include California (4 to 5 percent),
(300)
(200)
(100)
-
100
200
300
400
Th
ou
san
ds
2012-13 2024-25 2031-32
300
200
100
0
-100
-200
-300
Thou
sand
s
Figure 2.6. Projected Cumulative Change in U.S. High School Graduates after School Year 2012-13, by Race/Ethnicity (Hispanic)
640,413
+277,363
+150,744
Number of graduates in School Year 2012-13
(300)
(200)
(100)
-
100
200
300
400
Th
ou
san
ds
2012-13 2024-25 2031-32
300
200
100
0
-100
-200
-300
Thou
sand
sFigure 2.7. Projected Cumulative Change in U.S. High School Graduates after School Year 2012-13, by Race/Ethnicity (Asian/Pacific Islander)
183,686
+25,807+57,528
Number of graduates in School Year 2012-13

December 2016 17
AT THE COLLEGE DOORKNOCKING CHAPTER 2. NATIONAL PROJECTIONS
Washington (7 to 8 percent), and Oregon (10 to 12 percent).
Black public high school graduates. The number of Black public high school graduates recently reached a high of about 480,000 in 2010 through 2012. But between now and the early 2030s, the number of Black, non-Hispanic public high school graduates is projected to gradually decline by about 6 percent (see Figure 2.8). This number will vary between 467,000 and 440,000 over the next 15 years. Black graduates are projected to remain about 15 percent of the total number of public high school graduates through 2016, then decline to about 14 percent of the total and remain at that level throughout the remaining years projected.
American Indian/Alaska Native public high school graduates. American Indian/Alaska Native public high school graduates represent only about 1 percent of the total number of public high school graduates currently, or about 32,000 graduates annually in recent years. This population is projected to decline in number in every year of the projections to about 25,000 by 2025 and 23,000 by the early 2030s, at which point it will make up only about 0.7 percent of all public high school graduates (see Figure 2.9).
Two or More Races public high school graduates. It was not possible to produce reliable projections from the available data for public high school graduates of Two or More Races. The data, however, indicate that students of Two or More Races represented 1 to 3 percent of all non-Hispanic public high school students in the years between 2010-11 and 2013-14.
(300)
(200)
(100)
-
100
200
300
400
Th
ou
san
ds
2012-13 2024-25 2031-32
300
200
100
0
-100
-200
-300
Thou
sand
s
Figure 2.8. Projected Cumulative Change in U.S. High School Graduates after School Year 2012-13, by Race/Ethnicity (Black)
474,247
-2,924-33,872
Number of graduates in School Year 2012-13
(300)
(200)
(100)
-
100
200
300
400 T
ho
usa
nd
s
2012-13 2024-25 2031-32
300
200
100
0
-100
-200
-300
Thou
sand
s
Figure 2.9. Projected Cumulative Change in U.S. High School Graduates after School Year 2012-13, by Race/Ethnicity (American Indian/Alaska Native)
31,947
-6,548
-9,087
Number of graduates in School Year 2012-13
Impact of New Race/Ethnicity Categories in Federal Data
It bears asking whether the declines in Black and American Indian/Alaska Native public high school graduates are a result of stagnation or decline in graduation rates. In fact, these populations have seen growth in graduation rates, which suggests that there would be more, not fewer, graduates.11 The declines in the numbers of Black and American Indian/Alaska Native public high school graduates are more likely the result of the transition to new race/ethnicity categories in federal data. While the race/ethnicity reporting changes affect the relative distribution of individuals between all the categories, Black and American Indian/Alaska Native public school student counts may be particularly susceptible to the effects of the changes, both for racial/ethnicity identity reasons and because of the greater fluctuations that may occur with smaller groups, particularly American Indian/Alaska Natives (among other reasons).12 Population estimates, for example, indicate that perhaps 10 percent or more of Black individuals may be counted under a different category now compared to previous reporting methods. For more information, please see Appendix C: Technical Information and Methodology.
Projections of High School Graduates18
AT THE COLLEGE DOORKNOCKING CHAPTER 2. NATIONAL PROJECTIONS
Endnotes1 Unless otherwise noted, years for graduates refer to the end of the K-12 school year, e.g., May 1997 of the 1996-97 school year. The latest available data refer to the latest available published data from the National Center for Education Statistics (NCES) Common Core of Data.2 The first projected year is different between public and private school graduates due to differences in data availability. Public school graduates represent 91 percent or more of total graduates, and therefore when this publication refers to the total number of public and private school graduates or to public school graduates alone, it is referring to the first year of projected graduates as the 2013-14 school year, or the Class of 2014. When this publication focuses on private school graduates alone, the first year of projected graduates is for the 2011-12 school year, or the Class of 2012.3 National Center for Education Statistics, Condition of Education, "Private School Enrollment," May 2016, accessed October 2, 2016, http://nces.ed.gov/programs/coe/indicator_cgc.asp.4 Federally reported data, including the education and births data included in the Knocking projections, is classified under a common scheme such that Hispanics include any individuals with Hispanic origins, regardless of their race. And all race categories are non-Hispanic by definition. Therefore, this publication uses the terms White, Black, Asian/Pacific Islander, American Indian/Alaska Native, and Two or More Races throughout, without the additional “non-Hispanic” term. When comparing to prior years’ data or across data sources, the exact classification can vary by year and source. For more information, please see Appendix C: Technical Information and Methodology.5 National Center for Education Statistics, Private School Survey Universe Data Tables, “Percentage Distribution of Students, By Racial/Ethnic Background, and Percentage Minority Students in Private Schools, By Selected Characteristics: United States,” accessed September 26, 2016, https://nces.ed.gov/surveys/pss/tableswhi.asp.6 Ibid; NCES Private School Survey Data Tables.7 Brian T. Prescott and Peace Bransberger, Knocking at the College Door: Projections of High School Graduates, Boulder, CO: Western Interstate Commission for Higher Education, 2012, accessed October 12, 2016, www.wiche.edu/knocking-8th.8 U.S. Department of Homeland Security, “Deferred Action for Childhood Arrivals,” accessed October 11, 2016, https://www.dhs.gov/deferred-action-childhood-arrivals.9 For a more complete analysis of WICHE’s historical accuracy with respect to the projections of high school graduates over time, please see Appendix C: Technical Information and Methodology. 10 Seven percent of all enrollments at each level, Grades 1 to 5, Grades 6 to 8 and Grades 9 to 12, and of graduates. 11 Based on adjusted cohort graduation rate data for 2010-11 to 2013-14, compiled from National Center for Education Statistics, Digest of Education Statistics and Condition of Education, available from http://nces.ed.gov/.12 D'Vera Cohn, "Millions of Americans Changed Their Racial or Ethnic Identity from One Census to the Next," Pew Research Center, May 5, 2014, accessed October 1, 2016, http://www.pewresearch.org/fact-tank/2014/05/05/millions-of-americans-changed-their-racial-or-ethnic-identity-from-one-census-to-the-next/.
In the first year that all states reported public high school graduates in this category (2010-11), there were almost 52,000 graduates reported. The number increased to 59,000 graduates in 2011-12, and to 66,000 graduates in 2012-13. The number of reported graduates of Two or More Races increased 27 percent over these three years. It may take several years for these numbers to stabilize enough to allow projections to be computed. Interested readers can find more detail about this topic in the Appendix C: Technical Information and Methodology.
National Projections SummaryAfter steady increases in the overall number of high school graduates over the last 15 years, the U.S. is headed into a period of stagnation. WICHE’s projections indicate that the number of graduates per year will average around 3.44 million through 2023, before peaking at 3.56 million prior to 2026. This trend is largely fueled by a decline in the White population and counterbalanced by growth in the number of non-White public school graduates – Hispanics and Asian/Pacific Islanders in particular. At the same time, the number of high school graduates from private religious and nonsectarian schools is projected to decline at an even greater rate than the overall trend, and graduates from private schools will represent a gradually smaller share of the total by the end of the projection period.
http://www.pewresearch.org/fact-tank/2014/05/05/millions-of-americans-changed-their-racial-or-ethnic

December 2016 19
AT THE COLLEGE DOORKNOCKING CHAPTER 3. REGIONAL AND STATE VARIATION
CHAPTER 3. REGIONAL AND STATE VARIATION
The national projections of the total number of public and private high school graduates for the school years covered in this edition (2000-01 through 2031-32) mask significant variations among the nation’s four geographic regions (shown in Figure 3.1, as defined for this publication).1 As illustrated in Figure 3.2, two overriding patterns have been identified among the four regions throughout the years projected: growth in the number of high school graduates in the South and West, and continuing declines in the number of high school graduates in the Midwest and Northeast.2
Growth in the South and WestThe South is the engine of growth for high school graduates. It is the only region that is projected to experience an increase in the number of high school graduates for every year of the projections, even though that number is expected to contract after 2025. In the early 2000s, about one-third (33 percent) of the nation’s high school graduates were located in the Southern states, and the region’s share of the national total grew to 43 percent, or 1.23 million high school graduates, by the last confirmed year, 2013.
During the few years of high growth that are expected to end around 2025, it is projected that states in the South will generate almost 47 percent of the nation’s high school graduates, or 1.35 million graduates. By that point, it is projected that the number of graduates in the South will be about 10 percent more than the 2013 figure. After this high point, the South is projected to produce about 45 percent of the nation’s high school graduates through the end of the
Figure 3.1. Regional Divisions of the U.S.
Midwest
West Northeast
South
0.4
0.6
0.8
1.0
1.2
1.4
2000-01 2010-11 2020-21 2030-31
Milli
ons
2000-01 2012-13 2024-25 2031-32
1.4
1.2
1.0
0.8
0.6
0.4
Mill
ions
ACTUAL
P R O J E C T E D
South West Midwest Northeast
1,352,638
862,031
776,820
647,036
Figure 3.2. Total Public and Private High School Graduates, by Region, 2000-01 through 2031-32

Projections of High School Graduates20
AT THE COLLEGE DOORKNOCKING CHAPTER 3. REGIONAL AND STATE VARIATION
projection period – an average of 1.25 million high school graduates per year.
Figure 3.3 shows each region’s contribution to the projected change in the number of graduates at several points in time, relative to the last year of reported high school graduate counts (2012-13).The West generated 25 percent of the nation’s high school graduates in the early 2000s. By 2009-10, high school graduates from the West represented about 29 percent of the total (813,400 graduates); that number is projected to be about 30 percent of the total throughout the projection period. The West is projected to reach its new high point in 2023-24 with about 860,000 high school graduates. It will remain the second-highest-producing region behind the South during the course of these projections, although it is expected to drop back slightly to 28 percent of the total (on average, about 785,000 graduates) by the
early 2030s.
Four of the 10 states that produce the greatest number of high school graduates are located in the South and West (see Table 3.1). In 2012-13, these four high-producing Southern and Western states generated about 1.05 million high school graduates (30 percent of the U.S. total); California alone produced 455,900 (13 percent of the total), Texas added another 9 percent (314,400 graduates), Florida another 5 percent (176,300 graduates) and Ohio another 4 percent (135,000 graduates). By 2025-26, Texas is projected to gain 2 percentage points in the share of the U.S. total, while California will drop a percentage point.
In 2025-26, Georgia (110,000 graduates) and Virginia (93,000) will round out the top five Southern states that generate the largest number of high school graduates in that region, while Washington (77,000 graduates), Arizona (72,000), Colorado (62,000) and Oregon (38,000) will join California as the top five states in the West.
Figure 3.4 on the following pages show these trends in more detail. Each state’s year-over-year change is shown, grouped by region and sorted by the state’s relative number of high school graduates. Years with fewer graduates than the previous year are shown as
2019-20 2024-25 2029-30
250,000
200,000
150,000
100,000
50,000
0
-50,000
-100,000
-150,000
-200,000
-250,000
Figure 3.3. Change in High School Graduates from School Year 2012-13, by Region
South West Midwest Northeast
2019-20 2024-25 2029-30
South 32,200 117,900 7,100
West -11,500 24,900 -45,900
Midwest -41,200 -29,700 -92,700
Northeast -42,000 -26,200 -72,300
Table 3.1. Top 10 States that Produce a Majority of U.S. High School Graduates 2012-13 2025-26 CA 455,900 13% CA 431,000 12% TX 314,400 9% TX 374,700 11% NY 211,600 6% NY 214,500 6% FL 176,300 5% FL 193,000 5% IL 153,300 4% IL 142,600 4% PA 145,800 4% PA 139,700 4% OH 135,000 4% OH 118,700 3% MI 111,200 3% MI 97,500 3% NJ 109,000 3% NJ 102,900 3% NC 100,700 3% NC 110,100 3% TOTAL 55% TOTAL 54%

December 2016 21
AT THE COLLEGE DOORKNOCKING CHAPTER 3. REGIONAL AND STATE VARIATION
are neutral-colored, and years with more graduates are shown as orange.
As shown in the figure, between 2000-01 and 2012-13, the number of graduates increased in the earlier years, and more often in the Southern and Western states, than in the Midwestern and Northeastern regions. Between 2013-14 and 2020-21, the overall number of high school graduates is expected to plateau and even decrease slightly while declining more steeply in the Midwest and Northeast. Generally speaking, most states are projected to experience increases between 2021 and 2025, and higher rates of increases are projected for the South and West than the Midwest and Northeast. Most, if not all, states are then projected to experience year-over-year decreases for five to six years between 2025 and 2030. Then about half the states, mostly in the South and West, are projected to see slight increases in the last two years or so of the projections.
Decline in the Northeast and MidwestThe number of high school graduates in the Midwest and Northeast regions is, generally speaking, in decline. In 2012-13, the Midwest generated 22 percent of the nation’s high school graduates (about 762,000). That share is projected to decrease to 19 percent by 2029-30, meaning 93,000 fewer high school graduates by that time (a decline of 12 percentage points compared to 2012-13). The trend is broadly the same for the Northeast, which produced around 639,000 graduates in 2012-13, or 18 percent of the national total. By 2029-30, the number of high school graduates in the Northeast is projected to decrease to around 567,000 graduates. This number will represent 72,000 fewer graduates by 2029-30 (a decline of 11 percentage points compared to 2012-13), and will lead to the Northeast contributing only 16 percent of the nation’s high school graduates by that point.
Whereas the number of high school graduates in the South and West will show moderate increases in the next 10 years before heading into the slump caused by the recent decline in birth rates, the decline in the number of high school graduates in the Midwest and Northeast is projected to play out consistently year-over-year without pause. In the Midwest, several years
of slight increases are projected between 2021-22 and 2026-27, but this increase will not be enough for the region to reach its previous high number of high school graduates.
Six of the 10 states that together produce around 55 percent of the nation’s high school graduates are located in the Midwest and Northeast regions (see Table 3.1). In 2012-13, these six Midwestern and Northeastern states produced about 866,000 high school graduates, or 25 percent of the total number of high school graduates in the U.S. By 2025-26, this number is projected to decline to about 816,000 graduates, or 23 percent of the national total.
Indiana (111,200 graduates) and Missouri (72,700 graduates) round out the five Midwestern states that produced the greatest number of high school graduates in the region in 2012-13. The number of high school graduates in Indiana is projected to decrease throughout the projection period, while the number of graduates in Missouri will increase a little between 2020 and 2025 before ending the projection period down about 3 percent from 2012-13. Massachusetts and Connecticut round out the five Northeast states that produce the greatest number of high school graduates in that region; both states are projected to experience declines in the number of high school graduates throughout the course of the projection period.
Declines are the Result of Decreasing Numbers of White GraduatesThe overriding source of the decline in the number of high school graduates in the Midwest and Northeast regions, and nationally in states that have a high proportion of White youth, is the ongoing decline in the White youth population. This trend is illustrated in Figures 3.5 through 3.8, which show the regional distributions and changes in public high school graduate populations by race/ethnicity over the projected years.3 Currently, the Midwest generates about 30 percent of the nation’s White public high school students; this portion is projected to decrease by 15 percent from 527,600 in 2012-13 to 490,000 by 2024-25, and to 445,800 by the end of the projection period (Figure 3.5). The Northeast generates about
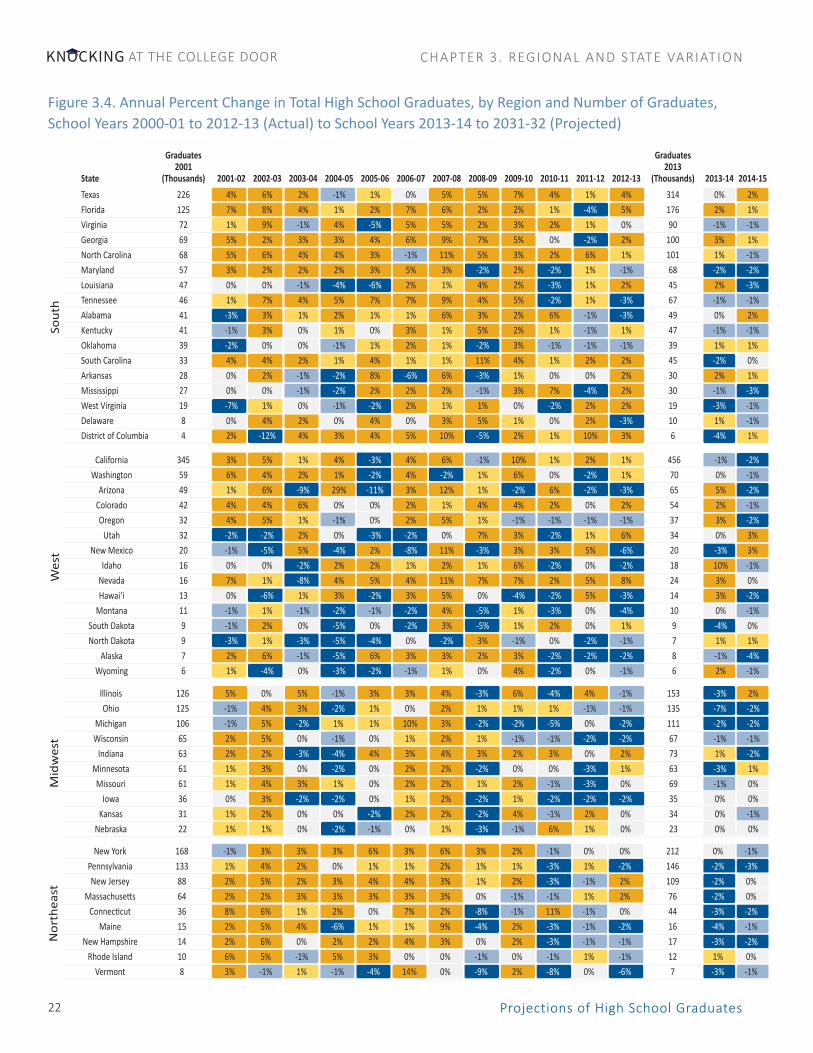
Projections of High School Graduates22
AT THE COLLEGE DOORKNOCKING CHAPTER 3. REGIONAL AND STATE VARIATION
Figure 3.4. Annual Percent Change in Total High School Graduates, by Region and Number of Graduates,School Years 2000-01 to 2012-13 (Actual) to School Years 2013-14 to 2031-32 (Projected)
Sout
hW
est
Mid
wes
tN
orth
east
Graduates Graduates 2001 2013 State (Thousands) 2001-02 2002-03 2003-04 2004-05 2005-06 2006-07 2007-08 2008-09 2009-10 2010-11 2011-12 2012-13 (Thousands) 2013-14 2014-15 Texas 226 4% 6% 2% -1% 1% 0% 5% 5% 7% 4% 1% 4% 314 0% 2% Florida 125 7% 8% 4% 1% 2% 7% 6% 2% 2% 1% -4% 5% 176 2% 1% Virginia 72 1% 9% -1% 4% -5% 5% 5% 2% 3% 2% 1% 0% 90 -1% -1% Georgia 69 5% 2% 3% 3% 4% 6% 9% 7% 5% 0% -2% 2% 100 3% 1% North Carolina 68 5% 6% 4% 4% 3% -1% 11% 5% 3% 2% 6% 1% 101 1% -1% Maryland 57 3% 2% 2% 2% 3% 5% 3% -2% 2% -2% 1% -1% 68 -2% -2% Louisiana 47 0% 0% -1% -4% -6% 2% 1% 4% 2% -3% 1% 2% 45 2% -3% Tennessee 46 1% 7% 4% 5% 7% 7% 9% 4% 5% -2% 1% -3% 67 -1% -1% Alabama 41 -3% 3% 1% 2% 1% 1% 6% 3% 2% 6% -1% -3% 49 0% 2% Kentucky 41 -1% 3% 0% 1% 0% 3% 1% 5% 2% 1% -1% 1% 47 -1% -1% Oklahoma 39 -2% 0% 0% -1% 1% 2% 1% -2% 3% -1% -1% -1% 39 1% 1% South Carolina 33 4% 4% 2% 1% 4% 1% 1% 11% 4% 1% 2% 2% 45 -2% 0% Arkansas 28 0% 2% -1% -2% 8% -6% 6% -3% 1% 0% 0% 2% 30 2% 1% Mississippi 27 0% 0% -1% -2% 2% 2% 2% -1% 3% 7% -4% 2% 30 -1% -3% West Virginia 19 -7% 1% 0% -1% -2% 2% 1% 1% 0% -2% 2% 2% 19 -3% -1% Delaware 8 0% 4% 2% 0% 4% 0% 3% 5% 1% 0% 2% -3% 10 1% -1% District of Columbia 4 2% -12% 4% 3% 4% 5% 10% -5% 2% 1% 10% 3% 6 -4% 1%
California 345 3% 5% 1% 4% -3% 4% 6% -1% 10% 1% 2% 1% 456 -1% -2% Washington 59 6% 4% 2% 1% -2% 4% -2% 1% 6% 0% -2% 1% 70 0% -1% Arizona 49 1% 6% -9% 29% -11% 3% 12% 1% -2% 6% -2% -3% 65 5% -2% Colorado 42 4% 4% 6% 0% 0% 2% 1% 4% 4% 2% 0% 2% 54 2% -1% Oregon 32 4% 5% 1% -1% 0% 2% 5% 1% -1% -1% -1% -1% 37 3% -2% Utah 32 -2% -2% 2% 0% -3% -2% 0% 7% 3% -2% 1% 6% 34 0% 3% New Mexico 20 -1% -5% 5% -4% 2% -8% 11% -3% 3% 3% 5% -6% 20 -3% 3% Idaho 16 0% 0% -2% 2% 2% 1% 2% 1% 6% -2% 0% -2% 18 10% -1% Nevada 16 7% 1% -8% 4% 5% 4% 11% 7% 7% 2% 5% 8% 24 3% 0% Hawai‘i 13 0% -6% 1% 3% -2% 3% 5% 0% -4% -2% 5% -3% 14 3% -2% Montana 11 -1% 1% -1% -2% -1% -2% 4% -5% 1% -3% 0% -4% 10 0% -1% South Dakota 9 -1% 2% 0% -5% 0% -2% 3% -5% 1% 2% 0% 1% 9 -4% 0% North Dakota 9 -3% 1% -3% -5% -4% 0% -2% 3% -1% 0% -2% -1% 7 1% 1% Alaska 7 2% 6% -1% -5% 6% 3% 3% 2% 3% -2% -2% -2% 8 -1% -4% Wyoming 6 1% -4% 0% -3% -2% -1% 1% 0% 4% -2% 0% -1% 6 2% -1%
Illinois 126 5% 0% 5% -1% 3% 3% 4% -3% 6% -4% 4% -1% 153 -3% 2% Ohio 125 -1% 4% 3% -2% 1% 0% 2% 1% 1% 1% -1% -1% 135 -7% -2% Michigan 106 -1% 5% -2% 1% 1% 10% 3% -2% -2% -5% 0% -2% 111 -2% -2% Wisconsin 65 2% 5% 0% -1% 0% 1% 2% 1% -1% -1% -2% -2% 67 -1% -1% Indiana 63 2% 2% -3% -4% 4% 3% 4% 3% 2% 3% 0% 2% 73 1% -2% Minnesota 61 1% 3% 0% -2% 0% 2% 2% -2% 0% 0% -3% 1% 63 -3% 1% Missouri 61 1% 4% 3% 1% 0% 2% 2% 1% 2% -1% -3% 0% 69 -1% 0% Iowa 36 0% 3% -2% -2% 0% 1% 2% -2% 1% -2% -2% -2% 35 0% 0% Kansas 31 1% 2% 0% 0% -2% 2% 2% -2% 4% -1% 2% 0% 34 0% -1% Nebraska 22 1% 1% 0% -2% -1% 0% 1% -3% -1% 6% 1% 0% 23 0% 0%
New York 168 -1% 3% 3% 3% 6% 3% 6% 3% 2% -1% 0% 0% 212 0% -1% Pennsylvania 133 1% 4% 2% 0% 1% 1% 2% 1% 1% -3% 1% -2% 146 -2% -3% New Jersey 88 2% 5% 2% 3% 4% 4% 3% 1% 2% -3% -1% 2% 109 -2% 0% Massachusetts 64 2% 2% 3% 3% 3% 3% 3% 0% -1% -1% 1% 2% 76 -2% 0% Connecticut 36 8% 6% 1% 2% 0% 7% 2% -8% -1% 11% -1% 0% 44 -3% -2% Maine 15 2% 5% 4% -6% 1% 1% 9% -4% 2% -3% -1% -2% 16 -4% -1% New Hampshire 14 2% 6% 0% 2% 2% 4% 3% 0% 2% -3% -1% -1% 17 -3% -2% Rhode Island 10 6% 5% -1% 5% 3% 0% 0% -1% 0% -1% 1% -1% 12 1% 0% Vermont 8 3% -1% 1% -1% -4% 14% 0% -9% 2% -8% 0% -6% 7 -3% -1%

December 2016 23
AT THE COLLEGE DOORKNOCKING CHAPTER 3. REGIONAL AND STATE VARIATION
-1% -2% 2% -1% -1% 2% 0% 1% 3% -4% 0% -4% -3% -2% 0% -1% 1% 394 California 0% -2% 2% 0% -2% 1% 1% 1% 2% 4% 2% -1% -4% 0% 1% -1% 2% 75 Washington 1% 1% 1% 1% -1% 1% 0% 1% 1% 2% -1% -8% -6% -3% 1% -1% 1% 62 Arizona 2% 0% 4% 2% 1% 2% 0% 1% 2% 2% -2% -2% -4% -2% 0% 0% 1% 58 Colorado 1% -1% 0% 0% -2% 0% 0% 0% 3% 3% 0% -4% -4% -1% 0% 0% 1% 35 Oregon 4% 4% 2% 1% 1% 3% 2% 0% 4% 3% 3% -4% -4% -3% 1% -1% 0% 41 Utah -2% 2% 0% 2% -1% -2% 1% 0% 1% 3% 0% -4% -4% -2% -1% -2% -1% 18 New Mexico 3% 1% 0% 3% -1% 2% 4% 3% 2% 5% 2% -7% -3% -5% 4% -3% 3% 22 Idaho -2% -1% 3% 2% -1% -1% 0% 2% 4% 5% -2% -6% -5% -2% -1% 1% 2% 24 Nevada -3% 0% 5% -2% 3% 2% 2% 2% 3% 4% 0% -4% 1% 0% 0% 0% -3% 15 Hawai‘i 1% -2% -1% 3% 1% 0% 2% 0% 5% 0% 2% -3% -2% 0% 0% 2% 1% 11 Montana -2% 0% 3% -2% 2% 2% 2% 5% 2% 3% -2% -1% -1% 0% 2% 1% 0% 10 South Dakota 0% 1% -2% 5% 2% 4% 7% 2% 11% 4% -3% 1% 2% 7% 9% 7% 9% 12 North Dakota -1% 2% 0% 0% -3% 0% 1% 1% 2% 2% 4% -1% 1% 0% -2% 2% -1% 8 Alaska 1% 1% 1% 1% -1% 5% 0% 5% 4% 3% 5% -3% -6% -3% 2% 1% 1% 7 Wyoming
-4% -1% 1% -1% -2% -1% 1% -2% 0% 1% -2% -3% -3% -2% -1% -1% 1% 125 Illinois 2% -2% 1% -1% -2% -1% -1% -1% 1% 1% -1% -2% -3% -1% 0% 0% 0% 110 Ohio -2% -2% 1% -1% -3% -1% 1% -3% 1% 0% -4% -3% -2% 0% -1% 0% 1% 88 Michigan 0% 0% 2% -1% -2% 1% 1% -1% 1% 2% -1% -2% -3% -1% -1% -1% 1% 62 Wisconsin 0% 0% 2% 2% -4% -2% 2% -1% 1% 1% -1% -2% -3% 0% -1% 0% 1% 68 Indiana -1% 1% 1% 1% -1% 2% 2% 0% 2% 2% -2% -3% -3% 0% 1% 1% 1% 63 Minnesota 1% -2% 2% 0% 0% 0% 1% 1% 1% 2% -1% -3% -3% -1% -1% 0% 0% 66 Missouri 0% 0% 2% -1% 0% 1% 0% 2% 3% 2% -2% -2% -3% -1% 1% 1% 2% 36 Iowa 2% -1% 4% 0% -1% 2% 0% 1% 2% 3% 0% -1% -2% -3% 2% -4% 1% 35 Kansas -1% -1% 5% 2% 1% 1% 2% 0% 2% -6% 4% 0% -4% -1% 0% 1% 3% 25 Nebraska
-3% -1% 3% -1% -1% 1% 0% 0% 2% 2% -3% -1% -1% -1% 0% -2% 1% 200 New York -1% 0% 1% -1% -2% 1% 1% -1% 2% 2% -1% -2% -2% 0% 0% -1% 1% 132 Pennsylvania -1% -2% 0% 0% -2% 0% 0% -1% 2% 1% -3% -2% -3% -1% -1% -1% 1% 91 New Jersey 1% -2% 1% -1% -1% 0% -1% -2% 1% 1% -2% -2% -3% 0% -1% -1% 0% 67 Massachusetts -1% 0% -2% -2% -2% 1% -2% -1% -1% 1% -2% -3% -3% -1% -1% -1% 0% 33 Connecticut -1% -3% -1% 0% -3% -1% 0% -1% 0% 1% -3% -1% -3% -2% 0% 0% 0% 12 Maine -1% -3% 0% -1% -1% -2% 0% -2% 0% -1% -3% -2% -3% 0% -3% 0% -1% 12 New Hampshire -4% -10% 3% 5% 0% -1% 2% -3% 0% 2% -4% -4% -2% -1% 0% -1% 0% 9 Rhode Island -1% 1% -5% -1% -1% -1% 0% 0% -2% 2% -3% -3% 2% -2% -1% 1% 1% 6 Vermont
Decrease 2% or more Decrease up to 2% Same Increase up to 2% Increase 2% or more
Note: States are sorted in order within region by the number of graduates. Graduates 2032 2015-16 2016-17 2017-18 2018-19 2019-20 2020-21 2021-22 2022-23 2023-24 2024-25 2025-26 2026-27 2027-28 2028-29 2029-30 2030-31 2031-32 (Thousands) States 3% 0% 4% 2% -1% 2% 1% 2% 2% 3% 0% -1% -5% -3% 2% 1% 4% 368 Texas -2% 0% 2% 0% -3% 0% 1% 2% 3% 3% -3% -5% -3% -1% 0% 1% 2% 177 Florida 1% -1% 3% 0% 0% 0% 2% 0% 3% 3% -2% -2% -2% 0% 0% -1% 1% 90 Virginia 1% 0% 3% 1% -2% -2% 1% 1% 3% 3% -2% -4% -6% -1% -1% -1% 2% 97 Georgia 1% -1% 5% 2% -2% 0% -7% 6% 3% 3% 1% -4% -4% -2% 0% -1% 2% 102 North Carolina -1% -3% 2% -1% 2% 1% 1% 0% 4% 3% -3% -3% -2% -1% 0% -1% 3% 65 Maryland 2% -1% 4% -3% 0% -2% -2% 1% 3% 4% -2% 0% -3% -1% 1% 1% 2% 45 Louisiana 0% 1% 1% -1% -2% -1% 0% 0% 3% 1% 0% -4% -4% 0% 1% 0% 2% 65 Tennessee -2% -1% 2% -2% -3% -2% -1% 0% 2% 3% 1% -3% -4% -1% -1% 0% 2% 45 Alabama 0% -2% 2% 0% -4% 0% -1% -2% 3% 2% 0% -2% -3% -1% 1% 0% 1% 44 Kentucky 3% 1% 2% 0% 0% 2% 1% 0% 3% 4% -1% -1% -3% -2% 1% 1% 0% 44 Oklahoma 1% 0% 4% 0% -3% -1% 1% 1% 4% 4% 1% -5% -4% -2% 0% -1% 1% 46 South Carolina 0% -1% 1% 1% 0% -1% 0% -1% 0% 7% -2% -3% -4% 0% 0% -1% 2% 30 Arkansas 0% 0% 3% -3% -2% -3% 0% -1% 4% 5% -4% -5% -6% -1% -2% 0% 0% 25 Mississippi 1% -3% 2% -2% 0% -2% 1% -1% 0% 2% 0% -1% -4% 1% 0% 0% -2% 17 West Virginia -2% 1% 2% -1% 0% 3% -2% 1% 5% -1% 1% -5% -2% -1% -2% -2% 1% 9 Delaware 0% -2% 2% -2% -4% -1% 1% 6% 10% 10% -3% -2% 3% 2% 2% -2% 3% 7 District of Columbia
Annual Percent Change

Projections of High School Graduates24
AT THE COLLEGE DOORKNOCKING CHAPTER 3. REGIONAL AND STATE VARIATION
20 percent of the nation’s White public high school students, but by the end of the projection period that share is expected to drop to 18 percent as the number of White public high school graduates in the Northeast is projected to decrease from 365,100 in 2012-13 to 305,200 by 2024-25, and to 271,500 by the end of the projections – a decrease of 26 percent (see Figure 3.6).
The reduction in the White youth population also affects the West and South, even if it does not lead to regional declines overall. Figure 3.7 shows the number of White public high school graduates from the West will decline over the course of the projections, from about 356,000 in 2012-13 to about 343,000 by 2024-25 (going from about 45 percent of the national number to about 37 percent). The number of White public high
school students in the South is projected to decline, as well, although by less than the West – from 590,000 in 2012-13 to 585,000 in 2024-25, as the South will gain in share of the national total of White public high school graduates, from 37 percent to 40 percent between 2012-13 and 2024-25 (see Figure 3.8).
The number of high school graduates from private schools is projected to decline in all regions. And while it is not possible to precisely tie this decline to any factor, and indeed it is likely related to multiple factors, the reduction in the White youth population is logically a strong factor in the decline of the private school population (as 70 percent or more of students at private high schools have been White, historically).4
-100,000
-75,000
-50,000
-25,000
0
25,000
50,000762K
50,000
25,000
0
-25,000
-50,000
-75,000
-100,000
Figure 3.5. High School Graduates by Region and Race/Ethnicity – Midwest
733K (2025)
673K
2012-13 2018-19 2031-32 2012-13 2018-19 2024-25 2031-322024-25
American Indian/Alaska Native Asian/Pacific Islander Black Hispanic White Private
-100,000
-75,000
-50,000
-25,000
0
25,000
50,000639K
American Indian/Alaska Native Asian/Pacific Islander Black Hispanic White Private
50,000
25,000
0
-25,000
-50,000
-75,000
-100,000
613K (2025)
563K
Figure 3.6. High School Graduates by Region and Race/Ethnicity – Northeast
2012-13 2018-19 2031-32 2012-13 2018-19 2024-25 2031-322024-25

December 2016 25
AT THE COLLEGE DOORKNOCKING CHAPTER 3. REGIONAL AND STATE VARIATION
OtherFactorsContributingtoDecliningNumbersThe patterns vary by region and state, but for the purpose of this summary, Black public high school graduates are a factor in the declines seen in the Midwest and Northeast, and to a lesser extent, in the West. Only in the South are Black public high school graduates a growth factor. The number of Black public high school graduates in the Midwest and Northeast peaked around 2010-11 and is projected to decline incrementally over the course of the projections, compounding the declines in the number of White high school graduates in these regions. The number of Black public high school graduates in the Midwest are projected to decline about 6 percent from 87,800
in 2012-13 to 82,200 by 2024-25, and will decline another 6 percent after that point, to a low of 75,800 in 2028-29. The Northeast is projected to see similar rates of decline among the number of Black public high school graduates, dipping slightly from 75,600 in 2012-13 to 73,900 by 2024-25, and then dropping to 65,200 in the last projected year, 2031-32 (about 14 percent fewer between 2012-13 and 2031-32). As for the West, which contributed 9 percent of the nation’s Black public high school graduates in 2012-13 (about 42,000) – by 2024-25, the number of Black public high school graduates is projected to drop in number (to about 34,000), to 7 percent of the nation’s total Black public high school graduates.
-100,000
-50,000
0
50,000
100,000
150,000
1 2 3 4 5 6 7 8 9 10 11 12 13 14 15 16 17 18 19 202012-13 2018-19 2031-32
1.23M
1.35M (2025)
Figure 3.8. High School Graduates by Region and Race/Ethnicity – South
150,000
100,000
50,000
0
-50,000
-150,0002012-13 2018-19 2024-25 2031-32
1.29M
American Indian/Alaska Native Asian/Pacific Islander Black Hispanic White Private
2024-25
831K856K (2025) 80,000
60,000
40,000
20,000
0
-20,000
-40,000
-60,000-60,000
-40,000
-20,000
0
20,000
40,000
60,000
80,000
American Indian/Alaska Native Asian/Pacific Islander Black Hispanic White Private
789K
Figure 3.7. High School Graduates by Region and Race/Ethnicity – West
2012-13 2018-19 2031-32 2012-13 2018-19 2024-25 2031-322024-25
Projections of High School Graduates26
AT THE COLLEGE DOORKNOCKING CHAPTER 3. REGIONAL AND STATE VARIATION
The number of American Indian/Alaska Native public high school graduates is projected to decrease in every region over the course of the projections. This is most notable for the West, which encompasses almost half of the nation’s American Indian/Alaska Native public high school graduates. In 2012-13, there were 14,400 American Indian/Alaska Native public high school graduates in the West (45 percent of the national number), which is about 2 percent of all public high school graduates in the West. By 2024-25, the West will have about 12,000 American Indian/Alaska Native public high school graduates (47 percent of the projected number nationally that year) and the South will have about 8,800. American Indian/Alaska Native public high school graduates are 1 percent or less of all public high school graduates in the Midwest and Northeast. In the Midwest, there are projected to be 30 to 35 percent fewer American Indian/Alaska Native public high school graduates by the early 2030s, down from about 4,000 in 2012-13 to about 2,600 in the last several projected years. In contrast, the Northeast is projected to have greater numbers of American Indian/Alaska Native public high school graduates over the course of the projections, up about 30 percent around 2025 and 20 percent by the early 2030s (about 2,100 and 1,800 respectively).
Growth is the Result of Increasing Numbers of Non-White GraduatesJust as the declining number of White youth is the key driver of projected declines in the number of high school graduates in the Northeast and Midwest, rapid increases in non-White student populations are fueling the growth in the number of high school graduates in the South and West. The previous illustrations (Figures 3.5 through 3.8) highlight the swift, substantial increases among Hispanic public high school graduates, particularly in the South and West, but also to a smaller extent in the Midwest and Northeast. Asian/Pacific Islander high school graduates are fewer in number, but contribute to the increasing number of high school graduates in all regions over the course of the projections. The patterns for Black and American Indian/Alaska Native public high school graduates differ from each other, but the numbers are predicted to either remain generally stable or decline slightly in some years.
The South generated 36 percent (229,000 graduates) of the nation’s Hispanic public high school graduates and 57 percent (268,000 graduates) of the nation’s Black public high school graduates in 2012-13. By 2024-25, the number of Hispanic and Black public high school graduates from the South is expected to increase to about 366,000 and 282,000 graduates, respectively, or 40 percent and 60 percent of the nation’s total Hispanic and Black public high school graduates.
In 2012-13, the West generated 43 percent of the nation’s Hispanic public high school graduates (about 279,000 graduates). By 2024-25, the Western states are projected to generate about 341,000 Hispanic public high school graduates, which by then will represent 37 percent of the total number of Hispanic public high school graduates in the nation. The number of Hispanic high school graduates in Southern states (including Texas and Florida) is projected to surpass that generated by the West by 2022-23.
While the Midwest and Northeast are, generally speaking, experiencing a decline in the number of high school graduates they produce, these two regions are projected to experience an increase in the size of their Hispanic public high school populations similar to that of the overall national trend. The Northeast generated about 12 percent of the nation’s Hispanic graduates (about 76,000 graduates) in 2012-13. The number of Hispanic public high school graduates in the Northeast is projected to increase rapidly, reaching about 121,000 graduates by 2024-25, which will be 13 percent of the nation’s total number at that point. The strong increases in the number of Hispanic public high school graduates will mean that by 2024-25, for every 10 fewer White public high school graduates in the Northeast there will be eight additional Hispanic graduates, just short of replacement. Along these lines, in the Midwest between 2012-13 and 2024-25, the declining number of White public high school graduates (a decrease of about 37,500 graduates) will be offset almost one-to-one by the projected increases in Hispanic public high school graduates (an increase of about 39,200 graduates). By 2024-25, the Midwest is projected to be producing about 10 percent of the nation’s Hispanic public high school graduates.
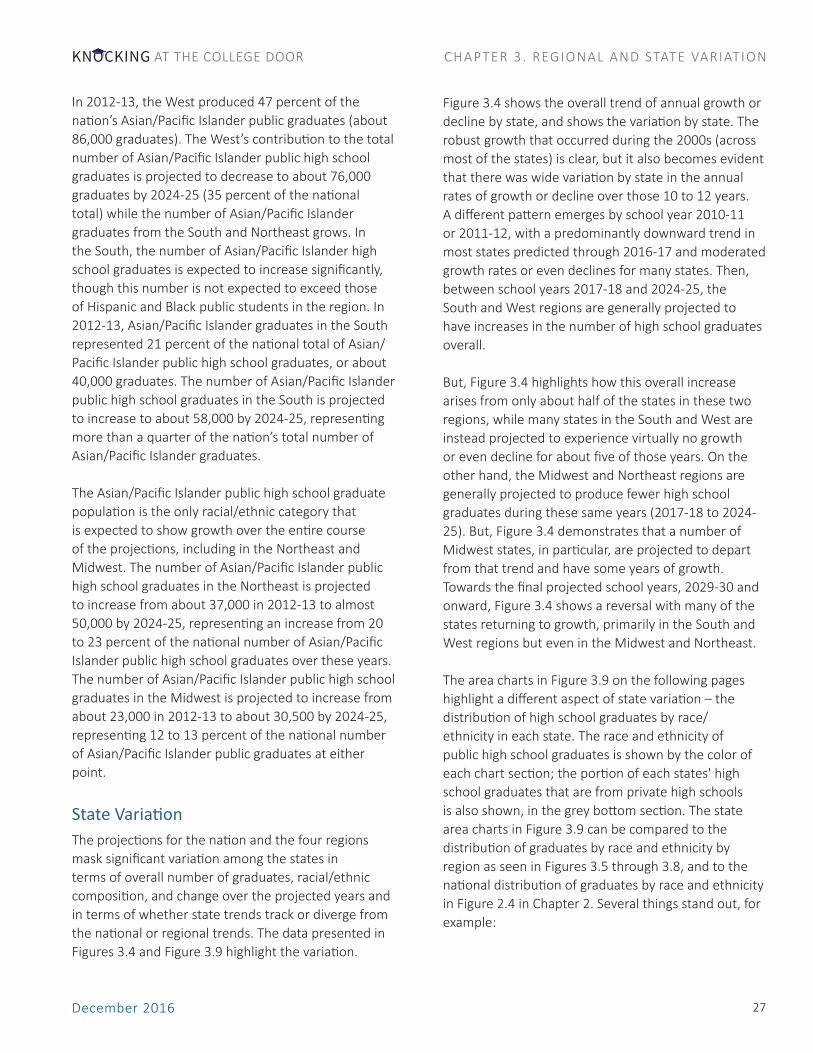
December 2016 27
AT THE COLLEGE DOORKNOCKING CHAPTER 3. REGIONAL AND STATE VARIATION
In 2012-13, the West produced 47 percent of the nation’s Asian/Pacific Islander public graduates (about 86,000 graduates). The West’s contribution to the total number of Asian/Pacific Islander public high school graduates is projected to decrease to about 76,000 graduates by 2024-25 (35 percent of the national total) while the number of Asian/Pacific Islander graduates from the South and Northeast grows. In the South, the number of Asian/Pacific Islander high school graduates is expected to increase significantly, though this number is not expected to exceed those of Hispanic and Black public students in the region. In 2012-13, Asian/Pacific Islander graduates in the South represented 21 percent of the national total of Asian/Pacific Islander public high school graduates, or about 40,000 graduates. The number of Asian/Pacific Islander public high school graduates in the South is projected to increase to about 58,000 by 2024-25, representing more than a quarter of the nation’s total number of Asian/Pacific Islander graduates.
The Asian/Pacific Islander public high school graduate population is the only racial/ethnic category that is expected to show growth over the entire course of the projections, including in the Northeast and Midwest. The number of Asian/Pacific Islander public high school graduates in the Northeast is projected to increase from about 37,000 in 2012-13 to almost 50,000 by 2024-25, representing an increase from 20 to 23 percent of the national number of Asian/Pacific Islander public high school graduates over these years. The number of Asian/Pacific Islander public high school graduates in the Midwest is projected to increase from about 23,000 in 2012-13 to about 30,500 by 2024-25, representing 12 to 13 percent of the national number of Asian/Pacific Islander public graduates at either point.
StateVariationThe projections for the nation and the four regions mask significant variation among the states in terms of overall number of graduates, racial/ethnic composition, and change over the projected years and in terms of whether state trends track or diverge from the national or regional trends. The data presented in Figures 3.4 and Figure 3.9 highlight the variation.
Figure 3.4 shows the overall trend of annual growth or decline by state, and shows the variation by state. The robust growth that occurred during the 2000s (across most of the states) is clear, but it also becomes evident that there was wide variation by state in the annual rates of growth or decline over those 10 to 12 years. A different pattern emerges by school year 2010-11 or 2011-12, with a predominantly downward trend in most states predicted through 2016-17 and moderated growth rates or even declines for many states. Then, between school years 2017-18 and 2024-25, the South and West regions are generally projected to have increases in the number of high school graduates overall.
But, Figure 3.4 highlights how this overall increase arises from only about half of the states in these two regions, while many states in the South and West are instead projected to experience virtually no growth or even decline for about five of those years. On the other hand, the Midwest and Northeast regions are generally projected to produce fewer high school graduates during these same years (2017-18 to 2024-25). But, Figure 3.4 demonstrates that a number of Midwest states, in particular, are projected to depart from that trend and have some years of growth. Towards the final projected school years, 2029-30 and onward, Figure 3.4 shows a reversal with many of the states returning to growth, primarily in the South and West regions but even in the Midwest and Northeast.
The area charts in Figure 3.9 on the following pages highlight a different aspect of state variation – the distribution of high school graduates by race/ethnicity in each state. The race and ethnicity of public high school graduates is shown by the color of each chart section; the portion of each states' high school graduates that are from private high schools is also shown, in the grey bottom section. The state area charts in Figure 3.9 can be compared to the distribution of graduates by race and ethnicity by region as seen in Figures 3.5 through 3.8, and to the national distribution of graduates by race and ethnicity in Figure 2.4 in Chapter 2. Several things stand out, for example:
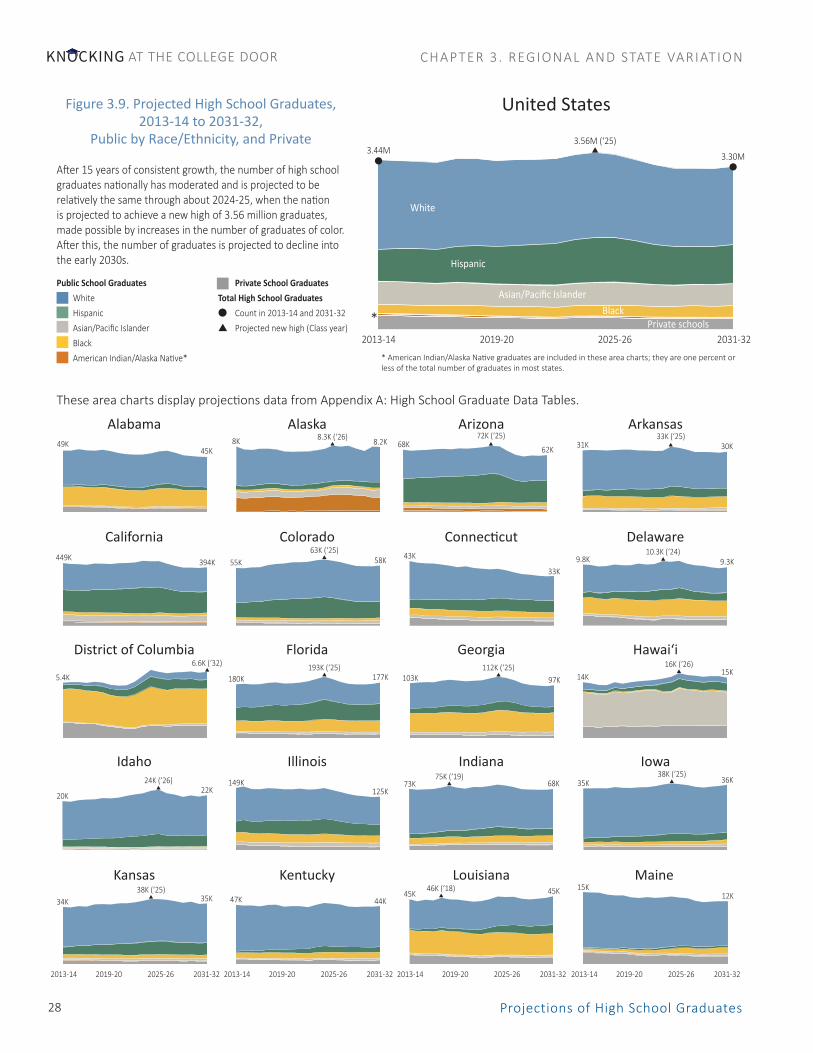
Projections of High School Graduates28
AT THE COLLEGE DOORKNOCKING CHAPTER 3. REGIONAL AND STATE VARIATION
Alabama Alaska Arizona Arkansas
California Colorado Connecticut Delaware
District of Columbia Florida Georgia Hawai‘i
Idaho Illinois Indiana Iowa
Kansas Kentucky Louisiana Maine
2013-14 2019-20 2025-26 2031-32
United States
3.44M3.30M
3.56M (‘25)
White
Hispanic
Asian/PacificIslanderBlack
Private schools2013-14 2019-20 2025-26 2031-32
Figure 3.9. Projected High School Graduates, 2013-14 to 2031-32,
Public by Race/Ethnicity, and Private
After 15 years of consistent growth, the number of high school graduates nationally has moderated and is projected to be relatively the same through about 2024-25, when the nation is projected to achieve a new high of 3.56 million graduates, made possible by increases in the number of graduates of color. After this, the number of graduates is projected to decline into the early 2030s.
Public School Graduates White Hispanic Asian/Pacific Islander Black American Indian/Alaska Native*
Private School GraduatesTotal High School Graduates
Count in 2013-14 and 2031-32Projected new high (Class year)
These area charts display projections data from Appendix A: High School Graduate Data Tables.
49K45K
8K 8.2K8.3K (‘26)68K 62K
72K (‘25)31K 30K
33K (‘25)
449K 394K 55K 58K63K (‘25)
43K
33K9.8K 9.3K
10.3K (‘24)
5.4K
6.6K (‘32)
180K193K (‘25)
177K 103K112K (‘25)
97K 14K16K (‘26)
15K
20K
24K (‘26)22K
149K125K
73K 68K75K (‘19) 38K (‘25)
36K35K
34K38K (‘25)
35K 47K 44K45K
46K (‘18) 45K 15K12K
* American Indian/Alaska Native graduates are included in these area charts; they are one percent or less of the total number of graduates in most states.
*
2013-14 2019-20 2025-26 2031-32 2013-14 2019-20 2025-26 2031-32 2013-14 2019-20 2025-26 2031-32
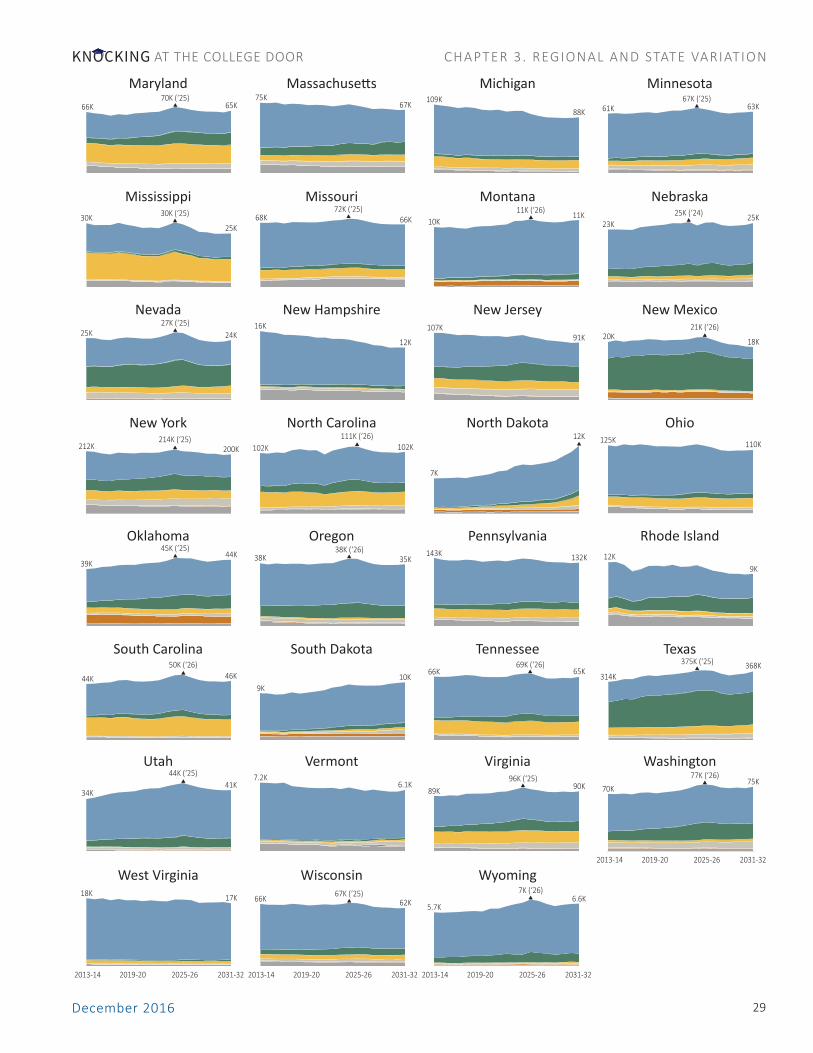
December 2016 29
AT THE COLLEGE DOORKNOCKING CHAPTER 3. REGIONAL AND STATE VARIATION
New York North Carolina North Dakota Ohio
Oklahoma Oregon Pennsylvania Rhode Island
South Carolina South Dakota Tennessee Texas
Utah Vermont Virginia Washington
West Virginia Wisconsin Wyoming
Maryland Massachusetts Michigan Minnesota
Mississippi Missouri Montana Nebraska
Nevada New Hampshire New Jersey New Mexico
66K70K (‘25)
65K75K
67K109K
88K 61K67K (‘25)
63K
30K 30K (‘25)
25K68K
72K (‘25)66K 10K
11K (‘26) 11K23K
25K25K (‘24)
25K 24K27K (‘25) 16K
12K
107K91K 20K
21K ('26)20K
18K
21K (‘26)
212K 214K ('25)212K 200K214K (‘25)
102K 111K ('26)102K 102K
111K (‘26)
7K7K
12K 125K 110K
39K44K
45K (‘25)38K 35K
38K (‘26) 143K 132K 12K12K9K
44K 46K50K (‘26)
9K9K10K
66K 65K69K (‘26)
314K368K375K (‘25)
34K41K
44K (‘25) 7.2K6.1K
89K 90K96K (‘25)
70K75K
77K (‘26)
18K 17K 66K 62K67K (‘25)
5.7K6.6K
7K (‘26)
2013-14 2019-20 2025-26 2031-32 2013-14 2019-20 2025-26 2031-32 2013-14 2019-20 2025-26 2031-32
2013-14 2019-20 2025-26 2031-32

Projections of High School Graduates30
AT THE COLLEGE DOORKNOCKING CHAPTER 3. REGIONAL AND STATE VARIATION
ff These area charts highlight that in very few states, if any, are there projected to be increases in the number of White public high school graduates as shown in blue. Rather, the reduction in White public high school graduates underlies the overall decreases in high school graduates. This is particularly striking for Northeast states like Connecticut and Maine, and Midwest states like Illinois and Michigan.
ff The substantial portion of all high school graduates which are Hispanic may not be a surprise for states such as Texas and New Mexico as shown in green. But, the growth in the portion of graduates that will be Hispanic may be surprising for states like Oklahoma and Nebraska. And, these area charts illustrate how for many states the growing population of Hispanic high school graduates adds to any overall future increases in high school graduates. Also, it is evident that the projected increases in Hispanic graduates in some states offset the reduced number of graduates of other races, particularly White. But, in other cases, Hispanic graduates appear to overtake the portion of high school graduates that is Black.
ff While American Indian/Alaska Native graduates are only about one percent of high school graduates nationally, the area charts in Figure 3.11 highlight which states generate the vast majority of these graduates – Alaska, Montana, New Mexico, North Dakota, Oklahoma, and South Dakota.
ff Similarly evident from these area charts are the states for whom Black high school graduates are a substantial portion of overall graduates.
First-TimeProjectionsforU.S.PacificTerritories and Freely Associated States For the first time, WICHE attempted projections for outlying U.S. Pacific territories and freely associated states. The U.S. Pacific territories and freely associated states are members of WICHE. WICHE produced projections for Guam, but was unable to do so for the Commonwealth of the Northern Mariana Islands due to data limitations. WICHE also produced projections for Puerto Rico for the first time, given its connection to the U.S. and frequent exchange of individuals through migration. For each of these entities, WICHE was only able to obtain the data necessary to produce
projections for overall public school students and graduates (additional information can be found in Appendix C).5 Steady production of graduates in Guam. Guam public schools produced between 1,200 and 1,800 high school graduates in the years between 2003-04 and 2010-11 (see Figure 3.10). The projections indicate that Guam will continue to steadily produce an average of 1,500 public high school graduates per year through the Class of 2023, after which it appears there will be an uptick in high school graduates to about 1,800 on average, per year, related to growth in the number of births from 2006 to 2012 and good enrollment progression.6
On average, 88 percent of public school enrollments are reported as Asian/Pacific Islander; 97 percent of high school graduates. Three-quarters of the combined Asian/Pacific Islander students in 2010-11 to 2013-14, the years data were available, were reported as Pacific Islander or Hawai‘ian Natives (this race detail was not available in the high school graduates data). There are also four Department of Defense schools in Guam with about 2,500 students and a hundred or less 12th graders in recent years (2006-07 to 2014-15).7
Striking declines in graduates in Puerto Rico. After several decades of population and economic growth, Puerto Rico has seen a rapid decline in population in the last decade or so.8 These significant population declines are showing in steady school enrollment
-
500
1,000
1,500
2,000
2,500
2003-04 2011-12 2019-20 2027-28
1,346
1,759
2003-04 2010-11 2024-25 2031-32
2,500
2,000
1,500
1,000
500
0
Figure 3.10. Guam Public High School Graduates, 2003-04 to 2031-32
ACTUAL
P R O J E C T E D

December 2016 31
AT THE COLLEGE DOORKNOCKING CHAPTER 3. REGIONAL AND STATE VARIATION
declines, which are set to begin showing in high school graduates. Puerto Rico public schools produced between 29,000 and 32,000 high school graduates in the years between 2000-01 and 2008-09 (see Figure 3.11). The declines in births and enrollments begins to show at the high school level most notably beginning in 2009-10, and continuing in each subsequent year. The projections indicate that the Class of 2020 public high school graduates will fall below 20,000 in Puerto Rico. And that by the Class of 2028, there will be less than half the number of public high school graduates as 20 years prior, below 15,000.9 Practically speaking, virtually all of the public school students/graduates are considered Hispanic.10 It appears that about 75 percent of K-12 students are enrolled in the public sector. While WICHE did not obtain sufficient data to separately project the number of graduates from private high schools, an additional 13,000 to 14,000 high school graduates were reported by private schools in Puerto Rico in the 2010-11 to 2013-14 school years.
RegionalandStateVariationSummaryThis chapter illustrates the projected trends in the regions, including the number of graduates and demographic makeup over the course of the projected period. Each state has its own particular variations, of course, which are a result of complex state-specific factors. Several overriding patterns, however, can be discerned for the next 15 years or so. The South and West currently produce the greatest number of graduates and are likely to experience generally robust growth in the number of high school graduates over the next decade. The Midwest and Northeast can generally be described as in decline overall. All regions will face projected declines in the number of high school graduates after about 2025, roughly a decade from now, but the magnitude of those declines will be quite different. The extent, pace, and magnitude of growth or decline are closely related to the racial/ethnic composition of the youth populations in these regions and states. Generally speaking, the more diverse the population, the better the region or state appears to fare over the course of the projections in terms of either increases in the number of high school graduates, or at least lesser declines. Inversely, states or regions with a greater portion of White youth stand to experience greater declines in the number of high school graduates throughout the course of these projections, as the White youth population declines in number.
10
15
20
25
30
35
2000-01 2010-11 2020-21 2030-31
Th
ou
san
ds
2000-01 2010-11 2024-25 2031-32
35,000
30,000
25,000
20,000
15,000
10,000
Figure 3.11. Puerto Rico Public High School Graduates, 2000-01 to 2031-32
ACTUAL
P R O J E C T E D
30,154
11,798
Projections of High School Graduates32
AT THE COLLEGE DOORKNOCKING CHAPTER 3. REGIONAL AND STATE VARIATION
Endnotes1 The regional divisions are consistent with those established by the U.S. Census Bureau, with the exception of North Dakota and South Dakota, which are included in the Western region, as they face many of the same conditions and share a number of attributes with neighboring Western states, such as Montana and Wyoming, and are also WICHE states. The U.S. Pacific territories and freely associated states are also WICHE members, but due to data limitations, were not included in the calculations for the regional projections and are therefore not displayed on the map. See Appendix A for Guam's and Puerto Rico's public high school graduate data tables.2 Unless otherwise noted, years for high school graduates refer to the end of the K-12 school year, e.g., May 1997 of the 1996-97 school year. The first projected year is different between public and private school graduates, due to differences in data availability. Public high school graduates represent 91 percent or more of the total number of graduates, and therefore when this publication refers to the total number of public and private high school graduates or to public school graduates alone, it is referring to the first year of projected graduates as the 2013-14 school year, or the Class of 2014. When this publication focuses on private school graduates alone, the first year of projected graduates is for the 2011-12 school year, or the Class of 2012.3 Due to data limitations, projections by race/ethnicity are limited to public high school graduates.4 National Center for Eduction Statistics, Private School Universe Survey (PSS), Data Tables, Washington, DC: U.S. Department of Education National Center for Education Statistics, accessed October 13, 2016, https://nces.ed.gov/surveys/pss/.5 Complete data were not available from the NCES Common Core of Data, so WICHE requested assistance obtaining data from officials in Guam, Puerto Rico, and the Commonwealth of the Northern Mariana Islands, but found that data for these entities is generally less complete and detailed than necessary. 6 The data obtained that report 6 to 13 percent more high school graduates than the number of 12th graders suggest that totals including these additional graduates would be as much as 15 percent higher in any given projected year if WICHE used those data. These data were not used because WICHE considered them anomalous.7 U.S. Department of Defense Education Activity (DoDEA), Pacific Area Guam Schools enrollment data at http://www.dodea.edu/datacenter/enrollment_display.cfm. WICHE was not able to obtain data on the number of graduates from private high schools in Guam.8 Jens Manual Krogstad, Historic Population Losses Continue Across Puerto Rico. Washington D.C.: Pew Research Center, 2016, accessed May 15, 2016, http://www.pewresearch.org/fact-tank/2016/03/24/historic-population-losses-continue-across-puerto-rico/; Jaison R. Abel, Richard Dietz, “The Causes and Consequences of Puerto Rico’s Declining Population,” Federal Reserve Bank of New York (2014), accessed May 15, 2016, www.newyorkfed.org/medialibrary/media/research/current_issues/ci20-4.pdf. From April 2010 to July 2015 Puerto Rico is estimated to have lost 295,718 citizens to out-migration, which includes migration to the mainland United States. There are several possible reasons for the rapid increase in migration to the mainland United States, the most important of which is the economic climate in Puerto Rico. High unemployment and a weak economic outlook plays a large role in out-migration from the island, especially for younger and less educated individuals. Although it is unclear how many school-age children are migrating from Puerto Rico to the United States, the large number of 16-30 year olds who are migrating has the potential to affect future education enrollment.9 The data obtained that appear to have included all diploma recipients, including non-standard and those from special schools, suggest that totals including these diploma types may be as much as 20 percent higher in any given year, but with the same rate of declines related to overall birth and population declines.10 WICHE did not have sufficient data to attempt projections by race/ethnicity, but, on average 95 percent of births were classified as Hispanic between 2005 and 2014 (the years that births data were available by race/ethnicity), and virtually 100 percent of public school enrollments were classified as Hispanic in the available data.
http://www.pewresearch.org/fact-tank/2016/03/24/historic-population-losses-continue-across-puerto-ri

December 2016 33
AT THE COLLEGE DOORKNOCKING CHAPTER 4. ENROLLMENT PROJECTIONS
CHAPTER 4. ENROLLMENT PROJECTIONS
WICHE relies on data about the number of recent births and enrollment counts to generate the projections in Knocking at the College Door. While these births and enrollment data are not the focus of this publication, WICHE provides them because they provide useful information about the children who will ultimately move through the educational pipeline and emerge as high school graduates over the course of the next 15 years or so.
Trends with Younger Youth Drive High School Graduate ProductionA few highlights from these data help illustrate what is behind the projected overall reduction in the number of high school graduates and how the changing racial/ethnic composition of America’s youth population contributes to that trend.
BirthsDeclines in the number of babies born in recent years in the U.S. will result in smaller graduating classes, projected to begin by 2025 and into the early 2030s. Figure 4.1 shows the recent decline in births nationally beginning around 2007. Essentially, the total U.S. fertility rate is teetering at or below replacement
level, which is the estimated level of fertility that is necessary for a population to sustain itself assuming no in-migration or out-migration.1
The story appears a little different when looking at the various racial/ethnic populations. A decline in White youth has been predicted for years.2 This long-anticipated reduction was then amplified as birth rates declined substantially for all populations after 2007. In other words, the long-predicted contraction in the number of White high school graduates unfolds throughout the course of these projections, but is compounded by the recent sharp declines in births. The other races also experienced declines further amplifying the decline in the overall number of high school graduates, because non-Whites had previously been the driver of growth in the number of school-age youth. In particular, the largest relative declines in births/fertility rates occurred among Hispanic women.3
Regional views provide another perspective on these trends. Figure 4.2 shows changes in the overall numbers and the racial/ethnic profiles of births between 1990 and 2014 by region.4 Declines in the numbers of White births in the Midwest and Northeast
3.8
3.9
4.0
4.1
4.2
4.3
4.4
Mill
ions
1990 1996 2002 2014
4.4
4.3
4.2
4.1
4.0
3.9
3.8
Mill
ions
3 .99
3.93
4.32
3.88
Figure 4.1. Births in the U.S., 1990-2014
2008Source: National Center for Health Statistics, Centers for Disease Control and Prevention, VitalStats.

Projections of High School Graduates34
AT THE COLLEGE DOORKNOCKING CHAPTER 4. ENROLLMENT PROJECTIONS
are clear, while increases in the share of non-White individuals increased in each region.
Progress Through the K-12 PipelineAs students move through the K-12 pipeline, a variety of factors determine how many and which students will progress all the way through to high school graduation. For example, students move between private and public schools, families move to different states and even different countries, and children change schools and may be either promoted early or retained in a grade. Changes in policies and practices can also potentially impact their progress through the pipeline, as can differences related to their race/ethnicity and changes in their family and economic circumstances. While the primary underlying
explanation for the declining numbers of high school graduates is the reduced number of births, enrollment patterns reveal information that highlights different progression patterns and where improvements could be made to ensure that the greatest possible number of children graduate from high school.
Ideally, the many factors, which relate to how and whether students progress as expected through grade levels to high school graduation could be quantified, but precise information about these complex underlying trends is difficult to find. Therefore, WICHE does not explicitly model these factors. Instead, these projections rely on a relatively simple and straightforward methodology that observes the percentage of students in one grade who are encompassed by the number of students in the next
-
200,000
400,000
600,000
800,000
1,000,000
1,200,000
1,400,000
1,600,000
1,800,000
-
200,000
400,000
600,000
800,000
1,000,000
1,200,000
1,400,000
1,600,000
1,800,000
1 3 5 7 9 11 13 15 17 19 21 23 25
total
-
200,000
400,000
600,000
800,000
1,000,000
1,200,000
1,400,000
1,600,000
1,800,000
-
200,000
400,000
600,000
800,000
1,000,000
1,200,000
1,400,000
1,600,000
1,800,000
1990 2000 2010 2014
1.8
1.5
1.2
0.9
0.6
0.3
0
Mill
ions
38%44%
49%
Hispanic Black Asian/Pacific Islander American Indian/Alaska Native White Total % Nonwhite
SOUTH
-
200,000
400,000
600,000
800,000
1,000,000
1,200,000
1,400,000
1,600,000
1,800,000
-
200,000
400,000
600,000
800,000
1,000,000
1,200,000
1,400,000
1,600,000
1,800,000
1 3 5 7 9 11 13 15 17 19 21 23 25
total
-
200,000
400,000
600,000
800,000
1,000,000
1,200,000
1,400,000
1,600,000
1,800,000
1 3 5 7 9 11 13 15 17 19 21 23 25
total
1990 2000 2010 2014
1.8
1.5
1.2
0.9
0.6
0.3
0
Mill
ions
46% 53% 56%
WEST
1990 2000 2010 2014
1.8
1.5
1.2
0.9
0.6
0.3
0
Mill
ions
22% 26% 29%
MIDWEST
1990 2000 2010 2014
1.8
1.5
1.2
0.9
0.6
0.3
0
Mill
ions
31% 35% 41%
NORTHEAST
-
200,000
400,000
600,000
800,000
1,000,000
1,200,000
1,400,000
1,600,000
1,800,000
1 3 5 7 9 11 13 15 17 19 21 23 25
total
Figure 4.2. Births by Race/Ethnicity, by Region, 1990 to 2014

December 2016 35
AT THE COLLEGE DOORKNOCKING CHAPTER 4. ENROLLMENT PROJECTIONS
higher grade the following year (described in Chapter 1 and in more detail in Appendix C). This method has advantages and disadvantages for developing projections, but the methodology is considered sound; furthermore, other educational agencies use similar cohort survival methods for producing projections.
Projected EnrollmentsSchool planners will find these enrollments projections useful for anticipating the current and near-future waves of students as they evaluate capacity and funding for future school years (high school enrollment projections for the nation and region are presented in Appendix B). The national enrollment trends mirror those described for the graduates, except that most of the changes occur nearer in the future than with high school graduates.
Figure 4.3 depicts enrollments by school level (elementary, middle, and high school grades), and by race/ethnicity. WICHE is able to project high school enrollments further into the future than earlier grade enrollments, so this figure displays only the projected middle and high school enrollments in the later years, while earlier grades are shown as “not available.” Although elementary grade enrollments are projected through 2020-21 only, the data clearly show how the recent declines in birth rates begin to flow into the school pipeline in terms of reductions in the number of elementary grade enrollments (the lightest shade shown on the charts) from 2000 to 2020.
White public school students. The greatest declines are among the numbers of White public school students, whose enrollments declined 8 percent (from 26.3 million to 24.2 million) between 2000-01 and 2010-11, and are projected to decline another 7 percent (to 22.4 million) by 2020-21. White students comprised 54 percent of total public school enrollments in the 2010-11 school year, and 56 percent of middle and high school enrollments, respectively (the two darker shades shown on the charts). By school year 2020-21, White students are projected to represent just 50 percent of public school enrollments overall, and this number is projected to dip below 50 percent in the middle and high school
grades by school year 2028-29, the last year of WICHE’s high school enrollment projections.
Hispanic public school students. With respect to Hispanic students, the data show just how substantial was their contribution to public school enrollments overall between 2000 and 2010, increasing from 6.8 million in 2000-01 to 10.1 million in 2020-21 – an increase from 16 percent to 23 percent of all public school students. Compare this increase of 3.35 million Hispanic students over those 10 years to the 2.10 million decrease in the number of White students. By grade level, the number of Hispanic public elementary school students increased 39 percent, by 49 percent at the middle school level, and by 68 percent at the high school level. The number of Hispanic middle and high school students is projected to continue increasing at a swift pace, by 29 percent and 35 percent, respectively, between 2010-11 and 2020-21. However, the previous rates of increase do not appear to be sustained at the elementary school level, at which the number of Hispanic elementary school students is projected to increase by only 1 percent through 2020-21. This significant slowdown is related primarily to the recent declines in birth rates, and perhaps to reduced immigration as well. Past 2020-21, trends in the number of Hispanic public high school students will follow the overall trend downward. By school year 2020-21, Hispanic students are projected to account for 26 percent of all public school first- through fifth-graders. Also by school year 2020-21 and going forward throughout the projections, Hispanic students are projected to account for 26 to 28 percent of all public middle school and high school students.
Black public school students. The numbers of Black public school students are projected to decline somewhat throughout the course of the projections, largely in line with the overall trend. The total number of Black public school students is expected to remain relatively steady compared to the other student populations, however. The number of Black public elementary school students is projected to decline by 3 percent from 3.01 million in 2010-11 to around 2.93 million by 2020-21. The number of Black public middle school students will increase by 2 percent from 1.82 million in 2010-11 to 1.86 million students by 2020-21,

Projections of High School Graduates36
AT THE COLLEGE DOORKNOCKING CHAPTER 4. ENROLLMENT PROJECTIONS
and then decline by about 7 percent, to about 1.74 million students, by 2025-26. The number of Black public high school students is projected to decline by 7 percent from 2.47 million in 2010-11 to 2.31 million by 2020-21, and then decline another 2 percent by 2028-29. Between 2000-01 and 2010-11, the number of Black public high school students declined by a
percentage point among total enrollments, in part due to small numerical declines but it is likely that some of the apparent reduction in numbers is related to recategorization to other racial/ethnic categories (see Appendix C for additional information). By 2010-11, Black public high school students comprised 16 percent of public school elementary and middle
2000
White
30
25
20
15
10
5
0
Mill
ions
Figure 4.3. U.S. School Enrollments by Level and Race/Ethnicity, 2000-01 to 2028-29
2010 2020 2025 2030
Hispanic Black
Grades1-5
Grades6-8
Grades9-12
Grades1-5n/a
Grades1-8n/a
Grades1-5n/a
Grades1-8n/a
Grades1-5n/a Grades
1-8n/a
Grades1-5
Grades6-8
Asian/Pacific Islander
5
4
3
2
1
0
Mill
ions
Grades9-12
American Indian/Alaska Native Private Schools
Grades1-5n/a
Grades1-8n/a
Grades1-5n/a
Grades1-8n/a
Grades1-5n/a
Grades1-8n/a
Note: Race/ethnicity detail only available for public school students.
2000 2010 2020 2025 2030 2000 2010 2020 2025 2030
2000 2010 2020 2025 2030 2000 2010 2020 2025 2030 2000 2010 2020 2025 2030
December 2016 37
AT THE COLLEGE DOORKNOCKING CHAPTER 4. ENROLLMENT PROJECTIONS
school enrollments and 17 percent of public high school enrollments. The percentage of Black students enrolled in public high school is expected to remain at or very near this number throughout the course of the projections.
Asian/Pacific Islander public school students. Asian/Pacific Islander public school students are the only student population that is projected to consistently add K-12 public school enrollments throughout the projections, at all school levels. Between 2010-11 and 2020-21, Asian/Pacific Islander public school elementary enrollments are projected to increase by 7 percent (an increase of about 308,000 students), middle school students by 12 percent (155,000), and high school students by 11 percent (224,000). Even in the later years of the projections, when all other student populations are expected to decline in number, the number of Asian/Pacific Islander students is expected to increase. The projections show there will be an additional 7 percent of Asian/Pacific Islander middle school students between 2020-21 and 2025-26, and 10 percent more Asian/Pacific Islander public high school students between 2020-21 and 2028-29. The total number of Asian/Pacific Islander public high school students is projected to increase past 1 million by 2028-29.
Native Hawai‘ian/Pacific Islander public school students. Due to data limitations, WICHE was unable to produce reliable projections for Native Hawai‘ian/Pacific Islander public school enrollments. The available data, however, indicate that between 2010-11 and 2013-14, Hawai‘ian/Pacific Islanders represented about 7 percent of the total combined number of Asian/Pacific Islander students at each school level – elementary, middle, and high school (the number of Native Hawai‘ian/Pacific Islander public school students decreased about 2 percent between school year 2012-13 and 2013-14, which is somewhat contrary to the expected trend). Of course, Hawaiian/Pacific Islanders represent a substantial part of some states’ populations with education outcomes that are distinct from the overall Asian/Pacific Islander population – for example, Hawai‘i and the Pacific Northwest states. And, certain local school districts may have a substantial number of Native Hawai‘ian/
Pacific Islander students, but these lower-level enrollments do not appear as substantial when rolled up in the state-level data (see Appendix C for more information).
American Indian/Alaska Native public school students. American Indian/Alaska Native students make up roughly 1 percent of all public school students, at all levels.5 Overall, the number of American Indian/Alaska Native students is projected to decrease over the course of the projections. The number of American Indian/Alaska Native public elementary school students is projected to decline by 14 percent between 2010-11 and 2020-21, from about 215,000 to about 184,500 students. At the middle school level, the number is projected to decline by 13 percent by 2020-21 and another 11 percent by 2025-26, from about 131,000 students in 2010-11 to 101,500 students by 2025-26. The number of American Indian/Alaska Native public high school students is projected to decline by 28 percent (from about 175,000 to about 125,000 students) between 2010-11 and 2028-29, the last year of WICHE’s high school enrollment projections.
Two or More Races public school students. Due to data limitations, WICHE was not able to produce reliable projections for public school students in the Two or More Races category. Students of Two or More Races represented 3 percent of non-Hispanic students in the first through fifth grades in 2010-11, and 5 percent by 2013-14, a 33 percent increase over these four years. In 2013-14, they represented 4 percent of non-Hispanic sixth to eighth graders, and 3 percent of high school students. Nationally, the number of reported students increased by 10 percent or more each year between 2010-11 and 2013-14. These are unusually high rates of growth, which make the accuracy of extrapolated results questionable; this is just one of several data complexities that limited WICHE’s ability to produce reliable projections for this population. Reliable projections may not be possible for several years until the transition to the new reporting scheme has been fully implemented and enough stable data have accumulated (see Appendix C for more information). The apparent declines projected for American Indian/Alaska Native and Black
Projections of High School Graduates38
AT THE COLLEGE DOORKNOCKING CHAPTER 4. ENROLLMENT PROJECTIONS
students are likely related to the reclassification of these students in the data under the Hispanic or Two or More Races categories.
Private School StudentsThe number of private school students dipped below 10 percent of total high school enrollments by school year 2010-11, and this population is projected to decline in both number and share throughout the projection period – ultimately down to 6 to 8 percent of total enrollments across school levels in the later years of the projections. The declines are projected to be steepest over the next few years, and then should level off somewhat. The number of private elementary and middle school students is projected to decrease 9 percent and 14 percent respectively from 2010-11 through 2020-21. Private high school enrollment is expected to decline 22 percent over this period. Private school enrollment at the middle school and high school levels is projected to decline at about the same rate as overall enrollments in the later years of the projections.
School ChoiceAccording to the Center for Public Education, 16 percent or more of the school age population is enrolled in a “public school of choice” – about 4 percent each in magnet and charter schools and about 10 percent in public schools from inter- or intra-district transfer, and about 1 percent in online schools.6 This increasing diversification in the type of school has the potential to affect graduation trends in ways that might not be easily sensed when these students are included in the total combined public school data. Furthermore, this increasing availability of viable traditional public school alternatives, in particular, can be a contributing factor to the declines in private enrollments.7
Charter SchoolsWICHE does not disaggregate the public school enrollments and graduates by public traditional or charter school due to data limitations. While data about the portion of the public school population that is educated by charter schools are becoming increasingly available, they are currently not available at the level of detail needed for accurate or meaningful projections.8
As a matter of context, however, from school year 1999-2000 to 2012-13, the number of students enrolled in public charter schools increased from 0.3 million to 2.3 million. Over the past five years since the last edition of Knocking at the College Door projections, student enrollment in public charter schools has grown by 70 percent. Elementary school students were the fastest category of enrollment growth. Because the increase in the number of charter school students (1.9 million) was larger than the increase in the number of traditional public school students (0.9 million), the percentage of public school students who attended charter schools increased from 0.7 to 4.6 percent during this period.9
And while the national average of 4.6 percent of enrollments at charter schools might not be enough to significantly impact national graduation trends, the trends in certain states and regions may be affected as the percentage of charter enrollments as a portion of all public school enrollments continues to grow. For example, in school year 2012-13, charter enrollments
Reasons for Declines in Private School Enrollment
There are several reasons for the declines in private school enrollments. Chief among them is undoubtedly the overall reduction in the number of White youth, which have historically represented about 70 percent of the total student population for private schools. But, enrollment in private religious schools and private nonsectarian schools exhibit different patterns; the overall declines are being driven by decreases in the number of students enrolling in private religious schools. Some of these enrollment declines are associated with rising tuition costs, increased enrollment at charter schools, and suburbanization, with families who have historically represented these private school audience moving away from the schools and/or finding suburban public schools to be better than the urban schools they previously attended. In other cases, the decline is related to different preferences among immigrant populations; whereas previous generations of European immigrants tended to enroll in private (religious) schools, newer immigrant populations, such as those from Central and South America, appear to be less inclined to do so.

December 2016 39
AT THE COLLEGE DOORKNOCKING CHAPTER 4. ENROLLMENT PROJECTIONS
represented more than 5 percent of total public school enrollments in 13 states.
ff In 42 states and the District of Columbia, approximately 2.7 million students attended public charter schools – more than 5 percent of the total number enrolled in public schools.
ff In 12 school districts, more than 30 percent of students attended charter schools. In nearly 150 districts, at least 10 percent of students attended charter schools.
ff In 43 school districts, at least 20 percent of public school students were enrolled in charter schools in the 2013-14 school year.10
In 2012, Black students accounted for a higher percentage of enrollment in public charter schools (28 percent) than in traditional public schools (15 percent). Hispanic students also accounted for a higher percentage of enrollment in public charter schools (29 percent) than in traditional public schools (24 percent). The percentage of public charter school enrollees who were White (35 percent) was lower than the percentage of traditional public school enrollees who were White (52 percent). The percentage of Asian/Pacific Islander students enrolled in charter schools (4 percent) was also lower than the percentage enrolled in public schools (5 percent).11
Homeschooled StudentsLikewise, limited data are available about the homeschooled population, making it impossible to provide projections for this group of students. Despite these limitations, it is important to understand some general background about homeschooled students. They represented 3.4 percent of the school-age population (1.77 million students) in 2011, up slightly from 3.0 percent (1.52 million students) in 2007, and research indicates that family financial conditions may have contributed to further recent increases during the economic recession and recovery.12 It is generally not possible to get state-level detail about the number of homeschooled students, nor to determine how many graduates were homeschooled.13
ImmigrationSimilar to the data limitations around charter- and homeschooled students, immigration presents substantial data-related challenges. Immigration – both authorized and unauthorized – has an important effect on population change, including births. With available data, it is simply not possible to pinpoint the exact contribution of immigration on the number of high school graduates. A few statistics about U.S. immigration trends, however, are helpful for understanding the relationship (and to some extent, the magnitude) of immigration to population growth overall and among youth in particular. The key takeaway is that higher immigration in previous years probably added more to the youth population in previous editions' projections than is likely for most of the years covered by the current edition.
In 2014, immigrants – including those who came to the U.S. or who were born here to foreign-born parents – represented 13.6 percent of the U.S. population (of which unauthorized immigrants were estimated to represent about 3.5 percent of the overall population and a quarter of the foreign-born population).14 The Pew Research Center estimates that immigrants contributed fully half of the nation’s population increase between 1965 and 2015 (a total of 72 million people).15
Between 1990 and 2014, non-native youth aged 19 and under represented 4 to 5 percent of all children aged 19 and under (not including U.S.-born children born to non-native parents), but their share relative to U.S.-born children under age 19 has decreased since 2000.16 Also, recent immigrants have higher fertility rates than the U.S-born population.17 Furthermore, the ratio of births to first graders six years later in the U.S. indicates a potentially dramatic decrease in net in-migration over the past five years. Between 2000 and 2008, the number of first graders exceeded the number of births six years previously by 3 percent. After 2010, however, it appears that fewer students enrolled in first grade than had been born six years previously. This is to be expected given factors such as childhood mortality (which is relatively steady at 0.7 percent nationwide), homeschooling, and an increase in the number of younger students who opt to defer
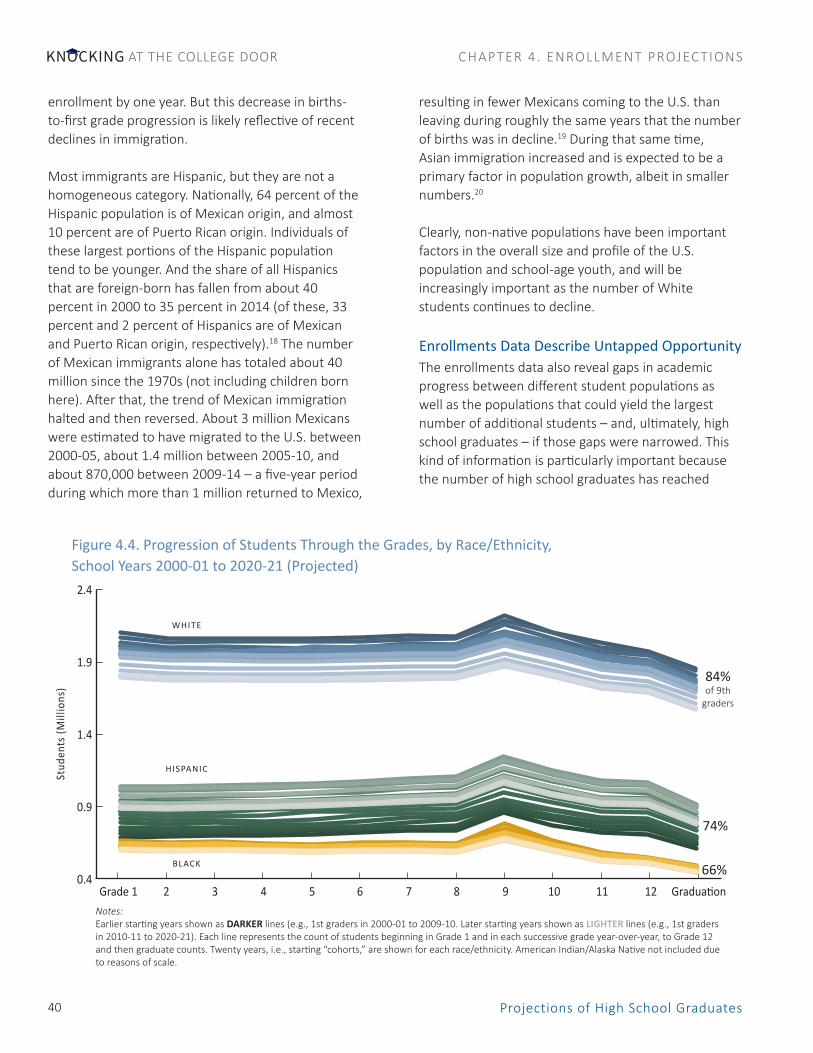
Projections of High School Graduates40
AT THE COLLEGE DOORKNOCKING CHAPTER 4. ENROLLMENT PROJECTIONS
enrollment by one year. But this decrease in births-to-first grade progression is likely reflective of recent declines in immigration.
Most immigrants are Hispanic, but they are not a homogeneous category. Nationally, 64 percent of the Hispanic population is of Mexican origin, and almost 10 percent are of Puerto Rican origin. Individuals of these largest portions of the Hispanic population tend to be younger. And the share of all Hispanics that are foreign-born has fallen from about 40 percent in 2000 to 35 percent in 2014 (of these, 33 percent and 2 percent of Hispanics are of Mexican and Puerto Rican origin, respectively).18 The number of Mexican immigrants alone has totaled about 40 million since the 1970s (not including children born here). After that, the trend of Mexican immigration halted and then reversed. About 3 million Mexicans were estimated to have migrated to the U.S. between 2000-05, about 1.4 million between 2005-10, and about 870,000 between 2009-14 – a five-year period during which more than 1 million returned to Mexico,
resulting in fewer Mexicans coming to the U.S. than leaving during roughly the same years that the number of births was in decline.19 During that same time, Asian immigration increased and is expected to be a primary factor in population growth, albeit in smaller numbers.20
Clearly, non-native populations have been important factors in the overall size and profile of the U.S. population and school-age youth, and will be increasingly important as the number of White students continues to decline.
Enrollments Data Describe Untapped OpportunityThe enrollments data also reveal gaps in academic progress between different student populations as well as the populations that could yield the largest number of additional students – and, ultimately, high school graduates – if those gaps were narrowed. This kind of information is particularly important because the number of high school graduates has reached
Grade 1
2.4
1.9
1.4
0.9
0.4
Stud
ents
(Mill
ions
)
WHITE
Figure 4.4. Progression of Students Through the Grades, by Race/Ethnicity,School Years 2000-01 to 2020-21 (Projected)
2 3 4 5 6 7 8 9 10 11 12 Graduation0.4
0.9
1.4
1.9
2.4
G01 G02 G03 G04 G05 G06 G07 G08 G09 G10 G11 G12 GRAD
Stude
nt s
(Milli
ons)
400000
900000
1400000
1900000
2400000 HISPANIC
HISPANIC
BLACK
84%of 9th
graders
74%
66%
Notes: Earlier starting years shown as DARKER lines (e.g., 1st graders in 2000-01 to 2009-10. Later starting years shown as LIGHTER lines (e.g., 1st graders in 2010-11 to 2020-21). Each line represents the count of students beginning in Grade 1 and in each successive grade year-over-year, to Grade 12 and then graduate counts. Twenty years, i.e., starting “cohorts,” are shown for each race/ethnicity. American Indian/Alaska Native not included due to reasons of scale.
400000
900000
1400000
1900000
2400000 BLACK
December 2016 41
AT THE COLLEGE DOORKNOCKING CHAPTER 4. ENROLLMENT PROJECTIONS
a plateau. There are simply fewer youth overall, so progress must be made in moving more of them successfully through the grades.
There are limits to the conclusions that can be drawn from these data, however. WICHE does not have data for predefined cohorts of students tracked over time, such as what the states now uniformly report on.21 As noted earlier, although it is possible to observe the percentage of students in one grade compared to the number in the prior grade a year earlier, movement in and out of the grades over the course of a year can affect that number. This is certainly a bigger consideration at a school district level, but student movement in and out of state or between public and private schools, as well as other movements, can reduce or add to the number of students in a given year. For that reason, WICHE only looks at progression at the national level, where in- or out-migration is not likely to a primary factor. Another mitigating factor with these data is that WICHE uses data for all high school graduates (regular diploma recipients) in a given year, so the number could include graduates who were not 12th grade students in that year. And some students might not graduate in one year from the 12th grade, but might go on to graduate in a later year.
Figure 4.4 displays an approximate “cohort” (or count) of first graders in a start year and the number of children who progress to the next grade, year-over-year, until that same approximate cohort of first-graders would theoretically reach graduation approximately 11 years later. The rates of progression from one grade to the next are relatively similar in the earlier grades up through eighth grade, and then there is a noticeable uptick between the eighth and ninth grades. This is generally considered to be due to several factors that cannot be precisely quantified.22 Other data show relatively high rates of retention for ninth graders. The other factor is the movement between private and public schools at certain junctures. For example, there is a slight decrease in the number of private school eighth graders compared to private school ninth graders, suggesting that many private middle school students attend public high schools.
Figure 4.4 illustrates that, on average, about 84 percent of White public school ninth graders are counted in the cohort of public high school graduates four years later. The corresponding rate for Hispanic public high school students is 74 percent, and for Black public high school students it is 66 percent. It bears repeating that there are limitations to the conclusiveness of these data, but it is difficult to ignore the differences between the high school populations by race/ethnicity.23 On average, nationally, between 11 to 12 percent fewer non-White public school ninth graders appear to be making it to graduation compared to White public school ninth graders (non-White includes Black, Hispanic, American Indian/Alaska Native, and Asian/Pacific Islander).
Enrollment Projections SummaryA key message from the projections is that not only is the number of high school graduates declining, but also that the youth population is rapidly becoming majority non-White. The workforce of the 2030s will be determined over the course of the next 15 years by the youth who are entering school today. The data used in these projections indicate that fewer young adults will be entering the workforce overall over the next 15 years, and an increasing number of them will be individuals of color, but that there might be even more if differences in progression through the educational pipeline between populations were narrowed.
Projections of High School Graduates42
AT THE COLLEGE DOORKNOCKING CHAPTER 4. ENROLLMENT PROJECTIONS
Endnotes1 Population Reference Bureau, “World Population Data Sheet 2014: The Decline in U.S. Fertility,” December 2014, accessed October 6, 2016, www.prb.org/Publications/Datasheets/2014/2014-world-population-data-sheet/us-fertility-decline-factsheet.aspx; Gretchen Livingston, “Is U.S. fertility at an All-Time Low? It Depends,” Washington, D.C.: Pew Research Center, February 24, 2015, accessed October 6, 2016, www.pewresearch.org/fact-tank/2015/02/24/is-u-s-fertility-at-an-all-time-low-it-depends/.2 WICHE began reporting about the impending reduction in White high school graduates in the 1998 edition of Knocking at the College Door: Projections of High School Graduates by State and Race/Ethnicity 1996-2012. Other demographic centers report about Whites becoming the minority in the general population around 2050, but younger age groups becoming White non-majority in earlier years.3 Ibid, Population Reference Bureau.4 Births are categorized by the race/ethnicity of the mother. For simplicity, WICHE uses the mother’s race/ethnicity interchangeably with the infant’s race/ethnicity. However, some infants might be categorized differently in other data which capture the combined race/ethnicity of the mother and father. See Appendix C for more detail.5 The federal Common Core of Data data that WICHE uses for these projections do not encompass students in Bureau of Indian Education (BIE) schools. The data indicate that students enrolled in BIE and tribally-operated schools educate between 8 to 10 percent of all American Indian/Alaska Native youth, about 40,000 student within 183 schools in 23 states. In school year 2012-13, the states with the highest number of schools serving 70 percent of BIE-educated youth nationally, were Arizona, New Mexico, South Dakota, and North Dakota. Other states in which American Indian/Alaska Native individuals are most highly concentrated are Oklahoma, California, and Alaska, but it appears most of these students are included in the public schools data. WICHE was unable to obtain the necessary data to add these students to the projections. 6 Center for Public Education, “School Choice: What the Research Says,” National School Boards Association: Alexandria, VA, 2015, accessed March 30, 2016, www.centerforpubliceducation.org/schoolchoice. While still a relatively small percent of all enrollments, recent data suggest growth in the numbers of students enrolled with full-time virtual schools. These students should be reflected in the public total, but to the extent that these students experience different outcomes, they could have an effect on graduation counts that may differ from the overall trend among public school students. See for example Gary Miron, Charisse Gulosino and Brian Horvitz, “Virtual Schools in the U.S. 2014: Politics, Performance, Policy and Research Evidence,” Section III, Boulder, CO: National Education Policy Center, University of Colorado Boulder, 2014, accessed October 27, 2016, http://nepc.colorado.edu and National Center for Education Statistics, Common Core of Data, Data Tables, Virtual Schools, Counts and Enrollment, 2013-14, available online at https://nces.ed.gov/ccd/data_tables.asp.7 Jon Marcus, “The Demise of Private Schools,” The Atlantic, September 2, 2015, accessed October 31, 2016, www.theatlantic.com/education/archive/2015/09/parochial-schools-demise/403369/.8 WICHE would need grade-level enrollments disaggregated by traditional and charter school status. This level of detail is not available in the Common Core of Data state data files, let alone disaggregated by race/ethnicity.9 Grace Kena, Lauren Musu-Gillette, Jennifer Robinson, Xiaolei Wang, Amy Rathbun, Jijun Zhang, Sidney Wilkinson-Flicker, Amy Barmer, Erin Dunlop Velez, Thomas Nachazel, Allison Dziuba, Wyatt Smith, Victoria Nelson, Virginia Robles-Villalba, William Soo, and DeLicia Ballard, “The Condition of Education 2015,” Washington, D.C.: National Center for Education Statistics, 2015), Chapter 2, accessed October 15, 2016, http://nces.ed.gov/pubs2015/2015144.pdf.10 National Alliance for Public Charter Schools, “A Growing Movement: America’s Largest Charter School Communities,” December 2014, accessed October 27, 2016, www.publiccharters.org.11 Lauren Musu-Gillette, Jennifer Robinson, Joel McFarland, Angelina KewalRamani, Anlan Zhang, and Sidney Wilkinson-Flicker, "Status and Trends in the Education of Racial and Ethnic Groups 2016," Washington, D.C.: U.S. Department of Education, National Center for Education Statistics, 2016, accessed October 27, 2016, http://nces.ed.gov/.
12 National Center for Education Statistics, Homeschooling Fast Facts, accessed October 31, 2016, https://nces.ed.gov/fastfacts/display.asp?id=91; Stephanie Ewert, “The Decline in Private School Enrollment,” SEHSD Working Paper Number FY12-117 (Washington, D.C.: U.S. Census Bureau, 2013), accessed November 8, 2016, from https://www.census.gov/hhes/school/files/ewert_private_school_enrollment.pdf.13 The most easily accessible, state-level data found was Milton Gaither, “All the Available State Homeschooling Data, 2011,” February 6, 2012, accessed October 27, 2016, https://gaither.wordpress.com/2012/02/06/all-the-available-state-homeschooling-data-2011/. 14 Jeffrey S. Passel and D’Vera Cohn, “Overall Number of U.S. Unauthorized Immigrants Holds Steady Since 2009,” Pew Research Center, September 20, 2016, accessed October 26, 2016, www.pewhispanic.org/2016/09/20/overall-number-of-u-s-unauthorized-immigrants-holds-steady-since-2009/.15 Pew Research Center, “Modern Immigration Wave Brings 59 Million to U.S., Driving Population Growth and Change Through 2065: Views of Immigration’s Impact on U.S. Society Mixed,” Washington, D.C.: September, 2015, accessed October 27, 2016, www.pewhispanic.org/files/2015/09/2015-09-28_modern-immigration-wave_REPORT.pdf.16 Ann Brown and Renee Stepler, “Statistical Portrait of the Foreign-Born Population in the United States,” Pew Research Center, April 19, 2016, accessed October 15, 2016, www.pewhispanic.org/2016/04/19/statistical-portrait-of-the-foreign-born-population-in-the-united-states-trends/. 17 Ibid, Population Reference Bureau.18 Ibid, Brown, 2016.19 Ibid, Cohn and Passel, and Miriam Jordan, “Mexican Immigration to U.S. Reverses,” Wall Street Journal, November 19, 2015, accessed October 15, 2016, www.wsj.com/articles/mexican-immigration-to-u-s-reverses-1447954334.20 Ibid, Pew Research Center, 2015.21 That is, the “adjusted cohort graduation rate” (ACGR), the percent of ninth graders who graduate from high school four years later, adjusted for movement in and out of the cohort such as relocation, school change, or death.22 Ibid, Western Interstate Commission for Higher Education, “Knocking at the College Door Methodology Review,” accessed October 24, 2016, www.wiche.edu/pub/knocking-methodology-review.23 See Appendix C for more information about official published cohort graduation rates.

December 2016 43
AT THE COLLEGE DOORKNOCKING CHAPTER 5. IMPLICATIONS
CHAPTER 5. IMPLICATIONS
The projections presented in this edition of Knocking at the College Door tell a different story from years past. After about 15 years of steady increases between 1996 and 2013, the total number of high school graduates is projected to reach a plateau. No longer will state and postsecondary institutional leaders be able to count on a steadily increasing stream of high school graduates knocking at their door. And, beyond 2026, U.S. colleges can expect an overall decline in the number of high school graduates. As discussed at length in Chapter 3, the national numbers certainly mask regional and state variation. Specifically, there will be growth in the South and West and continued declines in the Midwest and Northeast. Underlying these trends is increasing diversification of the high school graduating classes fueled in part by declines in the numbers of White students. If one thinks about these changing demographics in the context of the education pipeline, the policy and practice implications are varied and potentially impactful.
Policy Questions and ImplicationsA variety of public policy questions and implications arise from an examination of these data; how the policy issues are framed depends on one’s perspective. For instance, a state legislator from a state with projected declines in high school graduates will likely see a policy challenge to solve and a solution that involves identifying ways to fill seats on college campuses. A state legislator from a state with projected increases, on the other hand, has the exact opposite challenge in mind. How will the state deal with too much demand and not enough capacity to serve its students, particularly when the available resources are limited? Another example might be an enrollment manager at a college campus with moderately selective admissions in a state with projected declines in enrollments. In order to build a freshmen class that will succeed at her institution, she will have to decide which students to recruit and from where. These are just a few on-the-ground examples of the immediate issues that arise when considering the effects of the projected demographic changes.
200
210
220
230
240
250
260
270
280
290
300
1990 1992 1996 2000 2003 2005 2007 2009 2011 2013 20151992
300
280
260
240
220
200
277
H I S PA N I C
WHITE
BLACK249
237
Figure 5.1. National Assessment of Educational Progress Scores in Math for 8th Graders, 1992-2015
1996 2000 2003 2005 2007 2009 2011 2013 2015
292
270
260
Note: Black includes African American, Hispanic includes Latino, and Pacific Islander includes Native Hawai‘ian. Race categories exclude Hispanic origin. Prior to 2011, students in the "two or more races" category were categorized as "unclassified." The NAEP Mathematics scale ranges from 0 to 500. Some apparent differences between estimates may not be statistically significant. Source: U.S. Department of Education, Institute of Education Sciences, National Center for Education Statistics, National Assessment of Educational Progress (NAEP), 1990, 1992, 1996, 2000, 2003, 2005, 2007, 2009, 2011, 2013, and 2015 Mathematics Assessments.

Projections of High School Graduates44
AT THE COLLEGE DOORKNOCKING CHAPTER 5. IMPLICATIONS
But there are also long-term considerations related to the entire educational pathway as well.
Achievement Gap in K-12When people speak about the achievement gap in K-12 education, they are generally referring to the variations in academic performance between different populations of students. In the United States, the differences are revealed most starkly by race/ethnicity. For example, Whites consistently outperform students of color in both math and reading among eighth graders (see Figures 5.1 and 5.2).1 And although some progress has been made to close the achievement gaps between students of color and White students that have been prevalent since the 1970s, disparities remain.2
The Knocking at the College Door projections of high school graduates as well as high school enrollments suggest a diversification of student populations, with fewer White students and increasing numbers of non-White students. Despite some progress in efforts to close the achievement gaps between these groups of students, if these trends continue the outlook for overall student performance may be in question.
Recent state policy changes, such as the implemen-tation of the Common Core State Standards (CCSS), are intended to have a positive impact on the academic performance of all students. However, the CCSS has been a politically charged issue that has created, and will continue to create, challenges for assessing the true impact of this major policy change on student academic performance overall, as well as identifying whether they have been effective for all students and not just those who have historically performed well academically. The first CCSS-aligned examinations were given in Spring 2015; however, the decision by states to adopt various tests has induced variability that complicates the evaluation even further. For example, some states have adopted the Smarter Balanced Assessment while others have joined the Partnership for Assessment of Readiness for College and Careers (PARCC). Some states have aligned with ACT or The College Board or developed their own assessment. This variation makes comparison across states challenging at best. Over time, an examination of other indicators such as the National Assessment of Educational Progress (NAEP) can help to assess the impact of these new standards on student academic performance, specifically with respect to certain subpopulations.
200
210
220
230
240
250
260
270
280
290
300
1992 1994 1998 2002 2003 2005 2007 2009 2011 2013 2015
White
Black
Hispanic
1992
300
280
260
240
220
200
267
H I S PA N I C
WHITE
BLACK241
237
Figure 5.2. National Assessment of Educational Progress Scores in Reading for 8th Graders, 1992-2015
1994 1998 2002 2003 2005 2007 2009 2011 2013 2015
274
253
248
Note: Black includes African American, Hispanic includes Latino, and Pacific Islander includes Native Hawai‘ian. Race categories exclude Hispanic origin. Prior to 2011, students in the "two or more races" category were categorized as "unclassified." The NAEP Mathematics scale ranges from 0 to 500. Some apparent differences between estimates may not be statistically significant. Source: U.S. Department of Education, Institute of Education Sciences, National Center for Education Statistics, National Assessment of Educational Progress (NAEP), 1990, 1992, 1996, 2000, 2003, 2005, 2007, 2009, 2011, 2013 and 2015 Mathematics Assessments.

December 2016 45
AT THE COLLEGE DOORKNOCKING CHAPTER 5. IMPLICATIONS
Adoption and implementation of the standards on their own, however, will not lead to improvements. It is what happens on the ground that will impact students the most. The policy and practice decisions that district and school administrators make, as well as the support they give to the teachers who interact with the students every day, are critical to the success of the standards. The amount of actionable data that are now available about these standards and assessments is unprecedented. If educators can develop the skills necessary to understand and use the data from the assessments – and if schools and districts can provide them with the support they need to develop those skills – they will be better able to make informed decisions about how to more effectively support their students.
There are myriad policy efforts around the country that are designed to close the achievement gaps in K-12 education, and they are not all focused solely on the academic aspects of a child’s life. Many of the children in student populations that perform less well than the average are also from low-income backgrounds, and comprehensive efforts aimed at supporting those children are underway in many areas. Stakeholders should consider undertaking additional evaluations of the impact that those policies and programs are having and the ways they interact with the academic initiatives, as well as consider ways of scaling them up in a concerted effort.
Reaching the GoalsIn the past decade, various entities have established postsecondary attainment goals designed to spur policymakers and higher education leaders to action. In an address to a Joint Session of Congress in 2009, President Barack Obama established a national postsecondary attainment goal whereby the nation would achieve the highest proportion of college graduates in the world by 2020.3 Lumina Foundation has been working toward Goal 2025, which aims to have 60 percent of Americans holding degrees, certificates, or other high-quality postsecondary credentials by 2025.4 Likewise, as of September 2016, governors, legislatures, or college or university systems in at least 29 states had set postsecondary attainment goals for their students.5 When these goals
are developed in ways that lead to policymakers and stakeholders believing that they are legitimate and worthwhile, then policymakers and stakeholders will work toward them. When designed well, these goals also provide a common purpose by which people at all levels can make decisions. For instance, in November 2013, the Washington Student Achievement Council (WASC), that was subsequently adopted by the Washington State Legislature, adopted the 2013 Roadmap report that set two aggressive state educational attainment goals to be achieved by 2023:
ff All adults in Washington, ages 25-44, will have a high school diploma or equivalent.
ff At least 70 percent of Washington adults, ages 25-44, will have a postsecondary credential.6
To accomplish these goals, WSAC identified strategies focused on three primary objectives: ensuring access, ensuring learning, and preparing for future challenges.7 WSAC adopted an update to the 2013 Roadmap in December 2015.8 The 2015 Update, which was the first progress report since the initial adoption, showed progress on three key measures: high school completion, postsecondary enrollment, and postsecondary completion.9 Although the state is only just beginning to monitor progress toward its goals, the Roadmap has defined how the state views and advances its higher education agenda. For instance, Washington is now preparing to release its 2017-19 strategic plan to advance educational attainment, and cites Knocking at the College Door data that show increasing diversification in the state of Washington. Importantly, the plan highlights the need to serve underrepresented students if the state is to meet its established goals in the near future.10
In addition to the projected plateau in the number of high school graduates, the United States has been facing steadily declining enrollments in all sectors for students over the age of 24.11 This creates additional challenges; with fewer students in the traditional pipeline and fewer adults returning to postsecondary education recently, policymakers who want to reach the national and state postsecondary attainment goals will need to consider how to more effectively serve populations that have not been served well

Projections of High School Graduates46
AT THE COLLEGE DOORKNOCKING CHAPTER 5. IMPLICATIONS
historically.12 To begin, they need to use data to evaluate the impact of policies, particularly when resources are limited. Then, as they identify effective policies, they must invest in scaling up those that work.
Postsecondary institutions also feel the combined effects of the projected plateau in the number of traditional-age students in the pipeline and a decline in adult student enrollments. While there is variation at the regional and state levels, overall such an environment can create increased competition for students within and across state borders, forcing enrollment managers and others not just to find new ways to recruit students, but also to identify new categories of students to recruit in the first place.
Attainment Gap in Postsecondary EducationState postsecondary attainment goals are often set by looking at data that indicate projected employment needs, which is a key consideration for governors, state legislators, and others who are interested in creating and maintaining a robust economy with a skilled workforce. Far fewer states, however, have explicitly included in their goals any language about closing attainment gaps for underserved students despite data that clearly show changes in demographics around the nation. The achievement gaps seen in K-12 education are also reflected in postsecondary education; Asian and White students have higher postsecondary attainment levels than Black, American Indian/Alaska Native, and Hispanic adults (see Figure 5.3).
Colorado is an example of a state that is taking the lead in focusing its attention on closing its attainment gap. State policymakers have recognized that despite overall high postsecondary education attainment levels, certain troubling trends persist. Students of color enroll in college at lower rates than White students, they do not perform as well, and they graduate at lower rates. In response, and with the support of Governor John Hickenlooper, the Colorado Department of Higher Education (CDHE) has set as its primary strategic policy initiative closing the attainment gap by half by 2025. For the past year, CDHE has been establishing strategies, setting targets, and monitoring progress toward this goal. This specific attention to the state’s attainment gap is the guide by
which the department does much of its work and that helps staff stay on target.
Going forward, particularly in light of these projections suggesting rapid diversification in the traditional-education pipeline, those states that are serious about reaching their attainment goals will soon likely need to consider establishing a set of related goals that address attainment gaps. Without specific attention paid to this issue, states are not likely to prioritize it even when the data may clearly show unprecedented changes in demographics at their doorstep.
Connections to the WorkforceFinally, the gaps that persist in K-12 and in higher education will ultimately manifest in the workforce. Data show that 65 percent of jobs will require some sort of training beyond high school by 2020.13 Until American Indian/Alaska Native, Hispanic, and Black students are achieving the same levels of degree attainment that Asian and White students are, they will not be able to fully participate in and benefit from the expanding global economy.
As an example, students of color have fallen behind particularly in STEM (science, technology, engineering, and mathematics) occupations.14 While underserved students (including African American, American Indian/
Figure 5.3. Postsecondary Educational Attainment Level, Associate’s Degree and Above, by Race/Ethnicity, Adults aged 25-64 (2014)70%
60%
50%
40%
30%
20%
10%
0%Asian/Pacific
Islander
White Black American Indian/AlaskaNative
Hispanic
61%
45%
21%24%
29%
Source: U.S. Census Bureau, 2012, 2013, and 2014 American Community Survey One-Year PUMS Files.

December 2016 47
AT THE COLLEGE DOORKNOCKING CHAPTER 5. IMPLICATIONS
Alaska Native, Hispanic/Latino, or Native Hawaiian/other Pacific Islander; low-income; or first generation in college) make up a large portion of potential STEM students, they are far less prepared for success in STEM coursework in college as measured by the ACT College Readiness Benchmark in science.15 While this is not to suggest that all students need to pursue STEM degrees in order to succeed in the workforce, careers in STEM fields are often higher paying, are increasingly in demand, and are connected to the country’s economic competitiveness and innovation.16
Another example that affects students throughout the education pipeline is the diversity of the educator workforce. Despite evidence suggesting that racial diversity among teachers can benefit students, 82 percent of public school teachers in the 2011-12 school year identified as White, a figure that has not changed much in the past 15 years.17 The racial/ethnic composition of the leadership at schools looks much the same. In the 2011-12 school year, about 80 percent of public school principals were White, compared to only 10 percent who were Black, and 7 percent who were Hispanic.18 Yet, the racial/ethnic composition of the students they serve has shifted. The projections presented in this edition of Knocking at the College Door confirm this diversification will continue and amplify into the future. As discussed in Chapter 2, the projected increases in the number of non-White public high school graduates could replace the decline in the number of White high school graduates (public and private combined) almost one-to-one in a number of years.
As the composition of high school graduating classes becomes more diverse, targeted policy efforts designed to increase success among non-White student populations will be necessary to maintain the levels of postsecondary education attainment that the U.S. has historically experienced, not to mention the economic standard of living that is underpinned by high levels of educational attainment. Not only will the number of White students – who have historically performed better – simply not be in the pipeline as they have been at previous points, there is a societal obligation as well as an economic imperative to serve all of the youth of this country so they can succeed in school and in the workforce.
Implications SummaryIn the context of the changing demographics presented in Knocking at the College Door, policymakers and stakeholders have some important policy decisions to make. As education professionals, policy leaders, researchers, community leaders, or parents, we can choose to focus on the challenges or view this as an opportunity. The education landscape looked very different 40 years ago than it does today, and it will look very different 40 years from now. How we want our education system, our society, and country to look is up to us. WICHE encourages everyone with a stake in education to take these data as they are presented here and use them in ways that make our schools, districts, universities, colleges, states, and country places with more high-quality educational opportunities for all students.

Projections of High School Graduates48
AT THE COLLEGE DOORKNOCKING CHAPTER 5. IMPLICATIONS
Endnotes1 National Center for Education Statistics, “NAEP Data Explorer,” accessed October 27, 2016, http://nces.ed.gov/nationsreportcard/naepdata/.2 National Center for Education Statistics, “The Nation’s Report Card,” , accessed October 27, 2016, http://nces.ed.gov/nationsreportcard/.3 Martha Kanter PowerPoint Presentation, “Winning the Future,” accessed October 27, 2016, www.ed.gov/sites/default/files/winning-the-future.ppt.4 Lumina Foundation, “Goal 2025,” accessed October 27, 2016, https://www.luminafoundation.org/goal_2025.5 Strategy Labs, “States with Higher Education Attainment Goals,” September 16, 2016, accessed October 27, 2016, http://strategylabs.luminafoundation.org/wp-content/uploads/2013/10/State-Attainment-Goals.pdf.6 Washington Student Achievement Council, “The Roadmap,” accessed on October 22, 2016, http://www.wsac.wa.gov/the-roadmap.7 Ibid.8 Washington Student Achievement Council, “2015 Roadmap Update,” accessed on October 22, 2016, http://www.wsac.wa.gov/2015-roadmap-update.9 Ibid.10 Washington Student Achievement Council Power PowerPoint Presentation, “2017-19 Strategic Plan to Advance Educational Attainment,” accessed November 3, 2016, http://wsac.wa.gov/sites/default/files/2016.10.12.05.Strategic.Action.Plan.pdf.11 National Student Clearinghouse Research Center, “Current Term Enrollment Estimates, Spring 2016,” accessed October 25, 2016, https://nscresearchcenter.org/currenttermenrollmentestimate-spring2016/.12 Lumina Foundation, "Stronger Nation," Indianapolis: Lumina Foundation, 2016, accessed October 15, 2016, www.luminafoundation.org/stronger_nation2016.13 Anthony P. Carnevale, Nicole Smith, and Jeff Strohl, “Recovery: Job Growth and Education Requirements through 2020,” Washington, D.C.: Georgetown Center on Education and the Workforce, 2014, accessed October 27, 2016, https://cew.georgetown.edu/wp-content/uploads/2014/11/Recovery2020.FR_.Web_.pdf. 14 ACT, “Understanding the Underserved Learner: The Condition of STEM 2014,” accessed October 25, 2016, http://www.act.org/content/dam/act/unsecured/documents/STEM-Underserved-Learner.pdf.15 Ibid.16 Anthony P. Carnevale, Nicole Smith, and Michelle Melton, “STEM: Science, Technology, Engineering, Mathematics,” Washington, D.C.: Georgetown Center on Education and the Workforce, 2014, accessed October 27, 2016, https://cew.georgetown.edu/wp-content/uploads/2014/11/stem-complete.pdf.17 John B. King, Jr., Amy McIntosh, and Jennifer Bell-Ellwanger, “The State of Racial Diversity in the Educator Workforce,” Washington, D.C.: U.S. Department of Education, 2016, accessed November 1, 2016, http://www2.ed.gov/rschstat/eval/highered/racial-diversity/state-racial-diversity-workforce.pdf.18 Ibid.

AT THE COLLEGE DOORKNOCKING AT THE COLLEGE DOORKNOCKING
APPENDIX A
HIGH SCHOOL GRADUATE DATA TABLES

AT THE COLLEGE DOORKNOCKING APPENDIX A . HIGH SCHOOL GRADUATE DATA TABLES
Projections of High School Graduates50

Notes: School Year refers to the K-12 calendar running fall to spring and may include graduates from any point in that school year, including the summer after the year end. The Grand Total is the sum of the Private Schools and Public Schools totals. The Private Schools Total includes schools not supported primarily by public funds, religious and nonsectarian, but not including homeschool students. Private Schools projections begin in school year 2011-12. The Public Schools Total will not exactly equal the sum of the races/ethnicities columns, which are projected separately. Prior to 2010-11, data were not available separately for Asian and Pacific Islander students, and Two or More Races students. Hawai‘ian/Pacific Islander and Two or More Races counts are displayed separately in the years they were reported for informational purposes, but are included in the race categories in the projected years. For more detailed information, see Appendix C: Technical Information and Methodology at www.wiche.edu/knocking.Source: Western Interstate Commission for Higher Education, Knocking at the College Door: Projections of High School Graduates, 2016.
American Asian/Pacific White Black Indian/ Islander AlaskaNative (combined)
Hispanic Non-HispanicPUBLIC
SCHOOLSTOTAL
PRIVATESCHOOLS
TOTALGRANDTOTAL
Hawai‘ian/Pacific
Islander
Two or More Races
School Year Alone, or Any Race
Available Data for Additional
Race Categories
Repo
rted
Cou
nts
of H
igh
Scho
ol G
radu
ates
Proj
ectio
ns o
f Hig
h Sc
hool
Gra
duat
es
2000-01
2001-02
2002-03
2003-04
2004-05
2005-06
2006-07
2007-08
2008-09
2009-10
2010-11
2011-12
2012-13
2013-14
2014-15
2015-16
2016-17
2017-18
2018-19
2019-20
2020-21
2021-22
2022-23
2023-24
2024-25
2025-26
2026-27
2027-28
2028-29
2029-30
2030-31
2031-32
AT THE COLLEGE DOORKNOCKING APPENDIX A . HIGH SCHOOL GRADUATE DATA TABLES
2,600,000
2,800,000
3,000,000
3,200,000
3,400,000
3,600,000
3,800,000
2,850,006 280,806 2,569,200 296,776 1,782,495 336,176 26,138 126,852
2,910,675 289,141 2,621,534 314,122 1,800,226 345,430 26,901 132,043
3,019,234 299,287 2,719,947 338,416 1,855,842 358,387 27,391 135,096
3,059,930 300,041 2,759,889 359,401 1,856,119 371,972 28,331 137,812
3,095,418 296,168 2,799,250 380,736 1,851,095 384,728 30,456 142,555
3,115,511 302,099 2,813,412 387,257 1,852,128 391,122 29,185 150,747
3,196,104 303,059 2,893,045 404,958 1,871,929 408,750 30,598 153,826
3,315,437 314,100 3,001,337 449,346 1,902,881 431,944 32,062 159,646
3,347,948 308,933 3,039,015 481,698 1,889,673 452,820 32,357 167,392 3,283 8,367
3,440,691 312,669 3,128,022 545,518 1,884,694 475,306 34,352 168,951 3,480 17,091
3,446,268 302,168 3,144,100 583,907 1,873,458 480,976 33,444 172,300 9,979 51,751
3,452,793 303,608 3,149,185 608,726 1,850,484 478,929 33,224 177,804 10,237 58,704
3,466,888 297,631 3,169,257 640,413 1,838,951 474,247 31,947 183,686 10,313 65,570
3,443,012 290,743 3,152,269 654,254 1,807,917 466,231 30,877 184,913
3,421,456 286,430 3,135,026 672,840 1,776,322 464,405 30,099 185,255
3,412,947 274,087 3,138,860 691,661 1,773,222 459,572 30,167 183,077
3,385,917 267,024 3,118,893 698,626 1,757,322 450,543 29,300 183,383
3,459,580 261,547 3,198,033 739,495 1,769,885 465,040 29,050 196,796
3,455,113 252,085 3,203,028 767,254 1,754,284 461,072 28,139 196,622
3,408,037 241,888 3,166,150 777,906 1,720,563 450,629 27,458 198,353
3,420,211 235,248 3,184,963 800,815 1,724,512 441,955 26,662 206,196
3,423,639 227,771 3,195,867 822,484 1,719,195 438,763 26,268 209,399
3,434,723 218,201 3,216,522 856,276 1,704,187 445,157 25,878 208,632
3,511,409 240,900 3,270,509 894,471 1,711,952 457,765 25,711 207,925
3,561,051 243,739 3,317,313 917,776 1,724,972 471,323 25,399 209,494
3,518,463 237,470 3,280,993 902,729 1,690,414 472,457 26,744 220,736
3,420,010 229,347 3,190,662 865,793 1,648,372 460,941 26,106 219,501
3,308,160 221,753 3,086,407 818,084 1,609,589 445,577 24,817 214,918
3,267,826 220,750 3,047,076 794,047 1,584,150 434,638 23,785 215,234
3,268,233 220,689 3,047,544 785,378 1,575,820 436,117 23,618 230,599
3,252,714 219,170 3,033,544 779,977 1,572,108 436,682 23,481 226,830
3,298,597 222,087 3,076,509 791,157 1,586,896 440,374 22,860 241,214
U N I T E D S TAT E S
2011-12 2021-22 2031-32
3, 298,597
PublicPublic & Private
• 3,409,100 high school graduates, on average, projected per year between school years 2011-12 and 2031-32.
• The total number of graduates is projected to increase by 3.1% between 2011-12 and 2024-25, the next highest year for the United States.
3.8M
2.6M
3,452,793
December 2016 51
3,561,051

Notes: See Figure 3.1. Regional Divisions of the U.S. on page 19 for the states covered by this region. School Year refers to the K-12 calendar running fall to spring and may include graduates from any point in that school year, including the summer after the year end. The Grand Total is the sum of the Private Schools and Public Schools totals. The Private Schools Total includes schools not supported primarily by public funds, religious and nonsectar-ian, but not including homeschool students. Private Schools projections begin in school year 2011-12. The Public Schools Total will not exactly equal the sum of the races/ethnicities columns, which are projected separately. Prior to 2010-11, data were not available separately for Asian and Pacific Islander students, and Two or More Races students. Hawai‘ian/Pacific Islander and Two or More Races counts are displayed separately in the years they were reported for informational purposes, but are included in the race categories in the projected years. For more detailed information, see Appendix C: Technical Information and Methodology at www.wiche.edu/knocking.Source: Western Interstate Commission for Higher Education, Knocking at the College Door: Projections of High School Graduates, 2016.
American Asian/Pacific White Black Indian/ Islander AlaskaNative (combined)
Hispanic Non-HispanicPUBLIC
SCHOOLSTOTAL
PRIVATESCHOOLS
TOTALGRANDTOTAL
Hawai‘ian/Pacific
Islander
Two or More Races
School Year Alone, or Any Race
Available Data for Additional
Race Categories
Repo
rted
Cou
nts
of H
igh
Scho
ol G
radu
ates
Proj
ectio
ns o
f Hig
h Sc
hool
Gra
duat
es
2000-01
2001-02
2002-03
2003-04
2004-05
2005-06
2006-07
2007-08
2008-09
2009-10
2010-11
2011-12
2012-13
2013-14
2014-15
2015-16
2016-17
2017-18
2018-19
2019-20
2020-21
2021-22
2022-23
2023-24
2024-25
2025-26
2026-27
2027-28
2028-29
2029-30
2030-31
2031-32
AT THE COLLEGE DOORKNOCKING APPENDIX A . HIGH SCHOOL GRADUATE DATA TABLES
700,000
750,000
800,000
850,000
900,000
666,730 49,305 617,425 140,674 366,298 31,432 12,962 65,852
685,038 50,356 634,682 147,744 370,654 32,708 13,309 68,193
707,835 51,685 656,150 157,539 378,121 34,962 13,385 68,779
710,628 52,957 657,671 164,741 370,405 35,537 13,567 69,382
736,341 54,471 681,870 177,644 374,277 37,770 14,964 71,614
719,433 55,499 663,934 173,234 365,549 36,514 13,959 74,640
737,622 55,557 682,065 179,001 365,583 37,582 14,648 75,257
769,867 58,231 711,636 199,281 370,347 38,657 15,533 77,809
772,322 56,731 715,591 209,276 368,771 39,667 15,364 83,405 2,945 7,157
813,358 58,033 755,325 241,390 368,424 42,942 16,150 82,564 2,797 11,637
820,323 55,623 764,700 258,613 365,254 42,598 15,246 82,989 7,700 16,814
827,781 55,635 772,146 270,898 358,073 43,189 15,315 84,670 7,900 18,825
830,996 54,429 776,567 278,499 355,506 42,235 14,403 85,923 7,834 20,510
831,548 52,304 779,244 283,687 352,391 41,089 14,186 84,274
819,994 51,649 768,345 285,524 343,343 39,514 13,597 82,433
816,451 49,894 766,558 289,233 341,312 38,581 13,516 80,080
808,871 48,557 760,314 287,767 338,621 37,313 13,226 79,468
825,595 47,488 778,106 300,962 339,243 37,287 13,052 83,407
824,370 45,897 778,473 306,284 336,652 36,502 12,753 81,399
819,514 44,242 775,273 308,743 332,949 35,278 12,578 80,757
830,692 43,339 787,353 314,761 337,870 34,844 12,289 82,913
833,075 41,992 791,082 320,171 337,350 34,025 12,368 82,520
840,180 40,180 800,000 331,258 336,696 33,894 12,239 81,096
862,031 45,013 817,018 343,887 343,071 34,217 12,168 78,679
855,852 45,522 810,331 340,895 342,711 33,601 12,079 76,078
857,361 44,282 813,078 337,900 339,056 36,036 12,660 83,107
824,051 42,186 781,865 317,929 329,914 35,445 12,292 81,572
795,663 40,735 754,928 300,465 324,455 34,675 11,555 78,580
782,761 40,479 742,283 289,863 316,325 33,638 11,263 76,609
785,135 40,643 744,492 285,013 314,439 33,581 11,215 82,838
777,687 40,104 737,583 280,133 314,669 33,992 11,060 82,839
789,092 40,644 748,448 280,850 317,547 34,332 10,588 88,793
W E S T
2011-12 2021-22 2031-32
789,092
PublicPublic & Private
• 820,900 high school graduates, on average, projected per year between school years 2011-12 and 2031-32.
• The total number of graduates is projected to increase by 4.1% between 2011-12 and 2023-24, the next highest year for the West.
900K
700K
827,781
Projections of High School Graduates52
862,031
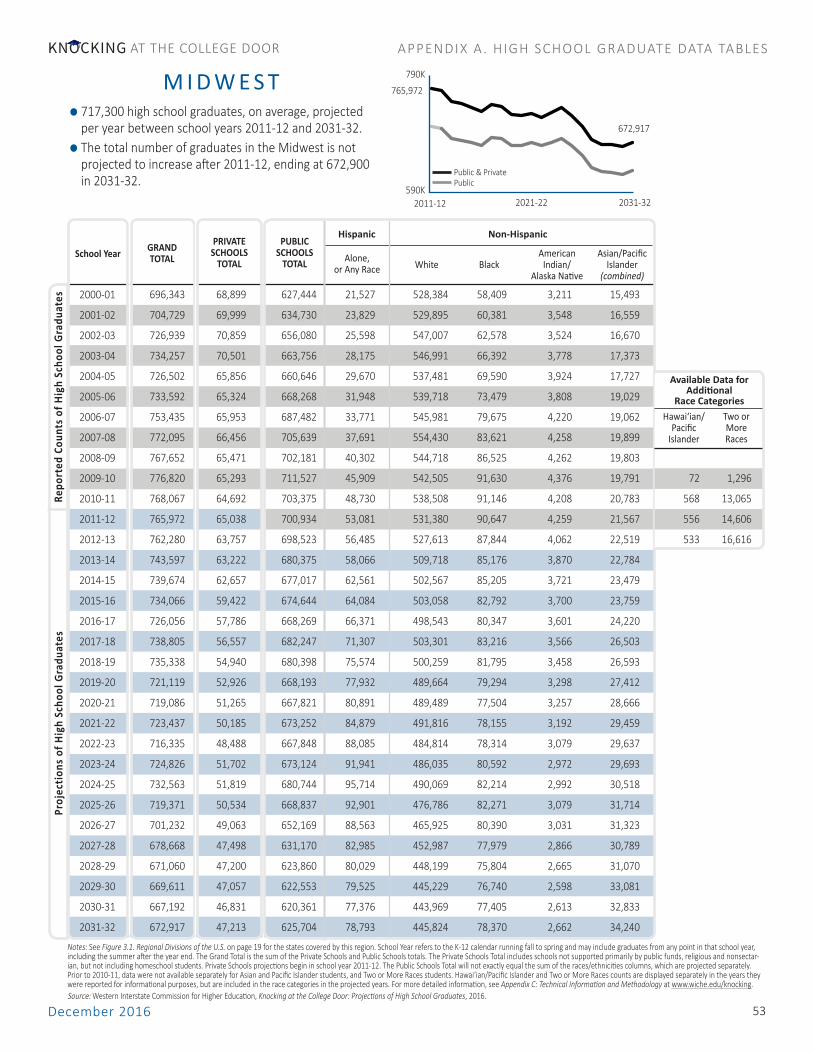
Notes: See Figure 3.1. Regional Divisions of the U.S. on page 19 for the states covered by this region. School Year refers to the K-12 calendar running fall to spring and may include graduates from any point in that school year, including the summer after the year end. The Grand Total is the sum of the Private Schools and Public Schools totals. The Private Schools Total includes schools not supported primarily by public funds, religious and nonsectar-ian, but not including homeschool students. Private Schools projections begin in school year 2011-12. The Public Schools Total will not exactly equal the sum of the races/ethnicities columns, which are projected separately. Prior to 2010-11, data were not available separately for Asian and Pacific Islander students, and Two or More Races students. Hawai‘ian/Pacific Islander and Two or More Races counts are displayed separately in the years they were reported for informational purposes, but are included in the race categories in the projected years. For more detailed information, see Appendix C: Technical Information and Methodology at www.wiche.edu/knocking.Source: Western Interstate Commission for Higher Education, Knocking at the College Door: Projections of High School Graduates, 2016.
American Asian/Pacific White Black Indian/ Islander AlaskaNative (combined)
Hispanic Non-HispanicPUBLIC
SCHOOLSTOTAL
PRIVATESCHOOLS
TOTALGRANDTOTAL
Hawai‘ian/Pacific
Islander
Two or More Races
School Year Alone, or Any Race
Available Data for Additional
Race Categories
Repo
rted
Cou
nts
of H
igh
Scho
ol G
radu
ates
Proj
ectio
ns o
f Hig
h Sc
hool
Gra
duat
es
2000-01
2001-02
2002-03
2003-04
2004-05
2005-06
2006-07
2007-08
2008-09
2009-10
2010-11
2011-12
2012-13
2013-14
2014-15
2015-16
2016-17
2017-18
2018-19
2019-20
2020-21
2021-22
2022-23
2023-24
2024-25
2025-26
2026-27
2027-28
2028-29
2029-30
2030-31
2031-32
AT THE COLLEGE DOORKNOCKING APPENDIX A . HIGH SCHOOL GRADUATE DATA TABLES
590,000
640,000
690,000
740,000
790,000
696,343 68,899 627,444 21,527 528,384 58,409 3,211 15,493
704,729 69,999 634,730 23,829 529,895 60,381 3,548 16,559
726,939 70,859 656,080 25,598 547,007 62,578 3,524 16,670
734,257 70,501 663,756 28,175 546,991 66,392 3,778 17,373
726,502 65,856 660,646 29,670 537,481 69,590 3,924 17,727
733,592 65,324 668,268 31,948 539,718 73,479 3,808 19,029
753,435 65,953 687,482 33,771 545,981 79,675 4,220 19,062
772,095 66,456 705,639 37,691 554,430 83,621 4,258 19,899
767,652 65,471 702,181 40,302 544,718 86,525 4,262 19,803
776,820 65,293 711,527 45,909 542,505 91,630 4,376 19,791 72 1,296
768,067 64,692 703,375 48,730 538,508 91,146 4,208 20,783 568 13,065
765,972 65,038 700,934 53,081 531,380 90,647 4,259 21,567 556 14,606
762,280 63,757 698,523 56,485 527,613 87,844 4,062 22,519 533 16,616
743,597 63,222 680,375 58,066 509,718 85,176 3,870 22,784
739,674 62,657 677,017 62,561 502,567 85,205 3,721 23,479
734,066 59,422 674,644 64,084 503,058 82,792 3,700 23,759
726,056 57,786 668,269 66,371 498,543 80,347 3,601 24,220
738,805 56,557 682,247 71,307 503,301 83,216 3,566 26,503
735,338 54,940 680,398 75,574 500,259 81,795 3,458 26,593
721,119 52,926 668,193 77,932 489,664 79,294 3,298 27,412
719,086 51,265 667,821 80,891 489,489 77,504 3,257 28,666
723,437 50,185 673,252 84,879 491,816 78,155 3,192 29,459
716,335 48,488 667,848 88,085 484,814 78,314 3,079 29,637
724,826 51,702 673,124 91,941 486,035 80,592 2,972 29,693
732,563 51,819 680,744 95,714 490,069 82,214 2,992 30,518
719,371 50,534 668,837 92,901 476,786 82,271 3,079 31,714
701,232 49,063 652,169 88,563 465,925 80,390 3,031 31,323
678,668 47,498 631,170 82,985 452,987 77,979 2,866 30,789
671,060 47,200 623,860 80,029 448,199 75,804 2,665 31,070
669,611 47,057 622,553 79,525 445,229 76,740 2,598 33,081
667,192 46,831 620,361 77,376 443,969 77,405 2,613 32,833
672,917 47,213 625,704 78,793 445,824 78,370 2,662 34,240
M I D W E S T
2011-12 2021-22 2031-32
672,917
PublicPublic & Private
• 717,300 high school graduates, on average, projected per year between school years 2011-12 and 2031-32.
• The total number of graduates in the Midwest is not projected to increase after 2011-12, ending at 672,900 in 2031-32.
790K
590K
765,972
December 2016 53
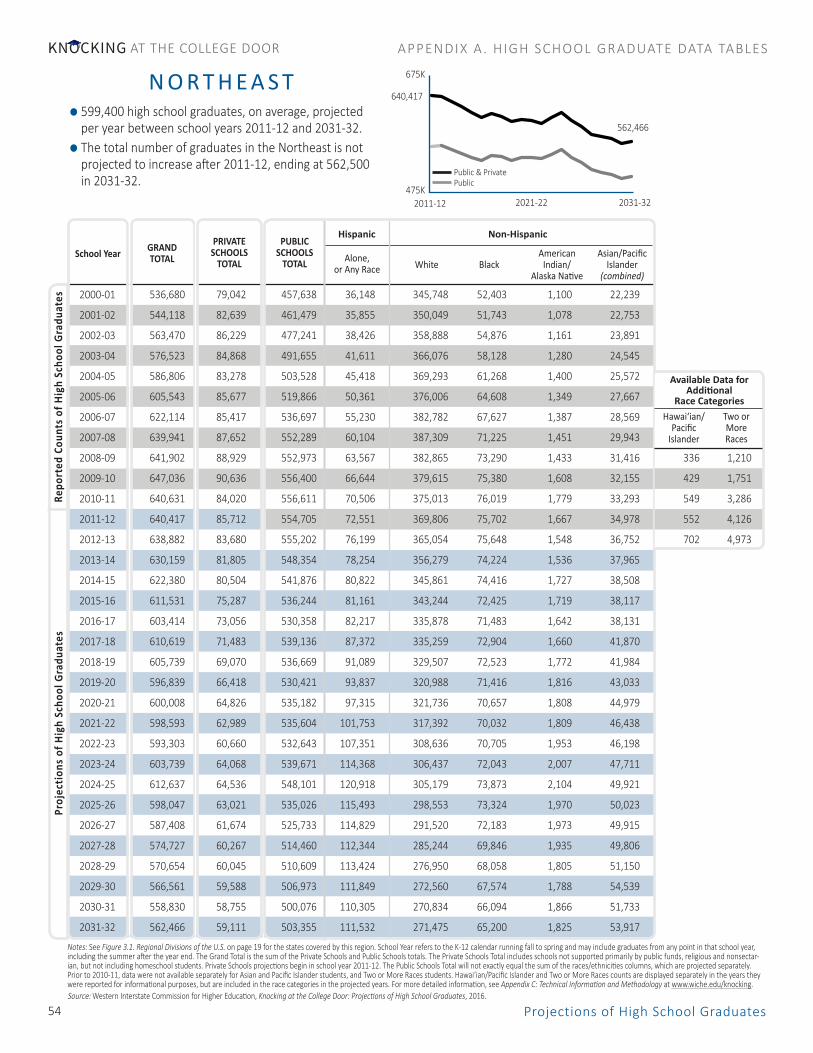
Notes: See Figure 3.1. Regional Divisions of the U.S. on page 19 for the states covered by this region. School Year refers to the K-12 calendar running fall to spring and may include graduates from any point in that school year, including the summer after the year end. The Grand Total is the sum of the Private Schools and Public Schools totals. The Private Schools Total includes schools not supported primarily by public funds, religious and nonsectar-ian, but not including homeschool students. Private Schools projections begin in school year 2011-12. The Public Schools Total will not exactly equal the sum of the races/ethnicities columns, which are projected separately. Prior to 2010-11, data were not available separately for Asian and Pacific Islander students, and Two or More Races students. Hawai‘ian/Pacific Islander and Two or More Races counts are displayed separately in the years they were reported for informational purposes, but are included in the race categories in the projected years. For more detailed information, see Appendix C: Technical Information and Methodology at www.wiche.edu/knocking.Source: Western Interstate Commission for Higher Education, Knocking at the College Door: Projections of High School Graduates, 2016.
American Asian/Pacific White Black Indian/ Islander AlaskaNative (combined)
Hispanic Non-HispanicPUBLIC
SCHOOLSTOTAL
PRIVATESCHOOLS
TOTALGRANDTOTAL
Hawai‘ian/Pacific
Islander
Two or More Races
School Year Alone, or Any Race
Available Data for Additional
Race Categories
Repo
rted
Cou
nts
of H
igh
Scho
ol G
radu
ates
Proj
ectio
ns o
f Hig
h Sc
hool
Gra
duat
es
2000-01
2001-02
2002-03
2003-04
2004-05
2005-06
2006-07
2007-08
2008-09
2009-10
2010-11
2011-12
2012-13
2013-14
2014-15
2015-16
2016-17
2017-18
2018-19
2019-20
2020-21
2021-22
2022-23
2023-24
2024-25
2025-26
2026-27
2027-28
2028-29
2029-30
2030-31
2031-32
AT THE COLLEGE DOORKNOCKING APPENDIX A . HIGH SCHOOL GRADUATE DATA TABLES
475,000
525,000
575,000
625,000
675,000
536,680 79,042 457,638 36,148 345,748 52,403 1,100 22,239
544,118 82,639 461,479 35,855 350,049 51,743 1,078 22,753
563,470 86,229 477,241 38,426 358,888 54,876 1,161 23,891
576,523 84,868 491,655 41,611 366,076 58,128 1,280 24,545
586,806 83,278 503,528 45,418 369,293 61,268 1,400 25,572
605,543 85,677 519,866 50,361 376,006 64,608 1,349 27,667
622,114 85,417 536,697 55,230 382,782 67,627 1,387 28,569
639,941 87,652 552,289 60,104 387,309 71,225 1,451 29,943
641,902 88,929 552,973 63,567 382,865 73,290 1,433 31,416 336 1,210
647,036 90,636 556,400 66,644 379,615 75,380 1,608 32,155 429 1,751
640,631 84,020 556,611 70,506 375,013 76,019 1,779 33,293 549 3,286
640,417 85,712 554,705 72,551 369,806 75,702 1,667 34,978 552 4,126
638,882 83,680 555,202 76,199 365,054 75,648 1,548 36,752 702 4,973
630,159 81,805 548,354 78,254 356,279 74,224 1,536 37,965
622,380 80,504 541,876 80,822 345,861 74,416 1,727 38,508
611,531 75,287 536,244 81,161 343,244 72,425 1,719 38,117
603,414 73,056 530,358 82,217 335,878 71,483 1,642 38,131
610,619 71,483 539,136 87,372 335,259 72,904 1,660 41,870
605,739 69,070 536,669 91,089 329,507 72,523 1,772 41,984
596,839 66,418 530,421 93,837 320,988 71,416 1,816 43,033
600,008 64,826 535,182 97,315 321,736 70,657 1,808 44,979
598,593 62,989 535,604 101,753 317,392 70,032 1,809 46,438
593,303 60,660 532,643 107,351 308,636 70,705 1,953 46,198
603,739 64,068 539,671 114,368 306,437 72,043 2,007 47,711
612,637 64,536 548,101 120,918 305,179 73,873 2,104 49,921
598,047 63,021 535,026 115,493 298,553 73,324 1,970 50,023
587,408 61,674 525,733 114,829 291,520 72,183 1,973 49,915
574,727 60,267 514,460 112,344 285,244 69,846 1,935 49,806
570,654 60,045 510,609 113,424 276,950 68,058 1,805 51,150
566,561 59,588 506,973 111,849 272,560 67,574 1,788 54,539
558,830 58,755 500,076 110,305 270,834 66,094 1,866 51,733
562,466 59,111 503,355 111,532 271,475 65,200 1,825 53,917
N O R T H E A S T
2011-12 2021-22 2031-32
562,466
PublicPublic & Private
• 599,400 high school graduates, on average, projected per year between school years 2011-12 and 2031-32.
• The total number of graduates in the Northeast is not projected to increase after 2011-12, ending at 562,500 in 2031-32.
675K
475K
640,417
Projections of High School Graduates54
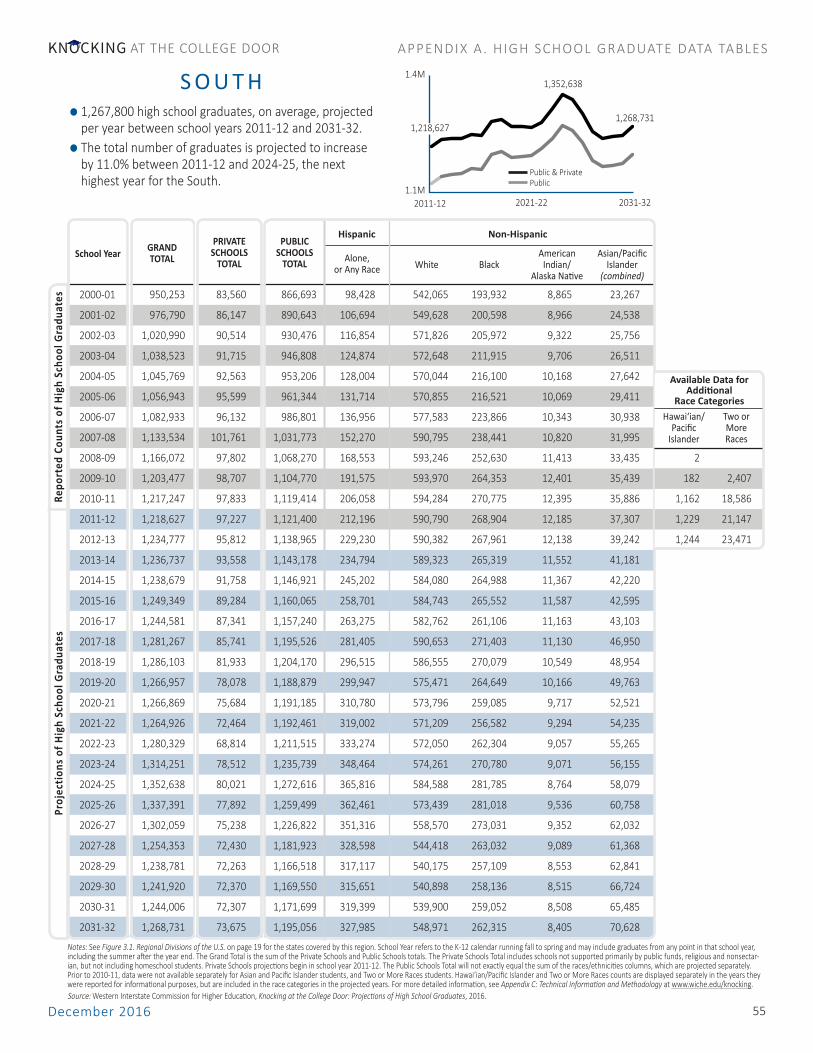
Notes: See Figure 3.1. Regional Divisions of the U.S. on page 19 for the states covered by this region. School Year refers to the K-12 calendar running fall to spring and may include graduates from any point in that school year, including the summer after the year end. The Grand Total is the sum of the Private Schools and Public Schools totals. The Private Schools Total includes schools not supported primarily by public funds, religious and nonsectar-ian, but not including homeschool students. Private Schools projections begin in school year 2011-12. The Public Schools Total will not exactly equal the sum of the races/ethnicities columns, which are projected separately. Prior to 2010-11, data were not available separately for Asian and Pacific Islander students, and Two or More Races students. Hawai‘ian/Pacific Islander and Two or More Races counts are displayed separately in the years they were reported for informational purposes, but are included in the race categories in the projected years. For more detailed information, see Appendix C: Technical Information and Methodology at www.wiche.edu/knocking.Source: Western Interstate Commission for Higher Education, Knocking at the College Door: Projections of High School Graduates, 2016.
American Asian/Pacific White Black Indian/ Islander AlaskaNative (combined)
Hispanic Non-HispanicPUBLIC
SCHOOLSTOTAL
PRIVATESCHOOLS
TOTALGRANDTOTAL
Hawai‘ian/Pacific
Islander
Two or More Races
School Year Alone, or Any Race
Available Data for Additional
Race Categories
Repo
rted
Cou
nts
of H
igh
Scho
ol G
radu
ates
Proj
ectio
ns o
f Hig
h Sc
hool
Gra
duat
es
2000-01
2001-02
2002-03
2003-04
2004-05
2005-06
2006-07
2007-08
2008-09
2009-10
2010-11
2011-12
2012-13
2013-14
2014-15
2015-16
2016-17
2017-18
2018-19
2019-20
2020-21
2021-22
2022-23
2023-24
2024-25
2025-26
2026-27
2027-28
2028-29
2029-30
2030-31
2031-32
AT THE COLLEGE DOORKNOCKING APPENDIX A . HIGH SCHOOL GRADUATE DATA TABLES
1,000,000
1,100,000
1,200,000
1,300,000
1,400,000
950,253 83,560 866,693 98,428 542,065 193,932 8,865 23,267
976,790 86,147 890,643 106,694 549,628 200,598 8,966 24,538
1,020,990 90,514 930,476 116,854 571,826 205,972 9,322 25,756
1,038,523 91,715 946,808 124,874 572,648 211,915 9,706 26,511
1,045,769 92,563 953,206 128,004 570,044 216,100 10,168 27,642
1,056,943 95,599 961,344 131,714 570,855 216,521 10,069 29,411
1,082,933 96,132 986,801 136,956 577,583 223,866 10,343 30,938
1,133,534 101,761 1,031,773 152,270 590,795 238,441 10,820 31,995
1,166,072 97,802 1,068,270 168,553 593,246 252,630 11,413 33,435 2
1,203,477 98,707 1,104,770 191,575 593,970 264,353 12,401 35,439 182 2,407
1,217,247 97,833 1,119,414 206,058 594,284 270,775 12,395 35,886 1,162 18,586
1,218,627 97,227 1,121,400 212,196 590,790 268,904 12,185 37,307 1,229 21,147
1,234,777 95,812 1,138,965 229,230 590,382 267,961 12,138 39,242 1,244 23,471
1,236,737 93,558 1,143,178 234,794 589,323 265,319 11,552 41,181
1,238,679 91,758 1,146,921 245,202 584,080 264,988 11,367 42,220
1,249,349 89,284 1,160,065 258,701 584,743 265,552 11,587 42,595
1,244,581 87,341 1,157,240 263,275 582,762 261,106 11,163 43,103
1,281,267 85,741 1,195,526 281,405 590,653 271,403 11,130 46,950
1,286,103 81,933 1,204,170 296,515 586,555 270,079 10,549 48,954
1,266,957 78,078 1,188,879 299,947 575,471 264,649 10,166 49,763
1,266,869 75,684 1,191,185 310,780 573,796 259,085 9,717 52,521
1,264,926 72,464 1,192,461 319,002 571,209 256,582 9,294 54,235
1,280,329 68,814 1,211,515 333,274 572,050 262,304 9,057 55,265
1,314,251 78,512 1,235,739 348,464 574,261 270,780 9,071 56,155
1,352,638 80,021 1,272,616 365,816 584,588 281,785 8,764 58,079
1,337,391 77,892 1,259,499 362,461 573,439 281,018 9,536 60,758
1,302,059 75,238 1,226,822 351,316 558,570 273,031 9,352 62,032
1,254,353 72,430 1,181,923 328,598 544,418 263,032 9,089 61,368
1,238,781 72,263 1,166,518 317,117 540,175 257,109 8,553 62,841
1,241,920 72,370 1,169,550 315,651 540,898 258,136 8,515 66,724
1,244,006 72,307 1,171,699 319,399 539,900 259,052 8,508 65,485
1,268,731 73,675 1,195,056 327,985 548,971 262,315 8,405 70,628
S O U T H
2011-12 2021-22 2031-32
1,268,731
PublicPublic & Private
• 1,267,800 high school graduates, on average, projected per year between school years 2011-12 and 2031-32.
• The total number of graduates is projected to increase by 11.0% between 2011-12 and 2024-25, the next highest year for the South.
1.4M
1.1M
1,218,627
December 2016 55
1,352,638

Notes: School Year refers to the K-12 calendar running fall to spring and may include graduates from any point in that school year, including the summer after the year end. The Grand Total is the sum of the Private Schools and Public Schools totals. The Private Schools Total includes schools not supported primarily by public funds, religious and nonsectarian, but not including homeschool students. Private Schools projections begin in school year 2011-12. The Public Schools Total will not exactly equal the sum of the races/ethnicities columns, which are projected separately. Prior to 2010-11, data were not available separately for Asian and Pacific Islander students, and Two or More Races students. Hawai‘ian/Pacific Islander and Two or More Races counts are displayed separately in the years they were reported for informational purposes, but are included in the race categories in the projected years. For more detailed information, see Appendix C: Technical Information and Methodology at www.wiche.edu/knocking.Source: Western Interstate Commission for Higher Education, Knocking at the College Door: Projections of High School Graduates, 2016.
American Asian/Pacific White Black Indian/ Islander AlaskaNative (combined)
Hispanic Non-HispanicPUBLIC
SCHOOLSTOTAL
PRIVATESCHOOLS
TOTALGRANDTOTAL
Hawai‘ian/Pacific
Islander
Two or More Races
School Year Alone, or Any Race
Available Data for Additional
Race Categories
Repo
rted
Cou
nts
of H
igh
Scho
ol G
radu
ates
Proj
ectio
ns o
f Hig
h Sc
hool
Gra
duat
es
2000-01
2001-02
2002-03
2003-04
2004-05
2005-06
2006-07
2007-08
2008-09
2009-10
2010-11
2011-12
2012-13
2013-14
2014-15
2015-16
2016-17
2017-18
2018-19
2019-20
2020-21
2021-22
2022-23
2023-24
2024-25
2025-26
2026-27
2027-28
2028-29
2029-30
2030-31
2031-32
AT THE COLLEGE DOORKNOCKING APPENDIX A . HIGH SCHOOL GRADUATE DATA TABLES
38,000
40,000
42,000
44,000
46,000
48,000
50,000
52,000
41,316 4,234 37,082 238 24,073 11,986 437 348
40,127 4,240 35,887 245 23,462 11,374 459 347
41,412 4,671 36,741 313 24,127 11,500 417 384
41,729 5,265 36,464 325 23,949 11,483 339 368
42,644 5,191 37,453 404 24,391 11,803 404 420
42,908 4,990 37,918 478 24,680 12,026 343 391
43,488 4,576 38,912 580 25,004 12,546 342 411
45,981 4,635 41,346 684 26,375 13,343 437 474
47,359 5,277 42,082 799 26,380 13,884 461 509
48,178 5,012 43,166 976 26,569 14,558 407 606
50,756 4,721 46,035 1,213 27,958 15,836 492 536 7 47
50,263 4,869 45,394 1,206 27,781 15,333 467 607 13 102
49,128 4,895 44,233 1,338 27,052 14,758 488 597 21 142
49,242 4,815 44,427 1,453 27,143 14,719 462 643
50,317 4,846 45,471 1,579 27,764 15,038 419 673
49,386 4,601 44,785 1,712 27,380 14,604 472 656
49,102 4,531 44,571 1,843 27,308 14,368 474 649
49,843 4,455 45,389 2,035 27,421 14,745 478 767
48,690 4,072 44,618 2,226 26,905 14,373 453 731
47,131 3,738 43,394 2,243 26,223 13,832 498 710
46,185 3,562 42,623 2,487 25,915 13,118 487 808
45,801 3,333 42,468 2,562 25,631 13,137 492 875
45,850 3,223 42,627 2,657 25,906 12,993 490 858
46,808 3,704 43,104 2,979 25,546 13,503 494 843
48,325 3,792 44,533 3,357 25,838 14,159 523 946
48,737 3,724 45,013 3,678 25,895 14,323 522 1,003
47,122 3,567 43,555 3,477 25,084 13,807 568 1,058
45,138 3,428 41,710 3,200 24,313 13,023 550 1,026
44,514 3,420 41,094 2,944 24,122 12,842 525 1,060
43,890 3,367 40,523 2,590 23,783 12,957 552 1,126
43,745 3,343 40,402 2,667 23,766 12,826 554 1,023
44,677 3,411 41,266 2,672 24,342 13,051 471 1,132
A L A B A M A
2011-12 2021-22 2031-32
44,677
PublicPublic & Private
• 47,300 high school graduates, on average, projected per year between school years 2011-12 and 2031-32.
• The total number of graduates in Alabama is not projected to increase after 2011-12, ending at 44,700 in 2031-32.
52K
38K
50,263
Projections of High School Graduates56

Notes: School Year refers to the K-12 calendar running fall to spring and may include graduates from any point in that school year, including the summer after the year end. The Grand Total is the sum of the Private Schools and Public Schools totals. The Private Schools Total includes schools not supported primarily by public funds, religious and nonsectarian, but not including homeschool students. Private Schools projections begin in school year 2011-12. The Public Schools Total will not exactly equal the sum of the races/ethnicities columns, which are projected separately. Prior to 2010-11, data were not available separately for Asian and Pacific Islander students, and Two or More Races students. Hawai‘ian/Pacific Islander and Two or More Races counts are displayed separately in the years they were reported for informational purposes, but are included in the race categories in the projected years. For more detailed information, see Appendix C: Technical Information and Methodology at www.wiche.edu/knocking.Source: Western Interstate Commission for Higher Education, Knocking at the College Door: Projections of High School Graduates, 2016.
American Asian/Pacific White Black Indian/ Islander AlaskaNative (combined)
Hispanic Non-HispanicPUBLIC
SCHOOLSTOTAL
PRIVATESCHOOLS
TOTALGRANDTOTAL
Hawai‘ian/Pacific
Islander
Two or More Races
School Year Alone, or Any Race
Available Data for Additional
Race Categories
Repo
rted
Cou
nts
of H
igh
Scho
ol G
radu
ates
Proj
ectio
ns o
f Hig
h Sc
hool
Gra
duat
es
2000-01
2001-02
2002-03
2003-04
2004-05
2005-06
2006-07
2007-08
2008-09
2009-10
2010-11
2011-12
2012-13
2013-14
2014-15
2015-16
2016-17
2017-18
2018-19
2019-20
2020-21
2021-22
2022-23
2023-24
2024-25
2025-26
2026-27
2027-28
2028-29
2029-30
2030-31
2031-32
AT THE COLLEGE DOORKNOCKING APPENDIX A . HIGH SCHOOL GRADUATE DATA TABLES
7,000
7,500
8,000
8,500
9,000
7,059 247 6,812 173 4,678 246 1,286 429
7,202 257 6,945 197 4,734 252 1,340 422
7,593 296 7,297 194 5,024 268 1,343 468
7,541 305 7,236 198 4,972 280 1,325 461
7,200 291 6,909 97 4,756 229 1,233 477
7,630 269 7,361 246 4,843 302 1,442 528
7,864 198 7,666 250 4,921 282 1,693 520
8,050 195 7,855 389 4,742 262 1,523 575
8,197 189 8,008 364 5,134 298 1,592 739 119 391
8,442 197 8,245 412 5,139 289 1,707 698 125 429
8,282 218 8,064 428 5,029 307 1,546 754 141 402
8,159 170 7,989 448 4,881 283 1,596 781 150 431
8,037 177 7,860 482 4,726 289 1,591 772 158 459
7,964 176 7,787 510 4,648 263 1,611 693
7,635 178 7,457 435 4,408 275 1,520 732
7,589 173 7,416 479 4,283 260 1,576 702
7,770 177 7,593 535 4,307 277 1,605 733
7,796 189 7,607 555 4,188 281 1,688 723
7,758 197 7,561 520 4,138 254 1,691 757
7,530 183 7,348 537 4,000 281 1,622 688
7,491 190 7,302 491 4,040 234 1,596 706
7,554 184 7,370 514 4,046 238 1,639 670
7,605 194 7,411 576 3,933 235 1,705 674
7,758 205 7,552 609 4,032 231 1,740 629
7,938 205 7,734 638 3,997 243 1,851 660
8,275 212 8,064 512 4,275 246 1,919 827
8,171 209 7,962 539 4,119 263 1,955 810
8,256 212 8,044 528 4,184 251 1,919 876
8,227 212 8,015 616 3,896 256 1,839 820
8,051 207 7,844 590 3,701 212 1,777 864
8,244 212 8,033 681 4,261 264 1,597 864
8,202 211 7,992 674 4,208 264 1,573 898
A L A S K A
2011-12 2021-22 2031-32
8,202
PublicPublic & Private
• 7,900 high school graduates, on average, projected per year between school years 2011-12 and 2031-32.
• The total number of graduates is projected to increase by 1.4% between 2011-12 and 2025-26, the next highest year for Alaska.
9K
7K
8,159 8,275
December 2016 57

Notes: School Year refers to the K-12 calendar running fall to spring and may include graduates from any point in that school year, including the summer after the year end. The Grand Total is the sum of the Private Schools and Public Schools totals. The Private Schools Total includes schools not supported primarily by public funds, religious and nonsectarian, but not including homeschool students. Private Schools projections begin in school year 2011-12. The Public Schools Total will not exactly equal the sum of the races/ethnicities columns, which are projected separately. Prior to 2010-11, data were not available separately for Asian and Pacific Islander students, and Two or More Races students. Hawai‘ian/Pacific Islander and Two or More Races counts are displayed separately in the years they were reported for informational purposes, but are included in the race categories in the projected years. For more detailed information, see Appendix C: Technical Information and Methodology at www.wiche.edu/knocking.Source: Western Interstate Commission for Higher Education, Knocking at the College Door: Projections of High School Graduates, 2016.
American Asian/Pacific White Black Indian/ Islander AlaskaNative (combined)
Hispanic Non-HispanicPUBLIC
SCHOOLSTOTAL
PRIVATESCHOOLS
TOTALGRANDTOTAL
Hawai‘ian/Pacific
Islander
Two or More Races
School Year Alone, or Any Race
Available Data for Additional
Race Categories
Repo
rted
Cou
nts
of H
igh
Scho
ol G
radu
ates
Proj
ectio
ns o
f Hig
h Sc
hool
Gra
duat
es
2000-01
2001-02
2002-03
2003-04
2004-05
2005-06
2006-07
2007-08
2008-09
2009-10
2010-11
2011-12
2012-13
2013-14
2014-15
2015-16
2016-17
2017-18
2018-19
2019-20
2020-21
2021-22
2022-23
2023-24
2024-25
2025-26
2026-27
2027-28
2028-29
2029-30
2030-31
2031-32
AT THE COLLEGE DOORKNOCKING APPENDIX A . HIGH SCHOOL GRADUATE DATA TABLES
56,000
61,000
66,000
71,000
76,000
48,812 2,079 46,733 12,468 28,150 2,038 2,868 1,209
49,416 2,241 47,175 12,479 28,640 2,008 2,762 1,286
52,388 2,402 49,986 13,622 30,039 2,240 2,693 1,392
48,042 2,534 45,508 13,874 25,685 2,204 2,571 1,174
62,132 2,634 59,498 17,616 33,363 2,790 4,139 1,590
56,847 2,756 54,091 16,369 30,551 2,703 2,779 1,689
58,547 2,593 55,954 17,593 30,578 2,930 3,154 1,699
64,547 2,880 61,667 20,276 32,490 3,398 3,625 1,878
65,129 2,755 62,374 21,607 31,895 3,519 3,346 2,007
63,982 2,837 61,145 22,452 29,448 3,622 3,370 1,879
67,118 2,646 64,472 23,741 31,472 3,777 3,345 2,138 119 450
65,977 2,769 63,208 23,517 30,749 3,558 3,231 2,153 112 657
64,750 2,542 62,208 23,542 29,997 3,407 2,903 2,359 147 827
68,060 2,507 65,553 25,537 30,817 3,679 2,955 2,360
66,952 2,343 64,609 26,089 29,671 3,538 2,851 2,239
67,549 2,418 65,132 26,490 29,534 3,641 2,946 2,276
67,909 2,369 65,540 26,832 29,724 3,420 2,963 2,338
68,627 2,292 66,335 27,509 29,829 3,508 2,798 2,443
68,985 2,135 66,850 28,306 29,667 3,389 2,689 2,553
68,574 2,066 66,508 28,313 29,298 3,425 2,745 2,439
69,507 2,060 67,447 28,773 29,808 3,338 2,707 2,566
69,313 1,917 67,396 29,085 29,293 3,349 2,748 2,631
69,981 1,819 68,162 29,850 29,410 3,258 2,751 2,588
70,851 2,191 68,661 30,533 29,435 3,199 2,656 2,537
72,298 2,204 70,094 31,836 29,492 3,189 2,662 2,606
71,534 2,095 69,439 30,054 29,793 3,860 2,755 2,933
66,528 1,926 64,602 27,060 28,162 3,926 2,646 2,833
62,357 1,812 60,545 24,161 27,419 3,748 2,497 2,756
60,705 1,795 58,910 22,835 26,972 3,662 2,433 2,856
61,505 1,814 59,691 23,348 26,956 3,989 2,426 3,056
61,069 1,791 59,278 23,360 26,691 4,045 2,376 2,986
61,951 1,814 60,137 24,137 26,848 4,258 2,155 2,926
A R I Z O N A
2011-12 2021-22 2031-32
61,951
PublicPublic & Private
76K
56K
65,977• 66,900 high school graduates, on average, projected
per year between school years 2011-12 and 2031-32.• The total number of graduates is projected to increase
by 9.6% between 2011-12 and 2024-25, the next highest year for Arizona.
72,298
Projections of High School Graduates58

Notes: School Year refers to the K-12 calendar running fall to spring and may include graduates from any point in that school year, including the summer after the year end. The Grand Total is the sum of the Private Schools and Public Schools totals. The Private Schools Total includes schools not supported primarily by public funds, religious and nonsectarian, but not including homeschool students. Private Schools projections begin in school year 2011-12. The Public Schools Total will not exactly equal the sum of the races/ethnicities columns, which are projected separately. Prior to 2010-11, data were not available separately for Asian and Pacific Islander students, and Two or More Races students. Hawai‘ian/Pacific Islander and Two or More Races counts are displayed separately in the years they were reported for informational purposes, but are included in the race categories in the projected years. For more detailed information, see Appendix C: Technical Information and Methodology at www.wiche.edu/knocking.Source: Western Interstate Commission for Higher Education, Knocking at the College Door: Projections of High School Graduates, 2016.
American Asian/Pacific White Black Indian/ Islander AlaskaNative (combined)
Hispanic Non-HispanicPUBLIC
SCHOOLSTOTAL
PRIVATESCHOOLS
TOTALGRANDTOTAL
Hawai‘ian/Pacific
Islander
Two or More Races
School Year Alone, or Any Race
Available Data for Additional
Race Categories
Repo
rted
Cou
nts
of H
igh
Scho
ol G
radu
ates
Proj
ectio
ns o
f Hig
h Sc
hool
Gra
duat
es
2000-01
2001-02
2002-03
2003-04
2004-05
2005-06
2006-07
2007-08
2008-09
2009-10
2010-11
2011-12
2012-13
2013-14
2014-15
2015-16
2016-17
2017-18
2018-19
2019-20
2020-21
2021-22
2022-23
2023-24
2024-25
2025-26
2026-27
2027-28
2028-29
2029-30
2030-31
2031-32
AT THE COLLEGE DOORKNOCKING APPENDIX A . HIGH SCHOOL GRADUATE DATA TABLES
27,000
28,000
29,000
30,000
31,000
32,000
33,000
34,000
28,336 1,236 27,100 528 20,454 5,697 119 302
28,278 1,294 26,984 626 20,138 5,779 118 323
28,906 1,351 27,555 788 20,559 5,747 129 332
28,507 1,326 27,181 795 20,276 5,596 154 360
27,986 1,365 26,621 998 19,563 5,509 165 386
30,177 1,387 28,790 1,183 21,017 5,951 172 467
28,545 1,379 27,166 1,121 19,449 5,534 154 449
30,179 1,454 28,725 1,421 20,474 6,132 185 513
29,387 1,330 28,057 1,599 19,872 5,939 205 442
29,569 1,293 28,276 1,849 19,693 6,004 173 558 96 260
29,700 1,495 28,205 2,096 19,285 6,075 218 531 63 279
29,807 1,388 28,419 2,220 19,505 6,028 174 492 75 284
30,278 1,350 28,928 2,413 19,715 6,097 183 521 85 389
30,947 1,394 29,553 2,576 20,054 6,162 185 549
31,214 1,370 29,844 2,794 19,989 6,211 205 599
31,144 1,494 29,650 2,955 19,690 6,168 189 597
30,904 1,470 29,434 3,024 19,766 5,840 191 602
31,126 1,273 29,853 3,308 19,667 6,021 184 660
31,315 1,212 30,102 3,431 19,778 6,052 176 664
31,264 1,282 29,982 3,773 19,486 5,946 155 650
30,835 1,273 29,562 3,927 19,170 5,658 159 710
30,760 1,102 29,658 4,079 19,146 5,629 160 734
30,526 1,072 29,454 4,175 18,849 5,652 137 750
30,584 1,269 29,314 4,479 18,645 5,511 135 701
32,630 1,288 31,342 4,884 19,601 6,101 156 751
31,978 1,243 30,735 4,756 19,218 6,069 166 783
31,100 1,192 29,908 4,553 18,926 5,747 132 764
29,966 1,156 28,810 4,322 18,263 5,501 167 709
30,060 1,177 28,883 4,232 18,362 5,363 167 843
29,935 1,166 28,769 4,151 18,111 5,453 182 1,012
29,527 1,146 28,381 4,134 17,664 5,429 172 1,238
30,022 1,164 28,858 4,129 18,104 5,414 164 1,289
A R K A N S A S
2011-12 2021-22 2031-32
30,022
PublicPublic & Private
34K
27K
29,807
• 30,800 high school graduates, on average, projected per year between school years 2011-12 and 2031-32.
• The total number of graduates is projected to increase by 9.5% between 2011-12 and 2024-25, the next highest year for Arkansas.
32,630
December 2016 59

Notes: School Year refers to the K-12 calendar running fall to spring and may include graduates from any point in that school year, including the summer after the year end. The Grand Total is the sum of the Private Schools and Public Schools totals. The Private Schools Total includes schools not supported primarily by public funds, religious and nonsectarian, but not including homeschool students. Private Schools projections begin in school year 2011-12. The Public Schools Total will not exactly equal the sum of the races/ethnicities columns, which are projected separately. Prior to 2010-11, data were not available separately for Asian and Pacific Islander students, and Two or More Races students. Hawai‘ian/Pacific Islander and Two or More Races counts are displayed separately in the years they were reported for informational purposes, but are included in the race categories in the projected years. For more detailed information, see Appendix C: Technical Information and Methodology at www.wiche.edu/knocking.Source: Western Interstate Commission for Higher Education, Knocking at the College Door: Projections of High School Graduates, 2016.
American Asian/Pacific White Black Indian/ Islander AlaskaNative (combined)
Hispanic Non-HispanicPUBLIC
SCHOOLSTOTAL
PRIVATESCHOOLS
TOTALGRANDTOTAL
Hawai‘ian/Pacific
Islander
Two or More Races
School Year Alone, or Any Race
Available Data for Additional
Race Categories
Repo
rted
Cou
nts
of H
igh
Scho
ol G
radu
ates
Proj
ectio
ns o
f Hig
h Sc
hool
Gra
duat
es
2000-01
2001-02
2002-03
2003-04
2004-05
2005-06
2006-07
2007-08
2008-09
2009-10
2010-11
2011-12
2012-13
2013-14
2014-15
2015-16
2016-17
2017-18
2018-19
2019-20
2020-21
2021-22
2022-23
2023-24
2024-25
2025-26
2026-27
2027-28
2028-29
2029-30
2030-31
2031-32
AT THE COLLEGE DOORKNOCKING APPENDIX A . HIGH SCHOOL GRADUATE DATA TABLES
346,000
366,000
386,000
406,000
426,000
446,000
466,000
345,474 30,285 315,189 103,795 139,228 22,474 2,734 46,958
357,011 31,116 325,895 109,038 140,421 23,451 3,036 48,206
373,043 31,946 341,097 116,724 144,664 24,855 3,120 48,728
376,385 32,905 343,480 121,418 141,574 25,267 3,040 48,770
388,758 33,541 355,217 129,671 140,807 26,800 2,950 50,224
378,157 34,642 343,515 124,409 138,584 25,355 2,833 52,334
391,519 34,878 356,641 128,462 138,595 25,737 2,866 52,252
410,697 36,136 374,561 142,491 141,011 25,911 3,071 54,019
407,566 35,256 372,310 147,717 139,038 26,205 2,980 59,196 2,826 6,766
441,065 36,078 404,987 174,088 139,679 28,891 3,320 59,010 2,661 11,034
444,848 34,381 410,467 184,131 135,762 28,633 3,049 58,892 2,588 8,565
453,078 34,414 418,664 193,516 133,271 29,230 3,250 59,397 2,587 9,063
455,854 33,729 422,125 198,993 131,369 28,335 3,137 60,291 2,584 9,906
449,202 32,418 416,784 199,242 126,688 26,963 2,981 58,839
440,016 32,177 407,839 198,524 120,789 25,727 2,809 57,324
434,112 30,625 403,487 199,027 118,286 25,018 2,717 55,346
425,864 29,749 396,115 195,763 115,709 23,894 2,490 55,017
435,365 29,014 406,351 204,335 114,545 23,539 2,472 57,894
431,009 27,871 403,138 205,566 111,883 23,042 2,272 56,137
427,665 26,759 400,906 206,555 110,060 22,001 2,268 55,505
434,526 26,472 408,054 210,573 111,762 21,719 2,156 57,127
434,103 25,551 408,552 213,065 110,570 21,057 2,113 56,765
437,192 24,560 412,632 220,216 108,709 20,742 1,999 55,453
448,839 26,936 421,903 228,376 109,035 20,971 1,993 55,418
431,016 27,111 403,906 218,862 104,573 19,912 1,902 52,431
432,388 26,165 406,223 219,016 102,625 21,274 2,124 56,428
414,426 24,812 389,614 206,723 99,721 20,715 2,021 55,592
400,749 23,990 376,759 196,902 99,297 20,066 1,973 53,110
393,429 23,774 369,655 190,536 94,821 19,181 1,820 51,669
393,374 23,851 369,523 185,900 93,379 18,858 1,832 56,499
387,456 23,384 364,071 181,629 93,992 18,646 1,880 56,665
394,117 23,749 370,368 181,050 94,548 18,255 1,820 62,081
C A L I F O R N I A
2011-12 2021-22 2031-32
394,117
PublicPublic & Private
466K
346K
453,078
• #1 highest producer of high school graduates with 426,400 high school graduates, on average, projected per year between school years 2011-12 and 2031-32.
• The total number of graduates in California is not projected to increase after 2011-12, ending at 394,100 in 2031-32.
Projections of High School Graduates60
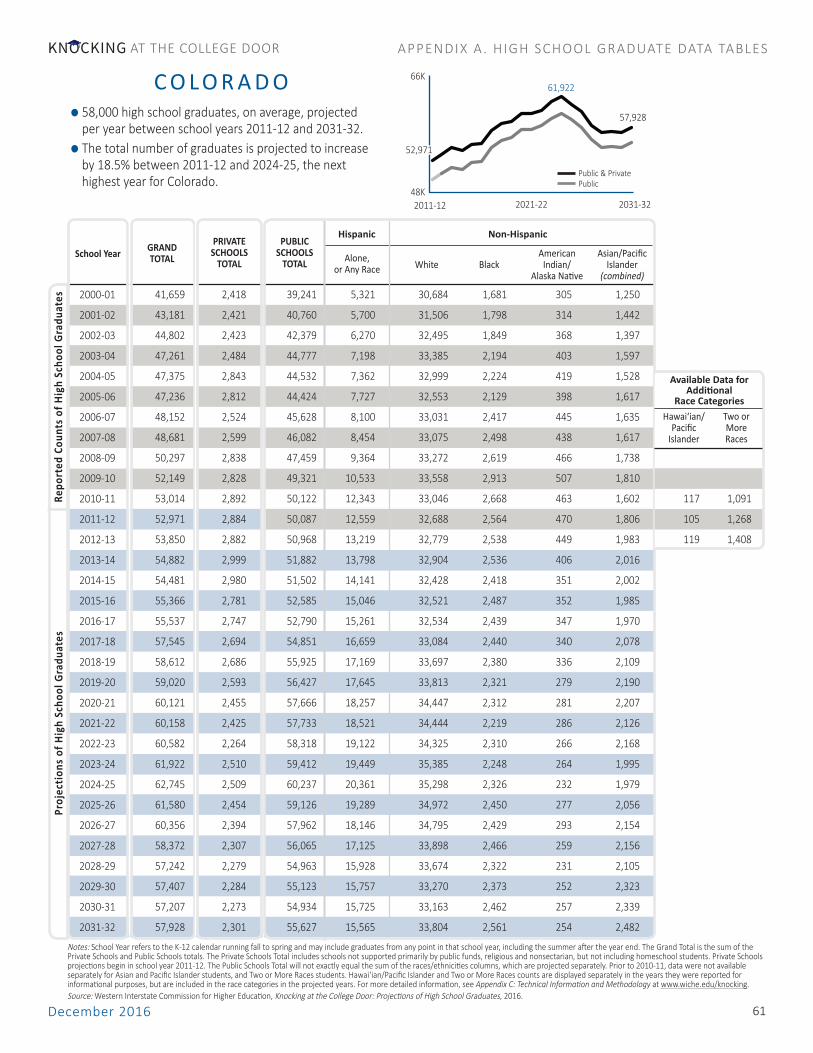
Notes: School Year refers to the K-12 calendar running fall to spring and may include graduates from any point in that school year, including the summer after the year end. The Grand Total is the sum of the Private Schools and Public Schools totals. The Private Schools Total includes schools not supported primarily by public funds, religious and nonsectarian, but not including homeschool students. Private Schools projections begin in school year 2011-12. The Public Schools Total will not exactly equal the sum of the races/ethnicities columns, which are projected separately. Prior to 2010-11, data were not available separately for Asian and Pacific Islander students, and Two or More Races students. Hawai‘ian/Pacific Islander and Two or More Races counts are displayed separately in the years they were reported for informational purposes, but are included in the race categories in the projected years. For more detailed information, see Appendix C: Technical Information and Methodology at www.wiche.edu/knocking.Source: Western Interstate Commission for Higher Education, Knocking at the College Door: Projections of High School Graduates, 2016.
American Asian/Pacific White Black Indian/ Islander AlaskaNative (combined)
Hispanic Non-HispanicPUBLIC
SCHOOLSTOTAL
PRIVATESCHOOLS
TOTALGRANDTOTAL
Hawai‘ian/Pacific
Islander
Two or More Races
School Year Alone, or Any Race
Available Data for Additional
Race Categories
Repo
rted
Cou
nts
of H
igh
Scho
ol G
radu
ates
Proj
ectio
ns o
f Hig
h Sc
hool
Gra
duat
es
2000-01
2001-02
2002-03
2003-04
2004-05
2005-06
2006-07
2007-08
2008-09
2009-10
2010-11
2011-12
2012-13
2013-14
2014-15
2015-16
2016-17
2017-18
2018-19
2019-20
2020-21
2021-22
2022-23
2023-24
2024-25
2025-26
2026-27
2027-28
2028-29
2029-30
2030-31
2031-32
AT THE COLLEGE DOORKNOCKING APPENDIX A . HIGH SCHOOL GRADUATE DATA TABLES
48,000
53,000
58,000
63,000
41,659 2,418 39,241 5,321 30,684 1,681 305 1,250
43,181 2,421 40,760 5,700 31,506 1,798 314 1,442
44,802 2,423 42,379 6,270 32,495 1,849 368 1,397
47,261 2,484 44,777 7,198 33,385 2,194 403 1,597
47,375 2,843 44,532 7,362 32,999 2,224 419 1,528
47,236 2,812 44,424 7,727 32,553 2,129 398 1,617
48,152 2,524 45,628 8,100 33,031 2,417 445 1,635
48,681 2,599 46,082 8,454 33,075 2,498 438 1,617
50,297 2,838 47,459 9,364 33,272 2,619 466 1,738
52,149 2,828 49,321 10,533 33,558 2,913 507 1,810
53,014 2,892 50,122 12,343 33,046 2,668 463 1,602 117 1,091
52,971 2,884 50,087 12,559 32,688 2,564 470 1,806 105 1,268
53,850 2,882 50,968 13,219 32,779 2,538 449 1,983 119 1,408
54,882 2,999 51,882 13,798 32,904 2,536 406 2,016
54,481 2,980 51,502 14,141 32,428 2,418 351 2,002
55,366 2,781 52,585 15,046 32,521 2,487 352 1,985
55,537 2,747 52,790 15,261 32,534 2,439 347 1,970
57,545 2,694 54,851 16,659 33,084 2,440 340 2,078
58,612 2,686 55,925 17,169 33,697 2,380 336 2,109
59,020 2,593 56,427 17,645 33,813 2,321 279 2,190
60,121 2,455 57,666 18,257 34,447 2,312 281 2,207
60,158 2,425 57,733 18,521 34,444 2,219 286 2,126
60,582 2,264 58,318 19,122 34,325 2,310 266 2,168
61,922 2,510 59,412 19,449 35,385 2,248 264 1,995
62,745 2,509 60,237 20,361 35,298 2,326 232 1,979
61,580 2,454 59,126 19,289 34,972 2,450 277 2,056
60,356 2,394 57,962 18,146 34,795 2,429 293 2,154
58,372 2,307 56,065 17,125 33,898 2,466 259 2,156
57,242 2,279 54,963 15,928 33,674 2,322 231 2,105
57,407 2,284 55,123 15,757 33,270 2,373 252 2,323
57,207 2,273 54,934 15,725 33,163 2,462 257 2,339
57,928 2,301 55,627 15,565 33,804 2,561 254 2,482
C O L O R A D O
2011-12 2021-22 2031-32
57,928
PublicPublic & Private
66K
48K
52,971
• 58,000 high school graduates, on average, projected per year between school years 2011-12 and 2031-32.
• The total number of graduates is projected to increase by 18.5% between 2011-12 and 2024-25, the next highest year for Colorado.
61,922
December 2016 61

Notes: School Year refers to the K-12 calendar running fall to spring and may include graduates from any point in that school year, including the summer after the year end. The Grand Total is the sum of the Private Schools and Public Schools totals. The Private Schools Total includes schools not supported primarily by public funds, religious and nonsectarian, but not including homeschool students. Private Schools projections begin in school year 2011-12. The Public Schools Total will not exactly equal the sum of the races/ethnicities columns, which are projected separately. Prior to 2010-11, data were not available separately for Asian and Pacific Islander students, and Two or More Races students. Hawai‘ian/Pacific Islander and Two or More Races counts are displayed separately in the years they were reported for informational purposes, but are included in the race categories in the projected years. For more detailed information, see Appendix C: Technical Information and Methodology at www.wiche.edu/knocking.Source: Western Interstate Commission for Higher Education, Knocking at the College Door: Projections of High School Graduates, 2016.
American Asian/Pacific White Black Indian/ Islander AlaskaNative (combined)
Hispanic Non-HispanicPUBLIC
SCHOOLSTOTAL
PRIVATESCHOOLS
TOTALGRANDTOTAL
Hawai‘ian/Pacific
Islander
Two or More Races
School Year Alone, or Any Race
Available Data for Additional
Race Categories
Repo
rted
Cou
nts
of H
igh
Scho
ol G
radu
ates
Proj
ectio
ns o
f Hig
h Sc
hool
Gra
duat
es
2000-01
2001-02
2002-03
2003-04
2004-05
2005-06
2006-07
2007-08
2008-09
2009-10
2010-11
2011-12
2012-13
2013-14
2014-15
2015-16
2016-17
2017-18
2018-19
2019-20
2020-21
2021-22
2022-23
2023-24
2024-25
2025-26
2026-27
2027-28
2028-29
2029-30
2030-31
2031-32
AT THE COLLEGE DOORKNOCKING APPENDIX A . HIGH SCHOOL GRADUATE DATA TABLES
28,000
33,000
38,000
43,000
35,514 5,126 30,388 2,563 23,429 3,369 66 961
38,205 5,878 32,327 2,886 24,721 3,617 74 1,029
40,296 6,629 33,667 3,250 25,308 3,952 87 1,070
40,537 5,964 34,573 3,319 26,130 3,896 102 1,126
41,104 5,589 35,515 3,717 26,482 4,051 93 1,172
41,210 4,988 36,222 3,623 27,047 4,184 117 1,251
43,558 6,017 37,541 4,139 27,384 4,689 102 1,227
44,099 5,680 38,419 4,451 27,782 4,775 104 1,307
41,201 6,233 34,968 3,861 25,561 4,221 77 1,248
40,996 6,501 34,495 4,063 24,787 4,226 95 1,324
44,813 5,959 38,854 5,301 27,039 4,922 169 1,423 17 270
44,495 5,814 38,681 5,507 26,656 4,770 215 1,533 21 395
44,365 5,643 38,722 5,838 26,188 4,823 144 1,728 65 449
42,968 5,517 37,451 5,641 25,397 4,588 107 1,658
41,956 5,533 36,423 5,845 24,123 4,538 108 1,666
41,580 4,745 36,835 6,191 24,000 4,559 122 1,799
41,529 4,684 36,845 6,403 23,731 4,542 109 1,791
40,783 4,490 36,292 6,516 23,095 4,431 104 1,965
40,056 4,255 35,801 6,696 22,679 4,271 106 1,845
39,050 4,107 34,943 6,841 21,623 4,189 76 2,016
39,603 3,964 35,639 7,158 22,033 4,101 88 2,079
38,497 3,741 34,756 7,347 21,016 4,072 80 2,064
37,991 3,504 34,488 7,774 20,434 3,966 74 2,080
37,586 3,783 33,803 8,082 19,525 3,975 67 1,989
37,880 3,777 34,103 8,523 19,292 3,928 62 2,163
36,798 3,621 33,177 8,344 18,544 4,078 66 2,180
35,370 3,460 31,910 8,272 17,590 3,937 86 2,070
34,246 3,348 30,897 7,930 16,996 3,734 85 2,186
33,833 3,336 30,497 8,071 16,544 3,726 71 2,092
33,201 3,270 29,931 7,649 16,356 3,683 71 2,142
32,796 3,223 29,572 7,900 15,929 3,614 88 2,043
32,968 3,238 29,730 7,825 16,101 3,620 89 2,087
C O N N E C T I C U T
2011-12 2021-22 2031-32
32,968
PublicPublic & Private
47K
28K
44,495
• 38,500 high school graduates, on average, projected per year between school years 2011-12 and 2031-32.
• The total number of graduates in Connecticut is not projected to increase after 2011-12, ending at 33,000 in 2031-32.
Projections of High School Graduates62
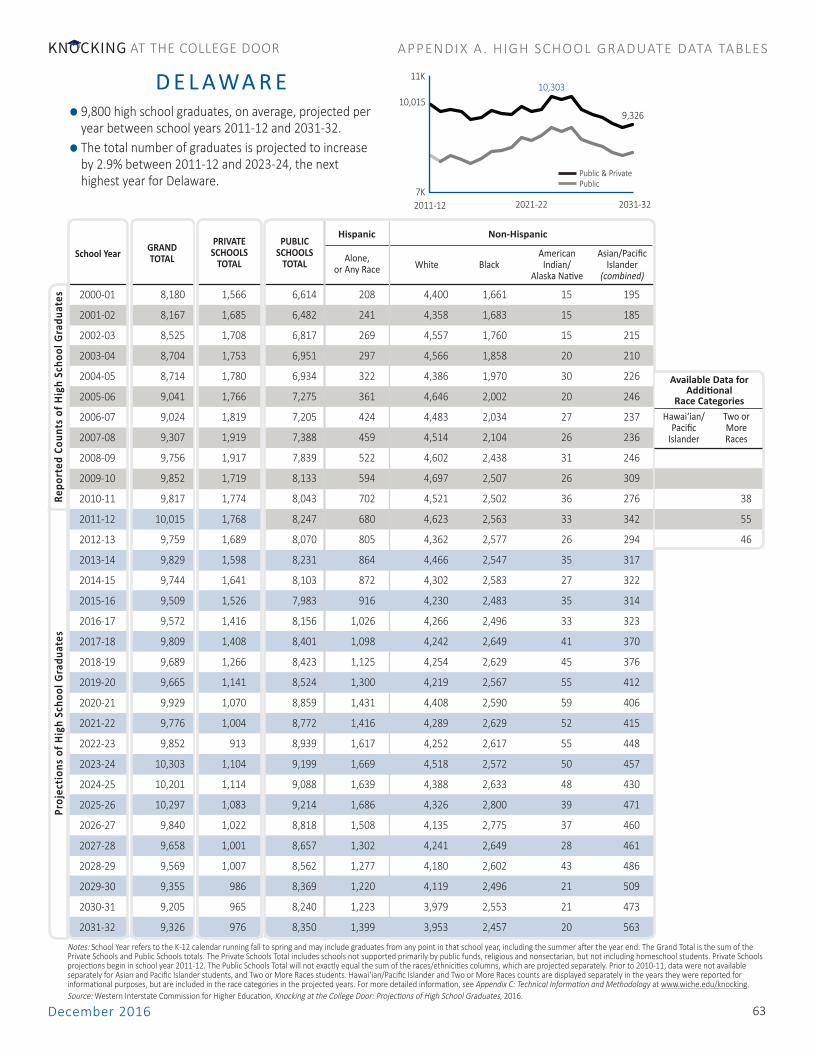
Notes: School Year refers to the K-12 calendar running fall to spring and may include graduates from any point in that school year, including the summer after the year end. The Grand Total is the sum of the Private Schools and Public Schools totals. The Private Schools Total includes schools not supported primarily by public funds, religious and nonsectarian, but not including homeschool students. Private Schools projections begin in school year 2011-12. The Public Schools Total will not exactly equal the sum of the races/ethnicities columns, which are projected separately. Prior to 2010-11, data were not available separately for Asian and Pacific Islander students, and Two or More Races students. Hawai‘ian/Pacific Islander and Two or More Races counts are displayed separately in the years they were reported for informational purposes, but are included in the race categories in the projected years. For more detailed information, see Appendix C: Technical Information and Methodology at www.wiche.edu/knocking.Source: Western Interstate Commission for Higher Education, Knocking at the College Door: Projections of High School Graduates, 2016.
American Asian/Pacific White Black Indian/ Islander AlaskaNative (combined)
Hispanic Non-HispanicPUBLIC
SCHOOLSTOTAL
PRIVATESCHOOLS
TOTALGRANDTOTAL
Hawai‘ian/Pacific
Islander
Two or More Races
School Year Alone, or Any Race
Available Data for Additional
Race Categories
Repo
rted
Cou
nts
of H
igh
Scho
ol G
radu
ates
Proj
ectio
ns o
f Hig
h Sc
hool
Gra
duat
es
2000-01
2001-02
2002-03
2003-04
2004-05
2005-06
2006-07
2007-08
2008-09
2009-10
2010-11
2011-12
2012-13
2013-14
2014-15
2015-16
2016-17
2017-18
2018-19
2019-20
2020-21
2021-22
2022-23
2023-24
2024-25
2025-26
2026-27
2027-28
2028-29
2029-30
2030-31
2031-32
AT THE COLLEGE DOORKNOCKING APPENDIX A . HIGH SCHOOL GRADUATE DATA TABLES
7,000
7,500
8,000
8,500
9,000
9,500
10,000
10,500
11,000
8,180 1,566 6,614 208 4,400 1,661 15 195
8,167 1,685 6,482 241 4,358 1,683 15 185
8,525 1,708 6,817 269 4,557 1,760 15 215
8,704 1,753 6,951 297 4,566 1,858 20 210
8,714 1,780 6,934 322 4,386 1,970 30 226
9,041 1,766 7,275 361 4,646 2,002 20 246
9,024 1,819 7,205 424 4,483 2,034 27 237
9,307 1,919 7,388 459 4,514 2,104 26 236
9,756 1,917 7,839 522 4,602 2,438 31 246
9,852 1,719 8,133 594 4,697 2,507 26 309
9,817 1,774 8,043 702 4,521 2,502 36 276 38
10,015 1,768 8,247 680 4,623 2,563 33 342 55
9,759 1,689 8,070 805 4,362 2,577 26 294 46
9,829 1,598 8,231 864 4,466 2,547 35 317
9,744 1,641 8,103 872 4,302 2,583 27 322
9,509 1,526 7,983 916 4,230 2,483 35 314
9,572 1,416 8,156 1,026 4,266 2,496 33 323
9,809 1,408 8,401 1,098 4,242 2,649 41 370
9,689 1,266 8,423 1,125 4,254 2,629 45 376
9,665 1,141 8,524 1,300 4,219 2,567 55 412
9,929 1,070 8,859 1,431 4,408 2,590 59 406
9,776 1,004 8,772 1,416 4,289 2,629 52 415
9,852 913 8,939 1,617 4,252 2,617 55 448
10,303 1,104 9,199 1,669 4,518 2,572 50 457
10,201 1,114 9,088 1,639 4,388 2,633 48 430
10,297 1,083 9,214 1,686 4,326 2,800 39 471
9,840 1,022 8,818 1,508 4,135 2,775 37 460
9,658 1,001 8,657 1,302 4,241 2,649 28 461
9,569 1,007 8,562 1,277 4,180 2,602 43 486
9,355 986 8,369 1,220 4,119 2,496 21 509
9,205 965 8,240 1,223 3,979 2,553 21 473
9,326 976 8,350 1,399 3,953 2,457 20 563
D E L AWA R E
2011-12 2021-22 2031-32
9,326
PublicPublic & Private
11K
7K
10,015• 9,800 high school graduates, on average, projected per year between school years 2011-12 and 2031-32.
• The total number of graduates is projected to increase by 2.9% between 2011-12 and 2023-24, the next highest year for Delaware.
10,303
December 2016 63

Notes: School Year refers to the K-12 calendar running fall to spring and may include graduates from any point in that school year, including the summer after the year end. The Grand Total is the sum of the Private Schools and Public Schools totals. The Private Schools Total includes schools not supported primarily by public funds, religious and nonsectarian, but not including homeschool students. Private Schools projections begin in school year 2011-12. The Public Schools Total will not exactly equal the sum of the races/ethnicities columns, which are projected separately. Prior to 2010-11, data were not available separately for Asian and Pacific Islander students, and Two or More Races students. Hawai‘ian/Pacific Islander and Two or More Races counts are displayed separately in the years they were reported for informational purposes, but are included in the race categories in the projected years. For more detailed information, see Appendix C: Technical Information and Methodology at www.wiche.edu/knocking.Source: Western Interstate Commission for Higher Education, Knocking at the College Door: Projections of High School Graduates, 2016.
American Asian/Pacific White Black Indian/ Islander AlaskaNative (combined)
Hispanic Non-HispanicPUBLIC
SCHOOLSTOTAL
PRIVATESCHOOLS
TOTALGRANDTOTAL
Hawai‘ian/Pacific
Islander
Two or More Races
School Year Alone, or Any Race
Available Data for Additional
Race Categories
Repo
rted
Cou
nts
of H
igh
Scho
ol G
radu
ates
Proj
ectio
ns o
f Hig
h Sc
hool
Gra
duat
es
2000-01
2001-02
2002-03
2003-04
2004-05
2005-06
2006-07
2007-08
2008-09
2009-10
2010-11
2011-12
2012-13
2013-14
2014-15
2015-16
2016-17
2017-18
2018-19
2019-20
2020-21
2021-22
2022-23
2023-24
2024-25
2025-26
2026-27
2027-28
2028-29
2029-30
2030-31
2031-32
AT THE COLLEGE DOORKNOCKING APPENDIX A . HIGH SCHOOL GRADUATE DATA TABLES
3,000
3,500
4,000
4,500
5,000
5,500
6,000
6,500
7,000
4,363 1,555 2,808 215 117 2,401 3 72
4,469 1,379 3,090 209 128 2,684 3 66
3,927 1,202 2,725 199 110 2,339 2 75
4,096 1,065 3,031 239 114 2,607 10 61
4,228 1,447 2,781 214 127 2,379 5 56
4,404 1,541 2,863 226 118 2,478 0 78
4,609 1,665 2,944 190 108 2,712 2 67
5,062 1,710 3,352 277 144 2,871 3 58
4,856 1,339 3,517 245 131 3,084 2 55
4,927 1,325 3,602 309 129 3,097 2 65
4,990 1,513 3,477 334 138 2,965 4 36 4 20
5,419 1,559 3,860 284 149 3,362 13 52 9 44
5,571 1,610 3,961 422 155 3,313 8 63 5 303
5,351 1,595 3,755 421 167 3,093 N/A 50
5,398 1,570 3,828 408 203 3,143 N/A 62
5,394 1,508 3,886 453 217 3,146 N/A 63
5,305 1,471 3,834 476 255 3,051 N/A 62
5,397 1,453 3,944 565 295 3,030 N/A 73
5,305 1,304 4,001 590 325 3,039 N/A 80
5,087 1,246 3,841 594 366 2,835 N/A 90
5,013 1,132 3,881 641 369 2,824 N/A 86
5,044 1,046 3,999 656 413 2,888 N/A 86
5,379 1,019 4,361 757 482 3,096 N/A 75
5,910 1,224 4,686 880 518 3,266 N/A 87
6,450 1,273 5,177 985 596 3,579 N/A 94
6,305 1,281 5,024 1,013 564 3,395 N/A 97
6,202 1,249 4,953 1,016 557 3,274 N/A 125
6,346 1,270 5,076 914 602 3,351 N/A 163
6,475 1,304 5,171 921 636 3,293 N/A 174
6,562 1,318 5,244 923 681 3,289 N/A 180
6,447 1,298 5,149 838 668 3,274 N/A 189
6,596 1,326 5,269 862 712 3,256 N/A 193
D I S T R I C T O F C O L U M B I A
2011-12 2021-22 2031-32
6,596
PublicPublic & Private
7K
3K
5,419• 5,800 high school graduates, on average, projected per year between school years 2011-12 and 2031-32.
• The total number of graduates is projected to increase by 21.7% between 2011-12 and 2031-32, the next highest year for District of Columbia.
Projections of High School Graduates64

Notes: School Year refers to the K-12 calendar running fall to spring and may include graduates from any point in that school year, including the summer after the year end. The Grand Total is the sum of the Private Schools and Public Schools totals. The Private Schools Total includes schools not supported primarily by public funds, religious and nonsectarian, but not including homeschool students. Private Schools projections begin in school year 2011-12. The Public Schools Total will not exactly equal the sum of the races/ethnicities columns, which are projected separately. Prior to 2010-11, data were not available separately for Asian and Pacific Islander students, and Two or More Races students. Hawai‘ian/Pacific Islander and Two or More Races counts are displayed separately in the years they were reported for informational purposes, but are included in the race categories in the projected years. For more detailed information, see Appendix C: Technical Information and Methodology at www.wiche.edu/knocking.Source: Western Interstate Commission for Higher Education, Knocking at the College Door: Projections of High School Graduates, 2016.
American Asian/Pacific White Black Indian/ Islander AlaskaNative (combined)
Hispanic Non-HispanicPUBLIC
SCHOOLSTOTAL
PRIVATESCHOOLS
TOTALGRANDTOTAL
Hawai‘ian/Pacific
Islander
Two or More Races
School Year Alone, or Any Race
Available Data for Additional
Race Categories
Repo
rted
Cou
nts
of H
igh
Scho
ol G
radu
ates
Proj
ectio
ns o
f Hig
h Sc
hool
Gra
duat
es
2000-01
2001-02
2002-03
2003-04
2004-05
2005-06
2006-07
2007-08
2008-09
2009-10
2010-11
2011-12
2012-13
2013-14
2014-15
2015-16
2016-17
2017-18
2018-19
2019-20
2020-21
2021-22
2022-23
2023-24
2024-25
2025-26
2026-27
2027-28
2028-29
2029-30
2030-31
2031-32
AT THE COLLEGE DOORKNOCKING APPENDIX A . HIGH SCHOOL GRADUATE DATA TABLES
140,000
150,000
160,000
170,000
180,000
190,000
200,000
125,227 14,115 111,112 17,943 66,205 23,608 288 3,068
134,557 15,020 119,537 20,067 70,862 24,960 303 3,345
144,867 17,383 127,484 22,041 75,891 25,835 363 3,354
149,449 18,031 131,418 23,925 77,115 26,342 491 3,545
150,142 16,824 133,318 25,330 77,144 26,569 551 3,724
152,041 17,355 134,686 26,495 76,980 26,759 434 4,018
160,867 18,583 142,284 28,861 78,413 28,099 405 4,234
168,757 19,711 149,046 31,721 79,596 30,239 443 4,255
171,716 18,255 153,461 34,079 78,933 32,167 451 4,436
174,804 18,674 156,130 36,397 77,375 33,748 502 4,540
175,553 20,060 155,493 38,614 78,119 33,598 615 4,547 158 3,606
170,505 18,541 151,964 38,183 76,637 31,824 615 4,705 146 3,859
176,317 18,288 158,029 42,010 76,743 33,648 652 4,976 152 4,179
179,533 18,168 161,365 44,020 76,818 34,541 596 5,127
180,670 18,096 162,574 45,844 76,045 34,969 661 5,459
177,533 17,246 160,287 46,790 74,698 34,145 735 5,269
177,707 16,893 160,814 48,318 73,991 34,516 698 5,328
181,306 16,727 164,579 50,650 74,324 35,890 710 5,747
181,999 16,081 165,917 52,624 73,831 36,327 713 6,016
177,270 15,636 161,634 52,609 71,399 35,409 728 6,014
176,934 15,067 161,867 54,497 70,908 35,151 693 6,337
178,139 14,455 163,684 56,489 71,661 35,180 616 6,620
181,350 14,134 167,217 59,020 72,145 36,713 534 6,763
187,372 16,318 171,054 62,604 72,858 37,674 577 6,777
193,017 16,497 176,520 66,571 73,954 39,577 609 6,907
187,320 15,712 171,608 62,239 71,976 39,085 529 7,109
178,507 14,867 163,640 58,015 68,601 38,258 471 6,935
172,510 14,398 158,113 55,413 66,682 37,332 294 6,653
171,513 14,465 157,048 54,550 65,991 36,860 319 6,825
171,681 14,447 157,234 54,044 65,880 37,188 314 6,973
173,546 14,561 158,985 55,300 66,889 36,961 293 6,806
177,129 14,852 162,277 57,693 68,399 37,092 319 6,979
F L O R I D A
2011-12 2021-22 2031-32
177,129
PublicPublic & Private
200K
140K
170,505• 4th highest producer of high school graduates with
178,700 high school graduates, on average, projected per year between school years 2011-12 and 2031-32.
• The total number of graduates is projected to increase by 13.2% between 2011-12 and 2024-25, the next highest year for Florida.
193,017
December 2016 65

Notes: School Year refers to the K-12 calendar running fall to spring and may include graduates from any point in that school year, including the summer after the year end. The Grand Total is the sum of the Private Schools and Public Schools totals. The Private Schools Total includes schools not supported primarily by public funds, religious and nonsectarian, but not including homeschool students. Private Schools projections begin in school year 2011-12. The Public Schools Total will not exactly equal the sum of the races/ethnicities columns, which are projected separately. Prior to 2010-11, data were not available separately for Asian and Pacific Islander students, and Two or More Races students. Hawai‘ian/Pacific Islander and Two or More Races counts are displayed separately in the years they were reported for informational purposes, but are included in the race categories in the projected years. For more detailed information, see Appendix C: Technical Information and Methodology at www.wiche.edu/knocking.Source: Western Interstate Commission for Higher Education, Knocking at the College Door: Projections of High School Graduates, 2016.
American Asian/Pacific White Black Indian/ Islander AlaskaNative (combined)
Hispanic Non-HispanicPUBLIC
SCHOOLSTOTAL
PRIVATESCHOOLS
TOTALGRANDTOTAL
Hawai‘ian/Pacific
Islander
Two or More Races
School Year Alone, or Any Race
Available Data for Additional
Race Categories
Repo
rted
Cou
nts
of H
igh
Scho
ol G
radu
ates
Proj
ectio
ns o
f Hig
h Sc
hool
Gra
duat
es
2000-01
2001-02
2002-03
2003-04
2004-05
2005-06
2006-07
2007-08
2008-09
2009-10
2010-11
2011-12
2012-13
2013-14
2014-15
2015-16
2016-17
2017-18
2018-19
2019-20
2020-21
2021-22
2022-23
2023-24
2024-25
2025-26
2026-27
2027-28
2028-29
2029-30
2030-31
2031-32
AT THE COLLEGE DOORKNOCKING APPENDIX A . HIGH SCHOOL GRADUATE DATA TABLES
85,000
90,000
95,000
100,000
105,000
110,000
115,000
120,000
69,121 6,622 62,499 1,281 39,353 19,795 82 1,988
72,834 6,851 65,983 1,593 40,801 21,357 81 2,151
73,969 7,079 66,890 1,867 41,499 21,266 81 2,177
75,873 7,323 68,550 2,122 41,289 22,030 98 2,250
78,136 7,302 70,834 2,590 41,903 23,034 88 2,342
81,111 7,613 73,498 3,003 42,959 24,829 82 2,625
85,403 7,574 77,829 3,515 43,936 26,195 94 2,798
91,672 8,167 83,505 4,309 45,701 29,010 145 2,868
96,325 8,322 88,003 5,052 45,921 31,949 140 3,101
99,776 8,215 91,561 6,649 47,038 34,168 230 3,476 83 2,117
100,099 7,761 92,338 7,272 46,517 34,738 238 3,573 70 2,283
98,481 7,899 90,582 7,359 45,727 33,574 231 3,690 75 2,293
99,939 7,523 92,416 8,275 46,231 33,811 214 3,885 77 2,472
102,511 7,743 94,767 8,925 47,177 34,318 217 4,094
103,393 7,743 95,649 9,733 47,475 34,327 236 4,255
104,126 7,455 96,671 10,147 47,587 34,770 244 4,347
103,912 7,145 96,767 10,681 47,213 34,687 249 4,356
106,728 7,187 99,540 11,637 47,660 35,934 252 4,680
108,051 6,929 101,123 12,865 47,384 36,450 238 4,990
106,367 6,690 99,677 13,396 46,570 35,485 276 5,078
104,714 6,308 98,406 13,504 45,901 34,772 274 5,389
105,313 6,169 99,145 14,062 46,031 34,897 302 5,596
106,005 5,710 100,295 14,885 45,637 35,753 284 5,670
109,349 6,707 102,642 15,674 45,674 37,439 304 5,732
111,911 6,840 105,071 16,271 45,542 39,490 347 5,963
109,613 6,528 103,085 17,588 42,670 39,082 222 6,215
105,484 6,229 99,255 16,659 41,414 37,369 264 6,170
99,637 5,879 93,759 14,280 39,899 35,941 267 5,967
98,386 5,879 92,507 12,522 39,408 34,822 223 6,350
96,920 5,787 91,133 11,734 39,225 34,647 234 6,513
95,876 5,704 90,173 11,453 38,634 34,739 214 6,288
97,478 5,793 91,686 11,613 39,107 35,215 241 6,781
G E O R G I A
2011-12 2021-22 2031-32
97,478
PublicPublic & Private
120K
85K
98,481
• 103,500 high school graduates, on average, projected per year between school years 2011-12 and 2031-32.
• The total number of graduates is projected to increase by 13.6% between 2011-12 and 2024-25, the next highest year for Georgia.
109,349
Projections of High School Graduates66

Notes: School Year refers to the K-12 calendar running fall to spring and may include graduates from any point in that school year, including the summer after the year end. The Grand Total is the sum of the Private Schools and Public Schools totals. The Private Schools Total includes schools not supported primarily by public funds, religious and nonsectarian, but not including homeschool students. Private Schools projections begin in school year 2011-12. The Public Schools Total will not exactly equal the sum of the races/ethnicities columns, which are projected separately. Prior to 2010-11, data were not available separately for Asian and Pacific Islander students, and Two or More Races students. Hawai‘ian/Pacific Islander and Two or More Races counts are displayed separately in the years they were reported for informational purposes, but are included in the race categories in the projected years. For more detailed information, see Appendix C: Technical Information and Methodology at www.wiche.edu/knocking.Source: Western Interstate Commission for Higher Education, Knocking at the College Door: Projections of High School Graduates, 2016.
American Asian/Pacific White Black Indian/ Islander AlaskaNative (combined)
Hispanic Non-HispanicPUBLIC
SCHOOLSTOTAL
PRIVATESCHOOLS
TOTALGRANDTOTAL
Hawai‘ian/Pacific
Islander
Two or More Races
School Year Alone, or Any Race
Available Data for Additional
Race Categories
Repo
rted
Cou
nts
of H
igh
Scho
ol G
radu
ates
Proj
ectio
ns o
f Hig
h Sc
hool
Gra
duat
es
2000-01
2001-02
2002-03
2003-04
2004-05
2005-06
2006-07
2007-08
2008-09
2009-10
2010-11
2011-12
2012-13
2013-14
2014-15
2015-16
2016-17
2017-18
2018-19
2019-20
2020-21
2021-22
2022-23
2023-24
2024-25
2025-26
2026-27
2027-28
2028-29
2029-30
2030-31
2031-32
AT THE COLLEGE DOORKNOCKING APPENDIX A . HIGH SCHOOL GRADUATE DATA TABLES
10,000
11,000
12,000
13,000
14,000
15,000
16,000
17,000
13,490 3,388 10,102 441 1,917 177 33 7,534
13,536 3,084 10,452 467 2,013 167 34 7,771
12,793 2,780 10,013 477 1,924 192 35 7,385
12,953 2,629 10,324 465 1,991 167 32 7,669
13,396 2,583 10,813 489 2,094 183 44 8,003
13,080 2,158 10,922 429 2,068 201 27 8,197
13,448 2,385 11,063 450 2,071 197 44 8,301
14,137 2,524 11,613 468 2,157 217 53 8,718
14,167 2,659 11,508 487 2,065 226 57 8,673
13,692 2,694 10,998 481 1,954 210 56 8,297
13,476 2,760 10,716 378 1,533 256 41 8,508 3,204 708
14,113 2,753 11,360 477 1,659 271 61 8,892 3,344 828
13,733 2,943 10,790 504 1,471 239 45 8,531 3,264 624
14,088 3,025 11,063 587 1,661 244 36 8,195
13,818 2,956 10,862 655 1,466 264 42 8,104
13,349 2,769 10,580 632 1,294 234 51 8,095
13,330 2,864 10,466 688 1,221 239 48 7,953
14,043 2,973 11,070 787 1,276 236 60 8,395
13,702 3,089 10,613 772 1,165 232 36 8,079
14,102 2,940 11,163 901 1,232 237 35 8,387
14,360 3,009 11,350 891 1,215 230 31 8,603
14,576 3,063 11,512 910 1,190 212 25 8,721
14,855 2,974 11,882 1,008 1,221 222 27 8,856
15,221 3,206 12,015 2,020 1,143 214 19 8,029
15,838 3,211 12,627 2,185 1,220 240 16 8,167
15,866 3,263 12,603 2,073 1,322 245 24 9,046
15,376 3,164 12,212 2,122 1,255 206 24 8,732
15,504 3,181 12,323 2,009 1,293 258 19 8,564
15,455 3,180 12,275 2,056 1,304 256 24 8,250
15,507 3,182 12,325 2,010 1,278 251 20 8,500
15,491 3,182 12,308 2,033 1,339 276 16 8,362
15,130 3,109 12,021 1,871 1,322 283 10 8,259
H AWA I ‘ I
2011-12 2021-22 2031-32
15,130
PublicPublic & Private
17K
10K
14,113• 14,600 high school graduates, on average, projected per year between school years 2011-12 and 2031-32.
• The total number of graduates is projected to increase by 12.4% between 2011-12 and 2025-26, the next highest year for Hawai‘i.
15,866
December 2016 67
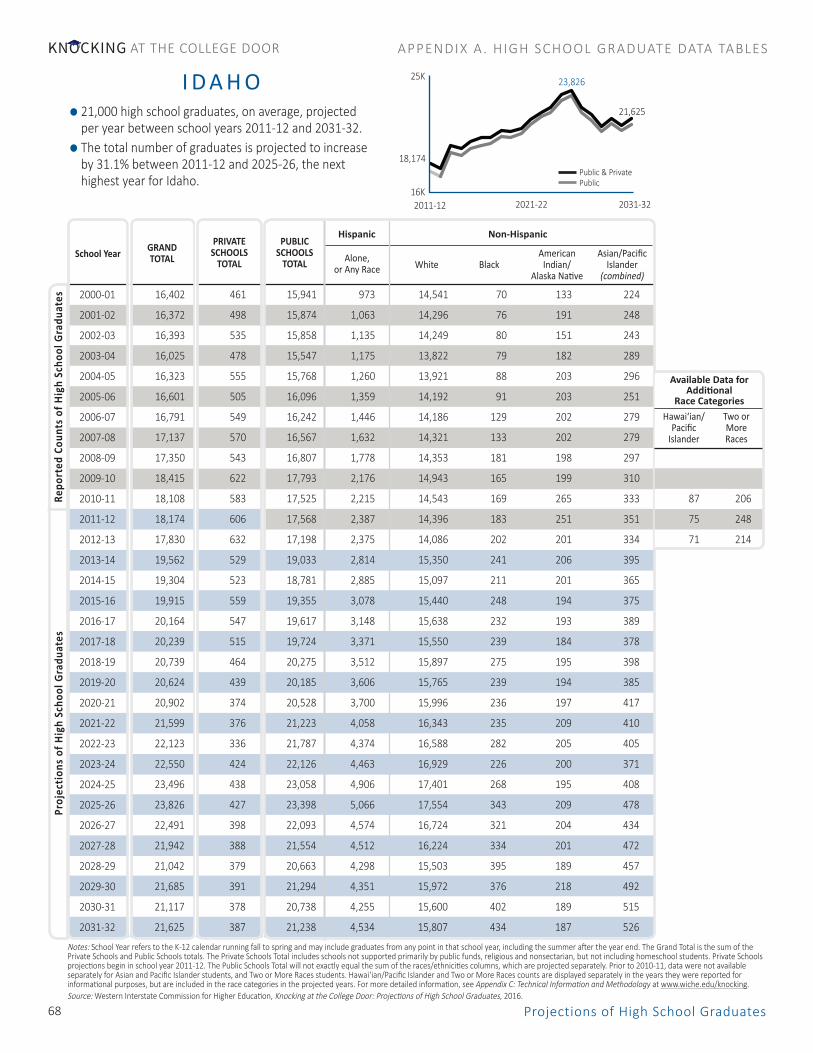
Notes: School Year refers to the K-12 calendar running fall to spring and may include graduates from any point in that school year, including the summer after the year end. The Grand Total is the sum of the Private Schools and Public Schools totals. The Private Schools Total includes schools not supported primarily by public funds, religious and nonsectarian, but not including homeschool students. Private Schools projections begin in school year 2011-12. The Public Schools Total will not exactly equal the sum of the races/ethnicities columns, which are projected separately. Prior to 2010-11, data were not available separately for Asian and Pacific Islander students, and Two or More Races students. Hawai‘ian/Pacific Islander and Two or More Races counts are displayed separately in the years they were reported for informational purposes, but are included in the race categories in the projected years. For more detailed information, see Appendix C: Technical Information and Methodology at www.wiche.edu/knocking.Source: Western Interstate Commission for Higher Education, Knocking at the College Door: Projections of High School Graduates, 2016.
American Asian/Pacific White Black Indian/ Islander AlaskaNative (combined)
Hispanic Non-HispanicPUBLIC
SCHOOLSTOTAL
PRIVATESCHOOLS
TOTALGRANDTOTAL
Hawai‘ian/Pacific
Islander
Two or More Races
School Year Alone, or Any Race
Available Data for Additional
Race Categories
Repo
rted
Cou
nts
of H
igh
Scho
ol G
radu
ates
Proj
ectio
ns o
f Hig
h Sc
hool
Gra
duat
es
2000-01
2001-02
2002-03
2003-04
2004-05
2005-06
2006-07
2007-08
2008-09
2009-10
2010-11
2011-12
2012-13
2013-14
2014-15
2015-16
2016-17
2017-18
2018-19
2019-20
2020-21
2021-22
2022-23
2023-24
2024-25
2025-26
2026-27
2027-28
2028-29
2029-30
2030-31
2031-32
AT THE COLLEGE DOORKNOCKING APPENDIX A . HIGH SCHOOL GRADUATE DATA TABLES
16,000
18,000
20,000
22,000
24,000
16,402 461 15,941 973 14,541 70 133 224
16,372 498 15,874 1,063 14,296 76 191 248
16,393 535 15,858 1,135 14,249 80 151 243
16,025 478 15,547 1,175 13,822 79 182 289
16,323 555 15,768 1,260 13,921 88 203 296
16,601 505 16,096 1,359 14,192 91 203 251
16,791 549 16,242 1,446 14,186 129 202 279
17,137 570 16,567 1,632 14,321 133 202 279
17,350 543 16,807 1,778 14,353 181 198 297
18,415 622 17,793 2,176 14,943 165 199 310
18,108 583 17,525 2,215 14,543 169 265 333 87 206
18,174 606 17,568 2,387 14,396 183 251 351 75 248
17,830 632 17,198 2,375 14,086 202 201 334 71 214
19,562 529 19,033 2,814 15,350 241 206 395
19,304 523 18,781 2,885 15,097 211 201 365
19,915 559 19,355 3,078 15,440 248 194 375
20,164 547 19,617 3,148 15,638 232 193 389
20,239 515 19,724 3,371 15,550 239 184 378
20,739 464 20,275 3,512 15,897 275 195 398
20,624 439 20,185 3,606 15,765 239 194 385
20,902 374 20,528 3,700 15,996 236 197 417
21,599 376 21,223 4,058 16,343 235 209 410
22,123 336 21,787 4,374 16,588 282 205 405
22,550 424 22,126 4,463 16,929 226 200 371
23,496 438 23,058 4,906 17,401 268 195 408
23,826 427 23,398 5,066 17,554 343 209 478
22,491 398 22,093 4,574 16,724 321 204 434
21,942 388 21,554 4,512 16,224 334 201 472
21,042 379 20,663 4,298 15,503 395 189 457
21,685 391 21,294 4,351 15,972 376 218 492
21,117 378 20,738 4,255 15,600 402 189 515
21,625 387 21,238 4,534 15,807 434 187 526
I D A H O
2011-12 2021-22 2031-32
21,625
PublicPublic & Private
25K
16K
18,174
• 21,000 high school graduates, on average, projected per year between school years 2011-12 and 2031-32.
• The total number of graduates is projected to increase by 31.1% between 2011-12 and 2025-26, the next highest year for Idaho.
23,826
Projections of High School Graduates68

Notes: School Year refers to the K-12 calendar running fall to spring and may include graduates from any point in that school year, including the summer after the year end. The Grand Total is the sum of the Private Schools and Public Schools totals. The Private Schools Total includes schools not supported primarily by public funds, religious and nonsectarian, but not including homeschool students. Private Schools projections begin in school year 2011-12. The Public Schools Total will not exactly equal the sum of the races/ethnicities columns, which are projected separately. Prior to 2010-11, data were not available separately for Asian and Pacific Islander students, and Two or More Races students. Hawai‘ian/Pacific Islander and Two or More Races counts are displayed separately in the years they were reported for informational purposes, but are included in the race categories in the projected years. For more detailed information, see Appendix C: Technical Information and Methodology at www.wiche.edu/knocking.Source: Western Interstate Commission for Higher Education, Knocking at the College Door: Projections of High School Graduates, 2016.
American Asian/Pacific White Black Indian/ Islander AlaskaNative (combined)
Hispanic Non-HispanicPUBLIC
SCHOOLSTOTAL
PRIVATESCHOOLS
TOTALGRANDTOTAL
Hawai‘ian/Pacific
Islander
Two or More Races
School Year Alone, or Any Race
Available Data for Additional
Race Categories
Repo
rted
Cou
nts
of H
igh
Scho
ol G
radu
ates
Proj
ectio
ns o
f Hig
h Sc
hool
Gra
duat
es
2000-01
2001-02
2002-03
2003-04
2004-05
2005-06
2006-07
2007-08
2008-09
2009-10
2010-11
2011-12
2012-13
2013-14
2014-15
2015-16
2016-17
2017-18
2018-19
2019-20
2020-21
2021-22
2022-23
2023-24
2024-25
2025-26
2026-27
2027-28
2028-29
2029-30
2030-31
2031-32
AT THE COLLEGE DOORKNOCKING APPENDIX A . HIGH SCHOOL GRADUATE DATA TABLES
100,000
140,000
180,000
126,245 15,621 110,624 10,855 79,210 15,498 172 4,889
132,054 15,397 116,657 12,242 82,454 16,294 433 5,234
132,680 15,173 117,507 13,098 83,112 15,886 234 5,177
139,254 14,491 124,763 14,561 86,179 18,341 255 5,427
137,967 14,352 123,615 14,926 83,613 18,771 363 5,514
141,822 15,005 126,817 15,764 85,503 19,482 252 5,816
145,325 15,105 130,220 16,128 85,552 21,116 422 5,963
150,282 15,139 135,143 18,411 87,097 21,728 318 6,000
146,777 15,107 131,670 19,616 82,749 21,887 242 5,600
154,304 15,269 139,035 22,320 83,547 24,859 284 5,827
149,458 14,502 134,956 22,783 82,485 23,233 431 6,025 165 2,696
154,138 14,563 139,575 25,771 82,769 24,262 407 6,367 110 2,874
153,252 14,024 139,228 26,687 82,898 22,695 375 6,574 112 3,276
149,249 13,524 135,725 26,975 79,497 22,076 352 6,716
152,293 13,319 138,974 29,048 79,680 23,169 400 6,953
145,482 12,393 133,090 28,575 77,071 21,133 423 6,861
144,617 11,849 132,767 29,176 76,775 20,862 425 6,948
146,800 11,443 135,357 30,836 76,926 21,121 494 7,672
145,526 10,999 134,527 31,884 76,209 20,472 460 7,649
143,207 10,369 132,838 32,282 75,102 19,942 529 7,744
142,340 10,037 132,303 33,241 74,578 19,263 535 8,173
143,210 9,734 133,476 34,136 75,036 19,374 576 8,533
140,373 9,202 131,170 34,353 73,337 18,967 631 8,679
140,738 9,843 130,895 35,011 72,689 19,331 673 8,490
142,631 9,851 132,780 36,137 73,312 19,864 761 8,808
138,936 9,548 129,387 34,316 71,155 19,288 638 9,091
134,538 9,199 125,339 32,352 69,646 18,724 605 8,878
129,704 8,864 120,840 29,907 68,494 17,870 564 8,821
126,640 8,707 117,933 28,682 67,328 16,983 457 8,831
125,082 8,590 116,491 27,974 66,019 17,063 491 9,124
123,295 8,458 114,837 26,849 65,729 16,761 507 8,920
124,559 8,540 116,019 27,116 66,010 16,997 467 9,185
I L L I N O I S
2011-12 2021-22 2031-32
124,559
PublicPublic & Private
180K
100K
154,138• 5th highest producer of high school graduates with 140,000 high school graduates, on average, projected per year between school years 2011-12 and 2031-32.
• The total number of graduates in Illinois is not projected to increase after 2011-12, ending at 124,600 in 2031-32.
December 2016 69

Notes: School Year refers to the K-12 calendar running fall to spring and may include graduates from any point in that school year, including the summer after the year end. The Grand Total is the sum of the Private Schools and Public Schools totals. The Private Schools Total includes schools not supported primarily by public funds, religious and nonsectarian, but not including homeschool students. Private Schools projections begin in school year 2011-12. The Public Schools Total will not exactly equal the sum of the races/ethnicities columns, which are projected separately. Prior to 2010-11, data were not available separately for Asian and Pacific Islander students, and Two or More Races students. Hawai‘ian/Pacific Islander and Two or More Races counts are displayed separately in the years they were reported for informational purposes, but are included in the race categories in the projected years. For more detailed information, see Appendix C: Technical Information and Methodology at www.wiche.edu/knocking.Source: Western Interstate Commission for Higher Education, Knocking at the College Door: Projections of High School Graduates, 2016.
American Asian/Pacific White Black Indian/ Islander AlaskaNative (combined)
Hispanic Non-HispanicPUBLIC
SCHOOLSTOTAL
PRIVATESCHOOLS
TOTALGRANDTOTAL
Hawai‘ian/Pacific
Islander
Two or More Races
School Year Alone, or Any Race
Available Data for Additional
Race Categories
Repo
rted
Cou
nts
of H
igh
Scho
ol G
radu
ates
Proj
ectio
ns o
f Hig
h Sc
hool
Gra
duat
es
2000-01
2001-02
2002-03
2003-04
2004-05
2005-06
2006-07
2007-08
2008-09
2009-10
2010-11
2011-12
2012-13
2013-14
2014-15
2015-16
2016-17
2017-18
2018-19
2019-20
2020-21
2021-22
2022-23
2023-24
2024-25
2025-26
2026-27
2027-28
2028-29
2029-30
2030-31
2031-32
AT THE COLLEGE DOORKNOCKING APPENDIX A . HIGH SCHOOL GRADUATE DATA TABLES
58,000
63,000
68,000
73,000
78,000
62,577 6,405 56,172 1,304 49,794 4,358 95 621
63,573 6,851 56,722 1,428 49,846 4,650 141 657
64,956 7,059 57,897 1,474 50,920 4,669 110 724
63,154 7,146 56,008 1,602 49,248 4,342 120 696
60,711 5,267 55,444 1,636 48,421 4,549 119 719
63,098 5,178 57,920 1,953 49,885 5,140 138 804
64,675 4,788 59,887 2,161 50,578 5,279 123 821
66,990 5,089 61,901 2,433 51,810 5,564 141 844
68,895 5,232 63,663 2,700 52,568 6,070 140 834
69,853 5,302 64,551 3,168 52,160 6,583 182 900
71,755 5,622 66,133 3,869 54,084 6,985 193 1,001 40 1,818
71,449 5,782 65,667 4,089 53,417 6,796 192 1,173 31 1,973
72,723 6,128 66,595 4,643 53,358 7,116 230 1,248 33 2,124
73,359 6,234 67,125 4,851 53,480 7,194 204 1,309
71,986 6,128 65,858 5,226 52,327 6,970 197 1,350
71,973 6,354 65,620 5,591 52,009 7,054 197 1,447
72,020 6,459 65,562 6,117 51,578 7,094 182 1,601
73,285 6,781 66,504 6,510 52,118 7,338 201 1,734
75,013 7,013 68,001 7,545 52,793 7,549 188 1,800
72,242 7,014 65,229 7,780 50,368 7,337 161 1,928
70,511 6,939 63,572 8,152 49,430 6,752 160 2,033
71,849 7,168 64,682 8,978 50,019 6,961 142 2,189
71,276 7,147 64,130 9,292 49,282 7,363 166 2,037
71,819 7,251 64,568 10,051 49,241 7,562 141 2,351
72,745 7,353 65,392 10,858 49,848 7,763 121 2,327
72,247 7,251 64,996 10,339 49,128 7,764 128 2,554
70,637 7,097 63,540 9,760 48,115 7,539 124 2,782
68,303 6,871 61,432 9,098 46,630 7,447 126 2,696
68,035 6,849 61,186 8,669 46,671 7,296 140 2,774
67,662 6,810 60,852 8,519 46,178 7,477 135 3,067
67,607 6,799 60,808 8,268 46,204 7,440 115 3,274
68,407 6,881 61,526 8,745 46,395 7,686 119 3,260
I N D I A N A
2011-12 2021-22 2031-32
68,407
PublicPublic & Private
79K
58K
71,449• 71,200 high school graduates, on average, projected per year between school years 2011-12 and 2031-32.
• The total number of graduates is projected to increase by 5.0% between 2011-12 and 2018-19, the next highest year for Indiana.
75,013
Projections of High School Graduates70

Notes: School Year refers to the K-12 calendar running fall to spring and may include graduates from any point in that school year, including the summer after the year end. The Grand Total is the sum of the Private Schools and Public Schools totals. The Private Schools Total includes schools not supported primarily by public funds, religious and nonsectarian, but not including homeschool students. Private Schools projections begin in school year 2011-12. The Public Schools Total will not exactly equal the sum of the races/ethnicities columns, which are projected separately. Prior to 2010-11, data were not available separately for Asian and Pacific Islander students, and Two or More Races students. Hawai‘ian/Pacific Islander and Two or More Races counts are displayed separately in the years they were reported for informational purposes, but are included in the race categories in the projected years. For more detailed information, see Appendix C: Technical Information and Methodology at www.wiche.edu/knocking.Source: Western Interstate Commission for Higher Education, Knocking at the College Door: Projections of High School Graduates, 2016.
American Asian/Pacific White Black Indian/ Islander AlaskaNative (combined)
Hispanic Non-HispanicPUBLIC
SCHOOLSTOTAL
PRIVATESCHOOLS
TOTALGRANDTOTAL
Hawai‘ian/Pacific
Islander
Two or More Races
School Year Alone, or Any Race
Available Data for Additional
Race Categories
Repo
rted
Cou
nts
of H
igh
Scho
ol G
radu
ates
Proj
ectio
ns o
f Hig
h Sc
hool
Gra
duat
es
2000-01
2001-02
2002-03
2003-04
2004-05
2005-06
2006-07
2007-08
2008-09
2009-10
2010-11
2011-12
2012-13
2013-14
2014-15
2015-16
2016-17
2017-18
2018-19
2019-20
2020-21
2021-22
2022-23
2023-24
2024-25
2025-26
2026-27
2027-28
2028-29
2029-30
2030-31
2031-32
AT THE COLLEGE DOORKNOCKING APPENDIX A . HIGH SCHOOL GRADUATE DATA TABLES
31,000
32,000
33,000
34,000
35,000
36,000
37,000
38,000
39,000
36,441 2,667 33,774 582 31,618 678 212 684
36,467 2,678 33,789 660 31,608 756 108 657
37,549 2,689 34,860 748 32,475 857 124 656
36,904 2,565 34,339 928 31,718 900 121 672
36,022 2,475 33,547 999 30,708 1,021 164 655
36,133 2,440 33,693 1,100 30,651 1,091 156 695
36,388 2,261 34,127 1,156 31,019 1,190 152 610
36,966 2,393 34,573 1,267 31,250 1,266 159 631
36,175 2,249 33,926 1,353 30,418 1,344 154 657
36,611 2,149 34,462 1,794 30,546 1,284 161 676 33 413
36,060 2,207 33,853 1,921 29,729 1,398 144 660 36 490
35,498 2,268 33,230 2,045 29,090 1,305 126 664 37 582
34,839 2,291 32,548 2,228 28,084 1,341 157 738 37 633
34,768 2,295 32,474 2,307 27,785 1,412 133 750
34,777 2,378 32,399 2,481 27,468 1,452 134 780
34,852 2,448 32,403 2,553 27,443 1,418 107 806
34,792 2,340 32,451 2,680 27,329 1,447 102 800
35,471 2,318 33,153 3,031 27,475 1,506 100 955
35,032 2,242 32,790 3,024 27,209 1,505 93 867
34,981 2,166 32,815 3,248 26,997 1,478 81 949
35,328 2,107 33,221 3,335 27,193 1,539 82 1,008
35,433 2,110 33,324 3,549 27,048 1,589 75 997
35,977 2,127 33,851 3,823 27,329 1,558 76 1,030
36,871 2,264 34,607 4,146 27,763 1,608 66 1,020
37,527 2,273 35,255 4,304 28,098 1,708 69 1,064
36,914 2,221 34,693 4,243 27,632 1,841 71 1,023
36,387 2,189 34,198 4,070 27,145 1,962 62 1,085
35,444 2,135 33,309 3,920 26,392 1,875 65 1,160
34,973 2,114 32,859 3,967 25,892 1,862 60 1,234
35,459 2,140 33,319 4,014 26,051 2,022 63 1,372
35,812 2,159 33,653 4,040 26,238 2,151 59 1,424
36,352 2,192 34,160 4,215 26,331 2,397 69 1,481
I O WA
2011-12 2021-22 2031-32
36,352
PublicPublic & Private
39K
31K
35,498• 35,600 high school graduates, on average, projected per year between school years 2011-12 and 2031-32.
• The total number of graduates is projected to increase by 5.7% between 2011-12 and 2024-25, the next highest year for Iowa.
37,527
December 2016 71

Notes: School Year refers to the K-12 calendar running fall to spring and may include graduates from any point in that school year, including the summer after the year end. The Grand Total is the sum of the Private Schools and Public Schools totals. The Private Schools Total includes schools not supported primarily by public funds, religious and nonsectarian, but not including homeschool students. Private Schools projections begin in school year 2011-12. The Public Schools Total will not exactly equal the sum of the races/ethnicities columns, which are projected separately. Prior to 2010-11, data were not available separately for Asian and Pacific Islander students, and Two or More Races students. Hawai‘ian/Pacific Islander and Two or More Races counts are displayed separately in the years they were reported for informational purposes, but are included in the race categories in the projected years. For more detailed information, see Appendix C: Technical Information and Methodology at www.wiche.edu/knocking.Source: Western Interstate Commission for Higher Education, Knocking at the College Door: Projections of High School Graduates, 2016.
American Asian/Pacific White Black Indian/ Islander AlaskaNative (combined)
Hispanic Non-HispanicPUBLIC
SCHOOLSTOTAL
PRIVATESCHOOLS
TOTALGRANDTOTAL
Hawai‘ian/Pacific
Islander
Two or More Races
School Year Alone, or Any Race
Available Data for Additional
Race Categories
Repo
rted
Cou
nts
of H
igh
Scho
ol G
radu
ates
Proj
ectio
ns o
f Hig
h Sc
hool
Gra
duat
es
2000-01
2001-02
2002-03
2003-04
2004-05
2005-06
2006-07
2007-08
2008-09
2009-10
2010-11
2011-12
2012-13
2013-14
2014-15
2015-16
2016-17
2017-18
2018-19
2019-20
2020-21
2021-22
2022-23
2023-24
2024-25
2025-26
2026-27
2027-28
2028-29
2029-30
2030-31
2031-32
AT THE COLLEGE DOORKNOCKING APPENDIX A . HIGH SCHOOL GRADUATE DATA TABLES
30,000
32,000
34,000
36,000
38,000
40,000
31,263 1,903 29,360 1,323 25,220 1,844 271 702
31,597 2,056 29,541 1,498 25,219 1,856 283 685
32,172 2,209 29,963 1,680 25,273 1,948 319 687
32,281 2,126 30,155 1,758 24,938 2,157 407 703
32,437 2,082 30,355 2,019 24,734 2,229 374 684
31,846 2,028 29,818 2,058 24,517 2,152 319 772
32,517 2,378 30,139 2,283 23,858 2,236 338 662
33,028 2,291 30,737 2,474 24,349 2,217 382 710
32,534 2,166 30,368 2,655 23,569 2,321 418 739
33,806 2,164 31,642 3,468 24,617 2,371 396 791 39 883
33,630 2,260 31,370 3,770 23,984 2,369 392 855 47 1,038
34,199 2,301 31,898 4,057 24,190 2,429 377 845 36 1,172
34,202 2,280 31,922 4,352 24,004 2,341 386 839 45 1,232
34,098 2,393 31,705 4,379 23,754 2,208 368 901
33,696 2,374 31,322 4,681 23,189 2,164 345 958
34,431 2,324 32,106 5,097 23,482 2,221 359 982
34,123 2,311 31,812 5,226 23,237 2,183 322 892
35,398 2,236 33,162 5,737 23,958 2,203 329 1,062
35,484 2,100 33,384 6,014 24,095 2,143 273 1,048
35,206 2,078 33,128 6,206 23,645 2,169 256 1,111
35,788 2,010 33,777 6,554 24,014 2,138 246 1,181
35,712 1,909 33,803 6,839 23,944 2,049 234 1,193
36,198 1,914 34,285 7,210 24,066 2,131 224 1,188
36,977 2,051 34,926 7,510 24,448 2,195 197 1,215
37,870 2,100 35,770 7,827 25,162 2,160 172 1,245
37,783 2,074 35,710 8,034 24,714 2,314 179 1,279
37,384 2,039 35,345 8,049 24,444 2,240 161 1,297
36,725 2,006 34,719 7,553 24,247 2,224 155 1,250
35,795 1,965 33,830 7,375 23,592 2,128 165 1,239
36,423 1,999 34,424 7,397 24,096 2,144 143 1,323
35,074 1,922 33,152 7,234 23,134 2,030 133 1,317
35,422 1,940 33,482 7,218 23,317 2,135 164 1,293
K A N S A S
2011-12 2021-22 2031-32
35,422
PublicPublic & Private
40K
30K
34,199
• 35,600 high school graduates, on average, projected per year between school years 2011-12 and 2031-32.
• The total number of graduates is projected to increase by 10.7% between 2011-12 and 2024-25, the next highest year for Kansas.
37,870
Projections of High School Graduates72

Notes: School Year refers to the K-12 calendar running fall to spring and may include graduates from any point in that school year, including the summer after the year end. The Grand Total is the sum of the Private Schools and Public Schools totals. The Private Schools Total includes schools not supported primarily by public funds, religious and nonsectarian, but not including homeschool students. Private Schools projections begin in school year 2011-12. The Public Schools Total will not exactly equal the sum of the races/ethnicities columns, which are projected separately. Prior to 2010-11, data were not available separately for Asian and Pacific Islander students, and Two or More Races students. Hawai‘ian/Pacific Islander and Two or More Races counts are displayed separately in the years they were reported for informational purposes, but are included in the race categories in the projected years. For more detailed information, see Appendix C: Technical Information and Methodology at www.wiche.edu/knocking.Source: Western Interstate Commission for Higher Education, Knocking at the College Door: Projections of High School Graduates, 2016.
American Asian/Pacific White Black Indian/ Islander AlaskaNative (combined)
Hispanic Non-HispanicPUBLIC
SCHOOLSTOTAL
PRIVATESCHOOLS
TOTALGRANDTOTAL
Hawai‘ian/Pacific
Islander
Two or More Races
School Year Alone, or Any Race
Available Data for Additional
Race Categories
Repo
rted
Cou
nts
of H
igh
Scho
ol G
radu
ates
Proj
ectio
ns o
f Hig
h Sc
hool
Gra
duat
es
2000-01
2001-02
2002-03
2003-04
2004-05
2005-06
2006-07
2007-08
2008-09
2009-10
2010-11
2011-12
2012-13
2013-14
2014-15
2015-16
2016-17
2017-18
2018-19
2019-20
2020-21
2021-22
2022-23
2023-24
2024-25
2025-26
2026-27
2027-28
2028-29
2029-30
2030-31
2031-32
AT THE COLLEGE DOORKNOCKING APPENDIX A . HIGH SCHOOL GRADUATE DATA TABLES
38,000
40,000
42,000
44,000
46,000
48,000
50,000
40,611 3,654 36,957 232 33,421 2,995 40 269
40,067 3,730 36,337 249 32,556 3,151 31 350
41,460 3,806 37,654 385 33,772 3,124 45 328
41,559 3,772 37,787 586 33,385 3,387 50 347
42,117 3,718 38,399 406 33,984 3,527 60 409
42,090 3,641 38,449 469 33,095 3,505 56 389
43,127 4,028 39,099 491 33,566 3,687 51 405
43,613 4,274 39,339 585 34,185 3,769 53 390
45,788 3,937 41,851 710 36,044 4,213 44 417
46,722 4,058 42,664 835 36,672 4,573 51 533
47,158 4,127 43,031 966 36,952 4,574 48 490 17 302
46,882 4,240 42,642 1,053 36,412 4,554 51 571 27 403
47,290 4,402 42,888 1,236 36,311 4,637 120 584 27 510
46,929 4,237 42,692 1,295 36,428 4,331 77 631
46,251 4,295 41,956 1,506 35,532 4,382 70 661
46,223 3,978 42,245 1,649 35,556 4,582 76 668
45,461 3,869 41,592 1,819 34,922 4,460 64 710
46,388 3,877 42,512 2,063 35,353 4,734 93 827
46,380 3,795 42,585 2,486 35,170 4,732 66 920
44,613 3,516 41,097 2,719 33,698 4,744 64 850
44,820 3,456 41,364 3,026 33,869 4,635 67 1,008
44,497 3,408 41,089 3,202 33,693 4,507 62 1,080
43,487 3,246 40,240 3,556 32,823 4,480 58 1,031
44,897 3,598 41,298 4,332 33,289 4,719 58 1,084
45,846 3,661 42,185 4,800 33,949 4,920 57 1,116
45,623 3,568 42,054 4,429 33,753 5,035 50 1,141
44,857 3,498 41,360 4,499 33,000 5,014 45 1,266
43,292 3,382 39,910 4,317 31,875 4,801 65 1,222
42,969 3,380 39,588 4,244 31,547 4,758 52 1,352
43,313 3,404 39,909 4,164 31,931 4,648 45 1,457
43,306 3,394 39,912 4,091 31,914 4,789 42 1,340
43,662 3,421 40,241 4,278 31,960 4,910 51 1,486
K E N T U C K Y
2011-12 2021-22 2031-32
43,662
PublicPublic & Private
50K
38K
46,882
• 45,100 high school graduates, on average, projected per year between school years 2011-12 and 2031-32.
• The total number of graduates in Kentucky is not projected to increase after 2011-12, ending at 43,700 in 2031-32.
December 2016 73

Notes: School Year refers to the K-12 calendar running fall to spring and may include graduates from any point in that school year, including the summer after the year end. The Grand Total is the sum of the Private Schools and Public Schools totals. The Private Schools Total includes schools not supported primarily by public funds, religious and nonsectarian, but not including homeschool students. Private Schools projections begin in school year 2011-12. The Public Schools Total will not exactly equal the sum of the races/ethnicities columns, which are projected separately. Prior to 2010-11, data were not available separately for Asian and Pacific Islander students, and Two or More Races students. Hawai‘ian/Pacific Islander and Two or More Races counts are displayed separately in the years they were reported for informational purposes, but are included in the race categories in the projected years. For more detailed information, see Appendix C: Technical Information and Methodology at www.wiche.edu/knocking.Source: Western Interstate Commission for Higher Education, Knocking at the College Door: Projections of High School Graduates, 2016.
American Asian/Pacific White Black Indian/ Islander AlaskaNative (combined)
Hispanic Non-HispanicPUBLIC
SCHOOLSTOTAL
PRIVATESCHOOLS
TOTALGRANDTOTAL
Hawai‘ian/Pacific
Islander
Two or More Races
School Year Alone, or Any Race
Available Data for Additional
Race Categories
Repo
rted
Cou
nts
of H
igh
Scho
ol G
radu
ates
Proj
ectio
ns o
f Hig
h Sc
hool
Gra
duat
es
2000-01
2001-02
2002-03
2003-04
2004-05
2005-06
2006-07
2007-08
2008-09
2009-10
2010-11
2011-12
2012-13
2013-14
2014-15
2015-16
2016-17
2017-18
2018-19
2019-20
2020-21
2021-22
2022-23
2023-24
2024-25
2025-26
2026-27
2027-28
2028-29
2029-30
2030-31
2031-32
AT THE COLLEGE DOORKNOCKING APPENDIX A . HIGH SCHOOL GRADUATE DATA TABLES
35,000
37,000
39,000
41,000
43,000
45,000
47,000
49,000
46,712 8,398 38,314 509 21,873 15,046 208 678
46,680 8,775 37,905 484 21,252 15,322 225 622
46,761 9,151 37,610 534 21,393 14,827 231 625
46,065 9,046 37,019 591 20,740 14,782 235 671
43,965 7,956 36,009 572 20,243 14,262 262 670
41,055 7,780 33,275 533 19,483 12,396 237 626
41,805 7,531 34,274 556 19,767 13,051 242 658
42,077 7,676 34,401 672 19,616 13,253 238 622
43,758 8,136 35,622 718 19,589 14,346 287 682
44,843 8,270 36,573 933 19,496 15,178 245 721
43,352 7,508 35,844 1,057 19,216 14,607 255 709 9 216
43,759 7,084 36,675 1,160 19,175 15,352 267 721 7 240
44,525 7,017 37,508 1,259 19,792 15,430 274 753 25 288
45,236 6,788 38,448 1,321 19,946 15,997 301 820
43,871 6,312 37,559 1,408 19,587 15,437 275 795
44,915 6,079 38,836 1,613 20,134 15,954 302 789
44,319 6,139 38,180 1,903 19,824 15,410 278 811
46,235 6,000 40,235 2,083 20,581 16,468 284 827
45,047 5,528 39,519 2,217 20,166 16,069 268 856
44,880 5,285 39,595 2,440 19,911 16,185 270 877
43,977 5,172 38,805 2,663 19,741 15,472 248 929
43,058 4,807 38,250 3,000 19,442 15,049 259 962
43,388 4,635 38,753 3,398 19,630 15,138 222 950
44,533 4,974 39,558 3,838 19,620 15,613 223 945
46,128 5,179 40,949 4,450 20,443 15,821 210 1,011
45,092 5,056 40,037 5,190 19,608 15,621 256 1,037
44,947 4,999 39,948 5,593 19,532 15,402 243 1,155
43,475 4,822 38,653 5,684 18,649 14,988 256 1,169
43,072 4,801 38,271 5,615 18,707 14,644 179 1,144
43,517 4,855 38,662 5,745 18,855 14,712 162 1,268
43,875 4,892 38,984 6,057 18,991 14,812 195 1,179
44,799 4,989 39,810 6,625 19,378 14,946 186 1,253
L O U I S I A N A
2011-12 2021-22 2031-32
35,422
PublicPublic & Private
49K
35K
34,199• 44,400 high school graduates, on average, projected per year between school years 2011-12 and 2031-32.
• The total number of graduates is projected to increase by 5.7% between 2011-12 and 2017-18, the next highest year for Louisiana.
37,870
Projections of High School Graduates74

Notes: School Year refers to the K-12 calendar running fall to spring and may include graduates from any point in that school year, including the summer after the year end. The Grand Total is the sum of the Private Schools and Public Schools totals. The Private Schools Total includes schools not supported primarily by public funds, religious and nonsectarian, but not including homeschool students. Private Schools projections begin in school year 2011-12. The Public Schools Total will not exactly equal the sum of the races/ethnicities columns, which are projected separately. Prior to 2010-11, data were not available separately for Asian and Pacific Islander students, and Two or More Races students. Hawai‘ian/Pacific Islander and Two or More Races counts are displayed separately in the years they were reported for informational purposes, but are included in the race categories in the projected years. For more detailed information, see Appendix C: Technical Information and Methodology at www.wiche.edu/knocking.Source: Western Interstate Commission for Higher Education, Knocking at the College Door: Projections of High School Graduates, 2016.
American Asian/Pacific White Black Indian/ Islander AlaskaNative (combined)
Hispanic Non-HispanicPUBLIC
SCHOOLSTOTAL
PRIVATESCHOOLS
TOTALGRANDTOTAL
Hawai‘ian/Pacific
Islander
Two or More Races
School Year Alone, or Any Race
Available Data for Additional
Race Categories
Repo
rted
Cou
nts
of H
igh
Scho
ol G
radu
ates
Proj
ectio
ns o
f Hig
h Sc
hool
Gra
duat
es
2000-01
2001-02
2002-03
2003-04
2004-05
2005-06
2006-07
2007-08
2008-09
2009-10
2010-11
2011-12
2012-13
2013-14
2014-15
2015-16
2016-17
2017-18
2018-19
2019-20
2020-21
2021-22
2022-23
2023-24
2024-25
2025-26
2026-27
2027-28
2028-29
2029-30
2030-31
2031-32
AT THE COLLEGE DOORKNOCKING APPENDIX A . HIGH SCHOOL GRADUATE DATA TABLES
10,000
11,000
12,000
13,000
14,000
15,000
16,000
17,000
14,699 2,045 12,654 79 12,295 84 75 121
15,002 2,409 12,593 61 12,201 110 77 144
15,719 2,772 12,947 74 12,498 149 78 148
16,335 3,057 13,278 76 12,822 172 71 137
15,427 2,350 13,077 92 12,552 173 88 172
15,550 2,600 12,950 107 12,359 219 69 196
15,769 2,618 13,151 103 12,561 227 76 184
17,044 2,694 14,350 129 13,629 285 73 234
16,455 2,362 14,093 116 13,397 274 90 216
16,708 2,639 14,069 146 13,316 290 100 217
16,254 2,601 13,653 189 12,883 281 103 197 8 82
16,141 2,668 13,473 153 12,664 316 82 258 14 53
15,860 2,690 13,170 191 12,269 321 93 296 10 99
15,227 2,530 12,696 162 11,771 386 92 292
15,125 2,552 12,574 184 11,670 416 92 229
15,040 2,375 12,664 236 11,681 399 86 322
14,623 2,303 12,321 210 11,367 440 88 282
14,427 2,198 12,230 228 11,248 456 86 310
14,353 2,262 12,090 278 11,019 509 97 353
13,915 2,081 11,834 283 10,792 568 102 289
13,720 1,919 11,801 302 10,740 600 98 318
13,780 1,807 11,973 338 10,779 741 104 381
13,621 1,735 11,886 343 10,713 777 118 315
13,663 1,948 11,716 431 10,536 742 94 361
13,752 1,933 11,819 435 10,603 903 103 306
13,282 1,824 11,458 436 10,190 1,139 118 351
13,124 1,787 11,337 389 10,060 1,206 119 358
12,605 1,722 10,883 415 9,652 1,122 110 332
12,351 1,706 10,645 414 9,402 1,148 106 304
12,411 1,711 10,700 415 9,444 1,178 120 351
12,411 1,705 10,706 341 9,442 1,326 111 369
12,351 1,696 10,656 397 9,344 1,317 146 369
M A I N E
2011-12 2021-22 2031-32
12,351
PublicPublic & Private
17K
10K
16,141
• 13,900 high school graduates, on average, projected per year between school years 2011-12 and 2031-32.
• The total number of graduates in Maine is not projected to increase after 2011-12, ending at 12,400 in 2031-32.
December 2016 75

Notes: School Year refers to the K-12 calendar running fall to spring and may include graduates from any point in that school year, including the summer after the year end. The Grand Total is the sum of the Private Schools and Public Schools totals. The Private Schools Total includes schools not supported primarily by public funds, religious and nonsectarian, but not including homeschool students. Private Schools projections begin in school year 2011-12. The Public Schools Total will not exactly equal the sum of the races/ethnicities columns, which are projected separately. Prior to 2010-11, data were not available separately for Asian and Pacific Islander students, and Two or More Races students. Hawai‘ian/Pacific Islander and Two or More Races counts are displayed separately in the years they were reported for informational purposes, but are included in the race categories in the projected years. For more detailed information, see Appendix C: Technical Information and Methodology at www.wiche.edu/knocking.Source: Western Interstate Commission for Higher Education, Knocking at the College Door: Projections of High School Graduates, 2016.
American Asian/Pacific White Black Indian/ Islander AlaskaNative (combined)
Hispanic Non-HispanicPUBLIC
SCHOOLSTOTAL
PRIVATESCHOOLS
TOTALGRANDTOTAL
Hawai‘ian/Pacific
Islander
Two or More Races
School Year Alone, or Any Race
Available Data for Additional
Race Categories
Repo
rted
Cou
nts
of H
igh
Scho
ol G
radu
ates
Proj
ectio
ns o
f Hig
h Sc
hool
Gra
duat
es
2000-01
2001-02
2002-03
2003-04
2004-05
2005-06
2006-07
2007-08
2008-09
2009-10
2010-11
2011-12
2012-13
2013-14
2014-15
2015-16
2016-17
2017-18
2018-19
2019-20
2020-21
2021-22
2022-23
2023-24
2024-25
2025-26
2026-27
2027-28
2028-29
2029-30
2030-31
2031-32
AT THE COLLEGE DOORKNOCKING APPENDIX A . HIGH SCHOOL GRADUATE DATA TABLES
52,000
57,000
62,000
67,000
72,000
56,888 7,666 49,222 1,708 28,726 16,155 145 2,488
58,756 7,875 50,881 1,890 29,363 16,745 158 2,725
59,948 8,084 51,864 2,075 30,182 16,586 158 2,860
61,269 8,399 52,870 2,270 30,541 17,005 135 2,919
62,689 8,519 54,170 2,509 30,384 18,001 202 3,074
64,222 8,686 55,536 2,790 30,672 18,558 178 3,338
67,018 9,454 57,564 3,130 31,165 19,779 179 3,311
68,805 9,634 59,171 3,555 31,429 20,602 193 3,392
67,532 9,228 58,304 3,842 30,269 20,581 186 3,426
68,659 9,581 59,078 4,087 29,870 21,231 190 3,700
67,579 8,834 58,745 4,682 28,680 21,644 199 3,541 28 1,290
68,046 9,235 58,811 5,045 28,347 21,533 193 3,693 53 1,457
67,601 8,705 58,896 5,463 28,290 21,024 253 3,867 52 1,665
65,968 8,461 57,507 5,781 27,475 20,139 201 3,906
64,586 8,097 56,489 5,771 26,443 20,221 130 3,917
63,747 7,529 56,218 6,278 25,968 19,888 153 3,895
62,010 7,000 55,009 6,821 24,998 19,088 136 3,910
63,485 6,720 56,765 7,260 25,457 19,730 146 4,246
62,688 6,401 56,287 7,622 24,891 19,534 130 4,255
64,127 6,048 58,079 8,664 25,522 19,612 129 4,480
64,473 5,796 58,677 9,400 25,564 19,443 116 4,678
65,085 5,417 59,668 9,949 25,733 19,769 109 4,760
65,290 4,960 60,330 10,905 25,341 19,909 119 4,937
67,818 5,779 62,039 12,155 25,407 20,495 135 4,944
69,964 5,830 64,134 13,530 25,661 21,222 110 4,993
68,023 5,677 62,346 13,478 24,503 21,039 121 5,199
65,987 5,447 60,539 13,452 23,432 20,344 130 5,364
64,940 5,340 59,600 12,925 23,167 19,872 121 5,518
64,432 5,353 59,080 12,992 22,973 19,333 114 5,535
64,346 5,338 59,007 12,941 22,942 19,364 102 5,572
63,408 5,255 58,153 13,307 22,467 18,945 137 5,387
65,125 5,391 59,735 13,868 22,885 19,449 97 5,720
M A R Y L A N D
2011-12 2021-22 2031-32
65,125
PublicPublic & Private
72K
52K
68,046
• 65,300 high school graduates, on average, projected per year between school years 2011-12 and 2031-32.
• The total number of graduates is projected to increase by 2.8% between 2011-12 and 2024-25, the next highest year for Maryland.
69,964
Projections of High School Graduates76

Notes: School Year refers to the K-12 calendar running fall to spring and may include graduates from any point in that school year, including the summer after the year end. The Grand Total is the sum of the Private Schools and Public Schools totals. The Private Schools Total includes schools not supported primarily by public funds, religious and nonsectarian, but not including homeschool students. Private Schools projections begin in school year 2011-12. The Public Schools Total will not exactly equal the sum of the races/ethnicities columns, which are projected separately. Prior to 2010-11, data were not available separately for Asian and Pacific Islander students, and Two or More Races students. Hawai‘ian/Pacific Islander and Two or More Races counts are displayed separately in the years they were reported for informational purposes, but are included in the race categories in the projected years. For more detailed information, see Appendix C: Technical Information and Methodology at www.wiche.edu/knocking.Source: Western Interstate Commission for Higher Education, Knocking at the College Door: Projections of High School Graduates, 2016.
American Asian/Pacific White Black Indian/ Islander AlaskaNative (combined)
Hispanic Non-HispanicPUBLIC
SCHOOLSTOTAL
PRIVATESCHOOLS
TOTALGRANDTOTAL
Hawai‘ian/Pacific
Islander
Two or More Races
School Year Alone, or Any Race
Available Data for Additional
Race Categories
Repo
rted
Cou
nts
of H
igh
Scho
ol G
radu
ates
Proj
ectio
ns o
f Hig
h Sc
hool
Gra
duat
es
2000-01
2001-02
2002-03
2003-04
2004-05
2005-06
2006-07
2007-08
2008-09
2009-10
2010-11
2011-12
2012-13
2013-14
2014-15
2015-16
2016-17
2017-18
2018-19
2019-20
2020-21
2021-22
2022-23
2023-24
2024-25
2025-26
2026-27
2027-28
2028-29
2029-30
2030-31
2031-32
AT THE COLLEGE DOORKNOCKING APPENDIX A . HIGH SCHOOL GRADUATE DATA TABLES
57,000
62,000
67,000
72,000
77,000
64,079 9,686 54,393 3,845 43,704 4,222 105 2,517
65,478 10,206 55,272 3,526 44,973 3,944 136 2,693
66,712 10,725 55,987 3,676 45,373 4,089 137 2,712
68,803 10,477 58,326 4,205 46,535 4,584 129 2,873
70,607 10,942 59,665 4,532 47,369 4,638 173 2,953
72,283 11,011 61,272 5,358 48,093 4,765 151 2,905
74,338 10,435 63,903 5,918 49,287 4,791 141 3,004
76,050 10,853 65,197 6,377 49,566 5,161 161 3,072
75,888 10,630 65,258 6,972 49,465 5,319 173 3,377 49 902
75,330 10,868 64,462 6,979 48,712 5,220 182 3,369 80 966
74,858 10,134 64,724 7,184 48,642 5,384 158 3,356 70 1,028
75,369 10,212 65,157 7,421 48,386 5,590 153 3,607 63 1,131
76,452 10,092 66,360 7,941 48,315 5,994 156 3,954 74 1,268
74,792 9,727 65,065 7,836 47,328 5,705 135 3,981
74,490 9,618 64,872 8,126 46,698 5,727 161 3,985
75,204 9,355 65,848 8,517 46,929 5,938 146 4,049
73,335 8,994 64,341 8,495 45,433 5,813 137 4,071
73,992 9,062 64,930 8,900 45,116 5,986 118 4,525
73,563 8,527 65,037 9,086 44,735 6,112 116 4,706
72,534 8,067 64,467 9,434 43,661 6,124 119 4,827
72,867 8,037 64,831 9,731 43,484 6,092 133 5,078
72,444 7,706 64,738 10,100 42,849 6,229 120 5,102
71,223 7,342 63,882 10,502 41,377 6,491 102 5,095
72,282 7,672 64,610 11,387 40,749 6,752 114 5,267
73,421 7,689 65,731 11,845 40,895 7,044 103 5,544
71,632 7,576 64,056 11,512 39,906 6,861 138 5,642
69,787 7,352 62,435 11,585 38,403 6,884 107 5,622
67,870 7,133 60,737 11,215 37,260 6,755 87 5,559
68,225 7,187 61,038 13,328 35,331 6,831 94 5,756
67,586 7,115 60,471 13,340 34,544 6,689 86 6,119
66,895 7,047 59,848 13,089 34,188 6,767 87 5,864
67,005 7,056 59,950 13,453 33,807 6,829 85 5,982
M A S S A C H U S E T T S
2011-12 2021-22 2031-32
67,005
PublicPublic & Private
80K
57K
75,369
• 72,000 high school graduates, on average, projected per year between school years 2011-12 and 2031-32.
• The total number of graduates in Massachusetts is not projected to increase after 2011-12, ending at 67,000 in 2031-32.
December 2016 77
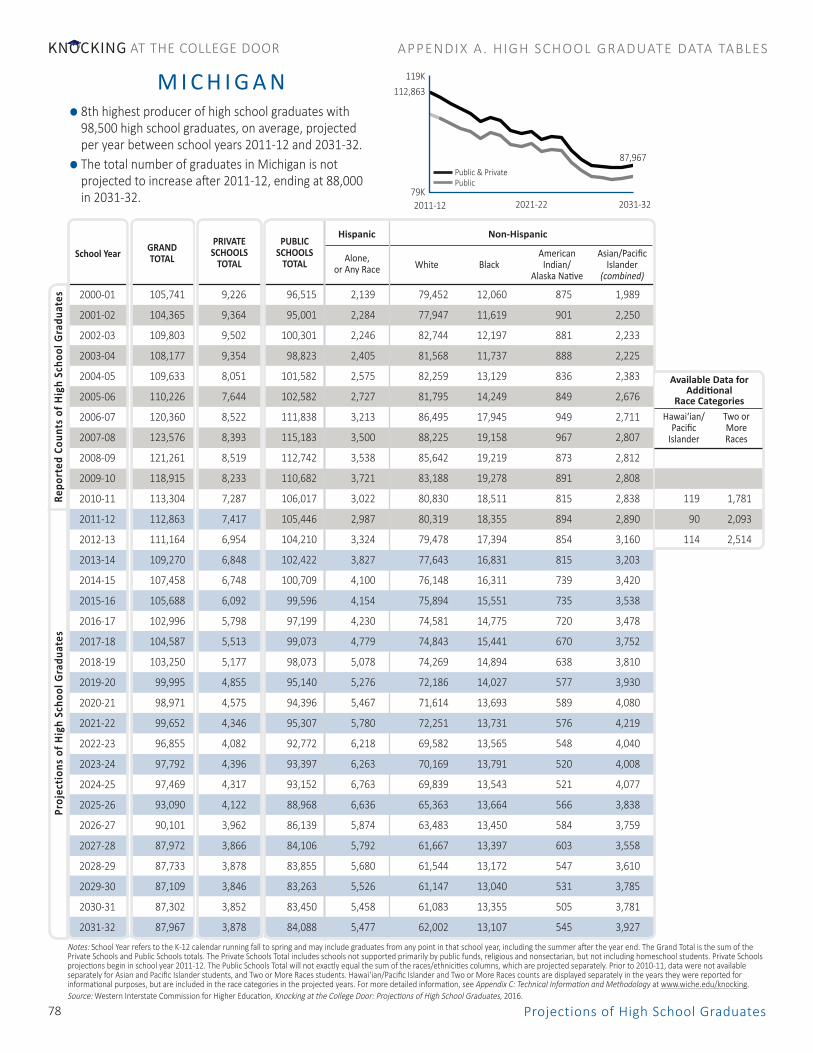
Notes: School Year refers to the K-12 calendar running fall to spring and may include graduates from any point in that school year, including the summer after the year end. The Grand Total is the sum of the Private Schools and Public Schools totals. The Private Schools Total includes schools not supported primarily by public funds, religious and nonsectarian, but not including homeschool students. Private Schools projections begin in school year 2011-12. The Public Schools Total will not exactly equal the sum of the races/ethnicities columns, which are projected separately. Prior to 2010-11, data were not available separately for Asian and Pacific Islander students, and Two or More Races students. Hawai‘ian/Pacific Islander and Two or More Races counts are displayed separately in the years they were reported for informational purposes, but are included in the race categories in the projected years. For more detailed information, see Appendix C: Technical Information and Methodology at www.wiche.edu/knocking.Source: Western Interstate Commission for Higher Education, Knocking at the College Door: Projections of High School Graduates, 2016.
American Asian/Pacific White Black Indian/ Islander AlaskaNative (combined)
Hispanic Non-HispanicPUBLIC
SCHOOLSTOTAL
PRIVATESCHOOLS
TOTALGRANDTOTAL
Hawai‘ian/Pacific
Islander
Two or More Races
School Year Alone, or Any Race
Available Data for Additional
Race Categories
Repo
rted
Cou
nts
of H
igh
Scho
ol G
radu
ates
Proj
ectio
ns o
f Hig
h Sc
hool
Gra
duat
es
2000-01
2001-02
2002-03
2003-04
2004-05
2005-06
2006-07
2007-08
2008-09
2009-10
2010-11
2011-12
2012-13
2013-14
2014-15
2015-16
2016-17
2017-18
2018-19
2019-20
2020-21
2021-22
2022-23
2023-24
2024-25
2025-26
2026-27
2027-28
2028-29
2029-30
2030-31
2031-32
AT THE COLLEGE DOORKNOCKING APPENDIX A . HIGH SCHOOL GRADUATE DATA TABLES
79,000
89,000
99,000
109,000
119,000
105,741 9,226 96,515 2,139 79,452 12,060 875 1,989
104,365 9,364 95,001 2,284 77,947 11,619 901 2,250
109,803 9,502 100,301 2,246 82,744 12,197 881 2,233
108,177 9,354 98,823 2,405 81,568 11,737 888 2,225
109,633 8,051 101,582 2,575 82,259 13,129 836 2,383
110,226 7,644 102,582 2,727 81,795 14,249 849 2,676
120,360 8,522 111,838 3,213 86,495 17,945 949 2,711
123,576 8,393 115,183 3,500 88,225 19,158 967 2,807
121,261 8,519 112,742 3,538 85,642 19,219 873 2,812
118,915 8,233 110,682 3,721 83,188 19,278 891 2,808
113,304 7,287 106,017 3,022 80,830 18,511 815 2,838 119 1,781
112,863 7,417 105,446 2,987 80,319 18,355 894 2,890 90 2,093
111,164 6,954 104,210 3,324 79,478 17,394 854 3,160 114 2,514
109,270 6,848 102,422 3,827 77,643 16,831 815 3,203
107,458 6,748 100,709 4,100 76,148 16,311 739 3,420
105,688 6,092 99,596 4,154 75,894 15,551 735 3,538
102,996 5,798 97,199 4,230 74,581 14,775 720 3,478
104,587 5,513 99,073 4,779 74,843 15,441 670 3,752
103,250 5,177 98,073 5,078 74,269 14,894 638 3,810
99,995 4,855 95,140 5,276 72,186 14,027 577 3,930
98,971 4,575 94,396 5,467 71,614 13,693 589 4,080
99,652 4,346 95,307 5,780 72,251 13,731 576 4,219
96,855 4,082 92,772 6,218 69,582 13,565 548 4,040
97,792 4,396 93,397 6,263 70,169 13,791 520 4,008
97,469 4,317 93,152 6,763 69,839 13,543 521 4,077
93,090 4,122 88,968 6,636 65,363 13,664 566 3,838
90,101 3,962 86,139 5,874 63,483 13,450 584 3,759
87,972 3,866 84,106 5,792 61,667 13,397 603 3,558
87,733 3,878 83,855 5,680 61,544 13,172 547 3,610
87,109 3,846 83,263 5,526 61,147 13,040 531 3,785
87,302 3,852 83,450 5,458 61,083 13,355 505 3,781
87,967 3,878 84,088 5,477 62,002 13,107 545 3,927
M I C H I G A N
2011-12 2021-22 2031-32
87,967
PublicPublic & Private
119K
79K
112,863
• 8th highest producer of high school graduates with 98,500 high school graduates, on average, projected per year between school years 2011-12 and 2031-32.
• The total number of graduates in Michigan is not projected to increase after 2011-12, ending at 88,000 in 2031-32.
Projections of High School Graduates78

Notes: School Year refers to the K-12 calendar running fall to spring and may include graduates from any point in that school year, including the summer after the year end. The Grand Total is the sum of the Private Schools and Public Schools totals. The Private Schools Total includes schools not supported primarily by public funds, religious and nonsectarian, but not including homeschool students. Private Schools projections begin in school year 2011-12. The Public Schools Total will not exactly equal the sum of the races/ethnicities columns, which are projected separately. Prior to 2010-11, data were not available separately for Asian and Pacific Islander students, and Two or More Races students. Hawai‘ian/Pacific Islander and Two or More Races counts are displayed separately in the years they were reported for informational purposes, but are included in the race categories in the projected years. For more detailed information, see Appendix C: Technical Information and Methodology at www.wiche.edu/knocking.Source: Western Interstate Commission for Higher Education, Knocking at the College Door: Projections of High School Graduates, 2016.
American Asian/Pacific White Black Indian/ Islander AlaskaNative (combined)
Hispanic Non-HispanicPUBLIC
SCHOOLSTOTAL
PRIVATESCHOOLS
TOTALGRANDTOTAL
Hawai‘ian/Pacific
Islander
Two or More Races
School Year Alone, or Any Race
Available Data for Additional
Race Categories
Repo
rted
Cou
nts
of H
igh
Scho
ol G
radu
ates
Proj
ectio
ns o
f Hig
h Sc
hool
Gra
duat
es
2000-01
2001-02
2002-03
2003-04
2004-05
2005-06
2006-07
2007-08
2008-09
2009-10
2010-11
2011-12
2012-13
2013-14
2014-15
2015-16
2016-17
2017-18
2018-19
2019-20
2020-21
2021-22
2022-23
2023-24
2024-25
2025-26
2026-27
2027-28
2028-29
2029-30
2030-31
2031-32
AT THE COLLEGE DOORKNOCKING APPENDIX A . HIGH SCHOOL GRADUATE DATA TABLES
53,000
58,000
63,000
68,000
61,144 4,563 56,581 916 50,714 1,840 643 2,468
62,023 4,583 57,440 1,032 51,052 2,122 661 2,573
64,034 4,602 59,432 1,139 52,363 2,495 736 2,699
63,890 4,794 59,096 1,238 51,688 2,510 799 2,861
62,663 4,272 58,391 1,322 50,749 2,637 848 2,837
62,915 4,017 58,898 1,501 50,551 2,973 778 3,095
64,427 4,930 59,497 1,690 50,534 3,323 890 3,060
65,486 5,077 60,409 1,788 50,762 3,678 830 3,351
63,970 4,241 59,729 1,997 49,455 3,969 901 3,407
63,969 4,302 59,667 2,176 49,048 4,194 902 3,347
64,062 4,705 59,357 2,485 48,561 4,119 698 3,495 32 457
62,086 4,585 57,501 2,497 46,875 3,869 671 3,589 46 582
62,871 4,616 58,255 2,827 46,735 4,293 674 3,725 26 851
60,719 4,572 56,147 2,796 44,881 4,051 647 3,587
61,115 4,396 56,719 3,166 44,876 4,109 629 3,716
60,515 4,246 56,269 3,160 44,553 4,116 611 3,614
60,914 4,049 56,866 3,531 44,278 4,377 584 3,769
61,766 4,022 57,744 3,572 44,428 4,658 586 4,157
62,303 3,809 58,494 3,973 44,454 4,829 593 4,174
61,508 3,581 57,927 4,113 43,676 4,778 580 4,276
62,751 3,393 59,358 4,208 44,899 4,810 567 4,411
64,107 3,315 60,792 4,731 45,322 5,140 555 4,456
63,982 3,221 60,762 4,712 45,294 5,198 496 4,538
65,482 3,595 61,888 5,064 45,718 5,498 497 4,491
66,921 3,583 63,338 5,374 46,089 5,877 515 4,789
65,359 3,469 61,890 5,032 44,697 5,996 546 5,176
63,737 3,365 60,372 4,920 43,638 5,785 529 5,042
61,839 3,271 58,568 4,481 42,473 5,795 479 4,916
61,634 3,285 58,348 4,045 42,138 5,698 488 4,927
62,061 3,300 58,762 4,246 41,987 6,153 452 5,323
62,382 3,311 59,071 4,094 42,106 6,526 478 5,258
63,042 3,345 59,697 4,095 42,185 6,843 458 5,533
M I N N E S OTA
2011-12 2021-22 2031-32
63,042
PublicPublic & Private
70K
53K
62,086• 62,700 high school graduates, on average, projected
per year between school years 2011-12 and 2031-32.• The total number of graduates is projected to increase
by 7.8% between 2011-12 and 2024-25, the next highest year for Minnesota.
66,921
December 2016 79

Notes: School Year refers to the K-12 calendar running fall to spring and may include graduates from any point in that school year, including the summer after the year end. The Grand Total is the sum of the Private Schools and Public Schools totals. The Private Schools Total includes schools not supported primarily by public funds, religious and nonsectarian, but not including homeschool students. Private Schools projections begin in school year 2011-12. The Public Schools Total will not exactly equal the sum of the races/ethnicities columns, which are projected separately. Prior to 2010-11, data were not available separately for Asian and Pacific Islander students, and Two or More Races students. Hawai‘ian/Pacific Islander and Two or More Races counts are displayed separately in the years they were reported for informational purposes, but are included in the race categories in the projected years. For more detailed information, see Appendix C: Technical Information and Methodology at www.wiche.edu/knocking.Source: Western Interstate Commission for Higher Education, Knocking at the College Door: Projections of High School Graduates, 2016.
American Asian/Pacific White Black Indian/ Islander AlaskaNative (combined)
Hispanic Non-HispanicPUBLIC
SCHOOLSTOTAL
PRIVATESCHOOLS
TOTALGRANDTOTAL
Hawai‘ian/Pacific
Islander
Two or More Races
School Year Alone, or Any Race
Available Data for Additional
Race Categories
Repo
rted
Cou
nts
of H
igh
Scho
ol G
radu
ates
Proj
ectio
ns o
f Hig
h Sc
hool
Gra
duat
es
2000-01
2001-02
2002-03
2003-04
2004-05
2005-06
2006-07
2007-08
2008-09
2009-10
2010-11
2011-12
2012-13
2013-14
2014-15
2015-16
2016-17
2017-18
2018-19
2019-20
2020-21
2021-22
2022-23
2023-24
2024-25
2025-26
2026-27
2027-28
2028-29
2029-30
2030-31
2031-32
AT THE COLLEGE DOORKNOCKING APPENDIX A . HIGH SCHOOL GRADUATE DATA TABLES
21,000
23,000
25,000
27,000
29,000
31,000
27,200 3,452 23,748 87 12,297 11,158 16 190
27,238 3,498 23,740 120 12,174 11,195 32 219
27,354 3,544 23,810 131 12,409 11,023 31 216
27,139 3,404 23,735 122 12,362 11,000 20 212
26,669 3,146 23,523 163 12,150 10,938 32 240
27,088 3,240 23,848 186 12,278 11,161 29 194
27,541 3,355 24,186 227 12,240 11,437 39 243
28,201 3,406 24,795 271 12,544 11,660 40 280
27,863 3,358 24,505 313 12,079 11,837 37 241 2 -
28,723 3,245 25,478 325 12,688 12,168 40 257 2 6
30,571 3,250 27,321 399 13,009 13,561 39 310
29,536 3,378 26,158 469 12,510 12,879 29 265 53
29,954 3,452 26,502 448 12,924 12,781 44 305 7 83
29,642 3,403 26,238 584 12,855 12,470 43 316
28,748 3,326 25,423 547 12,367 12,149 50 324
28,823 3,479 25,344 559 12,445 12,030 46 294
28,761 3,446 25,315 629 12,577 11,813 37 326
29,788 3,296 26,492 644 12,929 12,540 54 371
28,885 3,292 25,593 732 12,484 12,023 43 370
28,250 2,980 25,270 712 12,357 11,835 48 380
27,426 2,992 24,434 804 12,075 11,237 55 341
27,556 2,902 24,654 827 12,248 11,250 49 381
27,298 2,741 24,557 858 12,000 11,346 45 395
28,538 3,183 25,355 921 12,054 11,989 57 384
30,060 3,204 26,856 1,015 12,464 12,943 55 402
28,845 3,074 25,770 1,348 12,189 12,031 51 430
27,445 2,914 24,530 1,072 11,594 11,524 58 448
25,569 2,716 22,853 979 11,001 10,544 46 406
25,415 2,722 22,693 890 11,042 10,390 49 381
24,721 2,637 22,084 861 10,871 9,979 43 413
24,713 2,634 22,079 1,047 10,644 10,066 41 434
24,763 2,639 22,124 1,072 10,704 10,024 36 461
M I S S I S S I P P I
2011-12 2021-22 2031-32
24,763
PublicPublic & Private
32K
21K
29,536• 27,800 high school graduates, on average, projected per year between school years 2011-12 and 2031-32.
• The total number of graduates is projected to increase by 1.8% between 2011-12 and 2024-25, the next highest year for Mississippi.
30,060
Projections of High School Graduates80
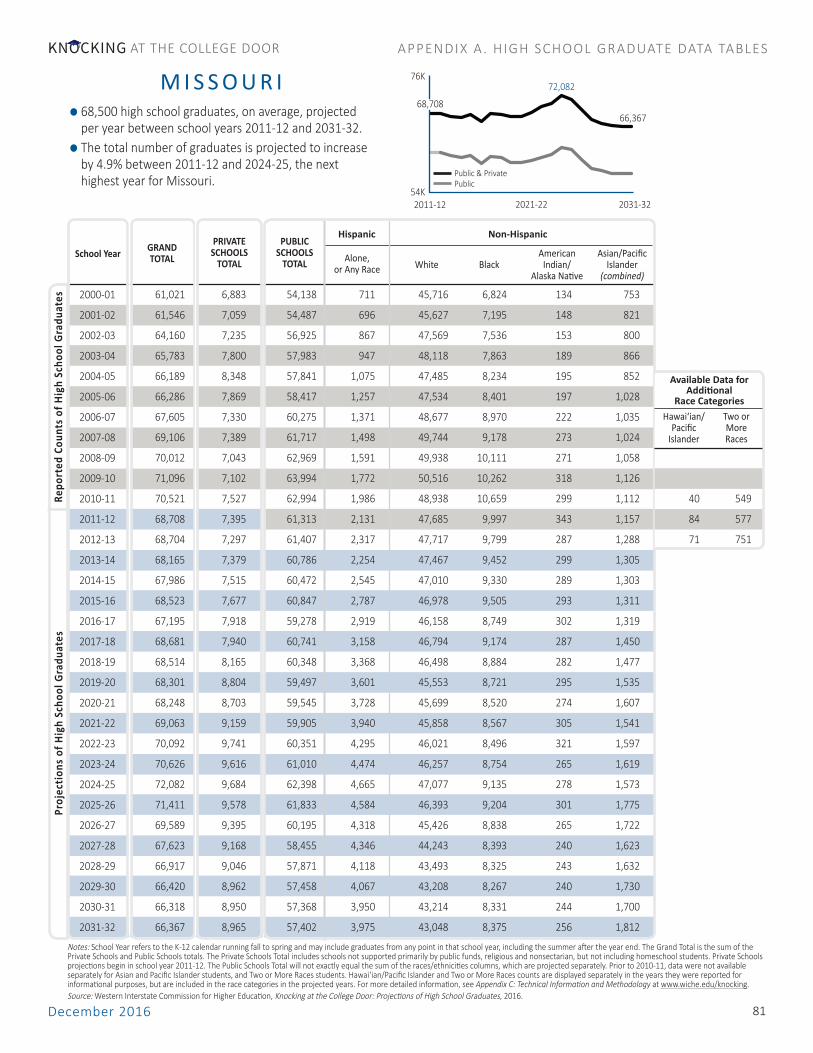
Notes: School Year refers to the K-12 calendar running fall to spring and may include graduates from any point in that school year, including the summer after the year end. The Grand Total is the sum of the Private Schools and Public Schools totals. The Private Schools Total includes schools not supported primarily by public funds, religious and nonsectarian, but not including homeschool students. Private Schools projections begin in school year 2011-12. The Public Schools Total will not exactly equal the sum of the races/ethnicities columns, which are projected separately. Prior to 2010-11, data were not available separately for Asian and Pacific Islander students, and Two or More Races students. Hawai‘ian/Pacific Islander and Two or More Races counts are displayed separately in the years they were reported for informational purposes, but are included in the race categories in the projected years. For more detailed information, see Appendix C: Technical Information and Methodology at www.wiche.edu/knocking.Source: Western Interstate Commission for Higher Education, Knocking at the College Door: Projections of High School Graduates, 2016.
American Asian/Pacific White Black Indian/ Islander AlaskaNative (combined)
Hispanic Non-HispanicPUBLIC
SCHOOLSTOTAL
PRIVATESCHOOLS
TOTALGRANDTOTAL
Hawai‘ian/Pacific
Islander
Two or More Races
School Year Alone, or Any Race
Available Data for Additional
Race Categories
Repo
rted
Cou
nts
of H
igh
Scho
ol G
radu
ates
Proj
ectio
ns o
f Hig
h Sc
hool
Gra
duat
es
2000-01
2001-02
2002-03
2003-04
2004-05
2005-06
2006-07
2007-08
2008-09
2009-10
2010-11
2011-12
2012-13
2013-14
2014-15
2015-16
2016-17
2017-18
2018-19
2019-20
2020-21
2021-22
2022-23
2023-24
2024-25
2025-26
2026-27
2027-28
2028-29
2029-30
2030-31
2031-32
AT THE COLLEGE DOORKNOCKING APPENDIX A . HIGH SCHOOL GRADUATE DATA TABLES
54,000
59,000
64,000
69,000
74,000
61,021 6,883 54,138 711 45,716 6,824 134 753
61,546 7,059 54,487 696 45,627 7,195 148 821
64,160 7,235 56,925 867 47,569 7,536 153 800
65,783 7,800 57,983 947 48,118 7,863 189 866
66,189 8,348 57,841 1,075 47,485 8,234 195 852
66,286 7,869 58,417 1,257 47,534 8,401 197 1,028
67,605 7,330 60,275 1,371 48,677 8,970 222 1,035
69,106 7,389 61,717 1,498 49,744 9,178 273 1,024
70,012 7,043 62,969 1,591 49,938 10,111 271 1,058
71,096 7,102 63,994 1,772 50,516 10,262 318 1,126
70,521 7,527 62,994 1,986 48,938 10,659 299 1,112 40 549
68,708 7,395 61,313 2,131 47,685 9,997 343 1,157 84 577
68,704 7,297 61,407 2,317 47,717 9,799 287 1,288 71 751
68,165 7,379 60,786 2,254 47,467 9,452 299 1,305
67,986 7,515 60,472 2,545 47,010 9,330 289 1,303
68,523 7,677 60,847 2,787 46,978 9,505 293 1,311
67,195 7,918 59,278 2,919 46,158 8,749 302 1,319
68,681 7,940 60,741 3,158 46,794 9,174 287 1,450
68,514 8,165 60,348 3,368 46,498 8,884 282 1,477
68,301 8,804 59,497 3,601 45,553 8,721 295 1,535
68,248 8,703 59,545 3,728 45,699 8,520 274 1,607
69,063 9,159 59,905 3,940 45,858 8,567 305 1,541
70,092 9,741 60,351 4,295 46,021 8,496 321 1,597
70,626 9,616 61,010 4,474 46,257 8,754 265 1,619
72,082 9,684 62,398 4,665 47,077 9,135 278 1,573
71,411 9,578 61,833 4,584 46,393 9,204 301 1,775
69,589 9,395 60,195 4,318 45,426 8,838 265 1,722
67,623 9,168 58,455 4,346 44,243 8,393 240 1,623
66,917 9,046 57,871 4,118 43,493 8,325 243 1,632
66,420 8,962 57,458 4,067 43,208 8,267 240 1,730
66,318 8,950 57,368 3,950 43,214 8,331 244 1,700
66,367 8,965 57,402 3,975 43,048 8,375 256 1,812
M I S S O U R I
2021-22 2031-32
66,367
PublicPublic & Private
76K
54K
68,708• 68,500 high school graduates, on average, projected per year between school years 2011-12 and 2031-32.
• The total number of graduates is projected to increase by 4.9% between 2011-12 and 2024-25, the next highest year for Missouri.
72,082
2011-12
December 2016 81
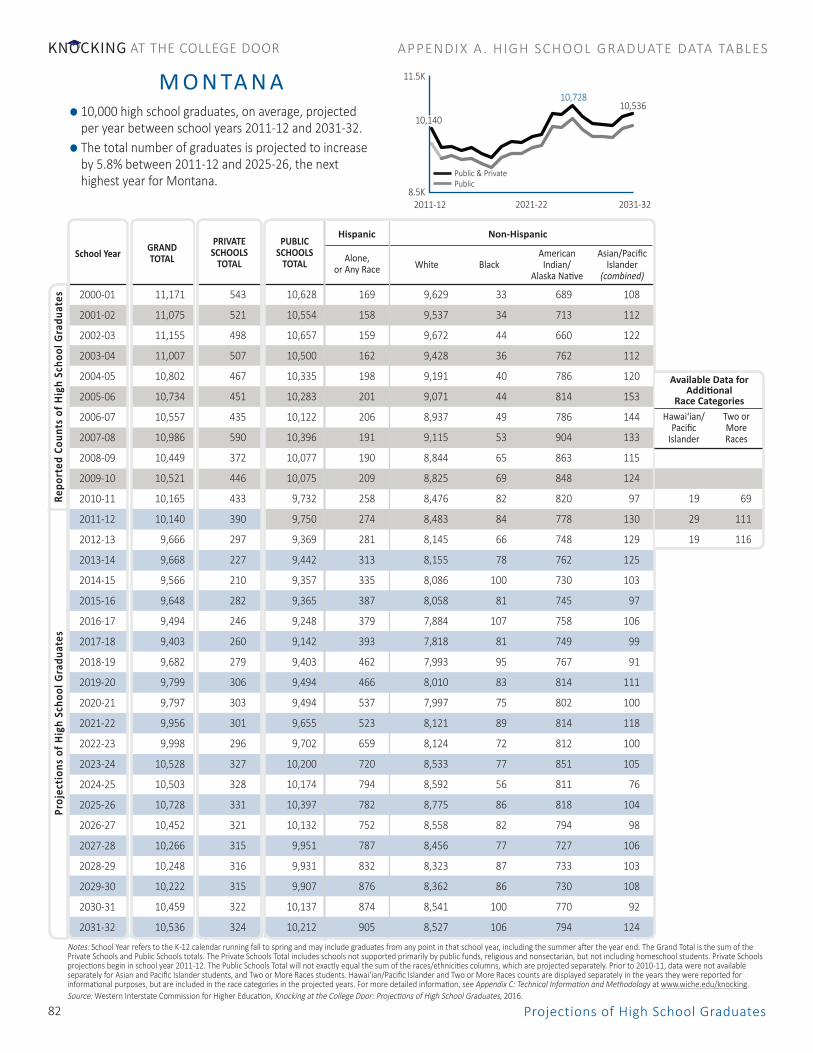
Notes: School Year refers to the K-12 calendar running fall to spring and may include graduates from any point in that school year, including the summer after the year end. The Grand Total is the sum of the Private Schools and Public Schools totals. The Private Schools Total includes schools not supported primarily by public funds, religious and nonsectarian, but not including homeschool students. Private Schools projections begin in school year 2011-12. The Public Schools Total will not exactly equal the sum of the races/ethnicities columns, which are projected separately. Prior to 2010-11, data were not available separately for Asian and Pacific Islander students, and Two or More Races students. Hawai‘ian/Pacific Islander and Two or More Races counts are displayed separately in the years they were reported for informational purposes, but are included in the race categories in the projected years. For more detailed information, see Appendix C: Technical Information and Methodology at www.wiche.edu/knocking.Source: Western Interstate Commission for Higher Education, Knocking at the College Door: Projections of High School Graduates, 2016.
American Asian/Pacific White Black Indian/ Islander AlaskaNative (combined)
Hispanic Non-HispanicPUBLIC
SCHOOLSTOTAL
PRIVATESCHOOLS
TOTALGRANDTOTAL
Hawai‘ian/Pacific
Islander
Two or More Races
School Year Alone, or Any Race
Available Data for Additional
Race Categories
Repo
rted
Cou
nts
of H
igh
Scho
ol G
radu
ates
Proj
ectio
ns o
f Hig
h Sc
hool
Gra
duat
es
2000-01
2001-02
2002-03
2003-04
2004-05
2005-06
2006-07
2007-08
2008-09
2009-10
2010-11
2011-12
2012-13
2013-14
2014-15
2015-16
2016-17
2017-18
2018-19
2019-20
2020-21
2021-22
2022-23
2023-24
2024-25
2025-26
2026-27
2027-28
2028-29
2029-30
2030-31
2031-32
AT THE COLLEGE DOORKNOCKING APPENDIX A . HIGH SCHOOL GRADUATE DATA TABLES
8,500
9,000
9,500
10,000
10,500
11,000
11,500
11,171 543 10,628 169 9,629 33 689 108
11,075 521 10,554 158 9,537 34 713 112
11,155 498 10,657 159 9,672 44 660 122
11,007 507 10,500 162 9,428 36 762 112
10,802 467 10,335 198 9,191 40 786 120
10,734 451 10,283 201 9,071 44 814 153
10,557 435 10,122 206 8,937 49 786 144
10,986 590 10,396 191 9,115 53 904 133
10,449 372 10,077 190 8,844 65 863 115
10,521 446 10,075 209 8,825 69 848 124
10,165 433 9,732 258 8,476 82 820 97 19 69
10,140 390 9,750 274 8,483 84 778 130 29 111
9,666 297 9,369 281 8,145 66 748 129 19 116
9,668 227 9,442 313 8,155 78 762 125
9,566 210 9,357 335 8,086 100 730 103
9,648 282 9,365 387 8,058 81 745 97
9,494 246 9,248 379 7,884 107 758 106
9,403 260 9,142 393 7,818 81 749 99
9,682 279 9,403 462 7,993 95 767 91
9,799 306 9,494 466 8,010 83 814 111
9,797 303 9,494 537 7,997 75 802 100
9,956 301 9,655 523 8,121 89 814 118
9,998 296 9,702 659 8,124 72 812 100
10,528 327 10,200 720 8,533 77 851 105
10,503 328 10,174 794 8,592 56 811 76
10,728 331 10,397 782 8,775 86 818 104
10,452 321 10,132 752 8,558 82 794 98
10,266 315 9,951 787 8,456 77 727 106
10,248 316 9,931 832 8,323 87 733 103
10,222 315 9,907 876 8,362 86 730 108
10,459 322 10,137 874 8,541 100 770 92
10,536 324 10,212 905 8,527 106 794 124
M O N TA N A
2021-22 2031-32
10,536
PublicPublic & Private
11.5K
8.5K
10,140• 10,000 high school graduates, on average, projected per year between school years 2011-12 and 2031-32.
• The total number of graduates is projected to increase by 5.8% between 2011-12 and 2025-26, the next highest year for Montana.
10,728
2011-12
Projections of High School Graduates82

Notes: School Year refers to the K-12 calendar running fall to spring and may include graduates from any point in that school year, including the summer after the year end. The Grand Total is the sum of the Private Schools and Public Schools totals. The Private Schools Total includes schools not supported primarily by public funds, religious and nonsectarian, but not including homeschool students. Private Schools projections begin in school year 2011-12. The Public Schools Total will not exactly equal the sum of the races/ethnicities columns, which are projected separately. Prior to 2010-11, data were not available separately for Asian and Pacific Islander students, and Two or More Races students. Hawai‘ian/Pacific Islander and Two or More Races counts are displayed separately in the years they were reported for informational purposes, but are included in the race categories in the projected years. For more detailed information, see Appendix C: Technical Information and Methodology at www.wiche.edu/knocking.Source: Western Interstate Commission for Higher Education, Knocking at the College Door: Projections of High School Graduates, 2016.
American Asian/Pacific White Black Indian/ Islander AlaskaNative (combined)
Hispanic Non-HispanicPUBLIC
SCHOOLSTOTAL
PRIVATESCHOOLS
TOTALGRANDTOTAL
Hawai‘ian/Pacific
Islander
Two or More Races
School Year Alone, or Any Race
Available Data for Additional
Race Categories
Repo
rted
Cou
nts
of H
igh
Scho
ol G
radu
ates
Proj
ectio
ns o
f Hig
h Sc
hool
Gra
duat
es
2000-01
2001-02
2002-03
2003-04
2004-05
2005-06
2006-07
2007-08
2008-09
2009-10
2010-11
2011-12
2012-13
2013-14
2014-15
2015-16
2016-17
2017-18
2018-19
2019-20
2020-21
2021-22
2022-23
2023-24
2024-25
2025-26
2026-27
2027-28
2028-29
2029-30
2030-31
2031-32
AT THE COLLEGE DOORKNOCKING APPENDIX A . HIGH SCHOOL GRADUATE DATA TABLES
19,000
20,000
21,000
22,000
23,000
24,000
25,000
26,000
27,000
22,033 2,375 19,658 762 17,619 827 139 311
22,307 2,397 19,910 756 17,851 796 150 357
22,580 2,419 20,161 822 17,963 892 182 302
22,632 2,323 20,309 1,004 17,798 984 183 340
22,214 2,274 19,940 1,194 17,242 961 197 346
21,983 2,219 19,764 1,236 16,931 1,032 213 352
22,029 2,156 19,873 1,290 16,800 1,226 211 346
22,192 2,157 20,035 1,434 16,969 1,049 228 355
21,505 2,004 19,501 1,617 16,275 1,054 227 328
21,381 2,011 19,370 1,812 15,921 1,093 191 353
22,635 2,304 20,331 2,348 16,223 1,126 242 392 29 488
22,783 2,319 20,464 2,520 15,921 1,271 280 472 31 527
22,787 2,345 20,442 2,666 15,811 1,301 238 426 20 540
22,836 2,400 20,436 2,885 15,464 1,296 221 503
22,838 2,443 20,395 3,074 15,289 1,232 241 515
22,707 2,336 20,372 3,115 15,396 1,167 216 472
22,542 2,334 20,209 3,191 15,250 1,034 229 561
23,627 2,377 21,250 3,562 15,703 1,217 225 570
24,001 2,402 21,599 3,729 15,760 1,232 268 636
24,272 2,304 21,968 4,053 16,001 1,133 229 646
24,542 2,356 22,186 4,131 16,101 1,149 235 681
25,100 2,426 22,674 4,295 16,433 1,142 230 727
25,004 2,370 22,634 4,416 16,209 1,204 198 791
25,493 2,456 23,037 4,695 16,285 1,225 224 805
24,151 2,463 21,687 4,364 15,526 1,085 208 708
25,107 2,468 22,639 4,893 15,901 1,228 204 756
25,216 2,465 22,751 4,925 15,874 1,245 216 858
24,234 2,369 21,865 4,506 15,408 1,215 183 846
23,959 2,354 21,606 4,153 15,433 1,179 183 839
24,057 2,373 21,684 4,344 15,272 1,222 183 941
24,291 2,387 21,904 4,442 15,369 1,230 196 957
24,968 2,451 22,517 4,730 15,570 1,288 201 1,116
N E B R A S K A
2021-22 2031-32
24,968
PublicPublic & Private
27K
19K
22,783• 24,000 high school graduates, on average, projected
per year between school years 2011-12 and 2031-32.• The total number of graduates is projected to increase
by 11.9% between 2011-12 and 2023-24, the next highest year for Nebraska.
25,493
2011-12
December 2016 83

Notes: School Year refers to the K-12 calendar running fall to spring and may include graduates from any point in that school year, including the summer after the year end. The Grand Total is the sum of the Private Schools and Public Schools totals. The Private Schools Total includes schools not supported primarily by public funds, religious and nonsectarian, but not including homeschool students. Private Schools projections begin in school year 2011-12. The Public Schools Total will not exactly equal the sum of the races/ethnicities columns, which are projected separately. Prior to 2010-11, data were not available separately for Asian and Pacific Islander students, and Two or More Races students. Hawai‘ian/Pacific Islander and Two or More Races counts are displayed separately in the years they were reported for informational purposes, but are included in the race categories in the projected years. For more detailed information, see Appendix C: Technical Information and Methodology at www.wiche.edu/knocking.Source: Western Interstate Commission for Higher Education, Knocking at the College Door: Projections of High School Graduates, 2016.
American Asian/Pacific White Black Indian/ Islander AlaskaNative (combined)
Hispanic Non-HispanicPUBLIC
SCHOOLSTOTAL
PRIVATESCHOOLS
TOTALGRANDTOTAL
Hawai‘ian/Pacific
Islander
Two or More Races
School Year Alone, or Any Race
Available Data for Additional
Race Categories
Repo
rted
Cou
nts
of H
igh
Scho
ol G
radu
ates
Proj
ectio
ns o
f Hig
h Sc
hool
Gra
duat
es
2000-01
2001-02
2002-03
2003-04
2004-05
2005-06
2006-07
2007-08
2008-09
2009-10
2010-11
2011-12
2012-13
2013-14
2014-15
2015-16
2016-17
2017-18
2018-19
2019-20
2020-21
2021-22
2022-23
2023-24
2024-25
2025-26
2026-27
2027-28
2028-29
2029-30
2030-31
2031-32
AT THE COLLEGE DOORKNOCKING APPENDIX A . HIGH SCHOOL GRADUATE DATA TABLES
21,000
22,000
23,000
24,000
25,000
26,000
27,000
28,000
29,000
15,732 605 15,127 2,331 10,348 1,201 249 998
16,911 641 16,270 2,728 10,879 1,285 255 1,123
17,054 676 16,378 2,595 10,742 1,626 276 1,139
15,825 624 15,201 2,659 9,961 1,155 203 1,238
16,402 662 15,740 2,934 9,988 1,262 226 1,330
17,199 744 16,455 3,421 9,902 1,385 231 1,516
17,844 695 17,149 3,620 10,150 1,449 252 1,678
19,569 754 18,815 4,461 10,545 1,682 242 1,885
20,728 824 19,904 5,014 10,723 1,849 264 2,054
21,827 871 20,956 5,713 10,758 2,045 275 2,165
22,081 899 21,182 6,287 10,842 1,819 250 1,984 291 915
22,790 899 21,891 6,816 10,709 2,014 233 2,120 320 1,197
23,989 951 23,038 7,548 10,954 2,040 251 2,245 329 1,295
24,689 951 23,738 8,042 10,956 2,074 241 2,238
24,718 959 23,759 8,162 10,779 2,123 242 2,269
24,119 1,042 23,077 8,117 10,430 1,938 219 2,190
23,920 1,055 22,864 7,988 10,316 1,968 198 2,233
24,688 1,022 23,666 8,585 10,406 2,078 175 2,174
25,077 1,019 24,058 8,941 10,352 2,048 188 2,228
24,943 989 23,954 9,039 10,166 2,064 175 2,174
24,644 961 23,682 8,788 10,183 2,082 164 2,149
24,658 914 23,745 9,078 10,065 2,032 157 2,060
25,247 869 24,378 9,350 10,254 2,178 169 2,009
26,163 1,087 25,076 9,736 10,499 2,223 161 2,009
27,302 1,119 26,183 10,292 10,724 2,419 147 2,106
26,859 1,052 25,807 10,153 10,345 2,520 169 2,268
25,432 985 24,447 9,435 9,888 2,503 149 2,147
24,132 938 23,193 8,723 9,619 2,443 120 1,962
23,632 936 22,696 8,450 9,293 2,520 122 1,941
23,439 926 22,513 8,295 9,129 2,537 118 2,020
23,580 926 22,654 8,300 9,124 2,686 115 2,024
24,118 946 23,173 8,480 9,240 2,925 125 2,064
N E VA D A
2021-22 2031-32
24,118
PublicPublic & Private
29K
21K
22,790
• 24,700 high school graduates, on average, projected per year between school years 2011-12 and 2031-32.
• The total number of graduates is projected to increase by 19.8% between 2011-12 and 2024-25, the next highest year for Nevada.
27,302
2011-12
Projections of High School Graduates84

Notes: School Year refers to the K-12 calendar running fall to spring and may include graduates from any point in that school year, including the summer after the year end. The Grand Total is the sum of the Private Schools and Public Schools totals. The Private Schools Total includes schools not supported primarily by public funds, religious and nonsectarian, but not including homeschool students. Private Schools projections begin in school year 2011-12. The Public Schools Total will not exactly equal the sum of the races/ethnicities columns, which are projected separately. Prior to 2010-11, data were not available separately for Asian and Pacific Islander students, and Two or More Races students. Hawai‘ian/Pacific Islander and Two or More Races counts are displayed separately in the years they were reported for informational purposes, but are included in the race categories in the projected years. For more detailed information, see Appendix C: Technical Information and Methodology at www.wiche.edu/knocking.Source: Western Interstate Commission for Higher Education, Knocking at the College Door: Projections of High School Graduates, 2016.
American Asian/Pacific White Black Indian/ Islander AlaskaNative (combined)
Hispanic Non-HispanicPUBLIC
SCHOOLSTOTAL
PRIVATESCHOOLS
TOTALGRANDTOTAL
Hawai‘ian/Pacific
Islander
Two or More Races
School Year Alone, or Any Race
Available Data for Additional
Race Categories
Repo
rted
Cou
nts
of H
igh
Scho
ol G
radu
ates
Proj
ectio
ns o
f Hig
h Sc
hool
Gra
duat
es
2000-01
2001-02
2002-03
2003-04
2004-05
2005-06
2006-07
2007-08
2008-09
2009-10
2010-11
2011-12
2012-13
2013-14
2014-15
2015-16
2016-17
2017-18
2018-19
2019-20
2020-21
2021-22
2022-23
2023-24
2024-25
2025-26
2026-27
2027-28
2028-29
2029-30
2030-31
2031-32
AT THE COLLEGE DOORKNOCKING APPENDIX A . HIGH SCHOOL GRADUATE DATA TABLES
10,000
11,000
12,000
13,000
14,000
15,000
16,000
17,000
18,000
14,483 2,189 12,294 164 11,790 118 27 194
14,782 2,330 12,452 211 11,928 119 20 174
15,681 2,471 13,210 213 12,654 117 42 185
15,700 2,391 13,309 231 12,696 142 29 210
15,938 2,163 13,775 257 13,104 173 32 209
16,161 2,173 13,988 222 13,422 215 31 223
16,746 2,294 14,452 188 13,739 257 31 237
17,240 2,258 14,982 201 14,174 320 30 257
17,220 2,463 14,757 192 13,892 359 38 276
17,482 2,448 15,034 392 14,140 206 35 261 8 56
17,017 2,522 14,495 443 13,448 245 43 315 7 69
16,872 2,446 14,426 471 13,327 237 38 353 7 110
16,794 2,532 14,262 457 13,148 263 37 356 9 132
16,315 2,615 13,700 404 12,578 288 41 395
16,058 2,596 13,462 448 12,312 268 32 410
15,896 2,491 13,405 538 12,134 290 42 406
15,447 2,479 12,967 504 11,793 238 29 412
15,401 2,437 12,964 535 11,733 243 29 442
15,256 2,595 12,661 531 11,427 228 20 486
15,114 2,482 12,632 579 11,335 240 28 480
14,737 2,346 12,391 590 11,081 219 27 517
14,765 2,354 12,411 650 11,063 205 30 510
14,429 2,317 12,113 714 10,696 211 32 518
14,451 2,383 12,068 731 10,676 214 27 483
14,234 2,338 11,896 819 10,466 183 28 484
13,799 2,241 11,559 725 10,143 234 26 520
13,472 2,187 11,284 740 9,876 218 28 523
12,947 2,107 10,840 706 9,501 223 21 477
12,929 2,110 10,819 717 9,335 225 27 480
12,430 2,027 10,403 748 8,994 193 11 454
12,478 2,032 10,447 685 9,073 209 28 452
12,381 2,016 10,365 789 8,950 184 11 478
N E W H A M P S H I R E
2021-22 2031-32
12,381
PublicPublic & Private
18K
10K
16,872
• 14,600 high school graduates, on average, projected per year between school years 2011-12 and 2031-32.
• The total number of graduates in New Hampshire is not projected to increase after 2011-12, ending at 12,400 in 2031-32.
2011-12
December 2016 85

Notes: School Year refers to the K-12 calendar running fall to spring and may include graduates from any point in that school year, including the summer after the year end. The Grand Total is the sum of the Private Schools and Public Schools totals. The Private Schools Total includes schools not supported primarily by public funds, religious and nonsectarian, but not including homeschool students. Private Schools projections begin in school year 2011-12. The Public Schools Total will not exactly equal the sum of the races/ethnicities columns, which are projected separately. Prior to 2010-11, data were not available separately for Asian and Pacific Islander students, and Two or More Races students. Hawai‘ian/Pacific Islander and Two or More Races counts are displayed separately in the years they were reported for informational purposes, but are included in the race categories in the projected years. For more detailed information, see Appendix C: Technical Information and Methodology at www.wiche.edu/knocking.Source: Western Interstate Commission for Higher Education, Knocking at the College Door: Projections of High School Graduates, 2016.
American Asian/Pacific White Black Indian/ Islander AlaskaNative (combined)
Hispanic Non-HispanicPUBLIC
SCHOOLSTOTAL
PRIVATESCHOOLS
TOTALGRANDTOTAL
Hawai‘ian/Pacific
Islander
Two or More Races
School Year Alone, or Any Race
Available Data for Additional
Race Categories
Repo
rted
Cou
nts
of H
igh
Scho
ol G
radu
ates
Proj
ectio
ns o
f Hig
h Sc
hool
Gra
duat
es
2000-01
2001-02
2002-03
2003-04
2004-05
2005-06
2006-07
2007-08
2008-09
2009-10
2010-11
2011-12
2012-13
2013-14
2014-15
2015-16
2016-17
2017-18
2018-19
2019-20
2020-21
2021-22
2022-23
2023-24
2024-25
2025-26
2026-27
2027-28
2028-29
2029-30
2030-31
2031-32
AT THE COLLEGE DOORKNOCKING APPENDIX A . HIGH SCHOOL GRADUATE DATA TABLES
80,000
85,000
90,000
95,000
100,000
105,000
110,000
115,000
88,475 12,345 76,130 9,402 49,647 11,507 204 5,370
90,288 12,624 77,664 9,657 50,347 11,909 132 5,619
94,293 12,902 81,391 11,016 51,802 12,284 161 6,128
96,254 12,428 83,826 11,406 53,298 12,768 272 6,072
99,328 12,826 86,502 12,238 54,422 13,090 300 6,452
103,200 13,151 90,049 12,775 56,056 13,916 214 7,088
106,357 13,344 93,013 13,507 57,416 14,359 197 7,243
108,609 13,615 94,994 14,593 57,702 14,776 227 7,501
109,433 14,348 95,085 14,808 57,069 15,270 137 8,076 274 270
110,891 14,666 96,225 15,456 57,670 15,045 178 7,877 333 678
108,165 12,979 95,186 15,779 56,341 14,639 301 8,126 171 270
107,257 13,438 93,819 16,092 54,668 14,559 141 8,360 161 337
108,975 12,485 96,490 17,711 54,843 14,997 112 8,827 233 359
106,594 12,246 94,347 17,523 53,338 14,277 214 8,953
106,475 11,926 94,549 18,546 52,239 14,346 303 8,998
105,062 10,786 94,276 18,706 51,997 13,919 319 9,175
103,175 10,148 93,027 19,215 50,491 13,625 341 9,071
103,597 9,521 94,077 20,508 49,590 13,831 228 9,719
103,091 9,147 93,944 21,121 48,807 13,733 257 9,844
101,372 8,560 92,812 21,816 47,460 13,241 234 9,927
101,312 7,959 93,353 22,690 46,842 13,169 225 10,343
101,356 7,508 93,848 24,054 46,395 12,748 220 10,446
99,865 6,963 92,902 25,195 44,527 12,728 263 10,292
101,611 7,765 93,846 26,442 43,689 13,210 246 10,344
102,914 7,819 95,095 28,021 42,717 13,646 218 10,569
99,266 7,466 91,799 26,496 41,028 13,230 191 11,245
97,248 7,247 90,000 26,241 40,097 13,018 217 10,843
94,292 7,017 87,275 25,440 38,779 12,420 254 10,844
93,452 7,017 86,435 25,506 37,888 12,181 177 10,912
91,999 6,905 85,093 25,176 36,552 12,294 192 11,233
90,476 6,778 83,699 24,770 36,632 11,818 208 10,588
91,126 6,819 84,307 24,783 36,779 11,785 201 10,930
N E W J E R S E Y
2021-22 2031-32
91,126
PublicPublic & Private
115K
80K
107,257• 9th highest producer of high school graduates with
100,500 high school graduates, on average, projected per year between school years 2011-12 and 2031-32.
• The total number of graduates in New Jersey is not projected to increase after 2011-12, ending at 91,100 in 2031-32. 2011-12
Projections of High School Graduates86

Notes: School Year refers to the K-12 calendar running fall to spring and may include graduates from any point in that school year, including the summer after the year end. The Grand Total is the sum of the Private Schools and Public Schools totals. The Private Schools Total includes schools not supported primarily by public funds, religious and nonsectarian, but not including homeschool students. Private Schools projections begin in school year 2011-12. The Public Schools Total will not exactly equal the sum of the races/ethnicities columns, which are projected separately. Prior to 2010-11, data were not available separately for Asian and Pacific Islander students, and Two or More Races students. Hawai‘ian/Pacific Islander and Two or More Races counts are displayed separately in the years they were reported for informational purposes, but are included in the race categories in the projected years. For more detailed information, see Appendix C: Technical Information and Methodology at www.wiche.edu/knocking.Source: Western Interstate Commission for Higher Education, Knocking at the College Door: Projections of High School Graduates, 2016.
American Asian/Pacific White Black Indian/ Islander AlaskaNative (combined)
Hispanic Non-HispanicPUBLIC
SCHOOLSTOTAL
PRIVATESCHOOLS
TOTALGRANDTOTAL
Hawai‘ian/Pacific
Islander
Two or More Races
School Year Alone, or Any Race
Available Data for Additional
Race Categories
Repo
rted
Cou
nts
of H
igh
Scho
ol G
radu
ates
Proj
ectio
ns o
f Hig
h Sc
hool
Gra
duat
es
2000-01
2001-02
2002-03
2003-04
2004-05
2005-06
2006-07
2007-08
2008-09
2009-10
2010-11
2011-12
2012-13
2013-14
2014-15
2015-16
2016-17
2017-18
2018-19
2019-20
2020-21
2021-22
2022-23
2023-24
2024-25
2025-26
2026-27
2027-28
2028-29
2029-30
2030-31
2031-32
AT THE COLLEGE DOORKNOCKING APPENDIX A . HIGH SCHOOL GRADUATE DATA TABLES
17,000
18,000
19,000
20,000
21,000
22,000
23,000
19,677 1,478 18,199 7,954 7,587 426 1,996 236
19,456 1,362 18,094 7,959 7,574 398 1,923 241
18,423 1,500 16,923 7,572 6,994 319 1,802 236
19,501 1,609 17,892 8,123 7,205 405 1,894 265
18,753 1,400 17,353 8,074 6,867 364 1,799 249
19,229 1,407 17,822 8,197 6,901 425 2,029 270
17,626 1,495 16,131 7,395 6,253 386 1,839 258
19,810 1,546 18,264 8,740 6,583 467 2,177 297
19,318 1,387 17,931 8,760 6,298 478 2,118 277
19,960 1,365 18,595 9,617 6,061 409 2,212 296 1 126
20,627 1,275 19,352 10,310 6,053 417 2,309 263 10 165
21,523 1,208 20,315 11,271 5,848 479 2,434 283 11 189
20,383 1,151 19,232 10,628 5,654 437 2,203 310 15 220
19,873 1,031 18,842 10,683 5,395 400 2,047 317
20,430 1,024 19,405 11,070 5,567 373 2,052 361
19,994 1,025 18,970 11,120 5,181 331 2,009 329
20,401 960 19,441 11,577 5,122 353 2,028 340
20,478 932 19,546 11,538 5,219 373 2,093 314
20,841 928 19,913 11,921 5,210 355 2,092 338
20,702 975 19,727 11,999 4,922 336 2,168 318
20,384 933 19,451 11,837 4,883 314 2,105 339
20,551 908 19,643 12,068 4,814 301 2,209 289
20,561 860 19,701 12,079 4,895 305 2,171 292
20,772 966 19,806 12,188 4,832 293 2,274 282
21,364 995 20,368 12,822 4,792 275 2,289 278
21,383 970 20,413 12,933 4,735 291 2,298 321
20,526 924 19,602 12,347 4,551 312 2,252 281
19,638 884 18,753 11,745 4,471 292 2,052 299
19,192 874 18,318 11,398 4,269 272 2,019 279
19,062 867 18,194 11,287 4,228 254 1,966 307
18,591 843 17,748 10,953 4,105 251 1,962 292
18,373 832 17,540 10,982 3,994 272 1,843 288
N E W M E X I C O
2021-22 2031-32
18,373
PublicPublic & Private
23K
17K
21,523
• 20,200 high school graduates, on average, projected per year between school years 2011-12 and 2031-32.
• The total number of graduates in New Mexico is not projected to increase after 2011-12, ending at 18,400 in 2031-32.
21,383
2011-12
December 2016 87

Notes: School Year refers to the K-12 calendar running fall to spring and may include graduates from any point in that school year, including the summer after the year end. The Grand Total is the sum of the Private Schools and Public Schools totals. The Private Schools Total includes schools not supported primarily by public funds, religious and nonsectarian, but not including homeschool students. Private Schools projections begin in school year 2011-12. The Public Schools Total will not exactly equal the sum of the races/ethnicities columns, which are projected separately. Prior to 2010-11, data were not available separately for Asian and Pacific Islander students, and Two or More Races students. Hawai‘ian/Pacific Islander and Two or More Races counts are displayed separately in the years they were reported for informational purposes, but are included in the race categories in the projected years. For more detailed information, see Appendix C: Technical Information and Methodology at www.wiche.edu/knocking.Source: Western Interstate Commission for Higher Education, Knocking at the College Door: Projections of High School Graduates, 2016.
American Asian/Pacific White Black Indian/ Islander AlaskaNative (combined)
Hispanic Non-HispanicPUBLIC
SCHOOLSTOTAL
PRIVATESCHOOLS
TOTALGRANDTOTAL
Hawai‘ian/Pacific
Islander
Two or More Races
School Year Alone, or Any Race
Available Data for Additional
Race Categories
Repo
rted
Cou
nts
of H
igh
Scho
ol G
radu
ates
Proj
ectio
ns o
f Hig
h Sc
hool
Gra
duat
es
2000-01
2001-02
2002-03
2003-04
2004-05
2005-06
2006-07
2007-08
2008-09
2009-10
2010-11
2011-12
2012-13
2013-14
2014-15
2015-16
2016-17
2017-18
2018-19
2019-20
2020-21
2021-22
2022-23
2023-24
2024-25
2025-26
2026-27
2027-28
2028-29
2029-30
2030-31
2031-32
AT THE COLLEGE DOORKNOCKING APPENDIX A . HIGH SCHOOL GRADUATE DATA TABLES
160,000
170,000
180,000
190,000
200,000
210,000
220,000
168,485 26,601 141,884 16,317 94,355 20,594 494 10,124
167,465 27,326 140,139 15,524 94,528 19,686 455 9,946
171,868 28,050 143,818 15,693 96,847 20,399 475 10,404
177,095 28,584 148,511 17,227 98,518 21,535 498 10,734
181,674 28,471 153,203 18,761 100,188 22,670 520 11,064
192,563 30,746 161,817 21,824 102,161 24,840 539 12,453
198,224 29,891 168,333 24,261 104,190 26,827 569 13,087
207,683 31,373 176,310 26,698 106,219 28,814 599 13,720
212,162 31,245 180,917 29,529 105,632 30,441 646 14,346
214,916 31,090 183,826 30,909 105,114 31,609 727 15,058
213,200 30,441 182,759 32,147 102,690 31,629 753 15,540 175 502
212,474 31,668 180,806 32,692 100,404 30,733 764 16,214 181 651
211,640 31,289 180,351 33,532 99,210 30,233 789 16,587 201 838
212,185 31,000 181,185 35,753 96,729 30,481 759 17,614
210,288 30,626 179,662 36,423 93,792 30,638 857 17,950
203,560 29,189 174,371 35,566 92,269 29,660 849 17,047
201,290 28,601 172,689 35,834 89,758 29,119 795 17,214
206,830 28,450 178,380 38,582 90,437 29,807 925 19,121
205,026 27,794 177,233 40,163 88,137 29,831 1,016 18,688
203,793 27,227 176,566 41,563 86,092 29,456 1,077 19,311
205,831 27,130 178,701 43,053 86,666 29,062 1,075 20,188
204,822 26,746 178,076 44,387 84,219 28,856 1,103 21,154
205,601 26,575 179,026 47,472 81,735 29,300 1,217 21,230
210,768 27,003 183,765 50,740 81,839 29,810 1,405 22,479
214,488 27,305 187,183 53,592 81,328 30,115 1,545 23,826
209,022 26,934 182,088 50,656 80,641 29,486 1,368 22,967
207,265 26,702 180,564 50,255 79,755 29,085 1,395 23,244
204,766 26,325 178,442 49,714 79,059 28,133 1,443 23,296
202,472 25,995 176,477 48,422 75,995 27,308 1,369 24,492
202,074 25,943 176,131 47,632 75,277 26,820 1,377 26,487
198,491 25,516 172,975 46,597 74,909 26,176 1,289 25,045
200,020 25,711 174,309 47,013 75,246 25,730 1,263 26,368
N E W YO R K
2021-22 2031-32
200,020
PublicPublic & Private
225K
160K
212,474
• 3rd highest producer of high graduates with 206,300 high graduates, on average, projected per year between school years 2011-12 and 2031-32.
• The total number of graduates is projected to increase by 0.9% between 2011-12 and 2024-25, the next highest year for New York.
214,488
2011-12
Projections of High School Graduates88

Notes: School Year refers to the K-12 calendar running fall to spring and may include graduates from any point in that school year, including the summer after the year end. The Grand Total is the sum of the Private Schools and Public Schools totals. The Private Schools Total includes schools not supported primarily by public funds, religious and nonsectarian, but not including homeschool students. Private Schools projections begin in school year 2011-12. The Public Schools Total will not exactly equal the sum of the races/ethnicities columns, which are projected separately. Prior to 2010-11, data were not available separately for Asian and Pacific Islander students, and Two or More Races students. Hawai‘ian/Pacific Islander and Two or More Races counts are displayed separately in the years they were reported for informational purposes, but are included in the race categories in the projected years. For more detailed information, see Appendix C: Technical Information and Methodology at www.wiche.edu/knocking.Source: Western Interstate Commission for Higher Education, Knocking at the College Door: Projections of High School Graduates, 2016.
American Asian/Pacific White Black Indian/ Islander AlaskaNative (combined)
Hispanic Non-HispanicPUBLIC
SCHOOLSTOTAL
PRIVATESCHOOLS
TOTALGRANDTOTAL
Hawai‘ian/Pacific
Islander
Two or More Races
School Year Alone, or Any Race
Available Data for Additional
Race Categories
Repo
rted
Cou
nts
of H
igh
Scho
ol G
radu
ates
Proj
ectio
ns o
f Hig
h Sc
hool
Gra
duat
es
2000-01
2001-02
2002-03
2003-04
2004-05
2005-06
2006-07
2007-08
2008-09
2009-10
2010-11
2011-12
2012-13
2013-14
2014-15
2015-16
2016-17
2017-18
2018-19
2019-20
2020-21
2021-22
2022-23
2023-24
2024-25
2025-26
2026-27
2027-28
2028-29
2029-30
2030-31
2031-32
AT THE COLLEGE DOORKNOCKING APPENDIX A . HIGH SCHOOL GRADUATE DATA TABLES
87,000
92,000
97,000
102,000
107,000
112,000
67,587 4,299 63,288 1,264 43,119 16,810 761 1,334
70,648 4,693 65,955 1,559 44,888 17,385 713 1,410
74,782 5,086 69,696 1,926 46,827 18,600 760 1,583
77,482 5,356 72,126 2,291 47,657 19,685 834 1,659
80,343 5,333 75,010 2,864 48,422 21,155 852 1,717
82,171 5,461 76,710 3,114 48,324 20,841 857 1,771
81,625 5,594 76,031 3,364 48,226 20,526 861 1,824
89,338 6,031 83,307 4,228 51,582 23,002 1,010 1,944
92,439 5,727 86,712 5,067 52,487 24,103 1,102 2,088
94,652 5,948 88,704 5,681 52,339 25,181 1,243 2,243
96,204 6,312 89,892 6,924 53,601 25,909 1,212 2,246 63 2,439
100,257 6,280 93,977 8,136 54,711 27,222 1,345 2,563 82 2,807
100,725 6,386 94,339 9,078 54,828 26,431 1,347 2,656 86 2,981
101,942 6,255 95,687 10,001 54,827 26,101 1,394 2,809
100,891 6,293 94,598 10,467 54,147 25,332 1,370 2,858
102,389 6,628 95,760 11,221 55,057 24,979 1,444 3,009
101,408 6,741 94,667 11,479 54,807 24,101 1,335 3,052
106,104 6,832 99,272 13,172 56,236 25,114 1,466 3,396
107,651 6,857 100,794 14,489 56,533 25,097 1,374 3,491
105,422 6,793 98,629 15,131 55,090 23,839 1,328 3,691
105,221 6,825 98,396 15,642 55,381 22,849 1,351 3,934
98,082 6,887 91,195 14,962 51,570 20,617 1,168 3,843
104,305 6,774 97,531 17,225 53,847 22,148 1,235 4,239
107,354 7,266 100,088 18,603 54,102 22,796 1,310 4,588
110,075 7,470 102,605 19,940 54,845 23,084 1,340 4,987
110,601 7,441 103,161 19,473 54,780 24,220 1,354 5,041
106,551 7,193 99,359 17,931 53,191 23,347 1,369 5,090
103,002 6,918 96,084 16,667 52,053 22,358 1,329 5,155
101,307 6,830 94,477 16,235 51,218 21,971 1,256 5,235
100,860 6,802 94,058 16,042 50,805 21,862 1,251 5,697
100,197 6,751 93,446 15,634 50,179 22,292 1,253 5,647
101,807 6,860 94,947 15,858 51,100 22,327 1,224 6,197
N O R T H C A R O L I N A
2021-22 2031-32
101,807
PublicPublic & Private
112K
87K
100,257• 10th highest producer of high school graduates with
103,600 high school graduates, on average, projected per year between school years 2011-12 and 2031-32.
• The total number of graduates is projected to increase by 10.3% between 2011-12 and 2025-26, the next highest year for North Carolina. 2011-12
110,601
December 2016 89
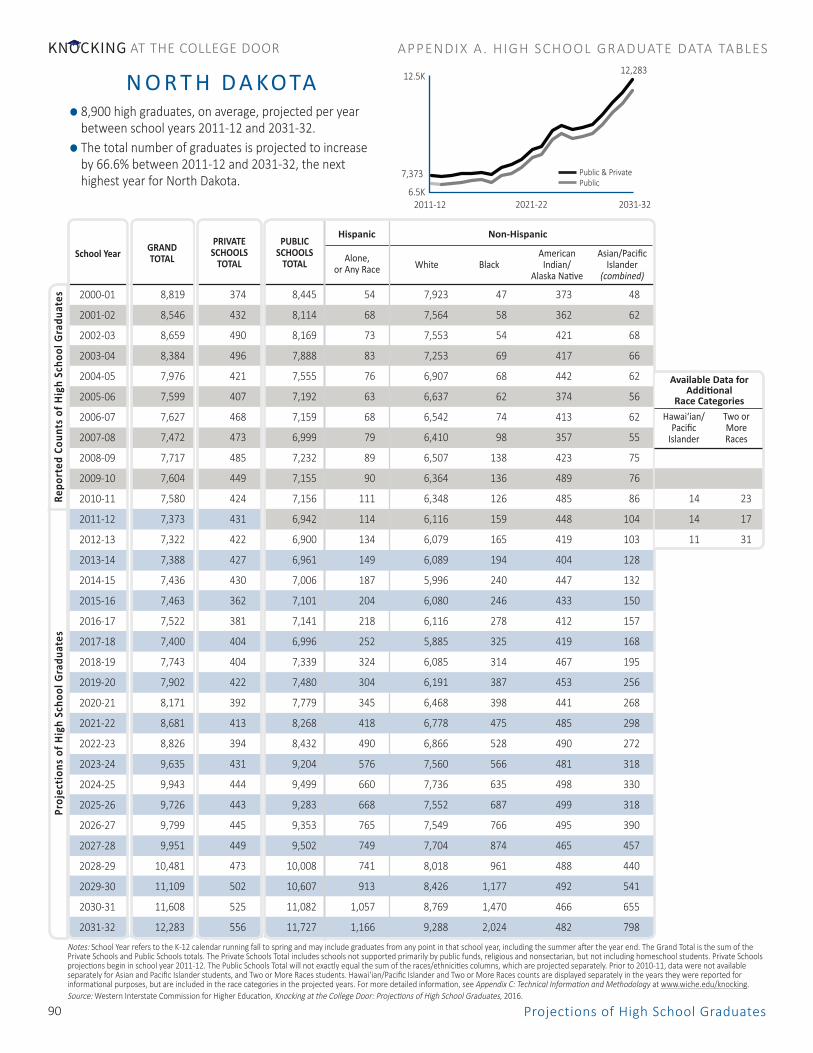
Notes: School Year refers to the K-12 calendar running fall to spring and may include graduates from any point in that school year, including the summer after the year end. The Grand Total is the sum of the Private Schools and Public Schools totals. The Private Schools Total includes schools not supported primarily by public funds, religious and nonsectarian, but not including homeschool students. Private Schools projections begin in school year 2011-12. The Public Schools Total will not exactly equal the sum of the races/ethnicities columns, which are projected separately. Prior to 2010-11, data were not available separately for Asian and Pacific Islander students, and Two or More Races students. Hawai‘ian/Pacific Islander and Two or More Races counts are displayed separately in the years they were reported for informational purposes, but are included in the race categories in the projected years. For more detailed information, see Appendix C: Technical Information and Methodology at www.wiche.edu/knocking.Source: Western Interstate Commission for Higher Education, Knocking at the College Door: Projections of High School Graduates, 2016.
American Asian/Pacific White Black Indian/ Islander AlaskaNative (combined)
Hispanic Non-HispanicPUBLIC
SCHOOLSTOTAL
PRIVATESCHOOLS
TOTALGRANDTOTAL
Hawai‘ian/Pacific
Islander
Two or More Races
School Year Alone, or Any Race
Available Data for Additional
Race Categories
Repo
rted
Cou
nts
of H
igh
Scho
ol G
radu
ates
Proj
ectio
ns o
f Hig
h Sc
hool
Gra
duat
es
2000-01
2001-02
2002-03
2003-04
2004-05
2005-06
2006-07
2007-08
2008-09
2009-10
2010-11
2011-12
2012-13
2013-14
2014-15
2015-16
2016-17
2017-18
2018-19
2019-20
2020-21
2021-22
2022-23
2023-24
2024-25
2025-26
2026-27
2027-28
2028-29
2029-30
2030-31
2031-32
AT THE COLLEGE DOORKNOCKING APPENDIX A . HIGH SCHOOL GRADUATE DATA TABLES
6,500
7,500
8,500
9,500
10,500
11,500
12,500
8,819 374 8,445 54 7,923 47 373 48
8,546 432 8,114 68 7,564 58 362 62
8,659 490 8,169 73 7,553 54 421 68
8,384 496 7,888 83 7,253 69 417 66
7,976 421 7,555 76 6,907 68 442 62
7,599 407 7,192 63 6,637 62 374 56
7,627 468 7,159 68 6,542 74 413 62
7,472 473 6,999 79 6,410 98 357 55
7,717 485 7,232 89 6,507 138 423 75
7,604 449 7,155 90 6,364 136 489 76
7,580 424 7,156 111 6,348 126 485 86 14 23
7,373 431 6,942 114 6,116 159 448 104 14 17
7,322 422 6,900 134 6,079 165 419 103 11 31
7,388 427 6,961 149 6,089 194 404 128
7,436 430 7,006 187 5,996 240 447 132
7,463 362 7,101 204 6,080 246 433 150
7,522 381 7,141 218 6,116 278 412 157
7,400 404 6,996 252 5,885 325 419 168
7,743 404 7,339 324 6,085 314 467 195
7,902 422 7,480 304 6,191 387 453 256
8,171 392 7,779 345 6,468 398 441 268
8,681 413 8,268 418 6,778 475 485 298
8,826 394 8,432 490 6,866 528 490 272
9,635 431 9,204 576 7,560 566 481 318
9,943 444 9,499 660 7,736 635 498 330
9,726 443 9,283 668 7,552 687 499 318
9,799 445 9,353 765 7,549 766 495 390
9,951 449 9,502 749 7,704 874 465 457
10,481 473 10,008 741 8,018 961 488 440
11,109 502 10,607 913 8,426 1,177 492 541
11,608 525 11,082 1,057 8,769 1,470 466 655
12,283 556 11,727 1,166 9,288 2,024 482 798
N O R T H D A KOTA
2021-22 2031-32
12,283
PublicPublic & Private
12.5K
6.5K
7,373
• 8,900 high graduates, on average, projected per year between school years 2011-12 and 2031-32.
• The total number of graduates is projected to increase by 66.6% between 2011-12 and 2031-32, the next highest year for North Dakota.
2011-12
Projections of High School Graduates90

Notes: School Year refers to the K-12 calendar running fall to spring and may include graduates from any point in that school year, including the summer after the year end. The Grand Total is the sum of the Private Schools and Public Schools totals. The Private Schools Total includes schools not supported primarily by public funds, religious and nonsectarian, but not including homeschool students. Private Schools projections begin in school year 2011-12. The Public Schools Total will not exactly equal the sum of the races/ethnicities columns, which are projected separately. Prior to 2010-11, data were not available separately for Asian and Pacific Islander students, and Two or More Races students. Hawai‘ian/Pacific Islander and Two or More Races counts are displayed separately in the years they were reported for informational purposes, but are included in the race categories in the projected years. For more detailed information, see Appendix C: Technical Information and Methodology at www.wiche.edu/knocking.Source: Western Interstate Commission for Higher Education, Knocking at the College Door: Projections of High School Graduates, 2016.
American Asian/Pacific White Black Indian/ Islander AlaskaNative (combined)
Hispanic Non-HispanicPUBLIC
SCHOOLSTOTAL
PRIVATESCHOOLS
TOTALGRANDTOTAL
Hawai‘ian/Pacific
Islander
Two or More Races
School Year Alone, or Any Race
Available Data for Additional
Race Categories
Repo
rted
Cou
nts
of H
igh
Scho
ol G
radu
ates
Proj
ectio
ns o
f Hig
h Sc
hool
Gra
duat
es
2000-01
2001-02
2002-03
2003-04
2004-05
2005-06
2006-07
2007-08
2008-09
2009-10
2010-11
2011-12
2012-13
2013-14
2014-15
2015-16
2016-17
2017-18
2018-19
2019-20
2020-21
2021-22
2022-23
2023-24
2024-25
2025-26
2026-27
2027-28
2028-29
2029-30
2030-31
2031-32
AT THE COLLEGE DOORKNOCKING APPENDIX A . HIGH SCHOOL GRADUATE DATA TABLES
96,000
106,000
116,000
126,000
136,000
125,150 13,869 111,281 1,378 96,206 11,645 123 1,509
124,514 13,906 110,608 1,441 95,036 11,945 100 1,568
129,705 13,943 115,762 1,654 98,909 12,902 117 1,533
132,889 13,860 119,029 1,696 100,613 14,084 132 1,648
129,772 13,070 116,702 1,723 97,704 14,308 128 1,726
130,618 13,262 117,356 1,922 98,744 14,919 130 1,641
130,715 13,057 117,658 1,899 98,390 14,058 137 1,652
133,785 13,027 120,758 2,046 99,936 14,956 160 1,749
135,506 13,303 122,203 2,113 100,117 15,630 188 1,835
136,449 13,012 123,437 2,314 99,925 16,574 165 1,695
137,087 12,858 124,229 2,790 101,699 17,636 185 1,920 26 3,135
136,066 12,931 123,135 3,032 100,273 17,586 179 2,065 44 3,516
135,042 12,551 122,491 3,286 100,098 16,782 160 2,165 46 3,833
125,152 12,283 112,869 3,371 91,054 15,955 169 2,211
122,825 12,101 110,724 3,720 88,939 15,933 166 2,262
125,662 10,712 114,949 4,221 92,907 16,299 164 2,556
123,075 10,152 112,923 4,264 92,289 15,514 180 2,620
124,473 9,631 114,842 4,812 93,083 16,270 157 2,835
122,452 9,156 113,296 5,263 91,726 16,192 166 2,814
119,508 8,501 111,007 5,826 89,938 15,734 130 3,033
118,808 8,170 110,639 6,342 89,691 15,755 139 3,180
117,537 7,651 109,887 6,756 89,279 15,723 116 3,281
116,169 6,974 109,195 8,059 87,729 16,103 116 3,379
117,730 7,899 109,831 8,886 87,832 16,803 104 3,321
118,707 7,940 110,767 9,551 88,361 17,389 124 3,483
117,111 7,731 109,380 9,210 86,191 17,344 105 3,630
113,828 7,434 106,394 9,123 83,700 16,903 116 3,459
109,233 7,117 102,116 8,487 80,285 16,350 106 3,578
108,301 7,133 101,168 8,549 79,383 15,959 101 3,486
108,821 7,166 101,656 8,842 79,157 16,281 112 3,839
109,177 7,172 102,005 8,742 79,091 16,624 110 3,849
109,570 7,188 102,382 9,246 79,112 16,544 113 4,166
O H I O
2021-22 2031-32
109,570
PublicPublic & Private
143K
96K
136,066
• 7th highest producer of high school graduates with 119,000 high school graduates, on average, projected per year between school years 2011-12 and 2031-32.
• The total number of graduates in Ohio is not projected to increase after 2011-12, ending at 109,600 in 2031-32. 2011-12
December 2016 91

Notes: School Year refers to the K-12 calendar running fall to spring and may include graduates from any point in that school year, including the summer after the year end. The Grand Total is the sum of the Private Schools and Public Schools totals. The Private Schools Total includes schools not supported primarily by public funds, religious and nonsectarian, but not including homeschool students. Private Schools projections begin in school year 2011-12. The Public Schools Total will not exactly equal the sum of the races/ethnicities columns, which are projected separately. Prior to 2010-11, data were not available separately for Asian and Pacific Islander students, and Two or More Races students. Hawai‘ian/Pacific Islander and Two or More Races counts are displayed separately in the years they were reported for informational purposes, but are included in the race categories in the projected years. For more detailed information, see Appendix C: Technical Information and Methodology at www.wiche.edu/knocking.Source: Western Interstate Commission for Higher Education, Knocking at the College Door: Projections of High School Graduates, 2016.
American Asian/Pacific White Black Indian/ Islander AlaskaNative (combined)
Hispanic Non-HispanicPUBLIC
SCHOOLSTOTAL
PRIVATESCHOOLS
TOTALGRANDTOTAL
Hawai‘ian/Pacific
Islander
Two or More Races
School Year Alone, or Any Race
Available Data for Additional
Race Categories
Repo
rted
Cou
nts
of H
igh
Scho
ol G
radu
ates
Proj
ectio
ns o
f Hig
h Sc
hool
Gra
duat
es
2000-01
2001-02
2002-03
2003-04
2004-05
2005-06
2006-07
2007-08
2008-09
2009-10
2010-11
2011-12
2012-13
2013-14
2014-15
2015-16
2016-17
2017-18
2018-19
2019-20
2020-21
2021-22
2022-23
2023-24
2024-25
2025-26
2026-27
2027-28
2028-29
2029-30
2030-31
2031-32
AT THE COLLEGE DOORKNOCKING APPENDIX A . HIGH SCHOOL GRADUATE DATA TABLES
35,000
37,000
39,000
41,000
43,000
45,000
47,000
39,039 1,581 37,458 1,492 26,066 3,243 5,906 751
38,409 1,557 36,852 1,562 25,385 3,299 5,956 650
38,226 1,532 36,694 1,584 24,976 3,355 6,124 655
38,354 1,555 36,799 1,726 24,679 3,386 6,281 727
38,007 1,780 36,227 1,937 23,714 3,449 6,442 685
38,349 1,852 36,497 2,131 23,572 3,568 6,494 732
39,133 2,033 37,100 2,385 23,530 3,599 6,730 856
39,645 2,015 37,630 2,476 23,591 3,926 6,770 867
38,750 1,531 37,219 2,664 22,976 3,643 7,034 902
40,065 1,562 38,503 2,870 23,492 3,797 7,281 1,063
39,508 1,764 37,744 3,099 22,982 3,630 6,963 1,070 98 604
39,149 1,844 37,305 3,346 22,505 3,652 6,780 1,022 94 996
38,952 1,919 37,033 3,601 22,211 3,566 6,690 965 71 1,243
39,223 1,751 37,473 4,140 22,267 3,595 6,416 1,019
39,663 1,771 37,892 4,456 22,480 3,541 6,284 1,107
40,695 1,848 38,847 4,796 22,944 3,635 6,353 1,076
40,897 1,858 39,039 5,098 23,122 3,456 6,272 1,119
41,753 1,868 39,885 5,680 23,366 3,572 6,277 1,054
41,851 1,788 40,063 6,250 23,369 3,451 6,015 1,201
41,706 1,687 40,019 6,679 23,266 3,465 5,778 1,154
42,373 1,826 40,547 7,227 23,770 3,360 5,496 1,232
42,650 1,791 40,859 7,777 23,751 3,336 5,409 1,273
42,834 1,774 41,060 8,216 23,969 3,298 5,231 1,197
43,823 1,879 41,944 8,987 24,324 3,306 5,154 1,249
45,403 1,912 43,491 9,817 25,469 3,406 4,942 1,276
45,191 1,910 43,281 9,321 24,809 3,476 5,673 1,357
44,956 1,896 43,061 9,553 24,454 3,552 5,493 1,474
43,804 1,847 41,957 9,120 24,049 3,339 5,341 1,442
42,960 1,817 41,143 8,804 23,498 3,329 5,149 1,595
43,424 1,833 41,591 9,109 23,683 3,412 5,059 1,691
43,940 1,855 42,085 9,511 23,948 3,358 5,027 1,704
43,904 1,854 42,051 9,518 23,656 3,502 5,060 1,867
O K L A H O M A
2021-22 2031-32
43,904
PublicPublic & Private
48K
35K
39,149
• 42,300 high school graduates, on average, projected per year between school years 2011-12 and 2031-32.
• The total number of graduates is projected to increase by 16.0% between 2011-12 and 2024-25, the next highest year for Oklahoma.
2011-12
45,403
Projections of High School Graduates92

Notes: School Year refers to the K-12 calendar running fall to spring and may include graduates from any point in that school year, including the summer after the year end. The Grand Total is the sum of the Private Schools and Public Schools totals. The Private Schools Total includes schools not supported primarily by public funds, religious and nonsectarian, but not including homeschool students. Private Schools projections begin in school year 2011-12. The Public Schools Total will not exactly equal the sum of the races/ethnicities columns, which are projected separately. Prior to 2010-11, data were not available separately for Asian and Pacific Islander students, and Two or More Races students. Hawai‘ian/Pacific Islander and Two or More Races counts are displayed separately in the years they were reported for informational purposes, but are included in the race categories in the projected years. For more detailed information, see Appendix C: Technical Information and Methodology at www.wiche.edu/knocking.Source: Western Interstate Commission for Higher Education, Knocking at the College Door: Projections of High School Graduates, 2016.
American Asian/Pacific White Black Indian/ Islander AlaskaNative (combined)
Hispanic Non-HispanicPUBLIC
SCHOOLSTOTAL
PRIVATESCHOOLS
TOTALGRANDTOTAL
Hawai‘ian/Pacific
Islander
Two or More Races
School Year Alone, or Any Race
Available Data for Additional
Race Categories
Repo
rted
Cou
nts
of H
igh
Scho
ol G
radu
ates
Proj
ectio
ns o
f Hig
h Sc
hool
Gra
duat
es
2000-01
2001-02
2002-03
2003-04
2004-05
2005-06
2006-07
2007-08
2008-09
2009-10
2010-11
2011-12
2012-13
2013-14
2014-15
2015-16
2016-17
2017-18
2018-19
2019-20
2020-21
2021-22
2022-23
2023-24
2024-25
2025-26
2026-27
2027-28
2028-29
2029-30
2030-31
2031-32
AT THE COLLEGE DOORKNOCKING APPENDIX A . HIGH SCHOOL GRADUATE DATA TABLES
32,000
33,000
34,000
35,000
36,000
37,000
38,000
39,000
40,000
32,456 2,517 29,939 1,629 25,782 604 448 1,269
33,770 2,617 31,153 1,990 26,464 594 490 1,283
35,304 2,717 32,587 2,380 27,207 697 506 1,470
35,697 2,739 32,958 2,583 26,981 692 574 1,565
35,450 2,848 32,602 2,717 26,482 692 600 1,590
35,453 3,059 32,394 3,139 26,248 746 597 1,664
36,260 2,814 33,446 3,242 26,227 806 681 1,687
38,015 3,066 34,949 3,849 26,846 830 725 1,811
38,277 3,139 35,138 4,250 26,558 826 693 1,695
37,955 3,284 34,671 4,900 25,675 893 616 1,703
37,697 2,974 34,723 5,414 26,048 893 610 1,758 189 1,298
37,262 3,001 34,261 5,554 25,463 870 566 1,809 215 1,396
36,817 2,918 33,899 5,807 24,840 893 543 1,815 188 1,473
37,757 2,826 34,930 6,139 25,427 824 566 1,892
36,885 2,814 34,071 6,286 24,697 794 527 1,869
37,210 2,600 34,610 6,699 25,135 779 498 1,862
36,704 2,407 34,297 6,744 24,901 799 505 1,863
36,734 2,286 34,448 7,079 24,772 757 498 2,017
36,594 2,176 34,418 7,406 24,663 748 444 1,981
35,920 2,011 33,909 7,478 24,433 687 419 1,907
36,091 1,862 34,229 7,618 24,723 723 402 2,021
36,197 1,783 34,414 7,930 24,849 676 418 2,019
36,058 1,642 34,416 8,211 24,853 672 381 2,000
37,279 1,957 35,322 8,557 25,610 695 385 2,060
38,247 1,979 36,267 8,843 26,616 708 399 1,980
38,254 1,933 36,321 9,148 25,913 790 407 2,077
36,733 1,839 34,894 8,558 25,042 745 373 2,078
35,405 1,773 33,632 8,145 24,221 742 337 2,051
35,031 1,778 33,253 7,665 24,169 748 336 1,991
35,013 1,774 33,239 7,518 24,219 742 336 2,061
35,109 1,772 33,337 7,431 24,367 766 356 2,025
35,417 1,786 33,631 7,496 24,623 786 293 2,099
O R E G O N
2021-22 2031-32
35,417
PublicPublic & Private
40K
32K
37,262• 36,500 high school graduates, on average, projected per year between school years 2011-12 and 2031-32.
• The total number of graduates is projected to increase by 2.7% between 2011-12 and 2025-26, the next highest year for Oregon.
2011-12
38,254
December 2016 93

Notes: School Year refers to the K-12 calendar running fall to spring and may include graduates from any point in that school year, including the summer after the year end. The Grand Total is the sum of the Private Schools and Public Schools totals. The Private Schools Total includes schools not supported primarily by public funds, religious and nonsectarian, but not including homeschool students. Private Schools projections begin in school year 2011-12. The Public Schools Total will not exactly equal the sum of the races/ethnicities columns, which are projected separately. Prior to 2010-11, data were not available separately for Asian and Pacific Islander students, and Two or More Races students. Hawai‘ian/Pacific Islander and Two or More Races counts are displayed separately in the years they were reported for informational purposes, but are included in the race categories in the projected years. For more detailed information, see Appendix C: Technical Information and Methodology at www.wiche.edu/knocking.Source: Western Interstate Commission for Higher Education, Knocking at the College Door: Projections of High School Graduates, 2016.
American Asian/Pacific White Black Indian/ Islander AlaskaNative (combined)
Hispanic Non-HispanicPUBLIC
SCHOOLSTOTAL
PRIVATESCHOOLS
TOTALGRANDTOTAL
Hawai‘ian/Pacific
Islander
Two or More Races
School Year Alone, or Any Race
Available Data for Additional
Race Categories
Repo
rted
Cou
nts
of H
igh
Scho
ol G
radu
ates
Proj
ectio
ns o
f Hig
h Sc
hool
Gra
duat
es
2000-01
2001-02
2002-03
2003-04
2004-05
2005-06
2006-07
2007-08
2008-09
2009-10
2010-11
2011-12
2012-13
2013-14
2014-15
2015-16
2016-17
2017-18
2018-19
2019-20
2020-21
2021-22
2022-23
2023-24
2024-25
2025-26
2026-27
2027-28
2028-29
2029-30
2030-31
2031-32
AT THE COLLEGE DOORKNOCKING APPENDIX A . HIGH SCHOOL GRADUATE DATA TABLES
114,000
124,000
134,000
144,000
154,000
132,528 18,092 114,436 2,961 96,931 11,915 62 2,567
133,673 18,730 114,943 3,093 97,397 11,655 102 2,696
139,300 19,367 119,933 3,566 100,330 13,143 105 2,789
142,195 18,721 123,474 4,134 101,989 14,303 100 2,952
142,738 17,980 124,758 4,610 101,285 15,610 114 3,139
144,657 17,976 126,681 5,088 102,751 15,563 123 3,156
146,080 17,477 128,603 5,566 104,217 15,515 132 3,173
148,125 17,827 130,298 5,978 104,355 16,111 146 3,439
149,321 18,663 130,658 6,509 103,712 16,424 169 3,428
150,365 19,183 131,182 7,055 102,057 17,753 198 3,530
146,650 16,366 130,284 7,682 100,734 17,880 176 3,811 64 826
148,098 16,365 131,733 8,403 100,524 18,475 203 4,128 76 1,162
145,762 15,985 129,777 8,706 98,436 17,989 165 4,480 85 1,515
143,382 15,344 128,038 9,002 96,779 17,550 160 4,506
139,458 14,788 124,669 9,234 93,061 17,536 154 4,672
137,546 13,788 123,758 9,533 92,455 16,882 143 4,849
137,536 13,437 124,099 9,951 92,195 17,050 159 4,885
139,054 13,090 125,963 10,257 93,165 17,440 142 5,333
137,709 12,520 125,189 11,136 91,723 17,153 151 5,553
134,456 11,918 122,538 11,204 89,099 17,082 161 5,660
135,550 11,553 123,997 11,695 90,210 16,914 151 5,974
136,427 11,289 125,138 12,661 90,477 16,819 143 6,298
134,601 10,735 123,866 13,080 88,809 16,991 170 6,221
137,455 11,747 125,708 14,152 89,440 17,299 136 6,430
139,680 11,863 127,817 15,148 89,919 18,130 145 6,691
138,615 11,637 126,978 15,163 88,417 18,646 150 6,705
136,040 11,361 124,679 15,285 86,224 18,359 141 6,870
132,871 11,097 121,774 14,850 84,262 17,909 128 6,789
132,696 11,158 121,539 15,341 83,494 17,178 124 6,714
132,174 11,05 121,068 15,249 82,482 17,372 116 7,468
130,733 10,964 119,768 15,347 81,846 16,916 134 7,072
131,973 11,062 120,911 15,700 82,313 16,534 112 7,426
P E N N S Y LVA N I A
2021-22 2031-32
131,973
PublicPublic & Private
156K
114K
148,098
• 6th highest producer of high school graduates with 137,200 high school graduates, on average, projected per year between school years 2011-12 and 2031-32.
• The total number of graduates in Pennsylvania is not projected to increase after 2011-12, ending at 132,000 in 2031-32. 2011-12
Projections of High School Graduates94

Notes: School Year refers to the K-12 calendar running fall to spring and may include graduates from any point in that school year, including the summer after the year end. The Grand Total is the sum of the Private Schools and Public Schools totals. The Private Schools Total includes schools not supported primarily by public funds, religious and nonsectarian, but not including homeschool students. Private Schools projections begin in school year 2011-12. The Public Schools Total will not exactly equal the sum of the races/ethnicities columns, which are projected separately. Prior to 2010-11, data were not available separately for Asian and Pacific Islander students, and Two or More Races students. Hawai‘ian/Pacific Islander and Two or More Races counts are displayed separately in the years they were reported for informational purposes, but are included in the race categories in the projected years. For more detailed information, see Appendix C: Technical Information and Methodology at www.wiche.edu/knocking.Source: Western Interstate Commission for Higher Education, Knocking at the College Door: Projections of High School Graduates, 2016.
American Asian/Pacific White Black Indian/ Islander AlaskaNative (combined)
Hispanic Non-HispanicPUBLIC
SCHOOLSTOTAL
PRIVATESCHOOLS
TOTALGRANDTOTAL
Hawai‘ian/Pacific
Islander
Two or More Races
School Year Alone, or Any Race
Available Data for Additional
Race Categories
Repo
rted
Cou
nts
of H
igh
Scho
ol G
radu
ates
Proj
ectio
ns o
f Hig
h Sc
hool
Gra
duat
es
2000-01
2001-02
2002-03
2003-04
2004-05
2005-06
2006-07
2007-08
2008-09
2009-10
2010-11
2011-12
2012-13
2013-14
2014-15
2015-16
2016-17
2017-18
2018-19
2019-20
2020-21
2021-22
2022-23
2023-24
2024-25
2025-26
2026-27
2027-28
2028-29
2029-30
2030-31
2031-32
AT THE COLLEGE DOORKNOCKING APPENDIX A . HIGH SCHOOL GRADUATE DATA TABLES
7,500
8,500
9,500
10,500
11,500
12,500
10,219 1,616 8,603 769 6,977 546 38 273
10,786 1,780 9,006 857 7,132 657 43 317
11,261 1,943 9,318 892 7,387 684 33 322
11,194 1,936 9,258 950 7,335 640 39 294
11,688 1,807 9,881 1,153 7,576 794 42 316
11,953 1,845 10,108 1,292 7,666 819 54 277
11,966 1,582 10,384 1,485 7,663 871 43 322
11,994 1,647 10,347 1,605 7,474 890 64 314
11,846 1,818 10,028 1,519 7,324 836 63 286
11,801 1,893 9,908 1,563 7,082 865 61 337
11,743 2,019 9,724 1,685 6,878 827 52 282 28 136
11,834 2,083 9,751 1,719 6,869 812 44 307 24 155
11,705 2,126 9,579 1,740 6,713 786 37 304 16 153
11,774 2,183 9,591 1,900 6,575 779 35 310
11,788 2,281 9,508 1,997 6,295 815 53 346
11,294 2,008 9,286 1,975 6,171 769 60 292
10,158 1,933 8,225 1,761 5,496 647 48 251
10,464 1,831 8,633 1,967 5,662 703 41 263
11,039 1,893 9,146 2,265 5,829 744 43 296
11,063 1,900 9,163 2,326 5,830 693 45 310
10,986 1,899 9,087 2,366 5,729 733 41 274
11,189 1,891 9,298 2,580 5,718 721 48 321
10,799 1,751 9,048 2,640 5,468 735 47 275
10,807 1,779 9,028 2,811 5,420 643 36 290
11,011 1,785 9,227 3,028 5,350 731 36 296
10,489 1,732 8,757 2,844 5,098 702 34 301
9,974 1,643 8,331 2,735 4,892 595 24 315
9,739 1,597 8,142 2,666 4,813 600 22 268
9,583 1,572 8,011 2,679 4,531 588 20 283
9,563 1,568 7,995 2,735 4,496 530 23 283
9,440 1,551 7,889 2,700 4,398 580 23 288
9,451 1,552 7,899 2,844 4,400 527 22 291
R H O D E I S L A N D
2021-22 2031-32
9,451
PublicPublic & Private
12.5K
7.5K
11,834
• 10,700 high school graduates, on average, projected per year between school years 2011-12 and 2031-32.
• The total number of graduates in Rhode Island is not projected to increase after 2011-12, ending at 9,500 in 2031-32.
2011-12
December 2016 95

Notes: School Year refers to the K-12 calendar running fall to spring and may include graduates from any point in that school year, including the summer after the year end. The Grand Total is the sum of the Private Schools and Public Schools totals. The Private Schools Total includes schools not supported primarily by public funds, religious and nonsectarian, but not including homeschool students. Private Schools projections begin in school year 2011-12. The Public Schools Total will not exactly equal the sum of the races/ethnicities columns, which are projected separately. Prior to 2010-11, data were not available separately for Asian and Pacific Islander students, and Two or More Races students. Hawai‘ian/Pacific Islander and Two or More Races counts are displayed separately in the years they were reported for informational purposes, but are included in the race categories in the projected years. For more detailed information, see Appendix C: Technical Information and Methodology at www.wiche.edu/knocking.Source: Western Interstate Commission for Higher Education, Knocking at the College Door: Projections of High School Graduates, 2016.
American Asian/Pacific White Black Indian/ Islander AlaskaNative (combined)
Hispanic Non-HispanicPUBLIC
SCHOOLSTOTAL
PRIVATESCHOOLS
TOTALGRANDTOTAL
Hawai‘ian/Pacific
Islander
Two or More Races
School Year Alone, or Any Race
Available Data for Additional
Race Categories
Repo
rted
Cou
nts
of H
igh
Scho
ol G
radu
ates
Proj
ectio
ns o
f Hig
h Sc
hool
Gra
duat
es
2000-01
2001-02
2002-03
2003-04
2004-05
2005-06
2006-07
2007-08
2008-09
2009-10
2010-11
2011-12
2012-13
2013-14
2014-15
2015-16
2016-17
2017-18
2018-19
2019-20
2020-21
2021-22
2022-23
2023-24
2024-25
2025-26
2026-27
2027-28
2028-29
2029-30
2030-31
2031-32
AT THE COLLEGE DOORKNOCKING APPENDIX A . HIGH SCHOOL GRADUATE DATA TABLES
39,000
41,000
43,000
45,000
47,000
49,000
51,000
53,000
32,949 2,923 30,026 322 17,856 11,435 43 368
34,245 2,943 31,302 380 18,614 11,647 66 376
35,445 2,963 32,482 454 19,202 12,330 49 387
36,203 2,968 33,235 495 19,350 12,853 69 412
36,389 2,950 33,439 648 19,489 12,906 72 447
37,833 3,559 34,274 639 20,275 12,774 58 455
38,319 3,211 35,108 631 21,062 12,643 44 462
38,502 3,199 35,303 965 20,717 12,766 14 604
42,187 3,073 39,114 1,227 22,453 14,541 107 605
43,387 2,949 40,438 1,394 22,985 15,125 109 699
43,665 2,957 40,708 1,663 23,133 15,234 115 564 48 527
44,241 2,799 41,442 1,755 23,745 15,178 110 654 59 687
44,978 2,732 42,246 2,070 24,266 15,065 125 720 60 775
43,943 2,627 41,316 2,045 24,265 14,186 124 696
44,147 2,604 41,544 2,176 24,412 14,198 110 705
44,750 2,546 42,204 2,418 24,719 14,367 131 690
44,954 2,429 42,525 2,540 25,374 14,007 127 737
46,536 2,377 44,159 2,875 25,743 14,822 119 828
46,760 2,395 44,365 3,184 25,847 14,653 121 837
45,582 2,255 43,327 3,426 25,462 13,919 98 820
45,285 2,112 43,172 3,621 25,540 13,576 103 825
45,559 2,030 43,529 3,768 25,804 13,550 129 844
46,216 1,930 44,286 4,152 25,907 13,851 135 853
48,200 2,307 45,893 4,676 26,479 14,462 132 817
50,076 2,335 47,740 4,915 27,324 15,207 143 857
50,319 2,303 48,016 5,221 27,233 15,223 135 978
48,240 2,191 46,049 4,614 26,681 14,387 121 962
46,316 2,106 44,210 4,060 26,010 13,731 122 962
45,475 2,093 43,382 3,878 25,750 13,267 115 920
45,411 2,085 43,326 3,764 25,703 13,243 142 994
45,140 2,066 43,074 3,633 25,881 12,980 114 949
45,778 2,093 43,685 3,821 26,308 13,017 111 967
S O U T H C A R O L I N A
2021-22 2031-32
45,778
PublicPublic & Private
53K
39K
44,241
• 46,100 high school graduates, on average, projected per year between school years 2011-12 and 2031-32.
• The total number of graduates is projected to increase by 13.7% between 2011-12 and 2025-26, the next highest year for South Carolina.
2011-12
50,319
Projections of High School Graduates96

Notes: School Year refers to the K-12 calendar running fall to spring and may include graduates from any point in that school year, including the summer after the year end. The Grand Total is the sum of the Private Schools and Public Schools totals. The Private Schools Total includes schools not supported primarily by public funds, religious and nonsectarian, but not including homeschool students. Private Schools projections begin in school year 2011-12. The Public Schools Total will not exactly equal the sum of the races/ethnicities columns, which are projected separately. Prior to 2010-11, data were not available separately for Asian and Pacific Islander students, and Two or More Races students. Hawai‘ian/Pacific Islander and Two or More Races counts are displayed separately in the years they were reported for informational purposes, but are included in the race categories in the projected years. For more detailed information, see Appendix C: Technical Information and Methodology at www.wiche.edu/knocking.Source: Western Interstate Commission for Higher Education, Knocking at the College Door: Projections of High School Graduates, 2016.
American Asian/Pacific White Black Indian/ Islander AlaskaNative (combined)
Hispanic Non-HispanicPUBLIC
SCHOOLSTOTAL
PRIVATESCHOOLS
TOTALGRANDTOTAL
Hawai‘ian/Pacific
Islander
Two or More Races
School Year Alone, or Any Race
Available Data for Additional
Race Categories
Repo
rted
Cou
nts
of H
igh
Scho
ol G
radu
ates
Proj
ectio
ns o
f Hig
h Sc
hool
Gra
duat
es
2000-01
2001-02
2002-03
2003-04
2004-05
2005-06
2006-07
2007-08
2008-09
2009-10
2010-11
2011-12
2012-13
2013-14
2014-15
2015-16
2016-17
2017-18
2018-19
2019-20
2020-21
2021-22
2022-23
2023-24
2024-25
2025-26
2026-27
2027-28
2028-29
2029-30
2030-31
2031-32
AT THE COLLEGE DOORKNOCKING APPENDIX A . HIGH SCHOOL GRADUATE DATA TABLES
7,000
7,500
8,000
8,500
9,000
9,500
10,000
10,500
9,391 510 8,881 65 8,358 41 334 83
9,304 508 8,796 62 8,232 49 354 99
9,505 506 8,999 78 8,319 85 426 91
9,541 540 9,001 98 8,262 108 415 118
9,093 508 8,585 91 7,879 91 417 107
9,077 488 8,589 109 7,713 103 561 103
8,902 556 8,346 116 7,535 93 491 111
9,156 574 8,582 129 7,707 125 515 111
8,641 518 8,123 137 7,192 141 554 99
8,696 534 8,162 152 7,296 145 477 92
8,901 653 8,248 175 7,334 157 479 103 7 52
8,867 671 8,196 196 7,180 188 480 152 10 63
8,947 708 8,239 229 7,099 211 548 150 5 83
8,582 688 7,894 210 6,775 172 570 158
8,545 719 7,826 249 6,747 167 485 168
8,360 654 7,707 272 6,504 191 505 206
8,405 617 7,788 282 6,663 171 496 174
8,703 668 8,035 331 6,809 202 501 219
8,522 632 7,890 320 6,601 221 529 211
8,698 698 8,000 383 6,667 185 531 241
8,862 684 8,178 440 6,782 200 526 271
9,074 677 8,398 463 6,934 224 539 291
9,541 686 8,855 622 7,223 231 576 271
9,702 729 8,973 627 7,341 253 560 298
10,002 755 9,248 770 7,521 241 564 330
9,825 737 9,088 697 7,339 296 581 364
9,725 725 9,000 712 7,282 340 557 354
9,654 719 8,935 785 7,221 348 538 351
9,663 723 8,941 782 7,091 345 562 508
9,857 738 9,119 846 7,242 402 556 500
9,989 747 9,242 799 7,300 421 571 616
10,000 747 9,253 924 7,297 452 551 604
S O U T H D A KOTA
2021-22 2031-32
10,000
PublicPublic & Private
10.5K
7.0K
8,867• 9,200 high school graduates, on average, projected per year between school years 2011-12 and 2031-32.
• The total number of graduates is projected to increase by 12.8% between 2011-12 and 2024-25, the next highest year for South Dakota.
2011-12
10,002
December 2016 97

Notes: School Year refers to the K-12 calendar running fall to spring and may include graduates from any point in that school year, including the summer after the year end. The Grand Total is the sum of the Private Schools and Public Schools totals. The Private Schools Total includes schools not supported primarily by public funds, religious and nonsectarian, but not including homeschool students. Private Schools projections begin in school year 2011-12. The Public Schools Total will not exactly equal the sum of the races/ethnicities columns, which are projected separately. Prior to 2010-11, data were not available separately for Asian and Pacific Islander students, and Two or More Races students. Hawai‘ian/Pacific Islander and Two or More Races counts are displayed separately in the years they were reported for informational purposes, but are included in the race categories in the projected years. For more detailed information, see Appendix C: Technical Information and Methodology at www.wiche.edu/knocking.Source: Western Interstate Commission for Higher Education, Knocking at the College Door: Projections of High School Graduates, 2016.
American Asian/Pacific White Black Indian/ Islander AlaskaNative (combined)
Hispanic Non-HispanicPUBLIC
SCHOOLSTOTAL
PRIVATESCHOOLS
TOTALGRANDTOTAL
Hawai‘ian/Pacific
Islander
Two or More Races
School Year Alone, or Any Race
Available Data for Additional
Race Categories
Repo
rted
Cou
nts
of H
igh
Scho
ol G
radu
ates
Proj
ectio
ns o
f Hig
h Sc
hool
Gra
duat
es
2000-01
2001-02
2002-03
2003-04
2004-05
2005-06
2006-07
2007-08
2008-09
2009-10
2010-11
2011-12
2012-13
2013-14
2014-15
2015-16
2016-17
2017-18
2018-19
2019-20
2020-21
2021-22
2022-23
2023-24
2024-25
2025-26
2026-27
2027-28
2028-29
2029-30
2030-31
2031-32
AT THE COLLEGE DOORKNOCKING APPENDIX A . HIGH SCHOOL GRADUATE DATA TABLES
57,000
59,000
61,000
63,000
65,000
67,000
69,000
71,000
46,104 5,462 40,642 409 31,559 8,052 66 556
46,354 5,460 40,894 479 31,495 8,303 57 562
49,570 5,457 44,113 553 34,519 8,309 84 648
51,448 5,352 46,096 642 35,364 9,301 63 726
53,831 5,864 47,967 840 36,254 10,086 47 740
57,165 6,285 50,880 995 37,896 11,086 74 829
60,391 5,889 54,502 1,146 40,140 12,188 94 934
64,761 7,275 57,486 1,567 41,700 13,207 105 906
66,587 6,219 60,368 1,762 43,360 14,221 109 916
68,790 6,382 62,408 2,046 43,934 15,242 124 1,062
67,719 5,857 61,862 2,271 43,329 15,053 169 1,040 78
68,331 5,877 62,454 2,549 43,337 15,277 172 1,119 85
67,007 5,684 61,323 2,800 42,682 14,509 147 1,185 72
66,336 5,369 60,967 3,131 42,295 14,254 132 1,151
65,956 4,994 60,962 3,349 42,241 14,120 145 1,112
66,235 5,035 61,200 3,516 42,398 13,940 147 1,209
67,044 5,052 61,992 3,862 42,702 14,042 154 1,254
67,863 4,821 63,042 4,434 43,115 14,092 147 1,348
67,268 4,335 62,933 5,009 42,828 13,724 140 1,408
65,892 3,961 61,931 5,163 41,829 13,616 143 1,368
65,499 3,770 61,729 5,584 41,287 13,478 133 1,523
65,399 3,623 61,776 5,989 41,295 13,188 139 1,526
65,606 3,262 62,344 6,783 41,289 13,181 108 1,473
67,670 3,890 63,780 7,487 41,528 13,660 110 1,596
68,595 4,005 64,590 8,122 41,700 13,882 103 1,477
68,867 3,884 64,983 7,950 41,716 14,506 86 1,549
66,142 3,685 62,457 7,322 40,175 13,909 93 1,701
63,751 3,544 60,207 6,966 39,019 13,191 114 1,547
63,766 3,599 60,167 6,842 39,072 13,091 90 1,633
64,365 3,636 60,730 6,840 39,444 13,175 92 1,763
64,172 3,608 60,565 6,727 39,269 13,341 88 1,692
65,459 3,674 61,785 6,844 40,089 13,480 100 1,840
T E N N E S S E E
2021-22 2031-32
65,459
PublicPublic & Private
72K
57K
68,331
• 66,200 high school graduates, on average, projected per year between school years 2011-12 and 2031-32.
• The total number of graduates is projected to increase by 0.8% between 2011-12 and 2025-26, the next highest year for Tennessee.
2011-12
68,867
Projections of High School Graduates98

Notes: School Year refers to the K-12 calendar running fall to spring and may include graduates from any point in that school year, including the summer after the year end. The Grand Total is the sum of the Private Schools and Public Schools totals. The Private Schools Total includes schools not supported primarily by public funds, religious and nonsectarian, but not including homeschool students. Private Schools projections begin in school year 2011-12. The Public Schools Total will not exactly equal the sum of the races/ethnicities columns, which are projected separately. Prior to 2010-11, data were not available separately for Asian and Pacific Islander students, and Two or More Races students. Hawai‘ian/Pacific Islander and Two or More Races counts are displayed separately in the years they were reported for informational purposes, but are included in the race categories in the projected years. For more detailed information, see Appendix C: Technical Information and Methodology at www.wiche.edu/knocking.Source: Western Interstate Commission for Higher Education, Knocking at the College Door: Projections of High School Graduates, 2016.
American Asian/Pacific White Black Indian/ Islander AlaskaNative (combined)
Hispanic Non-HispanicPUBLIC
SCHOOLSTOTAL
PRIVATESCHOOLS
TOTALGRANDTOTAL
Hawai‘ian/Pacific
Islander
Two or More Races
School Year Alone, or Any Race
Available Data for Additional
Race Categories
Repo
rted
Cou
nts
of H
igh
Scho
ol G
radu
ates
Proj
ectio
ns o
f Hig
h Sc
hool
Gra
duat
es
2000-01
2001-02
2002-03
2003-04
2004-05
2005-06
2006-07
2007-08
2008-09
2009-10
2010-11
2011-12
2012-13
2013-14
2014-15
2015-16
2016-17
2017-18
2018-19
2019-20
2020-21
2021-22
2022-23
2023-24
2024-25
2025-26
2026-27
2027-28
2028-29
2029-30
2030-31
2031-32
AT THE COLLEGE DOORKNOCKING APPENDIX A . HIGH SCHOOL GRADUATE DATA TABLES
280,000
300,000
320,000
340,000
360,000
380,000
225,816 10,500 215,316 69,595 109,634 28,295 574 7,218
235,758 10,591 225,167 74,466 112,386 30,030 578 7,707
248,793 10,682 238,111 80,777 116,818 31,801 670 8,045
254,408 10,243 244,165 85,412 116,499 33,213 739 8,304
251,215 11,498 239,717 84,566 113,213 32,811 764 8,363
252,765 12,280 240,485 85,455 112,994 32,183 816 9,037
253,116 11,923 241,193 86,332 112,215 32,139 882 9,625
264,869 12,748 252,121 94,571 112,983 33,873 944 9,750
277,178 12,903 264,275 104,854 112,016 35,982 961 10,462
294,081 13,187 280,894 120,985 110,456 37,491 1,472 10,490
303,308 12,838 290,470 127,719 110,458 39,679 1,463 11,151 406 4,178
305,710 13,179 292,531 131,045 109,060 39,355 1,471 11,600 396 4,854
314,443 13,053 301,390 139,783 107,843 40,001 1,355 12,407 394 5,014
313,846 12,872 300,974 139,947 107,432 38,767 1,270 13,243
318,595 12,699 305,896 145,301 106,284 39,222 1,373 13,668
328,841 12,402 316,439 153,900 106,644 40,489 1,330 13,851
328,451 12,224 316,227 153,399 107,283 39,853 1,263 14,019
341,612 11,969 329,644 162,849 108,761 41,315 1,147 15,358
348,578 11,600 336,978 169,964 107,870 41,706 1,127 16,125
344,580 11,030 333,550 168,816 106,092 41,256 1,072 16,300
350,471 10,827 339,643 173,798 106,256 41,514 1,029 17,164
353,536 10,354 343,182 176,988 105,851 41,825 941 17,802
358,973 9,714 349,259 181,243 106,353 42,730 1,033 18,141
364,839 11,059 353,780 184,850 105,943 43,782 1,073 18,328
374,687 11,292 363,395 190,739 107,874 44,966 1,035 19,088
374,141 11,116 363,025 190,482 107,030 45,209 1,097 20,711
370,813 10,905 359,908 188,793 105,781 44,789 1,066 21,203
355,899 10,445 345,454 177,366 103,515 43,719 1,133 21,127
347,356 10,307 337,049 170,894 102,340 42,101 1,044 21,537
352,494 10,455 342,039 171,386 103,780 43,491 1,090 23,737
356,918 10,560 346,358 173,835 104,567 44,837 1,077 23,626
368,348 10,884 357,464 177,577 107,907 46,943 1,054 26,139
T E X A S
2021-22 2031-32
368,348
PublicPublic & Private
390K
280K
305,710
• 2nd highest producer of high school graduates with 346,300 high school graduates, on average, projected per year between school years 2011-12 and 2031-32.
• The total number of graduates is projected to increase by 22.6% between 2011-12 and 2024-25, the next highest year for Texas. 2011-12
December 2016 99

Notes: School Year refers to the K-12 calendar running fall to spring and may include graduates from any point in that school year, including the summer after the year end. The Grand Total is the sum of the Private Schools and Public Schools totals. The Private Schools Total includes schools not supported primarily by public funds, religious and nonsectarian, but not including homeschool students. Private Schools projections begin in school year 2011-12. The Public Schools Total will not exactly equal the sum of the races/ethnicities columns, which are projected separately. Prior to 2010-11, data were not available separately for Asian and Pacific Islander students, and Two or More Races students. Hawai‘ian/Pacific Islander and Two or More Races counts are displayed separately in the years they were reported for informational purposes, but are included in the race categories in the projected years. For more detailed information, see Appendix C: Technical Information and Methodology at www.wiche.edu/knocking.Source: Western Interstate Commission for Higher Education, Knocking at the College Door: Projections of High School Graduates, 2016.
American Asian/Pacific White Black Indian/ Islander AlaskaNative (combined)
Hispanic Non-HispanicPUBLIC
SCHOOLSTOTAL
PRIVATESCHOOLS
TOTALGRANDTOTAL
Hawai‘ian/Pacific
Islander
Two or More Races
School Year Alone, or Any Race
Available Data for Additional
Race Categories
Repo
rted
Cou
nts
of H
igh
Scho
ol G
radu
ates
Proj
ectio
ns o
f Hig
h Sc
hool
Gra
duat
es
2000-01
2001-02
2002-03
2003-04
2004-05
2005-06
2006-07
2007-08
2008-09
2009-10
2010-11
2011-12
2012-13
2013-14
2014-15
2015-16
2016-17
2017-18
2018-19
2019-20
2020-21
2021-22
2022-23
2023-24
2024-25
2025-26
2026-27
2027-28
2028-29
2029-30
2030-31
2031-32
AT THE COLLEGE DOORKNOCKING APPENDIX A . HIGH SCHOOL GRADUATE DATA TABLES
30,000
35,000
40,000
45,000
31,856 820 31,036 1,527 28,209 184 348 768
31,128 945 30,183 1,574 27,307 172 313 817
30,597 1,070 29,527 1,590 26,555 203 340 808
31,346 1,094 30,252 1,838 26,975 218 377 844
31,341 1,088 30,253 1,838 26,976 218 377 844
30,230 1,180 29,050 2,021 25,575 231 341 844
29,627 1,351 28,276 2,100 24,679 231 390 876
29,581 1,414 28,167 2,063 24,549 229 382 868
31,733 1,270 30,463 2,707 25,801 344 420 1,086
32,766 1,285 31,481 3,096 26,357 367 442 1,113
32,101 1,213 30,888 3,295 25,720 363 389 1,121 457 225
32,426 1,269 31,157 3,719 25,526 380 400 1,132 438 321
34,470 1,284 33,186 4,100 27,147 408 379 1,152 466 419
34,482 1,222 33,260 4,122 27,063 387 370 1,172
35,363 1,164 34,199 4,340 27,790 373 375 1,178
36,614 1,158 35,455 4,675 28,674 396 377 1,215
37,874 1,108 36,766 4,952 29,688 433 360 1,242
38,706 1,032 37,674 5,193 30,349 412 357 1,275
39,100 1,007 38,093 5,380 30,605 445 353 1,194
39,532 921 38,611 5,643 30,876 438 329 1,221
40,702 859 39,843 5,955 31,758 410 342 1,309
41,269 811 40,458 6,024 32,434 397 309 1,288
41,353 734 40,620 6,076 32,663 380 292 1,254
42,580 893 41,687 6,238 33,697 384 290 1,189
43,641 919 42,722 6,651 34,266 382 306 1,254
44,563 909 43,655 7,389 34,143 488 324 1,502
43,165 867 42,298 6,867 33,564 471 292 1,289
41,754 838 40,916 6,240 32,842 487 266 1,259
40,877 834 40,043 5,907 32,380 466 253 1,225
41,074 838 40,237 5,875 31,690 410 268 1,301
40,720 827 39,893 5,960 31,214 466 259 1,312
40,875 828 40,047 6,006 31,238 477 249 1,337
U TA H
2021-22 2031-32
40,875
PublicPublic & Private
47K
30K
32,426
• 39,600 high school graduates, on average, projected per year between school years 2011-12 and 2031-32.
• The total number of graduates is projected to increase by 37.4% between 2011-12 and 2025-26, the next highest year for Utah.
2011-12
44,563
Projections of High School Graduates100

Notes: School Year refers to the K-12 calendar running fall to spring and may include graduates from any point in that school year, including the summer after the year end. The Grand Total is the sum of the Private Schools and Public Schools totals. The Private Schools Total includes schools not supported primarily by public funds, religious and nonsectarian, but not including homeschool students. Private Schools projections begin in school year 2011-12. The Public Schools Total will not exactly equal the sum of the races/ethnicities columns, which are projected separately. Prior to 2010-11, data were not available separately for Asian and Pacific Islander students, and Two or More Races students. Hawai‘ian/Pacific Islander and Two or More Races counts are displayed separately in the years they were reported for informational purposes, but are included in the race categories in the projected years. For more detailed information, see Appendix C: Technical Information and Methodology at www.wiche.edu/knocking.Source: Western Interstate Commission for Higher Education, Knocking at the College Door: Projections of High School Graduates, 2016.
American Asian/Pacific White Black Indian/ Islander AlaskaNative (combined)
Hispanic Non-HispanicPUBLIC
SCHOOLSTOTAL
PRIVATESCHOOLS
TOTALGRANDTOTAL
Hawai‘ian/Pacific
Islander
Two or More Races
School Year Alone, or Any Race
Available Data for Additional
Race Categories
Repo
rted
Cou
nts
of H
igh
Scho
ol G
radu
ates
Proj
ectio
ns o
f Hig
h Sc
hool
Gra
duat
es
2000-01
2001-02
2002-03
2003-04
2004-05
2005-06
2006-07
2007-08
2008-09
2009-10
2010-11
2011-12
2012-13
2013-14
2014-15
2015-16
2016-17
2017-18
2018-19
2019-20
2020-21
2021-22
2022-23
2023-24
2024-25
2025-26
2026-27
2027-28
2028-29
2029-30
2030-31
2031-32
AT THE COLLEGE DOORKNOCKING APPENDIX A . HIGH SCHOOL GRADUATE DATA TABLES
5,000
5,500
6,000
6,500
7,000
7,500
8,000
8,198 1,342 6,856 48 6,620 48 28 112
8,439 1,356 7,083 40 6,822 47 40 135
8,340 1,370 6,970 46 6,689 59 43 133
8,410 1,310 7,100 63 6,753 89 40 147
8,302 1,150 7,152 58 6,315 69 38 95
7,966 1,187 6,779 72 6,451 87 51 118
9,076 1,759 7,317 63 6,325 91 96 92
9,097 1,705 7,392 72 6,408 93 47 99
8,376 1,167 7,209 61 6,858 100 39 164 13 38
8,547 1,348 7,199 81 6,773 120 32 193 8 51
7,931 999 6,932 96 6,476 129 23 208 9 103
7,947 1,088 6,859 93 6,449 120 26 170 5 132
7,432 941 6,491 83 6,101 138 12 156 9 160
7,175 825 6,349 78 5,944 123 13 219
7,137 834 6,303 105 5,875 124 20 216
7,069 858 6,211 105 5,793 102 15 249
7,160 824 6,336 110 5,899 145 29 188
6,777 762 6,015 131 5,561 137 29 215
6,676 709 5,967 104 5,531 130 30 246
6,594 715 5,879 125 5,455 109 23 241
6,541 708 5,832 127 5,369 132 22 278
6,536 639 5,897 150 5,437 123 34 247
6,504 550 5,954 159 5,478 123 81 264
6,374 648 5,726 151 5,256 121 66 289
6,550 655 5,896 193 5,412 127 75 235
6,349 627 5,722 167 5,230 165 58 284
6,121 594 5,527 206 5,042 129 106 273
6,245 603 5,643 170 5,138 180 104 278
6,076 597 5,479 159 4,949 142 108 405
5,980 587 5,394 217 4,852 149 58 403
6,077 595 5,483 205 4,849 175 64 376
6,117 597 5,520 204 4,961 188 96 407
V E R M O N T
2021-22 2031-32
6,117
PublicPublic & Private
8.3K
5.0K
7,947
• 6,600 high school graduates, on average, projected per year between school years 2011-12 and 2031-32.
• The total number of graduates in Vermont is not projected to increase after 2011-12, ending at 6,100 in 2031-32.
2011-12
December 2016 101

Notes: School Year refers to the K-12 calendar running fall to spring and may include graduates from any point in that school year, including the summer after the year end. The Grand Total is the sum of the Private Schools and Public Schools totals. The Private Schools Total includes schools not supported primarily by public funds, religious and nonsectarian, but not including homeschool students. Private Schools projections begin in school year 2011-12. The Public Schools Total will not exactly equal the sum of the races/ethnicities columns, which are projected separately. Prior to 2010-11, data were not available separately for Asian and Pacific Islander students, and Two or More Races students. Hawai‘ian/Pacific Islander and Two or More Races counts are displayed separately in the years they were reported for informational purposes, but are included in the race categories in the projected years. For more detailed information, see Appendix C: Technical Information and Methodology at www.wiche.edu/knocking.Source: Western Interstate Commission for Higher Education, Knocking at the College Door: Projections of High School Graduates, 2016.
American Asian/Pacific White Black Indian/ Islander AlaskaNative (combined)
Hispanic Non-HispanicPUBLIC
SCHOOLSTOTAL
PRIVATESCHOOLS
TOTALGRANDTOTAL
Hawai‘ian/Pacific
Islander
Two or More Races
School Year Alone, or Any Race
Available Data for Additional
Race Categories
Repo
rted
Cou
nts
of H
igh
Scho
ol G
radu
ates
Proj
ectio
ns o
f Hig
h Sc
hool
Gra
duat
es
2000-01
2001-02
2002-03
2003-04
2004-05
2005-06
2006-07
2007-08
2008-09
2009-10
2010-11
2011-12
2012-13
2013-14
2014-15
2015-16
2016-17
2017-18
2018-19
2019-20
2020-21
2021-22
2022-23
2023-24
2024-25
2025-26
2026-27
2027-28
2028-29
2029-30
2030-31
2031-32
AT THE COLLEGE DOORKNOCKING APPENDIX A . HIGH SCHOOL GRADUATE DATA TABLES
78,000
83,000
88,000
93,000
98,000
71,537 5,470 66,067 2,342 45,339 14,930 145 3,311
72,254 5,735 66,519 2,454 45,485 15,084 143 3,353
78,943 6,000 72,943 2,894 48,605 16,896 150 3,716
78,119 6,077 72,042 2,956 48,300 16,751 156 3,591
80,761 7,094 73,667 3,556 48,428 17,042 178 4,013
76,992 7,395 69,597 3,537 46,010 15,774 198 4,078
80,910 6,913 73,997 3,916 47,804 16,982 181 4,310
84,625 7,256 77,369 4,394 49,155 17,960 200 4,689
86,162 6,511 79,651 4,960 49,490 18,961 240 4,758
88,003 6,492 81,511 5,508 49,860 19,642 260 4,970
89,297 6,402 82,895 6,901 50,088 20,308 300 5,299 113 2,712
89,956 6,620 83,336 7,542 50,041 20,218 270 5,266 108 2,966
89,890 6,611 83,279 8,055 49,991 19,430 277 5,525 110 3,276
88,589 6,099 82,490 8,094 49,356 18,855 270 5,873
87,856 5,935 81,921 8,654 48,572 18,729 285 5,789
88,707 5,848 82,859 9,490 48,590 19,052 282 6,012
87,930 5,570 82,360 10,103 48,303 18,507 298 6,053
90,456 5,494 84,962 10,996 49,258 19,105 259 6,649
90,213 5,203 85,010 11,722 49,173 18,655 261 6,967
89,790 4,935 84,855 12,765 48,261 18,605 275 7,301
89,657 4,772 84,885 13,347 48,370 18,288 260 7,649
91,059 4,595 86,465 14,561 49,151 18,278 259 8,008
91,009 4,334 86,676 15,694 48,584 18,451 299 8,107
93,342 4,931 88,411 17,232 48,975 18,859 335 8,348
95,632 4,974 90,659 18,759 49,684 19,493 360 8,636
93,457 4,806 88,651 17,722 48,386 19,139 362 8,621
91,822 4,684 87,138 16,848 47,532 18,923 342 8,865
89,939 4,586 85,353 15,328 47,468 18,344 338 8,790
89,654 4,616 85,038 15,315 47,487 17,946 246 8,772
90,093 4,632 85,461 15,928 47,246 18,007 416 9,067
89,309 4,582 84,727 16,112 46,621 17,964 471 8,742
90,284 4,628 85,656 16,602 47,086 17,716 377 9,303
V I R G I N I A
2021-22 2031-32
90,284
PublicPublic & Private
100K
78K
89,956• 90,400 high school graduates, on average, projected per year between school years 2011-12 and 2031-32.
• The total number of graduates is projected to increase by 6.3% between 2011-12 and 2024-25, the next highest year for Virginia.
2011-12
95,632
Projections of High School Graduates102
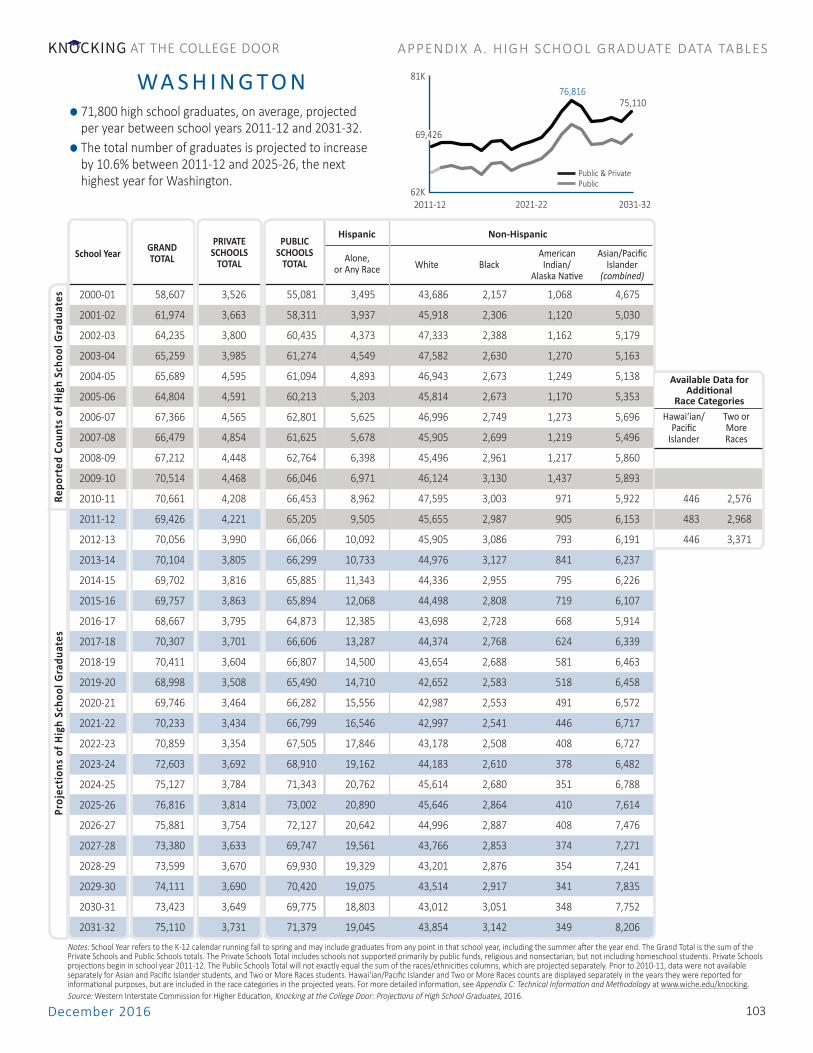
Notes: School Year refers to the K-12 calendar running fall to spring and may include graduates from any point in that school year, including the summer after the year end. The Grand Total is the sum of the Private Schools and Public Schools totals. The Private Schools Total includes schools not supported primarily by public funds, religious and nonsectarian, but not including homeschool students. Private Schools projections begin in school year 2011-12. The Public Schools Total will not exactly equal the sum of the races/ethnicities columns, which are projected separately. Prior to 2010-11, data were not available separately for Asian and Pacific Islander students, and Two or More Races students. Hawai‘ian/Pacific Islander and Two or More Races counts are displayed separately in the years they were reported for informational purposes, but are included in the race categories in the projected years. For more detailed information, see Appendix C: Technical Information and Methodology at www.wiche.edu/knocking.Source: Western Interstate Commission for Higher Education, Knocking at the College Door: Projections of High School Graduates, 2016.
American Asian/Pacific White Black Indian/ Islander AlaskaNative (combined)
Hispanic Non-HispanicPUBLIC
SCHOOLSTOTAL
PRIVATESCHOOLS
TOTALGRANDTOTAL
Hawai‘ian/Pacific
Islander
Two or More Races
School Year Alone, or Any Race
Available Data for Additional
Race Categories
Repo
rted
Cou
nts
of H
igh
Scho
ol G
radu
ates
Proj
ectio
ns o
f Hig
h Sc
hool
Gra
duat
es
2000-01
2001-02
2002-03
2003-04
2004-05
2005-06
2006-07
2007-08
2008-09
2009-10
2010-11
2011-12
2012-13
2013-14
2014-15
2015-16
2016-17
2017-18
2018-19
2019-20
2020-21
2021-22
2022-23
2023-24
2024-25
2025-26
2026-27
2027-28
2028-29
2029-30
2030-31
2031-32
AT THE COLLEGE DOORKNOCKING APPENDIX A . HIGH SCHOOL GRADUATE DATA TABLES
62,000
67,000
72,000
77,000
58,607 3,526 55,081 3,495 43,686 2,157 1,068 4,675
61,974 3,663 58,311 3,937 45,918 2,306 1,120 5,030
64,235 3,800 60,435 4,373 47,333 2,388 1,162 5,179
65,259 3,985 61,274 4,549 47,582 2,630 1,270 5,163
65,689 4,595 61,094 4,893 46,943 2,673 1,249 5,138
64,804 4,591 60,213 5,203 45,814 2,673 1,170 5,353
67,366 4,565 62,801 5,625 46,996 2,749 1,273 5,696
66,479 4,854 61,625 5,678 45,905 2,699 1,219 5,496
67,212 4,448 62,764 6,398 45,496 2,961 1,217 5,860
70,514 4,468 66,046 6,971 46,124 3,130 1,437 5,893
70,661 4,208 66,453 8,962 47,595 3,003 971 5,922 446 2,576
69,426 4,221 65,205 9,505 45,655 2,987 905 6,153 483 2,968
70,056 3,990 66,066 10,092 45,905 3,086 793 6,191 446 3,371
70,104 3,805 66,299 10,733 44,976 3,127 841 6,237
69,702 3,816 65,885 11,343 44,336 2,955 795 6,226
69,757 3,863 65,894 12,068 44,498 2,808 719 6,107
68,667 3,795 64,873 12,385 43,698 2,728 668 5,914
70,307 3,701 66,606 13,287 44,374 2,768 624 6,339
70,411 3,604 66,807 14,500 43,654 2,688 581 6,463
68,998 3,508 65,490 14,710 42,652 2,583 518 6,458
69,746 3,464 66,282 15,556 42,987 2,553 491 6,572
70,233 3,434 66,799 16,546 42,997 2,541 446 6,717
70,859 3,354 67,505 17,846 43,178 2,508 408 6,727
72,603 3,692 68,910 19,162 44,183 2,610 378 6,482
75,127 3,784 71,343 20,762 45,614 2,680 351 6,788
76,816 3,814 73,002 20,890 45,646 2,864 410 7,614
75,881 3,754 72,127 20,642 44,996 2,887 408 7,476
73,380 3,633 69,747 19,561 43,766 2,853 374 7,271
73,599 3,670 69,930 19,329 43,201 2,876 354 7,241
74,111 3,690 70,420 19,075 43,514 2,917 341 7,835
73,423 3,649 69,775 18,803 43,012 3,051 348 7,752
75,110 3,731 71,379 19,045 43,854 3,142 349 8,206
WA S H I N G TO N
2021-22 2031-32
75,110
PublicPublic & Private
81K
62K
69,426
• 71,800 high school graduates, on average, projected per year between school years 2011-12 and 2031-32.
• The total number of graduates is projected to increase by 10.6% between 2011-12 and 2025-26, the next highest year for Washington.
2011-12
76,816
December 2016 103

Notes: School Year refers to the K-12 calendar running fall to spring and may include graduates from any point in that school year, including the summer after the year end. The Grand Total is the sum of the Private Schools and Public Schools totals. The Private Schools Total includes schools not supported primarily by public funds, religious and nonsectarian, but not including homeschool students. Private Schools projections begin in school year 2011-12. The Public Schools Total will not exactly equal the sum of the races/ethnicities columns, which are projected separately. Prior to 2010-11, data were not available separately for Asian and Pacific Islander students, and Two or More Races students. Hawai‘ian/Pacific Islander and Two or More Races counts are displayed separately in the years they were reported for informational purposes, but are included in the race categories in the projected years. For more detailed information, see Appendix C: Technical Information and Methodology at www.wiche.edu/knocking.Source: Western Interstate Commission for Higher Education, Knocking at the College Door: Projections of High School Graduates, 2016.
American Asian/Pacific White Black Indian/ Islander AlaskaNative (combined)
Hispanic Non-HispanicPUBLIC
SCHOOLSTOTAL
PRIVATESCHOOLS
TOTALGRANDTOTAL
Hawai‘ian/Pacific
Islander
Two or More Races
School Year Alone, or Any Race
Available Data for Additional
Race Categories
Repo
rted
Cou
nts
of H
igh
Scho
ol G
radu
ates
Proj
ectio
ns o
f Hig
h Sc
hool
Gra
duat
es
2000-01
2001-02
2002-03
2003-04
2004-05
2005-06
2006-07
2007-08
2008-09
2009-10
2010-11
2011-12
2012-13
2013-14
2014-15
2015-16
2016-17
2017-18
2018-19
2019-20
2020-21
2021-22
2022-23
2023-24
2024-25
2025-26
2026-27
2027-28
2028-29
2029-30
2030-31
2031-32
AT THE COLLEGE DOORKNOCKING APPENDIX A . HIGH SCHOOL GRADUATE DATA TABLES
15,000
16,000
17,000
18,000
19,000
20,000
19,267 827 18,440 54 17,573 665 17 131
17,949 821 17,128 70 16,281 600 29 148
18,102 815 17,287 64 16,380 674 13 156
18,119 780 17,339 80 16,462 636 12 149
17,933 796 17,137 85 16,249 659 14 130
17,531 768 16,763 119 15,856 630 21 137
18,012 605 17,407 87 16,475 715 16 114
18,140 651 17,489 115 16,489 724 14 147
18,429 739 17,690 140 16,644 741 16 149
18,446 795 17,651 137 16,499 851 21 143 1 24
17,971 660 17,311 146 16,153 857 17 131 45
18,277 674 17,603 164 16,369 920 13 130 47
18,580 656 17,924 174 16,671 922 19 132 105
18,013 649 17,365 188 16,144 878 14 137
17,750 611 17,138 195 15,935 835 21 148
17,990 561 17,430 209 16,171 865 24 158
17,477 572 16,905 216 15,679 849 20 140
17,815 597 17,218 243 15,990 817 27 147
17,447 576 16,870 271 15,665 791 16 138
17,511 572 16,939 234 15,791 765 14 145
17,221 540 16,681 266 15,558 719 19 139
17,417 540 16,877 307 15,786 663 22 140
17,189 523 16,667 359 15,591 624 18 137
17,123 551 16,572 356 15,495 622 19 144
17,576 577 16,999 392 16,004 555 13 132
17,516 558 16,957 430 15,791 700 20 147
17,383 551 16,832 425 15,678 718 19 117
16,693 530 16,162 379 15,078 633 21 150
16,855 539 16,315 363 15,200 608 17 147
16,842 539 16,303 340 15,227 651 8 145
16,892 539 16,353 393 15,243 627 9 179
16,534 527 16,007 627 14,716 642 9 160
W E S T V I R G I N I A
2021-22 2031-32
16,534
PublicPublic & Private
20K
15K
18,277• 17,400 high school graduates, on average, projected per year between school years 2011-12 and 2031-32.
• The total number of graduates in West Virginia is not projected to increase after 2011-12, ending at 16,500 in 2031-32.
2011-12
Projections of High School Graduates104

Notes: School Year refers to the K-12 calendar running fall to spring and may include graduates from any point in that school year, including the summer after the year end. The Grand Total is the sum of the Private Schools and Public Schools totals. The Private Schools Total includes schools not supported primarily by public funds, religious and nonsectarian, but not including homeschool students. Private Schools projections begin in school year 2011-12. The Public Schools Total will not exactly equal the sum of the races/ethnicities columns, which are projected separately. Prior to 2010-11, data were not available separately for Asian and Pacific Islander students, and Two or More Races students. Hawai‘ian/Pacific Islander and Two or More Races counts are displayed separately in the years they were reported for informational purposes, but are included in the race categories in the projected years. For more detailed information, see Appendix C: Technical Information and Methodology at www.wiche.edu/knocking.Source: Western Interstate Commission for Higher Education, Knocking at the College Door: Projections of High School Graduates, 2016.
American Asian/Pacific White Black Indian/ Islander AlaskaNative (combined)
Hispanic Non-HispanicPUBLIC
SCHOOLSTOTAL
PRIVATESCHOOLS
TOTALGRANDTOTAL
Hawai‘ian/Pacific
Islander
Two or More Races
School Year Alone, or Any Race
Available Data for Additional
Race Categories
Repo
rted
Cou
nts
of H
igh
Scho
ol G
radu
ates
Proj
ectio
ns o
f Hig
h Sc
hool
Gra
duat
es
2000-01
2001-02
2002-03
2003-04
2004-05
2005-06
2006-07
2007-08
2008-09
2009-10
2010-11
2011-12
2012-13
2013-14
2014-15
2015-16
2016-17
2017-18
2018-19
2019-20
2020-21
2021-22
2022-23
2023-24
2024-25
2025-26
2026-27
2027-28
2028-29
2029-30
2030-31
2031-32
AT THE COLLEGE DOORKNOCKING APPENDIX A . HIGH SCHOOL GRADUATE DATA TABLES
54,000
59,000
64,000
69,000
64,728 5,387 59,341 1,557 52,835 2,835 547 1,567
66,283 5,708 60,575 1,792 53,255 3,148 623 1,757
69,300 6,028 63,272 1,870 55,679 3,196 668 1,859
69,293 6,042 63,251 2,036 55,123 3,474 684 1,935
68,894 5,665 63,229 2,201 54,566 3,751 700 2,011
68,665 5,662 63,003 2,430 53,607 4,040 776 2,150
69,394 5,426 63,968 2,580 54,078 4,332 776 2,202
70,684 5,501 65,183 2,840 54,288 4,827 800 2,428
71,017 5,607 65,410 3,122 53,987 4,920 848 2,533
70,436 5,749 64,687 3,364 53,119 5,050 893 2,261
69,555 5,420 64,135 3,756 51,976 5,148 797 2,457 34 613
68,185 5,480 62,705 3,952 50,848 4,811 779 2,316 47 710
66,747 5,322 61,425 4,155 49,419 4,826 693 2,332 29 862
66,068 5,422 60,647 4,402 48,618 4,618 677 2,300
65,173 5,431 59,743 4,499 47,734 4,621 608 2,213
65,174 5,137 60,037 4,932 47,582 4,634 643 2,162
65,189 5,051 60,138 5,143 47,363 4,624 621 2,233
66,246 4,980 61,266 5,454 48,197 4,565 622 2,334
65,548 4,838 60,711 5,940 47,377 4,367 596 2,355
64,536 4,676 59,860 5,951 46,573 4,339 595 2,311
65,056 4,578 60,479 6,267 46,855 4,309 581 2,397
65,662 4,452 61,210 6,526 47,280 4,309 571 2,464
65,133 4,378 60,755 6,713 46,691 4,227 571 2,507
65,904 4,685 61,219 7,221 46,301 4,404 567 2,573
67,340 4,711 62,629 7,355 47,528 4,444 569 2,625
66,778 4,638 62,140 7,620 46,462 4,594 600 2,883
65,398 4,524 60,873 7,461 45,294 4,622 602 2,841
63,073 4,373 58,700 7,004 43,992 4,318 580 2,741
62,446 4,351 58,095 6,970 43,496 4,140 443 2,911
62,071 4,318 57,753 7,037 42,930 4,205 449 3,097
61,471 4,270 57,201 6,859 42,575 4,226 451 2,975
61,924 4,301 57,624 6,831 42,633 4,448 438 3,099
W I S C O N S I N
2021-22 2031-32
61,924
PublicPublic & Private
72K
54K
68,185
• 65,000 high school graduates, on average, projected per year between school years 2011-12 and 2031-32.
• The total number of graduates in Wisconsin is not projected to increase after 2011-12, ending at 61,900 in 2031-32.
2011-12
67,340
December 2016 105

Notes: School Year refers to the K-12 calendar running fall to spring and may include graduates from any point in that school year, including the summer after the year end. The Grand Total is the sum of the Private Schools and Public Schools totals. The Private Schools Total includes schools not supported primarily by public funds, religious and nonsectarian, but not including homeschool students. Private Schools projections begin in school year 2011-12. The Public Schools Total will not exactly equal the sum of the races/ethnicities columns, which are projected separately. Prior to 2010-11, data were not available separately for Asian and Pacific Islander students, and Two or More Races students. Hawai‘ian/Pacific Islander and Two or More Races counts are displayed separately in the years they were reported for informational purposes, but are included in the race categories in the projected years. For more detailed information, see Appendix C: Technical Information and Methodology at www.wiche.edu/knocking.Source: Western Interstate Commission for Higher Education, Knocking at the College Door: Projections of High School Graduates, 2016.
American Asian/Pacific White Black Indian/ Islander AlaskaNative (combined)
Hispanic Non-HispanicPUBLIC
SCHOOLSTOTAL
PRIVATESCHOOLS
TOTALGRANDTOTAL
Hawai‘ian/Pacific
Islander
Two or More Races
School Year Alone, or Any Race
Available Data for Additional
Race Categories
Repo
rted
Cou
nts
of H
igh
Scho
ol G
radu
ates
Proj
ectio
ns o
f Hig
h Sc
hool
Gra
duat
es
2000-01
2001-02
2002-03
2003-04
2004-05
2005-06
2006-07
2007-08
2008-09
2009-10
2010-11
2011-12
2012-13
2013-14
2014-15
2015-16
2016-17
2017-18
2018-19
2019-20
2020-21
2021-22
2022-23
2023-24
2024-25
2025-26
2026-27
2027-28
2028-29
2029-30
2030-31
2031-32
AT THE COLLEGE DOORKNOCKING APPENDIX A . HIGH SCHOOL GRADUATE DATA TABLES
5,200
5,700
6,200
6,700
7,200
6,125 54 6,071 279 5,578 53 98 63
6,156 50 6,106 324 5,569 60 102 51
5,891 46 5,845 297 5,351 62 82 53
5,861 28 5,833 318 5,329 33 102 51
5,651 35 5,616 328 5,104 48 80 56
5,557 30 5,527 341 4,897 64 160 65
5,492 51 5,441 328 4,882 53 119 59
5,550 56 5,494 381 4,891 55 100 67
5,541 48 5,493 414 4,815 65 130 69
5,770 75 5,695 500 4,964 63 109 60 10 48
5,664 64 5,600 565 4,798 52 122 64 11 69
5,650 97 5,553 545 4,789 58 108 54 7 68
5,595 106 5,489 565 4,704 63 89 68 12 64
5,720 123 5,597 606 4,741 73 101 72
5,675 120 5,556 593 4,718 67 102 73
5,715 102 5,613 650 4,726 65 103 62
5,744 87 5,657 662 4,764 64 98 69
5,819 100 5,720 718 4,742 86 100 65
5,864 113 5,751 755 4,735 70 108 70
5,818 100 5,718 749 4,708 61 113 72
6,115 89 6,026 809 4,932 63 121 85
6,114 89 6,025 842 4,884 74 122 88
6,378 84 6,294 951 5,028 84 137 70
6,583 105 6,478 886 5,298 76 131 70
6,753 106 6,646 857 5,478 79 137 76
7,031 106 6,925 1,117 5,554 74 126 93
6,887 103 6,784 1,029 5,508 74 116 86
6,574 98 6,475 966 5,221 112 123 76
6,417 98 6,320 869 5,133 80 107 88
6,512 99 6,413 865 5,210 97 135 103
6,561 99 6,462 944 5,196 127 115 120
6,609 100 6,509 914 5,297 105 113 107
W YO M I N G
2021-22 2031-32
6,609
PublicPublic & Private
7.4K
5.2K
5,650
• 6,200 high school graduates, on average, projected per year between school years 2011-12 and 2031-32.
• The total number of graduates is projected to increase by 24.4% between 2011-12 and 2025-26, the next highest year for Wyoming.
2011-12
7,031
Projections of High School Graduates106

11,000
13,000
15,000
17,000
19,000
21,000
23,000
25,000
27,000
1,300
1,400
1,500
1,600
1,700
1,800
1,900
2,000
2,100
Notes: School Year refers to the K-12 calendar running fall to spring and may include graduates from any point in that school year, including the summer after the year end. For more detailed information, see Appendix C: Technical Information and Methodology at www.wiche.edu/knocking.Source: Western Interstate Commission for Higher Education, Knocking at the College Door: Projections of High School Graduates, 2016.
PUBLIC SCHOOLS
TOTALSchool Year
Repo
rted
Cou
nts
of H
igh
Scho
ol G
radu
ates
Proj
ectio
ns o
f Hig
h Sc
hool
Gra
duat
es
2000-01
2001-02
2002-03
2003-04
2004-05
2005-06
2006-07
2007-08
2008-09
2009-10
2010-11
2011-12
2012-13
2013-14
2014-15
2015-16
2016-17
2017-18
2018-19
2019-20
2020-21
2021-22
2022-23
2023-24
2024-25
2025-26
2026-27
2027-28
2028-29
2029-30
2030-31
2031-32
AT THE COLLEGE DOORKNOCKING APPENDIX A . HIGH SCHOOL GRADUATE DATA TABLES
December 2016 107
1,346
1,179
1,308
1,515
1,686
1,647
1,838
1,641
1,421
1,426
1,631
1,573
1,648
1,649
1,564
1,594
1,527
1,483
1,517
1,449
1,817
1,995
1,769
1,729
1,755
1,729
1,887
1,704
1,759
G U A M
• 1,600 high school graduates, on average, projected per year between school years 2011-12 and 2031-32.
• The total number of graduates is projected to increase by 40.4% between 2011-12 and 2024-25, the next highest year for Guam.
2021-22 2031-32
1,759
2.1K
1.3K
1,421
2011-12
1,995
PUBLIC SCHOOLS
TOTALSchool Year
Repo
rted
Cou
nts
of H
igh
Scho
ol G
radu
ates
Proj
ectio
ns o
f Hig
h Sc
hool
Gra
duat
es
2000-01
2001-02
2002-03
2003-04
2004-05
2005-06
2006-07
2007-08
2008-09
2009-10
2010-11
2011-12
2012-13
2013-14
2014-15
2015-16
2016-17
2017-18
2018-19
2019-20
2020-21
2021-22
2022-23
2023-24
2024-25
2025-26
2026-27
2027-28
2028-29
2029-30
2030-31
2031-32
P U E R TOR I C O
• 18,500 high school graduates, on average, projected per year between school years 2011-12 and 2031-32.
• The total number of graduates in Puerto Rico is not projected to increase over the course of the projections, ending at 11,800 in 2031-32.
2021-22 2031-32
11,798
27K
11K
25,703
2011-12
30,154
30,278
31,408
30,083
29,071
31,896
31,718
30,016
29,286
25,514
26,909
25,703
24,695
24,932
24,043
23,364
22,359
21,684
20,361
18,861
17,773
17,489
17,276
16,381
16,123
15,754
15,362
14,446
14,081
13,367
12,534
11,798

AT THE COLLEGE DOORKNOCKING
Projections of High School Graduates108

AT THE COLLEGE DOORKNOCKING
APPENDIX B
HIGH SCHOOL ENROLLMENT DATA TABLES

AT THE COLLEGE DOORKNOCKING APPENDIX B. HIGH SCHOOL ENROLLMENT DATA TABLES

Notes: School Year refers to the K-12 calendar running fall to spring. High School Enrollments include grades 9 to 12. The Grand Total is the sum of the Private Schools and Public Schools totals. The Private Schools Total includes schools not supported primarily by public funds, religious and nonsectarian, but not including homeschool students. Private Schools projections begin in school year 2012-13. The Public Schools Total will not exactly equal the sum of the races/ethnicities columns, which are projected separately. Prior to 2010-11, data were not available separately for Asian and Pacific Islander students, and Two or More Races students. Hawai‘ian/Pacific Islander and Two or More Races counts are displayed separately in the years they were reported for informational purposes, but are included in the race catego-ries in the projected years. For more detailed information, see Appendix C: Technical Information and Methodology at www.wiche.edu/knocking.Source: Western Interstate Commission for Higher Education, Knocking at the College Door: Projections of High School Graduates, 2016.
American Asian/Pacific White Black Indian/ Islander AlaskaNative (combined)
Hispanic Non-HispanicPUBLIC
SCHOOLSTOTAL
PRIVATESCHOOLS
TOTALGRANDTOTAL
Hawai‘ian/Pacific
Islander
Two or More Races
School Year Alone, or Any Race
Available Data for Additional
Race Categories
Repo
rted
Cou
nts
of H
igh
Scho
ol E
nrol
lmen
tsPr
ojec
tions
of H
igh
Scho
ol E
nrol
lmen
ts
2000-01
2001-02
2002-03
2003-04
2004-05
2005-06
2006-07
2007-08
2008-09
2009-10
2010-11
2011-12
2012-13
2013-14
2014-15
2015-16
2016-17
2017-18
2018-19
2019-20
2020-21
2021-22
2022-23
2023-24
2024-25
2025-26
2026-27
2027-28
2028-29
AT THE COLLEGE DOORKNOCKING APPENDIX B. HIGH SCHOOL ENROLLMENT DATA TABLES
14,614,211 1,274,269 13,339,942 1,852,956 8,671,373 2,064,185 151,618 595,923
14,877,869 1,300,885 13,576,984 1,968,722 8,697,601 2,121,744 157,274 613,421
15,204,889 1,300,382 13,904,507 2,103,625 8,767,332 2,206,255 166,443 635,813
15,489,480 1,300,279 14,189,201 2,233,208 8,800,704 2,285,967 174,840 655,382
15,813,851 1,318,327 14,495,524 2,372,318 8,849,422 2,359,834 176,575 675,939
16,116,237 1,327,565 14,788,672 2,517,313 8,872,046 2,441,828 184,201 699,757
16,307,757 1,336,798 14,970,959 2,641,040 8,827,859 2,477,844 179,369 707,991
16,345,914 1,351,248 14,994,666 2,761,827 8,665,379 2,514,309 180,337 723,839
16,215,805 1,323,264 14,892,541 2,833,959 8,510,382 2,528,578 179,005 758,035 15,174 59,204
16,200,721 1,305,982 14,894,739 2,972,698 8,376,775 2,506,192 181,240 768,390 15,860 83,765
16,132,159 1,281,449 14,850,710 3,116,668 8,317,034 2,471,418 175,240 820,135 48,574 277,040
15,975,347 1,269,262 14,706,085 3,190,805 8,148,513 2,410,914 167,602 787,941 50,315 308,906
15,948,736 1,238,231 14,710,505 3,288,648 8,070,281 2,389,036 162,871 799,668 51,109 334,966
15,945,009 1,203,180 14,741,829 3,385,138 8,003,663 2,385,080 161,126 806,823 50,571 362,397
15,962,457 1,171,134 14,791,324 3,489,266 7,958,484 2,383,869 159,087 821,051
15,989,731 1,134,518 14,855,213 3,606,422 7,932,006 2,375,669 156,039 834,584
15,968,489 1,100,113 14,868,376 3,707,895 7,865,719 2,357,652 152,028 846,794
16,013,144 1,065,838 14,947,306 3,833,607 7,829,938 2,343,853 148,428 872,416
15,986,769 1,029,421 14,957,348 3,939,871 7,776,987 2,313,354 144,980 887,439
15,968,130 992,876 14,975,253 4,052,079 7,720,753 2,296,210 142,065 900,739
16,091,826 993,462 15,098,363 4,198,146 7,710,711 2,309,407 139,775 910,941
16,260,378 1,003,883 15,256,496 4,342,547 7,712,541 2,350,460 138,070 914,074
16,364,988 1,014,106 15,350,883 4,436,129 7,679,003 2,392,825 139,033 926,704
16,329,835 1,024,185 15,305,650 4,439,355 7,612,333 2,407,514 139,341 938,843
16,078,441 1,002,934 15,075,506 4,337,392 7,494,333 2,385,391 137,783 946,361
15,737,477 978,485 14,758,992 4,183,455 7,336,680 2,335,752 135,240 952,485
15,456,964 960,995 14,495,969 4,042,060 7,210,209 2,292,107 131,191 963,397
15,270,347 950,387 14,319,960 3,939,825 7,126,925 2,264,655 127,922 971,574
15,266,100 950,935 14,315,164 3,909,980 7,103,896 2,260,422 125,335 1,000,312
U N I T E D S TAT E S
December 2016 111

American Asian/Pacific White Black Indian/ Islander AlaskaNative (combined)
Hispanic Non-HispanicPUBLIC
SCHOOLSTOTAL
PRIVATESCHOOLS
TOTALGRANDTOTAL
Hawai‘ian/Pacific
Islander
Two or More Races
School Year Alone, or Any Race
Available Data for Additional
Race Categories
Repo
rted
Cou
nts
of H
igh
Scho
ol E
nrol
lmen
tsPr
ojec
tions
of H
igh
Scho
ol E
nrol
lmen
ts
2000-01
2001-02
2002-03
2003-04
2004-05
2005-06
2006-07
2007-08
2008-09
2009-10
2010-11
2011-12
2012-13
2013-14
2014-15
2015-16
2016-17
2017-18
2018-19
2019-20
2020-21
2021-22
2022-23
2023-24
2024-25
2025-26
2026-27
2027-28
2028-29
AT THE COLLEGE DOORKNOCKING APPENDIX B. HIGH SCHOOL ENROLLMENT DATA TABLES
W E S T
3,516,889 235,876 3,281,013 882,134 1,803,033 194,918 80,148 309,962
3,587,160 243,898 3,343,262 929,370 1,800,469 202,343 82,679 316,017
3,690,756 243,327 3,447,429 991,310 1,815,697 211,962 87,658 325,699
3,783,724 242,133 3,541,591 1,048,978 1,817,114 221,996 95,230 332,895
3,897,060 257,391 3,639,669 1,110,132 1,825,048 231,038 95,169 341,361
3,986,442 257,081 3,729,361 1,176,336 1,824,197 238,930 100,135 352,348
4,003,260 257,820 3,745,440 1,225,297 1,777,643 241,373 92,945 350,606
4,045,594 258,974 3,786,620 1,283,750 1,748,592 242,302 92,454 358,960
4,026,185 249,284 3,776,901 1,316,188 1,736,737 247,654 92,365 384,520 13,968 53,858
4,001,078 242,768 3,758,310 1,358,345 1,689,069 239,230 90,677 381,791 13,517 57,165
4,002,308 238,159 3,764,149 1,403,217 1,675,768 230,404 85,090 407,928 38,320 89,428
3,982,227 236,053 3,746,174 1,426,401 1,641,958 222,771 82,362 372,683 38,707 105,183
3,973,947 229,614 3,744,333 1,451,637 1,622,946 218,402 79,633 371,715 38,756 111,126
3,974,023 222,288 3,751,735 1,477,893 1,609,511 215,221 78,983 370,127 38,910 119,023
3,959,157 216,657 3,742,500 1,495,726 1,591,943 208,957 77,326 369,974
3,960,462 210,629 3,749,833 1,520,098 1,583,796 203,962 75,777 369,294
3,962,497 204,610 3,757,887 1,543,579 1,573,278 199,153 74,374 367,065
3,991,968 198,826 3,793,141 1,579,257 1,572,889 196,166 73,048 371,464
4,004,475 192,713 3,811,763 1,605,512 1,571,333 192,041 72,221 371,271
4,023,214 186,386 3,836,828 1,637,245 1,571,060 188,369 71,493 371,004
4,074,885 187,632 3,887,253 1,682,291 1,582,904 186,890 70,868 368,459
4,104,892 190,367 3,914,524 1,714,978 1,588,555 185,157 70,545 360,401
4,133,896 192,826 3,941,070 1,737,057 1,590,378 188,126 71,119 361,293
4,112,546 194,490 3,918,056 1,719,024 1,582,212 190,266 71,162 361,989
4,030,760 189,621 3,841,139 1,662,389 1,560,339 190,638 70,052 361,763
3,942,935 184,157 3,758,778 1,597,300 1,529,500 190,615 68,767 362,246
3,856,998 180,342 3,676,656 1,530,182 1,500,851 187,322 66,790 362,065
3,801,370 178,129 3,623,241 1,482,074 1,483,274 185,460 65,096 363,589
3,793,898 178,062 3,615,836 1,457,268 1,475,390 185,033 63,636 375,213
Projections of High School Graduates112
Notes: See Figure 3.1. Regional Divisions of the U.S. on page 19 for the states covered by this region. School Year refers to the K-12 calendar running fall to spring. High School Enrollments include grades 9 to 12. The Grand Total is the sum of the Private Schools and Public Schools totals. The Private Schools Total includes schools not supported primarily by public funds, religious and nonsectarian, but not including homeschool students. Private Schools projections begin in school year 2012-13. The Public Schools Total will not exactly equal the sum of the races/ethnicities columns, which are projected separately. Prior to 2010-11, data were not available separately for Asian and Pacific Islander students, and Two or More Races students. Hawai‘ian/Pacific Islander and Two or More Races counts are displayed separately in the years they were reported for informational purposes, but are included in the race categories in the projected years. For more detailed information, see Appendix C: Technical Information and Methodology at www.wiche.edu/knocking.Source: Western Interstate Commission for Higher Education, Knocking at the College Door: Projections of High School Graduates, 2016.

American Asian/Pacific White Black Indian/ Islander AlaskaNative (combined)
Hispanic Non-HispanicPUBLIC
SCHOOLSTOTAL
PRIVATESCHOOLS
TOTALGRANDTOTAL
Hawai‘ian/Pacific
Islander
Two or More Races
School Year Alone, or Any Race
Available Data for Additional
Race Categories
Repo
rted
Cou
nts
of H
igh
Scho
ol E
nrol
lmen
tsPr
ojec
tions
of H
igh
Scho
ol E
nrol
lmen
ts
2000-01
2001-02
2002-03
2003-04
2004-05
2005-06
2006-07
2007-08
2008-09
2009-10
2010-11
2011-12
2012-13
2013-14
2014-15
2015-16
2016-17
2017-18
2018-19
2019-20
2020-21
2021-22
2022-23
2023-24
2024-25
2025-26
2026-27
2027-28
2028-29
AT THE COLLEGE DOORKNOCKING APPENDIX B. HIGH SCHOOL ENROLLMENT DATA TABLES
M I D W E S T
3,404,520 303,077 3,101,443 138,530 2,488,061 381,123 20,403 72,054
3,436,027 306,997 3,129,030 150,346 2,484,552 394,522 21,287 74,640
3,485,669 303,321 3,182,348 162,689 2,491,445 421,060 23,990 77,132
3,509,030 298,163 3,210,867 174,168 2,488,114 438,565 22,565 79,411
3,535,362 289,927 3,245,435 185,365 2,489,720 452,765 22,822 81,100
3,589,346 284,060 3,305,286 198,508 2,499,118 479,146 23,549 85,025
3,613,927 283,353 3,330,574 212,131 2,488,825 490,608 23,927 85,625
3,616,920 282,743 3,334,177 223,034 2,458,946 505,961 24,594 86,976
3,572,199 279,137 3,293,062 234,823 2,401,818 504,435 23,962 89,242
3,544,376 275,883 3,268,493 248,472 2,364,603 498,966 23,463 90,760 343 7,110
3,494,080 273,574 3,220,506 272,423 2,347,062 484,611 23,358 95,579 2,701 69,532
3,416,119 272,510 3,143,609 284,787 2,276,251 465,371 21,511 95,689 2,598 72,856
3,387,150 266,448 3,120,702 296,751 2,250,713 453,919 20,703 98,616 2,785 78,535
3,368,445 259,647 3,108,798 309,904 2,226,292 451,049 20,458 101,095 2,908 84,072
3,363,303 252,358 3,110,945 326,275 2,219,058 449,106 20,084 104,972
3,355,272 244,248 3,111,024 343,516 2,216,670 443,709 19,704 108,293
3,335,443 237,389 3,098,054 359,909 2,198,727 437,240 19,032 111,915
3,328,448 230,381 3,098,068 377,332 2,189,055 432,695 18,565 116,803
3,314,816 223,561 3,091,255 394,228 2,177,747 427,236 18,106 120,034
3,293,724 216,675 3,077,049 409,817 2,160,765 423,239 17,590 123,314
3,297,591 215,621 3,081,969 427,179 2,156,453 425,574 17,123 125,785
3,313,445 216,378 3,097,067 445,371 2,157,218 432,194 16,766 127,742
3,308,393 216,716 3,091,677 454,680 2,140,363 437,648 16,649 130,130
3,288,718 217,054 3,071,664 454,296 2,118,614 439,497 16,592 131,960
3,233,836 212,465 3,021,370 442,470 2,081,496 434,964 16,409 133,190
3,163,791 207,577 2,956,214 423,105 2,035,557 425,813 15,916 133,818
3,108,591 203,953 2,904,638 407,080 2,001,253 419,043 15,258 135,188
3,071,165 201,639 2,869,526 393,665 1,977,534 415,924 14,721 136,782
3,065,498 201,367 2,864,131 388,793 1,969,973 417,029 14,475 140,446
December 2016 113
Notes: See Figure 3.1. Regional Divisions of the U.S. on page 19 for the states covered by this region. School Year refers to the K-12 calendar running fall to spring. High School Enrollments include grades 9 to 12. The Grand Total is the sum of the Private Schools and Public Schools totals. The Private Schools Total includes schools not supported primarily by public funds, religious and nonsectarian, but not including homeschool students. Private Schools projections begin in school year 2012-13. The Public Schools Total will not exactly equal the sum of the races/ethnicities columns, which are projected separately. Prior to 2010-11, data were not available separately for Asian and Pacific Islander students, and Two or More Races students. Hawai‘ian/Pacific Islander and Two or More Races counts are displayed separately in the years they were reported for informational purposes, but are included in the race categories in the projected years. For more detailed information, see Appendix C: Technical Information and Methodology at www.wiche.edu/knocking.Source: Western Interstate Commission for Higher Education, Knocking at the College Door: Projections of High School Graduates, 2016.

American Asian/Pacific White Black Indian/ Islander AlaskaNative (combined)
Hispanic Non-HispanicPUBLIC
SCHOOLSTOTAL
PRIVATESCHOOLS
TOTALGRANDTOTAL
Hawai‘ian/Pacific
Islander
Two or More Races
School Year Alone, or Any Race
Available Data for Additional
Race Categories
Repo
rted
Cou
nts
of H
igh
Scho
ol E
nrol
lmen
tsPr
ojec
tions
of H
igh
Scho
ol E
nrol
lmen
ts
2000-01
2001-02
2002-03
2003-04
2004-05
2005-06
2006-07
2007-08
2008-09
2009-10
2010-11
2011-12
2012-13
2013-14
2014-15
2015-16
2016-17
2017-18
2018-19
2019-20
2020-21
2021-22
2022-23
2023-24
2024-25
2025-26
2026-27
2027-28
2028-29
AT THE COLLEGE DOORKNOCKING APPENDIX B. HIGH SCHOOL ENROLLMENT DATA TABLES
N O R T H E A S T
2,632,749 351,936 2,280,813 236,662 1,615,149 317,527 6,197 105,278
2,698,758 360,739 2,338,019 248,674 1,643,121 329,813 6,734 109,677
2,754,464 360,759 2,393,705 262,773 1,668,912 340,997 6,816 114,207
2,813,841 361,850 2,451,991 282,123 1,687,203 355,645 7,045 119,329
2,871,112 362,393 2,508,719 302,955 1,706,696 367,775 7,480 123,746
2,907,724 365,757 2,541,967 320,208 1,707,940 376,187 7,577 126,531
2,968,024 368,063 2,599,961 336,407 1,735,399 381,122 7,929 130,305
2,913,171 369,818 2,543,353 345,224 1,669,477 382,260 7,746 131,831
2,872,396 369,646 2,502,750 348,661 1,630,500 375,834 7,897 137,108 1,199 5,346
2,892,145 371,238 2,520,907 359,361 1,617,126 376,148 8,028 142,423 1,058 6,345
2,857,199 357,342 2,499,857 380,287 1,582,542 379,290 8,247 151,312 1,821 18,285
2,795,248 351,937 2,443,311 381,768 1,535,823 363,652 8,010 153,747 2,973 21,888
2,774,177 341,266 2,432,911 393,289 1,512,294 361,622 7,890 157,816 3,213 27,431
2,747,616 330,512 2,417,104 403,489 1,486,501 359,812 8,099 159,202 1,835 31,734
2,729,333 319,981 2,409,352 415,451 1,464,431 358,774 8,264 163,377
2,708,245 307,460 2,400,786 429,200 1,445,043 356,558 8,363 167,284
2,687,887 297,834 2,390,053 443,884 1,419,641 353,839 8,469 172,076
2,685,878 289,143 2,396,735 462,608 1,405,220 352,726 8,644 179,263
2,675,192 280,215 2,394,977 481,219 1,386,840 349,624 8,824 184,092
2,661,701 271,291 2,390,410 502,121 1,364,159 347,761 9,071 188,490
2,669,216 268,888 2,400,328 528,384 1,348,108 348,934 9,322 193,316
2,684,289 268,723 2,415,567 558,160 1,330,478 353,271 9,687 198,479
2,682,931 268,789 2,414,142 573,061 1,310,361 357,127 9,843 202,264
2,674,098 269,679 2,404,419 580,027 1,291,711 358,300 9,848 206,082
2,640,439 265,560 2,374,880 576,464 1,268,712 354,800 9,751 208,227
2,594,312 260,812 2,333,500 568,098 1,238,252 347,316 9,380 209,513
2,560,038 257,200 2,302,837 563,692 1,210,382 340,461 9,149 214,284
2,528,526 254,115 2,274,411 557,924 1,188,434 333,226 9,043 216,236
2,515,416 252,897 2,262,519 557,042 1,174,049 327,576 8,926 220,374
Projections of High School Graduates114
Notes: See Figure 3.1. Regional Divisions of the U.S. on page 19 for the states covered by this region. School Year refers to the K-12 calendar running fall to spring. High School Enrollments include grades 9 to 12. The Grand Total is the sum of the Private Schools and Public Schools totals. The Private Schools Total includes schools not supported primarily by public funds, religious and nonsectarian, but not including homeschool students. Private Schools projections begin in school year 2012-13. The Public Schools Total will not exactly equal the sum of the races/ethnicities columns, which are projected separately. Prior to 2010-11, data were not available separately for Asian and Pacific Islander students, and Two or More Races students. Hawai‘ian/Pacific Islander and Two or More Races counts are displayed separately in the years they were reported for informational purposes, but are included in the race categories in the projected years. For more detailed information, see Appendix C: Technical Information and Methodology at www.wiche.edu/knocking.Source: Western Interstate Commission for Higher Education, Knocking at the College Door: Projections of High School Graduates, 2016.

American Asian/Pacific White Black Indian/ Islander AlaskaNative (combined)
Hispanic Non-HispanicPUBLIC
SCHOOLSTOTAL
PRIVATESCHOOLS
TOTALGRANDTOTAL
Hawai‘ian/Pacific
Islander
Two or More Races
School Year Alone, or Any Race
Available Data for Additional
Race Categories
Repo
rted
Cou
nts
of H
igh
Scho
ol E
nrol
lmen
tsPr
ojec
tions
of H
igh
Scho
ol E
nrol
lmen
ts
2000-01
2001-02
2002-03
2003-04
2004-05
2005-06
2006-07
2007-08
2008-09
2009-10
2010-11
2011-12
2012-13
2013-14
2014-15
2015-16
2016-17
2017-18
2018-19
2019-20
2020-21
2021-22
2022-23
2023-24
2024-25
2025-26
2026-27
2027-28
2028-29
AT THE COLLEGE DOORKNOCKING APPENDIX B. HIGH SCHOOL ENROLLMENT DATA TABLES
S O U T H
5,060,053 383,380 4,676,673 595,630 2,765,130 1,170,617 44,870 108,629
5,155,924 389,251 4,766,673 640,332 2,769,459 1,195,066 46,574 113,087
5,274,000 392,975 4,881,025 686,853 2,791,278 1,232,236 47,979 118,775
5,382,885 398,133 4,984,752 727,939 2,808,273 1,269,761 50,000 123,747
5,510,317 408,616 5,101,701 773,866 2,827,958 1,308,256 51,104 129,732
5,632,725 420,667 5,212,058 822,261 2,840,791 1,347,565 52,940 135,853
5,722,546 427,562 5,294,984 867,205 2,825,992 1,364,741 54,568 141,455
5,770,229 439,713 5,330,516 909,819 2,788,364 1,383,786 55,543 146,072
5,745,025 425,197 5,319,828 934,287 2,741,395 1,394,659 55,957 151,915 7
5,763,122 416,093 5,347,029 1,006,520 2,705,605 1,386,429 60,226 158,053 942 13,145
5,778,572 412,374 5,366,198 1,060,741 2,710,216 1,374,148 59,665 168,607 5,732 99,795
5,781,753 408,762 5,372,991 1,097,849 2,692,931 1,354,919 57,079 170,213 6,037 108,979
5,813,311 400,752 5,412,559 1,146,971 2,683,108 1,350,523 55,977 175,980 6,355 117,874
5,854,495 390,303 5,464,192 1,193,852 2,680,395 1,353,960 54,982 181,002 6,918 127,568
5,907,601 381,260 5,526,342 1,251,342 2,681,118 1,362,054 54,862 187,506
5,960,205 370,896 5,589,308 1,312,814 2,684,032 1,366,474 53,759 194,966
5,975,142 358,963 5,616,178 1,359,270 2,671,364 1,362,298 51,851 202,067
5,998,473 346,345 5,652,128 1,413,903 2,659,941 1,357,082 49,997 212,120
5,983,794 331,928 5,651,866 1,458,970 2,638,735 1,339,405 47,831 220,082
5,982,357 317,702 5,664,655 1,504,244 2,623,153 1,332,062 46,095 226,908
6,042,198 319,113 5,723,084 1,562,612 2,622,282 1,343,057 44,865 233,692
6,148,625 324,441 5,824,184 1,628,962 2,636,017 1,374,795 43,725 239,563
6,229,172 330,109 5,899,064 1,677,521 2,637,474 1,404,485 44,189 246,585
6,242,974 336,126 5,906,849 1,694,118 2,619,433 1,413,648 44,578 253,879
6,160,794 329,267 5,831,527 1,664,578 2,582,715 1,399,074 44,538 259,423
6,026,832 321,048 5,705,784 1,605,541 2,532,724 1,366,642 44,041 264,466
5,921,463 315,347 5,606,116 1,552,358 2,497,507 1,339,910 42,818 270,883
5,860,139 312,363 5,547,776 1,518,647 2,477,628 1,324,746 41,877 274,615
5,882,498 313,811 5,568,687 1,520,971 2,484,208 1,325,610 41,126 284,565
December 2016 115
Notes: See Figure 3.1. Regional Divisions of the U.S. on page 19 for the states covered by this region. School Year refers to the K-12 calendar running fall to spring. High School Enrollments include grades 9 to 12. The Grand Total is the sum of the Private Schools and Public Schools totals. The Private Schools Total includes schools not supported primarily by public funds, religious and nonsectarian, but not including homeschool students. Private Schools projections begin in school year 2012-13. The Public Schools Total will not exactly equal the sum of the races/ethnicities columns, which are projected separately. Prior to 2010-11, data were not available separately for Asian and Pacific Islander students, and Two or More Races students. Hawai‘ian/Pacific Islander and Two or More Races counts are displayed separately in the years they were reported for informational purposes, but are included in the race categories in the projected years. For more detailed information, see Appendix C: Technical Information and Methodology at www.wiche.edu/knocking.Source: Western Interstate Commission for Higher Education, Knocking at the College Door: Projections of High School Graduates, 2016.

AT THE COLLEGE DOORKNOCKING
Projections of High School Graduates116

AT THE COLLEGE DOORKNOCKING
APPENDIX C
TECHNICAL INFORMATION AND METHODOLOGY

Projections of High School Graduates118
AT THE COLLEGE DOORKNOCKING APPENDIX C. TECHNICAL INFORMATION AND METHODOLOGY

December 2016 119
AT THE COLLEGE DOORKNOCKING APPENDIX C. TECHNICAL INFORMATION AND METHODOLOGY
Underlying assumptions and data constraints are inherent in any projections and must be understood in order to determine the appropriate uses and interpretations of the projections. The historical reported counts and projections of high school graduates used in this edition of Knocking at the College Door rely on several types of data accumulated over many years and span roughly three decades, from 2000 to 2031. The projections therefore reflect myriad past, current, and projected future trends in economics, demographics, education, and even data collection. Because the projections of high school graduates are estimates of future trends based on past observed trends, unforeseen factors will undoubtedly affect actual outcomes over the 17-year span of the projections.
The sections below provide an overview of the projection methodology, influential factors that are implicitly modeled in the projections, and pertinent information relating to the data underlying the projections. In many cases, technical aspects of the projections are discussed in light of specific examples.
Methodology OverviewWICHE’s Knocking at the College Door projections of high school graduates are produced using a methodology known as the cohort survival ratio (CSR) method, which is essentially an observation of the progression of students/individuals from birth to first grade, through each grade, and from the 12th grade to graduation. WICHE uses these ratios, calculated from all available data, to project the number of enrollments and graduates in the years to come. WICHE uses a five-year smoothed average ratio for making the projections, in order to place relatively greater weight on the most recent year’s data without masking or eliminating any trends that would be evident by taking a longer view. Each cohort survival ratio is calculated as:
where Ypt is the CSR at a given progression point p in year t, and w is the smoothing weight (equal to 0.4 in the first year and .15 for each of the four prior years in WICHE’s methodology).
In simple terms:
ff The CSR methodology operates by calculating the difference between the enrollments in a given grade in one school year and the enrollments in the subsequent grade level the next year. For example, if there are 100 first graders in school year 2012-13 and 98 second graders in 2013-14, the ratio of first graders to second graders is 0.98. (Although the focus of this publication is on high school graduates, the CSR methodology thereby also produces grade-level enrollment projections.)
ff WICHE uses data on births from the National Center for Health Statistics (NCHS) to derive the ratio of the number of children born in a given year compared to the number of first graders reported approximately six years later.
ff The ratio of 12th graders to graduates indicates the ratio between the reported count of 12th graders in a school year to the number of high school graduates (which encompasses all graduates throughout the school year, but largely reflects those who graduate in the spring term).
The last year for which graduates can be projected is 17-18 years past the last available year of births data, which is approximately when the most recently born children would be graduating from high school.
WICHE uses the CSR methodology for reasons that are similar to why educational planners in schools, school districts, states, and the federal government use it – because its relative simplicity and transparency meet the wide-ranging needs of its users. But perhaps an even greater strength of this methodology is that only a limited amount of data are required. Also, despite the relative simplicity of the CSR methodology, studies have shown that it is reasonably accurate for short-term projections and even for small populations.1 While alternative methodologies exist that provide short-term projections that are as accurate as
Ypt = wYp(t-1) +(1-w) i=2 ,∑
5
Yp(t-i)
4
APPENDIX C. TECHNICAL INFORMATION AND METHODOLOGY

Projections of High School Graduates120
AT THE COLLEGE DOORKNOCKING APPENDIX C. TECHNICAL INFORMATION AND METHODOLOGY
CSR, this equivalence is offset by the fact that the alternative methodologies have more extensive data requirements and employ techniques that are far less easily understood by non-statisticians.
Historical AccuracyWICHE makes all reasonable effort to ensure that the Knocking at the College Door methodology remains a credible and reliable method for producing these projections. This includes consulting with experts for each edition, assessing the accuracy of the projections against the subsequently reported actual data and other education projections, and carefully inspecting the underlying data and other pertinent information (discussed throughout Appendix C). Furthermore, WICHE releases updated projections every four to five years on average. This is a relatively short period of time considering that student populations and trends are relatively stable and the projections are therefore reliably contemporaneous.
Ongoing Expert ReviewIn preparation for the 2012 edition of Knocking at the College Door, WICHE undertook a comprehensive methodological review. It commissioned a technical white paper, convened both a technical review panel of experts and an end-user panel of various experts who use Knocking at the College Door, and conducted a simulations analysis to compare the relative accuracy of several CSR alternatives.2 The report of WICHE’s recent methodology review provides a thorough discussion of the methodological considerations, alternatives, and results of the expert panels and simulations analysis.3 In summary, the CSR methodology was found to produce projections as well as or better than the two most feasible alternatives (single and double exponential smoothing), to accommodate the constraints of the available data, and to provide the transparency and understandability that give the projections their substantial credibility.4
For this edition of Knocking at the College Door, another full methodological review was not necessary, but WICHE convened an advisory group of experts and users to provide guidance on methodological issues and to review the preliminary projections. The members of the advisory group were:
Patricia Barth, director, Center for Public Education, National School Boards Association (NSBA)
Jack Buckley, senior vice president, research, The College Board
Emily Calderon Galdeano, senior associate, Excelencia in Education
Andrew Carlson, senior policy analyst, State Higher Education Executive Officers Association (SHEEO)
Matthew Crellin, senior associate, National Center for Higher Education Management Systems (NCHEMS)
Will Doyle, associate professor, Vanderbilt UniversityNate Easley, executive director, Denver Scholarship
FoundationSteve Kappler, vice president, brand experience, ACTJeffrey Passel, senior demographer, Pew Research
CenterKent Rinehart, assistant vice president of enrollment
management/dean of admission, Marist CollegeJosé Rios, director, multicultural communications, The
College BoardDavid Sanders, research director, American Indian
College FundBrian Sponsler, director, Postsecondary Institute,
Education Commission of the States (ECS)Jeff Strohl, director of research, Georgetown
University Center on Education and the WorkforceChristina Whitfield, associate vice president, State
Higher Education Executive Officers Association (SHEEO)
Comparison to Other Education DataWICHE periodically compares the Knocking at the College Door projections to other data about high school graduates to better gauge their accuracy in real-time and over past editions. Analysis of past projections provides WICHE with greater confidence in its predictions of overall numbers as well as of particular trends. On average, WICHE’s projections of the total number of public high school graduates in the United States from the 2003, 2008, and 2012 editions of Knocking at the College Door are within 2 to 3 percent of the actual numbers subsequently reported to the National Center for Education Statistics (NCES) Common Core of Data (CCD) for specific years within the first four years of the projections (Table C.1). The average gap for the statewide total public graduates is similarly low. There is greater variance for some

December 2016 121
AT THE COLLEGE DOORKNOCKING APPENDIX C. TECHNICAL INFORMATION AND METHODOLOGY
regions and in other lower-level groupings such as by race/ethnicity, but it does not appear to be systemic. The possible reasons for variance are discussed throughout this section.
The 2012 edition of the Knocking at the College Door projections appear to have been particularly affected by unexpected/unforeseen increases in the number of high school students and graduates that were subsequently reported in the data used for these projections (see the sidebar in Chapter 2). California, in particular, reported higher numbers in recent years, while other states reported differences between the 2008-09 data and subsequent years, though these increases were not as high as that reported by California.5 While it is not possible to identify the precise sources of this unexpected increase,
WICHE’s research indicates that it might have been a result of several factors including Deferred Action for Childhood Arrivals (DACA), an increase in the number of students who remained in high school during the Great Recession and the subsequent slow economic recovery, real increases in the number of students progressing to graduation, and the use of improved student-data systems, among other reasons. As explained previously, however, the last year of reported data had the greatest influence on the projections, especially in the short term, and it appears that the significant increases that were represented in data released since the 2012 edition introduced slightly greater short-term variance between the projections and subsequently reported data than in previous editions.
NCES also produces projections of high school graduates, the most recent edition of which contains projections through school year 2023-24 for the nation by race/ethnicity, by state totals, and by the number of national private school graduates.6 NCES updates these projections annually, and WICHE’s projections have typically been within 2 percent of these projections. WICHE compared the 2012 Knocking at the College Door projections to each of the three editions of NCES projections released since (Figure C.1). The figure shows the Knocking at the College Door projections made in 2012, for which 2008-09 was the last year of available data and therefore served as the starting point for the projections, compared with the projections in this edition, which used 2012-13 data as the starting point. Figure C.1 also shows how the starting point of the NCES projections have been adjusted with each year’s subsequently released data, and as a result the following years were slightly different. This result illustrates and reiterates how influential the data from the most recent year are to subsequent projections. It also shows how relatively close all of the projections series are to each other, in that each series contains a predicted “dip” (as yet not shown in the reported data), and that they all follow a similar trend through the early 2020s.
Table C.1. Percent Difference of Projected Total Graduates Compared to Graduates Reported to NCES CCD2003 edition 2002-03 2003-04 2004-05 2005-06
U.S. Total -2.0 -3.2 -3.8 -8.0Average of States -1.7 -2.6 -3.3 -2.8West Region -5.2 -4.1 -5.8 -0.4Midwest Region 1.2 -0.6 -1.1 -1.4Northeast Region 11.4 10.0 7.9 -15.6South Region -9.0 -11.5 -10.5 -13.9
2008 edition 2005-06 2006-07 2007-08 2008-09
U.S. Total 2.9 2.2 1.1 -0.7Average of States 1.7 1.7 0.5 -0.6West Region 6.9 6.1 5.0 4.7Midwest Region 1.0 -0.3 -0.4 0.0Northeast Region 0.0 -1.3 -2.6 -4.1South Region 2.5 3.0 1.3 -3.0
2012 edition 2009-10 2010-11 2011-12 2012-13
U.S. Total -1.7 -1.3 -3.0 -4.6Average of States -1.3 -0.9 -2.2 -3.6West Region -2.4 -1.7 -4.8 -7.2Midwest Region -0.5 -0.2 -1.5 -2.5Northeast Region -0.6 -0.6 -1.5 -3.3South Region -2.6 -2.4 -3.7 -4.9
Source: WICHE Knocking at the College Door and U.S. Department of Education National Center for Education Statistics Common Core of Data. Author calculations.

Projections of High School Graduates122
AT THE COLLEGE DOORKNOCKING APPENDIX C. TECHNICAL INFORMATION AND METHODOLOGY
Expected Differences between National, Regional, and Subgroup ProjectionsWICHE develops its national and regional projections independently of its state projections. The state projections do not equal exactly to the regional projections, nor do the state and regional projections sum exactly to the national projections. Similarly, projections are developed independently for each racial/ethnic population by state, and those projections do not sum to the regional or national total public projections. The small numerical differences that result from making these projections independently may cause confusion for some Knocking at the College Door users. For example, the sum of WICHE’s state projections was about 11,000 (less than 1 percent) greater than that of the independent projection for the United States for 2027-28, which was the last year of projections for the 2012 edition of Knocking at the College Door.
During its methodology review for the 2012 edition of Knocking at the College Door, WICHE sought consultation on the merits and alternatives to making the lower-level projections independent of the aggregate projections. WICHE continues to make independent projections for each racial/ethnic group in each state, in part because the smaller counts of some population groups lead to greater uncertainty
in the projections, and also because some legitimate growth trends that are seen at the lower levels might be overstated or understated if they were adjusted.
The 2012 edition of Knocking at the College Door featured relatively small differences between the independent sets of projections. There was a difference of 1 percent or less in any of the projected years between the sum of lower-level projections and the aggregate higher-level projections, for any combination, except for the following:
ff A difference of 2.5 percent or less in any of the projected years between the sum of the regions and the independently projected national total for Hispanic and Asian graduates.
ff A difference of 5 percent or less in any of the projected years between the sum of the regions and the independently projected national total for American Indian/Alaska Native graduates.
ff A difference of only about 1 percent, on average, between the sum of race/ethnicity projections and the public total projection, across all states and years and within any region; the average difference across all years for any given state was +/-2.5 percent.
2.70
2.80
2.90
3.00
3.10
3.20
3.30
Mill
ions
2008-09
3.3
3.2
3.1
3.0
2.9
2.8
Mill
ions
3 .20M
Figure C.1. Comparison of Knocking and NCES Projections, United States Public Schools Total
2010-11 2012-13 2014-15 2016-17 2018-19 2020-21 2022-23
CCD ACTUALS
KNOCKING 2016
KNOCKING 2012
NCES to 2021NCES to 2023
3.11M
3.08M
December 2016 123
AT THE COLLEGE DOORKNOCKING APPENDIX C. TECHNICAL INFORMATION AND METHODOLOGY
Generally speaking, the differences between the independently projected series tend to increase in later future years, consistent with the nature of extended projections. The greatest differences in terms of percentage show up in the two categories with the smallest counts: in the number of nonpublic and American Indian/Alaskan Native graduates, and in the Northeast, the region with the lowest number of graduates.
Approach to Limitations with Available DataAll public school data were obtained from the CCD, maintained by NCES, part of the U.S. Department of Education. At the time of publication, the most recent available CCD data were for enrollments through school year 2013-14 and graduates through 2012-13. To obtain private school data, WICHE relied on the Private School Universe Survey (PSS), a biannual survey conducted in odd years by NCES that provides data for religious and nonsectarian private/nonpublic elementary and secondary schools in all 50 states and the District of Columbia. In producing this edition of the Knocking at the College Door projections, WICHE encountered two major dilemmas resulting from data limitations that impacted its efforts to produce the most useful, relevant projections possible:
ff A lack of more recent data, or “data lags,” that made it impossible to make projections that began closer in time to the data of publication.
ff A lack of sufficient data that would allow WICHE to make projections for the new race categorizations.
This section outlines the data issues that impacted the production of these projections, the analysis and efforts undertaken to address the data limitations, and the decisions that led to what is included in this edition. WICHE presented these issues and analysis to the Knocking at the College Door Advisory Group on two occasions for their recommendations. In all cases, the foremost criterion was whether WICHE could produce reliable, transparent projections from the available data for the nation, region, and each state while also making them contemporary and relevant.
Lags in Available DataThis edition of Knocking at the College Door projections is being released approximately four years after the 2012 edition. WICHE has typically updated its projections every four to five years, while demand typically increases for updated projections about two years after the release. This edition is no exception; indeed, WICHE has experienced heightened demand for this update given the climate over the last several years as states continue to recover from the Great Recession and colleges struggle with enrollment declines, among other factors. WICHE selected December 2016 as the target to release the ninth edition of the Knocking at the College Door projections for a number of reasons, but primarily to make the projections available in time for the 2017 legislative cycle. It was apparent months in advance that there would a dilemma in attempting to produce the most up-to-date projections possible despite delays in the availability of more recent data. The projections were not considered final until the last possible moment, in order to incorporate more recent data if they became available.7
Therefore, the first year of public high school graduate projections in this 2016 edition are for graduates of school year 2013-14 (Class of 2014), which is approximately two years earlier than this edition’s December 2016 publication date. The first year of public school grade-level enrollment projections are for school year 2014-15, which is also two years in the past. The private school projections begin two years prior to this, with private school graduate projections beginning school year 2011-12 (Class of 2012) and enrollment projections beginning 2012-13, due to lags in the biennial Private School Survey data.
Of course, these issues somewhat complicate a discussion of the projections and typically require the use of precise language and notation to differentiate between confirmed counts of students and graduates versus projections. Notwithstanding this less-than-ideal situation, several factors mitigate the impact and importance of past projections. First, an analysis of historical accuracy (see the section Historical Accuracy) provides users with a sense of how close the first several years of projections are compared to what is
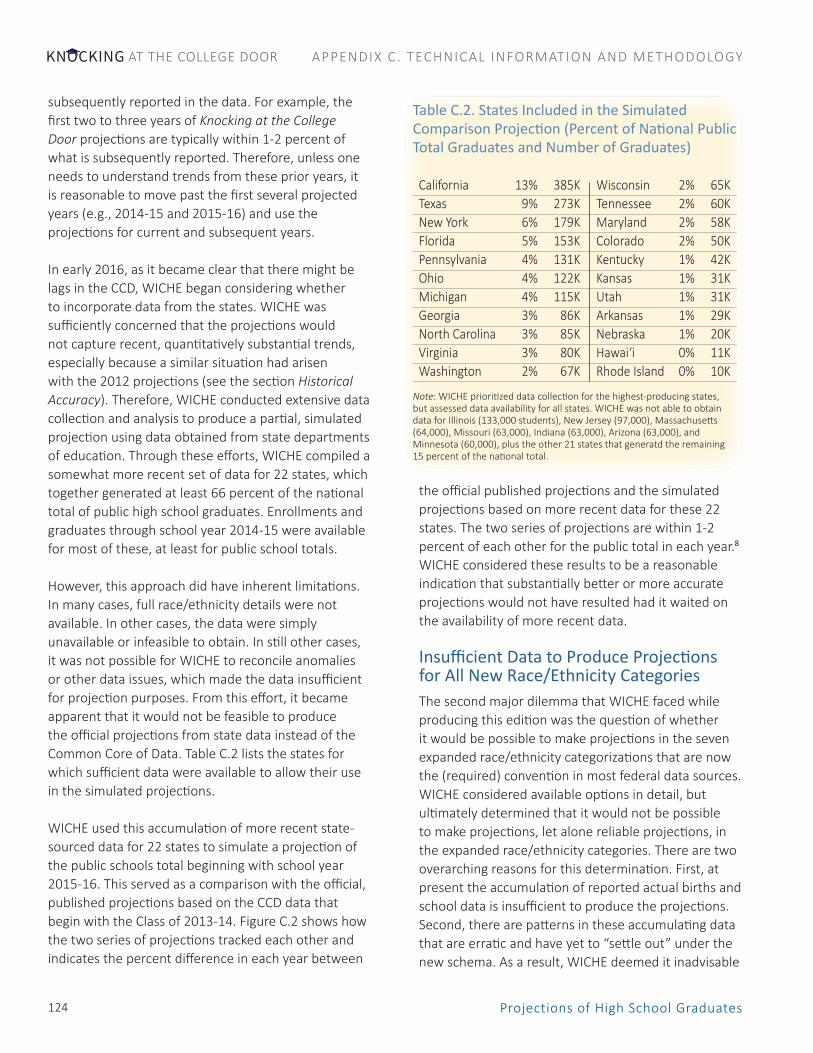
Projections of High School Graduates124
AT THE COLLEGE DOORKNOCKING APPENDIX C. TECHNICAL INFORMATION AND METHODOLOGY
subsequently reported in the data. For example, the first two to three years of Knocking at the College Door projections are typically within 1-2 percent of what is subsequently reported. Therefore, unless one needs to understand trends from these prior years, it is reasonable to move past the first several projected years (e.g., 2014-15 and 2015-16) and use the projections for current and subsequent years.
In early 2016, as it became clear that there might be lags in the CCD, WICHE began considering whether to incorporate data from the states. WICHE was sufficiently concerned that the projections would not capture recent, quantitatively substantial trends, especially because a similar situation had arisen with the 2012 projections (see the section Historical Accuracy). Therefore, WICHE conducted extensive data collection and analysis to produce a partial, simulated projection using data obtained from state departments of education. Through these efforts, WICHE compiled a somewhat more recent set of data for 22 states, which together generated at least 66 percent of the national total of public high school graduates. Enrollments and graduates through school year 2014-15 were available for most of these, at least for public school totals.
However, this approach did have inherent limitations. In many cases, full race/ethnicity details were not available. In other cases, the data were simply unavailable or infeasible to obtain. In still other cases, it was not possible for WICHE to reconcile anomalies or other data issues, which made the data insufficient for projection purposes. From this effort, it became apparent that it would not be feasible to produce the official projections from state data instead of the Common Core of Data. Table C.2 lists the states for which sufficient data were available to allow their use in the simulated projections.
WICHE used this accumulation of more recent state-sourced data for 22 states to simulate a projection of the public schools total beginning with school year 2015-16. This served as a comparison with the official, published projections based on the CCD data that begin with the Class of 2013-14. Figure C.2 shows how the two series of projections tracked each other and indicates the percent difference in each year between
the official published projections and the simulated projections based on more recent data for these 22 states. The two series of projections are within 1-2 percent of each other for the public total in each year.8 WICHE considered these results to be a reasonable indication that substantially better or more accurate projections would not have resulted had it waited on the availability of more recent data.
Insufficient Data to Produce Projections for All New Race/Ethnicity CategoriesThe second major dilemma that WICHE faced while producing this edition was the question of whether it would be possible to make projections in the seven expanded race/ethnicity categorizations that are now the (required) convention in most federal data sources. WICHE considered available options in detail, but ultimately determined that it would not be possible to make projections, let alone reliable projections, in the expanded race/ethnicity categories. There are two overarching reasons for this determination. First, at present the accumulation of reported actual births and school data is insufficient to produce the projections. Second, there are patterns in these accumulating data that are erratic and have yet to “settle out” under the new schema. As a result, WICHE deemed it inadvisable
Table C.2. States Included in the Simulated Comparison Projection (Percent of National Public Total Graduates and Number of Graduates)
California 13% 385K Wisconsin 2% 65KTexas 9% 273K Tennessee 2% 60KNew York 6% 179K Maryland 2% 58KFlorida 5% 153K Colorado 2% 50KPennsylvania 4% 131K Kentucky 1% 42KOhio 4% 122K Kansas 1% 31KMichigan 4% 115K Utah 1% 31KGeorgia 3% 86K Arkansas 1% 29KNorth Carolina 3% 85K Nebraska 1% 20KVirginia 3% 80K Hawai‘i 0% 11KWashington 2% 67K Rhode Island 0% 10K
Note: WICHE prioritized data collection for the highest-producing states,but assessed data availability for all states. WICHE was not able to obtain data for Illinois (133,000 students), New Jersey (97,000), Massachusetts (64,000), Missouri (63,000), Indiana (63,000), Arizona (63,000), and Minnesota (60,000), plus the other 21 states that generatd the remaining 15 percent of the national total.

December 2016 125
AT THE COLLEGE DOORKNOCKING APPENDIX C. TECHNICAL INFORMATION AND METHODOLOGY
to attempt to use these data to produce projections, even in the very few instances in which the data were close to sufficient.
Therefore, WICHE decided to continue providing projections using the five long-standing historical racial/ethnic categories. The reported actual counts of students in the additional race/ethnicity categories are published for informational purposes. This section provides some detail about what WICHE observed with the available data and offers insights and observations resulting from the close inspection of these data.
Overview of the Racial/Ethnic Category Changes (Public School Only)Prior to 2008-09 NCES had asked states to report public school student enrollment and completion counts by the five long-standing racial/ethnic categories.9 Beginning with the 2010-11 school year, every state and jurisdiction was required to report its public school student counts to NCES using the expanded set of seven racial/ethnic categories established by the Office of Management and Budget (OMB) in 1997 for the collection and reporting of race/ethnicity in federal data. A small number of states began reporting in the new seven categories in school year 2008-09 or 2009-10, because their data systems allowed for it.
In simple terms, the expanded set of categories separated the distinct Hawai‘ian/Pacific Islander student population from the previous Asian/Pacific Islander combined total, and also established a new category for Two or More Races. The Hispanic category also represents a slightly different categorization scheme, and the race categories are now “non-Hispanic” by definition. Figure C.3 illustrates the staggered implementation and provides a simplified view of the lack of necessary data for making projections for the new race categories. The shaded boxes indicate the number of states and years of data under the new reporting schema in the data used for this edition of the publication. The WICHE method relies on the availability of five years’ worth
0%
1%
1%
2%
2%
3%
3%
1.0
1.2
1.4
1.6
1.8
2.0
2.2
2.4
Mill
ions
2.4
2.2
2.0
1.8
1.6
1.4
1.2
1.0
Mill
ions
Figure C.2. Partial Simulated Projections Compared to Official, Published Projections
2016-17
2%
3%
2%
1%
0%
2%2% 2% 2%
2% 2% 2%
2% 1%1% 1% 1%
1%1%1%
1%
1%
0%
2000-01 2012-13 2024-25 2031-32
Percent difference between simulated and WICHE published projections
Simulated projections (actuals through 2014-15, projections beginning 2015-16)WICHE published projections (actuals through 2012-13, projections beginning 2013-14)
Figure C.3. Availability of Data in New Race/Ethnicity Categories
5 states 14 states All states
2008-09 2009-10 2010-11 2011-12 2012-13 2013-14
Enrollments Data
Graduates Data
No. of States Converted
Data availability in 7 categories: Not available in all states Available in all states
4 years available
3 years available

Projections of High School Graduates126
AT THE COLLEGE DOORKNOCKING APPENDIX C. TECHNICAL INFORMATION AND METHODOLOGY
of prior data, and few states had that many years’ worth of data in the new categories and at all levels of detail. For most states, this lack of data was further compounded by insufficient data on births (as discussed in the section titled Methodology Considerations).
WICHE considered producing a truncated series of projections in the new categories for the few states that lacked necessary births data but had sufficient student data, but ultimately decided not to because of other data limitations discussed herein. WICHE also considered using alternative data to estimate or serve as proxies for the missing data, but this introduced other data disadvantages and complexities that would have required WICHE to abandon its relatively straightforward and transparent methodology or use of data that have proven suitable for multiple editions.
While the data for students in the Two or More Races and Hawai‘ian/Pacific Islander categories were insufficient to produce reliable, plausible projections, the counts of these students are used in making the projections:
Hawai‘ian/Pacific Islander. Hawai‘ian/Pacific Islander student counts were added to those reported in the Asian category, prior to distributing the Two or More Races counts as described below. In the published data, the Asian/Pacific Islander combined total count includes students categorized as Asians and Hawai‘ian/Pacific Islanders reported separately in all years. The separately reported Hawai‘ian/Pacific Islander counts are shown for informational purposes.
Two or More Races. WICHE was unable to locate sufficient information to devise a method for distributing the reported Two or More Races student counts based on states’ unique racial/ethnic mix.10 Therefore, the Two or More Races data are apportioned to the four non-Hispanic race groups (American Indian/Alaska Native, Asian/Pacific Islander, Black non-Hispanic, and White non-Hispanic) based on each group’s average share of the combined race total over the three most recent previous years. (Data in the Hispanic category were not part of the apportionment, because Hispanic is considered an ethnicity, not
a race. However, WICHE’s research has indicated that some individuals with Hispanic origins may be captured in the Two or More Races data.) An average of three years was used so that any one aberrant year would not unduly influence the apportionment. It is possible that a disproportional portion of the Two or More Races students may be distributed to the student population that is in the majority, e.g., Whites, whether or not it makes conceptual sense. This effect appears to be non-significant in the race projections because of the typically low number of reported Two or More Races students, compared to the other student populations by race.
Ultimately, users should take note that there are subtle differences between the exact definitions of the race/ethnicity categorizations in any given year for the 30 years of data that this edition encompasses. Generally speaking, data including and after school year 2010-11 reflect the categorizations according to the new protocol.
Data in the New Race/Ethnicity Categories: Observations and LimitationsSome of the key ways in which these new race/ethnicity categories interrelate with the projection methodology used in this edition of Knocking at the College Door are described below.
All states and jurisdictions were required to begin using the new categories in their reporting by school year 2010-11. However, jurisdictions were not required to conduct a full census of all students in order to re-record or re-tabulate race/ethnicity. Instead, states and jurisdictions may have begun re-recording and tabulating students under the new categories at different junctures, for example when students transitioned between elementary and middle school or switched schools. This would not affect reporting on non-Hispanic students of a single-race category. However, it appears that it could result in some on-going shifts in the data as students are re-categorized at school transitions or for other reasons. This may explain some of the shift seen in the graduate counts of students in the Hawai‘ian/Pacific Islander and Two or More Races categories from 2010-11 to 2012-13. This apparent rolling conversion is sometimes even

December 2016 127
AT THE COLLEGE DOORKNOCKING APPENDIX C. TECHNICAL INFORMATION AND METHODOLOGY
more evident in the changing distribution in the enrollments counts.
In many cases the first-, second-, and third-grade enrollments, especially for states with smaller populations and therefore more noticeable changes in absolute numbers, appear to reveal a more logical pattern. The number of first graders appears to indicate the relative portion of very young children that will be categorized into the different student populations under the new reporting schema, for example an upward shift of 15 percent more first graders in a given category than in years past. The numbers of second and third graders indicate more typical rates of progression (90 percent to 100 percent advancing year-over-year). This suggests that additional years of data will eventually reveal the more stable patterns and ratios that are necessary for ensuring accurate projections about the coming waves of students. That is, one would expect that several more years of recent enrollment data will show a logical number of fourth, fifth and sixth graders by race/ethnicity. Perhaps more stable numbers and progression rates will also emerge in higher grades.
Sudden shifts have a greater likelihood of being noticeable, or having an impact on the projections, for race/ethnicity categories for which there are a relatively small number of students. For example, historically the number of Asian/Pacific Islander students in Arkansas has been small. But according to birth and school data, between approximately 2005 and 2013, the number of Asian/Pacific Islander first graders in Arkansas was 40 to 60 percent higher than the number of Asian/Pacific Islander infants who had been born in the state six years earlier. This discrepancy could represent either an actual increase of in-migration during this period or an effect of the categorization issues discussed herein, or a combination of both factors. In this case, the ratio that results from the data ends up projecting a similarly high increase in Asian/Pacific Islander first graders. There are, of course, cases of actual, large increases from a small starting population, such as communities that experience a refugee or immigrant influx or states that experience a sudden in- or out-migration due to changes in an industry sector. It is generally
not possible to differentiate all actual changes in youth population from changes in data collection or reporting.
Self-identification and changes over time and between data sources. Users should understand that race/ethnicity are not simply data categories in the public school data, but they also touch upon individuals’ self-identity. Research indicates that attempts to categorize individuals in a way that is meaningful for research purposes (e.g., educational or health outcomes) often does not equate to how individuals think of themselves in regards to race/ethnicity.11 Furthermore, self-identity can change over time and under different circumstances. This is particularly pertinent for K-12 school data, which span 12 years. There are also subtle but important differences in the application of the uniform race/ethnicity categories across different data sources. Again, these considerations have less potential to affect non-Hispanic individuals of a single-race category, and more potential to affect individuals with mixed racial/ethnic origins.
The Hispanic category of students encompasses any student with any Hispanic ethnicity, regardless of their race. The primary consideration for making the projections was whether sudden changes in the count of Hispanic students in the year or two surrounding the year of the data change would be projected forward in perpetuity, causing the number of Hispanics to increase implausibly. WICHE observed this effect when preparing the eighth edition of these projections and made adjustments to mitigate it.
In fact, many states report atypically high (20 to 30 percent) year-over-year increases in grade-level enrollments and graduates categorized as Hispanic, in one or more school years between 2008-09 and 2010-11. Not surprisingly, the percentage increases are higher in states that have relatively lower numbers of Hispanic students to begin with. This type of sudden increase is not extrapolated forward, or at least is greatly mitigated, in the projections because the years in which these sudden shifts in the number of Hispanic students occur are given a lower weight when weighting older ratios, thus diminishing the effect.The new OMB category scheme does result in a
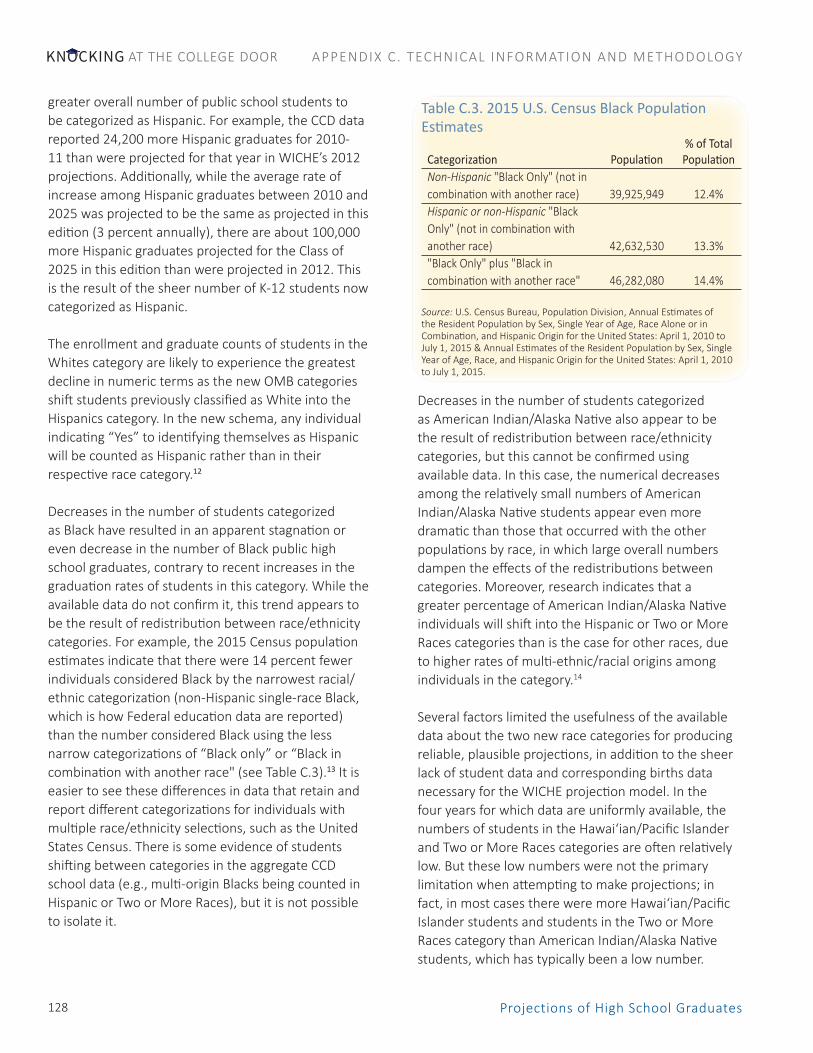
Projections of High School Graduates128
AT THE COLLEGE DOORKNOCKING APPENDIX C. TECHNICAL INFORMATION AND METHODOLOGY
greater overall number of public school students to be categorized as Hispanic. For example, the CCD data reported 24,200 more Hispanic graduates for 2010-11 than were projected for that year in WICHE’s 2012 projections. Additionally, while the average rate of increase among Hispanic graduates between 2010 and 2025 was projected to be the same as projected in this edition (3 percent annually), there are about 100,000 more Hispanic graduates projected for the Class of 2025 in this edition than were projected in 2012. This is the result of the sheer number of K-12 students now categorized as Hispanic.
The enrollment and graduate counts of students in the Whites category are likely to experience the greatest decline in numeric terms as the new OMB categories shift students previously classified as White into the Hispanics category. In the new schema, any individual indicating “Yes” to identifying themselves as Hispanic will be counted as Hispanic rather than in their respective race category.12
Decreases in the number of students categorized as Black have resulted in an apparent stagnation or even decrease in the number of Black public high school graduates, contrary to recent increases in the graduation rates of students in this category. While the available data do not confirm it, this trend appears to be the result of redistribution between race/ethnicity categories. For example, the 2015 Census population estimates indicate that there were 14 percent fewer individuals considered Black by the narrowest racial/ethnic categorization (non-Hispanic single-race Black, which is how Federal education data are reported) than the number considered Black using the less narrow categorizations of “Black only” or “Black in combination with another race" (see Table C.3).13 It is easier to see these differences in data that retain and report different categorizations for individuals with multiple race/ethnicity selections, such as the United States Census. There is some evidence of students shifting between categories in the aggregate CCD school data (e.g., multi-origin Blacks being counted in Hispanic or Two or More Races), but it is not possible to isolate it.
Decreases in the number of students categorized as American Indian/Alaska Native also appear to be the result of redistribution between race/ethnicity categories, but this cannot be confirmed using available data. In this case, the numerical decreases among the relatively small numbers of American Indian/Alaska Native students appear even more dramatic than those that occurred with the other populations by race, in which large overall numbers dampen the effects of the redistributions between categories. Moreover, research indicates that a greater percentage of American Indian/Alaska Native individuals will shift into the Hispanic or Two or More Races categories than is the case for other races, due to higher rates of multi-ethnic/racial origins among individuals in the category.14
Several factors limited the usefulness of the available data about the two new race categories for producing reliable, plausible projections, in addition to the sheer lack of student data and corresponding births data necessary for the WICHE projection model. In the four years for which data are uniformly available, the numbers of students in the Hawai‘ian/Pacific Islander and Two or More Races categories are often relatively low. But these low numbers were not the primary limitation when attempting to make projections; in fact, in most cases there were more Hawai‘ian/Pacific Islander students and students in the Two or More Races category than American Indian/Alaska Native students, which has typically been a low number.
Table C.3. 2015 U.S. Census Black Population Estimates
% of Total Categorization Population PopulationNon-Hispanic "Black Only" (not in combination with another race) 39,925,949 12.4%Hispanic or non-Hispanic "Black Only" (not in combination with another race) 42,632,530 13.3%"Black Only" plus "Black in combination with another race" 46,282,080 14.4%
Source: U.S. Census Bureau, Population Division, Annual Estimates of the Resident Population by Sex, Single Year of Age, Race Alone or in Combination, and Hispanic Origin for the United States: April 1, 2010 to July 1, 2015 & Annual Estimates of the Resident Population by Sex, Single Year of Age, Race, and Hispanic Origin for the United States: April 1, 2010 to July 1, 2015.

December 2016 129
AT THE COLLEGE DOORKNOCKING APPENDIX C. TECHNICAL INFORMATION AND METHODOLOGY
Projections of American Indian/Alaska Native students are possible largely because of longitudinal consistency in the data.
The patterns of the data for students in the Hawai‘ian/Pacific Islander and Two or More Races categories are still very unstable, which makes it inadvisable to attempt to make projections from them.
For example, across all states in the four years of available data, almost a quarter of the time there were year-over-year increases of 25 percent or more in the number of students in both the Hawai‘ian/Pacific Islander and Two or More Races categories. For example, there might be 1,000 fourth graders in 2010-11 and 1,250 in 2011-12, and up to 1,500 in 2012-13. These implausible rates of increase reflect redistribution from other categories, not rapid population growth. Perhaps even more problematic are erratic patterns of increase and substantial decrease over time in any given grade level.
Having only four years of these data permits only three years of CSR ratios, with attendant substantial instability and no obvious settled pattern. About a third of the time, the ratio of students in a higher grade to the number in the prior grade the year before was more than 110 percent. That is, in many cases, in each
subsequent year the number of additional students increases 10 percent or more in a given grade, creating a multiplier effect and producing implausible numbers of high school students and graduates.
A snapshot of the data aggregated for the United States highlights some of the data limitations while still obscuring the variation in data limitations or robustness that exists state-by-state. Figure C.4 shows the grade level enrollment counts and number of graduates.
To begin, births data do not yet line up with school data because of scheduling variations among the different data sources for transitioning to the new categories. The data suggest a substantial increase in the number of first graders categorized as Hawai‘ian/Pacific Islander or Two or More Races, compared to the number of U.S. births in these categories, which could represent either actual in-migration, a lack of correspondence between the categorizations, or some combination of both. Figure C.4 also demonstrates the substantial rates of growth and relative instability in the numbers such as large year-over-year numerical increases by grade and implausible rates of progression, which are highlighted in orange.
School 1st 12th Year Grade 2nd 3rd 4th 5th 6th 7th 8th 9th 10th 11th Grade Graduates 2008-09 3K 3K 3K 3K 3K 3K 3K 4K 4K 4K 4K 4K 3K 2009-10 4 4 3 4 4 4 4 4 4 4 4 4 3 2010-11 14 13 13 13 13 13 12 12 13 12 12 11 10 2011-12 15 14 14 14 13 13 13 13 14 13 12 11 10 2012-13 14 15 14 14 14 13 13 13 14 13 12 12 10 2013-14 14 13 14 14 14 13 13 13 14 13 12 11 N/A 2008-09 26K 24K 22K 20K 18K 16K 15K 15K 16K 15K 14K 13K 8K 2009-10 31 29 29 27 26 24 23 22 24 21 20 19 17 2010-11 110 101 95 93 89 86 82 78 84 73 64 57 52 2011-12 119 112 105 99 96 93 89 84 90 82 72 65 59 2012-13 135 122 116 108 102 100 96 91 98 87 78 72 66 2013-14 148 137 125 119 112 106 103 99 105 95 84 79 N/A Increase over 1st grade count: 105% 108% 361% 408%"Two or more races" births data were not uniformly available corresponding to any of the years that school data were available. By the time Two or more races births data were available (for 2010 to 2014), they represented only 40 to 50 percent of the count of Two or more races first graders in the most recent school year (e.g., 75,000 Two or more races births in 2014 versus 148,000 first graders in 2013-14).
Haw
ai‘ia
n/Pa
cific
Isla
nder
Two
or M
ore
Race
s
Figure C.4. Snapshot of Available Data for New Race Categories, United States

Projections of High School Graduates130
AT THE COLLEGE DOORKNOCKING APPENDIX C. TECHNICAL INFORMATION AND METHODOLOGY
Methodological ConsiderationsDemographic studies generally identify two main sources of population change: natural increase and net migration.15 The number of school-age youth – and, eventually, high school graduates – is influenced first and foremost by the number of children born, and secondarily by factors such as grade retention and acceleration, net migration between states and schools (in this case, movement between public and private schools), dropouts, early graduations, mortality, and policies and practices).
The projections model changes in birth trends explicitly, while assuming that the implicit influences on enrollments and graduates will carry forward indefinitely. The cohort survival ratios that are used to generate the projections capture these implicit factors as quantified by recent past data and carry them forward into the future projected years. However, this assumption has the greatest potential to degrade the accuracy of the projections should either a new pattern emerge in the preceding year or two, or new circumstances emerge in reality that are not evident in the years of available data.
Under the current methodology, Knocking at the College Door estimates the number of first graders based on the number of births that occurred six years prior. WICHE obtains data for live births by state and race/ethnicity from the National Center for Health Statistics, which is part of the Centers for Disease Control and Prevention. Births for 2014 were the latest available data at the time of publication; this establishes the last year for high school graduate projections as 2031-32, i.e., approximately when babies born in 2014 would reach 17 or 18 years of age.16 While not the principal focus of this publication, birth trends are instructive in their own right because of the significance they play in the projections methodology.
Figure C.5 plots the total number of public and private graduates (both actual reported counts and projections) with births 18 years prior, which corresponds to births between 1989 and 2014. The United States experienced a never before reached number of 4.32 million births in 2007. Birth/fertility
rates then entered a seven-year slide such that there were 384,000 fewer babies born in the U.S. in 2013 than in 2007 (a decline of 9 percent), which becomes evident in the later years of this edition’s projections for graduates. There was a slight uptick in births nationally in 2014 (about 56,000 births, or 1.4 percent more births than in 2013-14). But preliminary data indicates that the number of births in 2015 was essentially unchanged from 2014.17 So there is no evidence of a resumption of previous birth rates at the time that this edition is to be released, and therefore no indication of significant growth in the number of high school graduates in the early 2030s.
Two technical details related to births data are worth highlighting. While the number of births is a fundamentally robust indicator of how many first graders there will be in approximately six years, there are some observed discordances between the number of births and first graders. These discordances can likely be ascribed to nuances in data collection. First, states have been revising birth certificates to the 1997 OMB standards for reporting data on race and ethnicity by expanded categories, as have education agencies. As noted previously, generally individuals with Hispanic ethnicity origins are now counted only in the Hispanic category, and that there are now two new categories for non-Hispanic individuals: White, Black, Asian, Hawai‘ian/Pacific Islander, American Indian/Alaska Native, and Two or More Races.
Differences in the timing of the transition to the new OMB standards mean that the data related to births and education have not yet harmonized to the extent needed to produce reliable projections in the new expanded categories. WICHE’s CSR methodology requires five years of data in order for the data available for births overlap with the data available for first grade enrollments six years later. Table C.4 shows the small number of states for which birth and school data overlapped, and the years for which these data are available. All states were required to report student data in the new race/ethnicity categorizations beginning in school year 2010-11. In fact, 14 states transitioned to reporting in the new categorizations early, in 2008-09 or 2009-10, but none of these states had also converted their births records by the year that

December 2016 131
AT THE COLLEGE DOORKNOCKING APPENDIX C. TECHNICAL INFORMATION AND METHODOLOGY
would have corresponded to first graders, e.g., 2002 or 2003. Therefore, considering the data available for students and births by the time this edition was published, there were six states with four years’ worth of overlapping data, five states with three years’ worth, seven states with two years’ worth, and three states with only one year of overlapping data. There were no years in which national and regional birth data overlapped, since national births data are computed from the states’ births data.
These differences in the timing of the transition to the new race/ethnicity categories in the birth and school data compounded the overall insufficiency of data in the school data alone, making it impossible to produce reliable projections for the new race categories. Therefore, WICHE continues to associate births to school enrollments using the five categories of race/ethnicity that the U.S. Department of Education employed until school year 2009-10 (the insufficiency in the school data and decision to continue producing projections in the long-standing race/ethnicity categories is discussed below).18
There are certain nuances between relevant data sources, including births data, K-12 student data, and college data worth noting. A specific nuance that relates to the data sources used in these projections is that infants/births are categorized only by the mother’s race/ethnicity, whereas school enrollments data are more likely to reflect both parents’ race/ethnicity, which may be different from the mother’s race/ethnicity alone. Because college planners and administrators are a primary audience for these projections, it is also worth noting that there may also be some differences in the way students are
3.8
3.9
4.0
4.1
4.2
4.3
4.4
3.0
3.1
3.2
3.3
3.4
3.5
3.6
Birt
hs 1
8 Ye
ars P
rior (
Milli
ons)
Grad
uate
s (M
illion
s)
Graduating Class
2007 2012
3.6
3.5
3.4
3.3
3.2
3.1
3.0
Grad
uate
s (M
illio
ns)
ACTUAL GRADUATES
P R O J E C T E D G R A D U AT E S
3.88
Figure C.5. Long-Term Graduate Trends Reflect Births 18 Years Prior, 2007-2032
2017 2022 2027 2032
4.4
4.3
4.2
4.1
4.0
3.9
3.8
Births 18 Years Prior (Millions)
B IRTHS
3.93
3.99
4.32
Graduating Class
Sources: National Center for Health Statistics, Centers for Disease Control and Prevention and WICHE calculations. 2015 preliminary births obtained from Brady E. Hamilton, Ph.D., Joyce A. Martin, M.P.H., and Michelle J.K. Osterman, M.H.S., “Births: Preliminary Data for 2015," U.S. Department of Health and Human Services, Centers for Disease Control and Prevention, National Center for Health Statistics, June 2, 2016. Accessed September 6, 2016 from http://www.cdc.gov/nchs/data/nvsr/nvsr65/nvsr65_03.pdf.
Table C.4. States by Years of Overlapping Births and School DataYear Births Records Transitioned to New Race/Ethnicity Categories 2004 2005 2006 2007 2008 2009 (4 years of (3 years of (2 years of (1 year of Georgia, Remaining overlapping overlapping overlapping overlapping Michigan, 29 states data) data) data) data) Montana, and D.C. Idaho, Florida, California, Colorado, New Mexico, Kentucky, Kansas, Delaware, Iowa, New York, Pennsylvania, Nebraska, North Dakota, Indiana Oregon, South New Ohio, Utah Carolina, Hampshire South Dakota, Tennessee, Texas Vermont, Washington Wyoming

Projections of High School Graduates132
AT THE COLLEGE DOORKNOCKING APPENDIX C. TECHNICAL INFORMATION AND METHODOLOGY
categorized by race/ethnicity among recent high school graduates and in other data related to postsecondary education such as in the Integrated Postsecondary Education Data System (IPEDS). There may be some difference between how individuals are counted in different groupings (e.g., recently enrolled high school graduates versus all college students). And, some difference between data sources of any type may relate to individuals’ concept of their self-attested racial/ethnic identify over time and in relation to different circumstances such as college admission and financial aid.19 Of course, all of these factors have a greater impact in computations when there are a relatively small number of individuals.
With respect to the impact on the projections, theoretically, one would expect that something very close to 100 percent of children born would enter first grade within six years. However, there are cases where the ratio of births to first graders is notably higher or lower than 100 percent; this is particularly true for state and race/ethnicity groupings with low numbers. The ratio of births to first graders has always been subject to some level of effect from interstate relocations, immigration, changes in race/ethnicity categories, early and late enrollment of first graders, homeschooling, and the small but non-negligible rates of childhood mortality. WICHE was somewhat concerned that these data nuances could lead to an over- or underestimation of underlying population changes. WICHE’s analysis, however, indicated that the underlying population changes predicted by births are actually tracked quite well in the total number of graduates. Also, for most states, the sum of the students independently projected by race/ethnicity tracks with the underlying population. However, this underlying discordance between race/ethnicity categorizations in the births and school data may have a non-negligible effect in smaller states and race/ethnicities.
Other Factors Affecting CSRs and ProjectionsMortality, grade retention, and grade acceleration. Mortality, grade retention (holding students back), and grade acceleration (promoting students early) impact enrollments and grade progression to varying
extents. More importantly, national estimates indicate that these factors can vary systematically by race/ethnicity.20 However, these data cannot be specifically derived by state, race/ethnicity and grade level. Instead, they are implicitly included in the calculated cohort survival ratios that reflect the various aspects of grade progression. Interested readers can find more detail about child mortality, grade retention, and grade acceleration in WICHE’s 2012 Methodology Review Report.21
Movement and migration. The impact of movement and migration may have an impact on year-to-year enrollment data and ratios. One type of movement is when students transition between public and private schools, which most typically occurs at the junctures between school levels (e.g., when parents shift their children from public to private school at the beginning of ninth grade). The movement between public and private schools is implicitly reflected in the data for public and private school enrollments, but they are not easily discernible from other factors that are in play at the same time (e.g., relatively high rates of retention in the ninth grade), because they occur in relatively small numbers compared to the totals.
More impactful are the migrations of families and students who move between states and who immigrate from outside the United States.22 Recent trends for immigration of foreign-born individuals into the United States are discussed in Chapter 4. Overall, immigration to the U.S. has been down for eight years and will therefore not add to the overall numbers of youth as it had in past decades. Furthermore, there has been some change in the countries of origin for those foreign-born populations that are growing.23 Patterns vary by state; for example, states with a long history of high immigration are most likely still drawing a large proportion of immigrants to their established immigrant centers. Other regions and states, such as North Carolina, are emerging as new immigrant destinations within the United States. 24 And the net out-migration of Mexican immigrants that followed the Great Recession may have been substantial enough in some states to impact enrollments.25
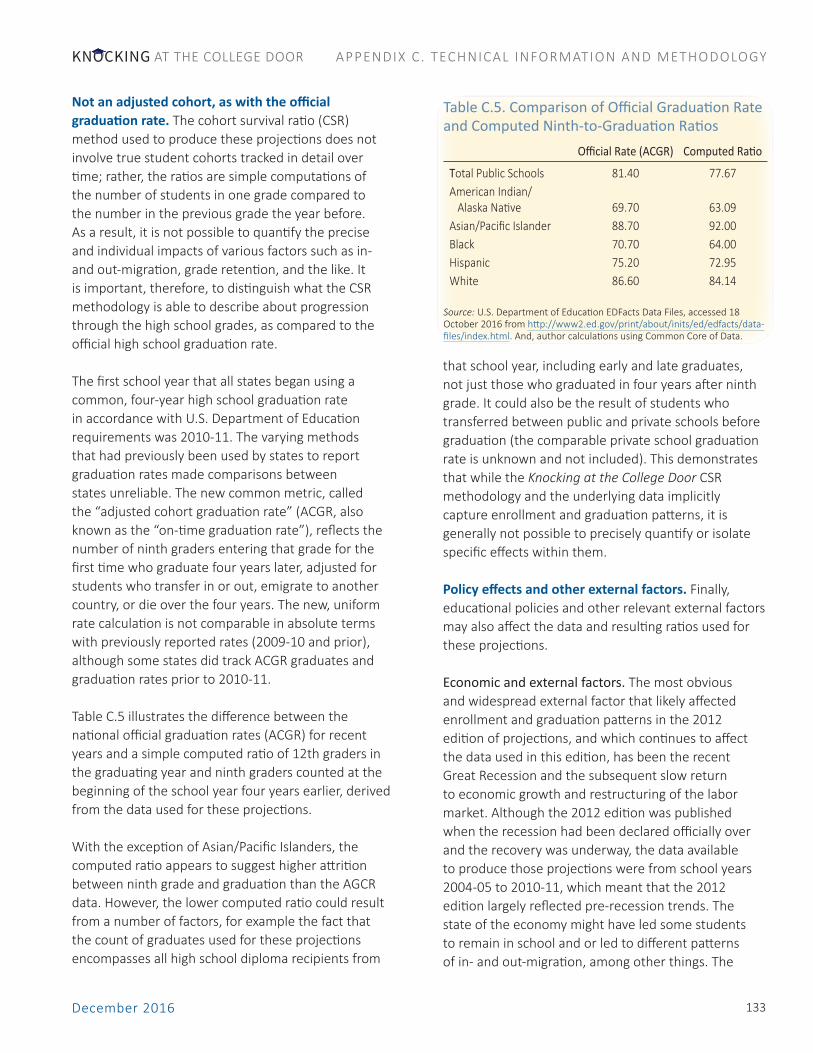
December 2016 133
AT THE COLLEGE DOORKNOCKING APPENDIX C. TECHNICAL INFORMATION AND METHODOLOGY
Not an adjusted cohort, as with the official graduation rate. The cohort survival ratio (CSR) method used to produce these projections does not involve true student cohorts tracked in detail over time; rather, the ratios are simple computations of the number of students in one grade compared to the number in the previous grade the year before. As a result, it is not possible to quantify the precise and individual impacts of various factors such as in- and out-migration, grade retention, and the like. It is important, therefore, to distinguish what the CSR methodology is able to describe about progression through the high school grades, as compared to the official high school graduation rate.
The first school year that all states began using a common, four-year high school graduation rate in accordance with U.S. Department of Education requirements was 2010-11. The varying methods that had previously been used by states to report graduation rates made comparisons between states unreliable. The new common metric, called the “adjusted cohort graduation rate” (ACGR, also known as the “on-time graduation rate”), reflects the number of ninth graders entering that grade for the first time who graduate four years later, adjusted for students who transfer in or out, emigrate to another country, or die over the four years. The new, uniform rate calculation is not comparable in absolute terms with previously reported rates (2009-10 and prior), although some states did track ACGR graduates and graduation rates prior to 2010-11.
Table C.5 illustrates the difference between the national official graduation rates (ACGR) for recent years and a simple computed ratio of 12th graders in the graduating year and ninth graders counted at the beginning of the school year four years earlier, derived from the data used for these projections.
With the exception of Asian/Pacific Islanders, the computed ratio appears to suggest higher attrition between ninth grade and graduation than the AGCR data. However, the lower computed ratio could result from a number of factors, for example the fact that the count of graduates used for these projections encompasses all high school diploma recipients from
that school year, including early and late graduates, not just those who graduated in four years after ninth grade. It could also be the result of students who transferred between public and private schools before graduation (the comparable private school graduation rate is unknown and not included). This demonstrates that while the Knocking at the College Door CSR methodology and the underlying data implicitly capture enrollment and graduation patterns, it is generally not possible to precisely quantify or isolate specific effects within them.
Policy effects and other external factors. Finally, educational policies and other relevant external factors may also affect the data and resulting ratios used for these projections.
Economic and external factors. The most obvious and widespread external factor that likely affected enrollment and graduation patterns in the 2012 edition of projections, and which continues to affect the data used in this edition, has been the recent Great Recession and the subsequent slow return to economic growth and restructuring of the labor market. Although the 2012 edition was published when the recession had been declared officially over and the recovery was underway, the data available to produce those projections were from school years 2004-05 to 2010-11, which meant that the 2012 edition largely reflected pre-recession trends. The state of the economy might have led some students to remain in school and or led to different patterns of in- and out-migration, among other things. The
Table C.5. Comparison of Official Graduation Rate and Computed Ninth-to-Graduation Ratios
Official Rate (ACGR) Computed Ratio
Total Public Schools 81.40 77.67American Indian/ Alaska Native 69.70 63.09Asian/Pacific Islander 88.70 92.00Black 70.70 64.00Hispanic 75.20 72.95White 86.60 84.14
Source: U.S. Department of Education EDFacts Data Files, accessed 18 October 2016 from http://www2.ed.gov/print/about/inits/ed/edfacts/data-files/index.html. And, author calculations using Common Core of Data.

Projections of High School Graduates134
AT THE COLLEGE DOORKNOCKING APPENDIX C. TECHNICAL INFORMATION AND METHODOLOGY
data available for this edition of projections are still substantially lagged (enrollments from school years 2009-10 to 2013-14 and graduates from school years 2008-09 to 2012-13), but they are probably more reflective of the current economic reality, which is largely very similar to the economic patterns of the past several years in many states that continue to experience relatively slow recovery. It is the case with each new edition of projections that the available data are better able to predict short-term trends. Specifically, the births and school data available for this editions might not as precisely predict medium- or longer-term trends, particularly if the economy recovers rapidly and substantially in the near future (in fact, some states have already realized significant economic recovery, the effects of which might not be reflected in the data for these projections).
WICHE’s research also indicates that some of the unexpectedly strong growth/retention in enrollments and graduates in recent years may be related to this federal immigration policy, implemented in 2012, that provides temporary relief from deportation and a two-year work permit to certain individuals who were brought to the U.S. illegally as children. In particular, the DACA education requirements may be a strong, additional incentive for certain youth populations to remain in school and graduate.26 It is not possible to quantify this effect, but for example, over 1 million DACA requests were accepted between 2012 and 2014, the highest numbers being from states with large immigrant populations.27 Some states have also recently received and are hosting notable numbers of unaccompanied minors from Central and South America, which are more likely to have impacts locally.28
Education policies and practices. Educational policy and practice innovations presumably affect student and graduate patterns more directly. Changes to graduation and high school course-taking policies are likely to have the most immediate, direct effect on these high school graduate projections. But other changes that affect earlier grades may be subtler and show up over the longer term. For example:
ff Implementation of major new curricula and exams such as the Common Core. Effects from curriculum change are unlikely to be immediate in most cases, and may only become evident over several editions of these projections. But, one specific related example is the elimination of the California High School Exit Examination (CAHSEE) due to a misalignment of the test and the recently implemented Common Core standards. Beginning January 1, 2016, no student in the state of California is required to take an exit examination, including those in adult education courses. Furthermore, any student whose only outstanding graduation requirement was the passing of CAHSEE is now immediately eligible to receive their high school diploma.29 It is unclear exactly how many more students will graduate each year and how many will retroactively graduate (one estimate states that about 249,000 students have failed the test since it became a graduation requirement in 2006, about 6 percent of the test takers in that time).30 But there are likely to be more graduates in California than projected as this exemption takes effect.
ff Expansions of dual/concurrent enrollment opportunities. States may expand opportunities for dual and concurrent enrollment in order to provide an incentive to remain in school, or extend these opportunities to additional new student populations.31
ff Monitoring and metrics. It is possible that more accurate student tracking through the increasing use of state longitudinal data systems may have led to numeric effects in the Common Core of Data.32 Along these lines, it appears the transition to the uniform official graduation rate may have had some effect on the number and type of diplomas awarded and counted in the data used for these projections.33
ff Every Student Succeeds Act (ESSA). Any discernible effect of ESSA – for example, the effect of the decision to shift funding formulas in order to allocate more funds to schools with higher relative proportions of students below the poverty line – will begin to emerge in the next edition of the projections at the earliest, as it is targeted for implementation in school year 2017-18.

December 2016 135
AT THE COLLEGE DOORKNOCKING APPENDIX C. TECHNICAL INFORMATION AND METHODOLOGY
Data Sources and NotesThis section provides specific information regarding the sources of data used in this publication, detailed notes and observations about the raw data, and any adjustments made to these data.
BirthsWICHE obtained data for live births from the National Center for Health Statistics and Prevention, which is part of the Centers for Disease Control. The data were acquired through the VitalStats table builder (http://205.207.175.93/VitalStats/ExtractViewer/extractView.aspx). Births data were grouped according to the mother’s state of residence (MRSTATE), mother’s Hispanic origin (UMHISP), and mother’s race (MRACEREC or MRACE4, as available by year). For this edition, WICHE acquired births data for 2011 to 2014 and added them to births data used for previous editions; the last available data were for 2014 births by state and race/ethnicity.
The births data are considered final, so adjustments were generally not made to the values obtained. However, due to new suppression rules for the publicly available births data, it was necessary to impute a small number of values. Counts of 10 or fewer and higher-level counts built from these counts were suppressed. WICHE derived the missing values based on the difference of totals and subcategories, as described in Table C.6. In recent years, race/ethnicity was “not stated” for between 0.6 percent and 0.9 percent of births, so these data were not used because there was no information for distributing them between the Hispanic and race categories.
Public School Data NotesAll public school data were obtained from the Common Core of Data (CCD), which is maintained by the National Center for Education Statistics (NCES), part of the U.S. Department of Education.
Data for graduates prior to 2009-10 and for prior years’ enrollments are those that were published in the 2012 edition of Knocking at the College Door and maintain the data adjustments made for that edition. Many are republished in this edition for historical perspective.
At the time of publication, the most recent available CCD data were for enrollments through school year 2013-14 and graduates through 2012-13. WICHE obtained the statewide grade-level enrollment counts from the publicly available datafiles at https://nces.ed.gov/ccd/stnfis.asp. The 2009-10 graduates were obtained from the publicly available datafile at https://nces.ed.gov/ccd/drpcompstatelvl.asp. Since the graduates data were not available past the school year 2009-10 in datafile format, the statewide counts for graduates/diploma recipients were obtained from the Digest of Education Statistics online data tables:
The state total was suppressed due to suppression of a Hispanic "Not Stated" value less than 10. So, the state total was computed as the sum of Non-Hispanic and Hispanic births.
The state total was suppressed due to suppression in underlying Hispanic nationality categories. So, the state total was computed as the sum of Non-Hispanic and Hispanic births.
The Hispanic total and state total were suppressed due to suppression in underlying Hispanic nationality categories. So, the Hispanic total was obtained from National Vital Statistics publications about final births,34 or computed based on all available unsuppressed counts in the Hispanic nationality categories, variably. Then the state total was computed as the sum of Non-Hispanic and the computed value for Hispanic births.
The Non-HIspanic American Indian total was estimated as 9 since it was suppressed in the available data for being less than 10.
Table C.6. Estimation of Suppressed Births Counts States/Years Estimation MethodU.S. Total (2012, 2013) Alabama (2012)Hawai‘i (2014)Iowa (2013)Maine (2014)Idaho (2013)Maine (2012)Montana (2012, 2013)Vermont (2012, 2014)West Virginia (2012, 2013)Wyoming (2013)Maine (2013)Idaho (2013)Mississippi (2012)Montana (2014)North Dakota (2014)South Dakota (2012, 2014)Vermont (2013)Wyoming (2012, 2014)
Delaware (2012, 2013, 2014)D.C. (2013, 2014)New Hampshire (2012, 2014)Vermont (2012, 2014)West Virginia (2012, 2013)
Note: The difference from an actual total should be in the magnitude of 10 or less, by definition, since suppression occurs for values of 10 or less.

Projections of High School Graduates136
AT THE COLLEGE DOORKNOCKING APPENDIX C. TECHNICAL INFORMATION AND METHODOLOGY
ff Table 219.32. Public high school graduates, by sex, race/ethnicity, and state or jurisdiction: 2010-11, at http://nces.ed.gov/programs/digest/d14/tables/dt14_219.32.asp
ff Table 219.33. Public high school graduates, by sex, race/ethnicity, and state or jurisdiction: 2011-12, at http://nces.ed.gov/programs/digest/d15/tables/dt15_219.33.asp
ff Table 219.32. Public high school graduates, by sex, race/ethnicity, and state or jurisdiction: 2012-13, at http://nces.ed.gov/programs/digest/d15/tables/dt15_219.32.asp
Therefore, the public school enrollments projections begin with school year 2014-15 and the high school graduate projections begin with school year 2013-14.
The data were reviewed for anomalies and compared with state-published data on nonpublic school enrollments or graduates, where this information was available. In carefully reviewing these data, WICHE noted a number of nuances but limited its data adjustments to cases in which there were obvious discrepancies – for instance, if the number of public graduates was the same as the number of graduates of a single racial/ethnic group, or if a data point for one year was substantially different from adjacent years. The data were reviewed with the expectation that there might be some perceptible effects of the race/ethnicity re-categorization discussed in the Methods section; where a given change appeared to repeat in subsequent years, it was typically not considered a data error.
It had been the case more frequently in prior years that the state public schools’ totals did not always equal the sum of the five racial/ethnic categories – for example, because a state tracked additional categories that were not covered by the five CCD categories (e.g., California, Georgia, and Ohio). This difference appears to have diminished in recent years’ data, but it may be observed in the historical reported counts presented with the projections. This difference may also occur if data in data were suppressed, as is typically done for low counts, or for other unknown reasons.
Information about any data adjustments, pertinent data notes from NCES documentation about the data files, or adjustments to the projection methodology to mitigate anomalous patterns are noted for each state in Table C.7.
Definition of high school graduate. High school graduates are those reported as regular diploma recipients. The CCD defines a regular diploma as the high school completion credential awarded to students who meet or exceed coursework and performance standards set by the state or other approving authority. What a high school diploma represents varies across states. Neither GED recipients nor recipients of alternative diplomas or credentials are included in these data, and detailed data are not available to fully account for the number of GED or other diploma equivalents nationally, let alone by state. But, for example, there were about 537,600 GED passers in 2013, 22 percent of which were between 16 and 18 years old (about 120,400).35 In 2014, there were about 20,000 completers of the HiSET exam (an alternative to the GED), but data by age are not available for these students.36 Likewise, no data are available for the specific number of students who completed and passed the TASC exam (another alternative to the GED).
Bureau of Indian Education schools. The CCD allows for the Bureau of Indian Education (BIE) to report data about the schools under their authority, however the BIE did not report the data for most years. WICHE’s research indicates that students enrolled in BIE- and tribally-operated schools educate between 8 and 10 percent of all American Indian/Alaska Native youth, representing about 40,000 students within 183 schools in 23 states. In 2012-13, the states with the highest number of schools serving 70 percent of BIE-educated youth nationally were Arizona, New Mexico, South Dakota, and North Dakota. Other states where American Indian/Alaska Native students are most highly concentrated are Oklahoma, California, and Alaska, but it appears that most of these students are included in the public-schools data. The necessary data were not available to add to the data used for the American Indian/Alaska Native projections.

December 2016 137
AT THE COLLEGE DOORKNOCKING APPENDIX C. TECHNICAL INFORMATION AND METHODOLOGY
Private School Data NotesThe Private School Universe Survey (PSS) is a biannual survey conducted in odd years by NCES and provides
Table C.7. Public School Data and Methodology Adjustments
State Enrollments GraduatesCalifornia California did not report graduation data for 2008-09
to the NCES Common Core of Data, so NCES imputed graduates at the state level such that the prior year's graduation rates were maintained at the race/ethnicity level.
Connecticut For school year 2009-10, NCES imputed graduation data at the state level based on prior-year rates because reported values were "excessively high."
Georgia According to the NCES data notes, the State Education Agency (SEA) did not report magnet schools in 2013-14. The SEA indicated that it would revise its magnet data, but these revisions were not made in time to be included in the CCD files used for these projections.
Hawai‘i A sudden but apparently real doubling of Hispanic first- and second-grade enrollments in 2012-12 and 2013-14 in combination with sudden increases in the grade progression ratios led to implausible, additive inflation and to a tripling of the number of first graders graduating in 17 years. Hawai‘i data officials confirmed that the enrollments counts were actual, and likely a result of the data recategorizations and real enrollment growth. Therefore, WICHE used the rates of progression between first and twelfth grade that were observed up through 2008-09, before the category change, and let the observed rates of increase in first and second grade enrollments flow forward, resulting in a more plausible increase.
Louisiana Hispanic enrollments decreased by about 20 percent between 2009-10 and 2010-11 in all grades, and then increased more than 40 percent between 2010-11 and 2011-12 in all grades. All Hispanic enrollments for 2010-11 were linearly imputed.
Maine For 2008-09, Maine reported data for some semi-private schools that receive more than 60 percent of their funding through public sources (1,419 diplomas awarded to students from those schools).
New Hampshire According to NCES data notes, New Hampshire misreported its Black and Hispanic graduate counts for 2008-09. The graduate counts and associated rates for New Hampshire’s Black and Hispanic students were to be corrected on an upcoming data release, but none was available by publication.
data for religious and nonsectarian private/nonpublic elementary and secondary schools in all 50 states and the District of Columbia. Details concerning the PSS methodology are available on NCES’s website (http://

Projections of High School Graduates138
AT THE COLLEGE DOORKNOCKING APPENDIX C. TECHNICAL INFORMATION AND METHODOLOGY
nces.ed.gov/surveys/pss). Response rates for the PSS are high and its data can be disaggregated by state as needed for these projections. These data do not cover students homeschooled without classroom instruction.
PSS data for enrollments and graduates through and including 2008-09 are those used in the 2012 edition of Knocking at the College Door. PSS enrollments obtained for this edition came from the 2011-12 survey data files (PSS1112) available on NCES’s website (http://nces.ed.gov/surveys/pss), which was the latest year of data available at the time of publication. For that administration the response rate nationally was 92 percent.37 This file provided enrollments for school year 2011-12. Graduates data are not provided in the PSS enrollment data files, so they were obtained the from NCES’s PSS Data Table 15, which details the number of private schools, students, full-time equivalent teachers, and high school graduates, by state and academic year.38 As with the CCD public school data, graduates in the PSS data are lagged and refer to the preceding academic year, so Table 15 provided graduate counts for school year 2010-11. As
such, projections for private school graduates begin with school year 2011-12, two years lagged from the public school projections.
The data were reviewed for anomalies and compared to state-published data on nonpublic school enrollments or graduates where this information was available. Information about any data adjustments or sources other than PSS data, or adjustments to the projection methodology to mitigate anomalous patterns, are noted for each state in Table C.8. Most anomalies were observed in states with low student counts for private schools, and therefore the projections for these states may be considered tentative or estimated.
Because the PSS data are collected every other year, enrollment counts for grades 1 to 11 for years between PSS administrations are linearly imputed. Grade 12 enrollment counts are provided in the PSS data for all years from PSS survey question 9b, which requests the number of students enrolled in the 12th grade around October 1 of the prior academic year, which
State Enrollments GraduatesNew York According to NCES data notes for 2013-14
enrollments data, on all three levels (state, LEA, and school) the SEA reported zero Hawaiian Native/Pacific Islander students in 2013-14 although over 5,000 students were reported in this category at all three levels in 2012-13. The SEA offered no explanation. It is possible these students are being counted in the Two or More Races category. This count increased from approximately 33,500 (all three levels) in 2012-13 to over 40,400 (all three levels) in 2013-14.
Ohio Observed 10-15 percent decreases in grades 11 and 12 for 2010-11 and 2011-12, primarily attributable to similar changes in White enrollments. Insufficient information or data was received in order to confirm whether these were real/actual decreases or to make adjustments to the data.
Tennessee There were no counts for graduates/diploma recipients in the Two or More Races category in any year.
Vermont According to NCES data notes for the 2013-14 enrollments data, the school- and district-level counts do not match statewide counts, due perhaps to differences in funding source.
Note: If a state is not listed, no data adjustments were made.
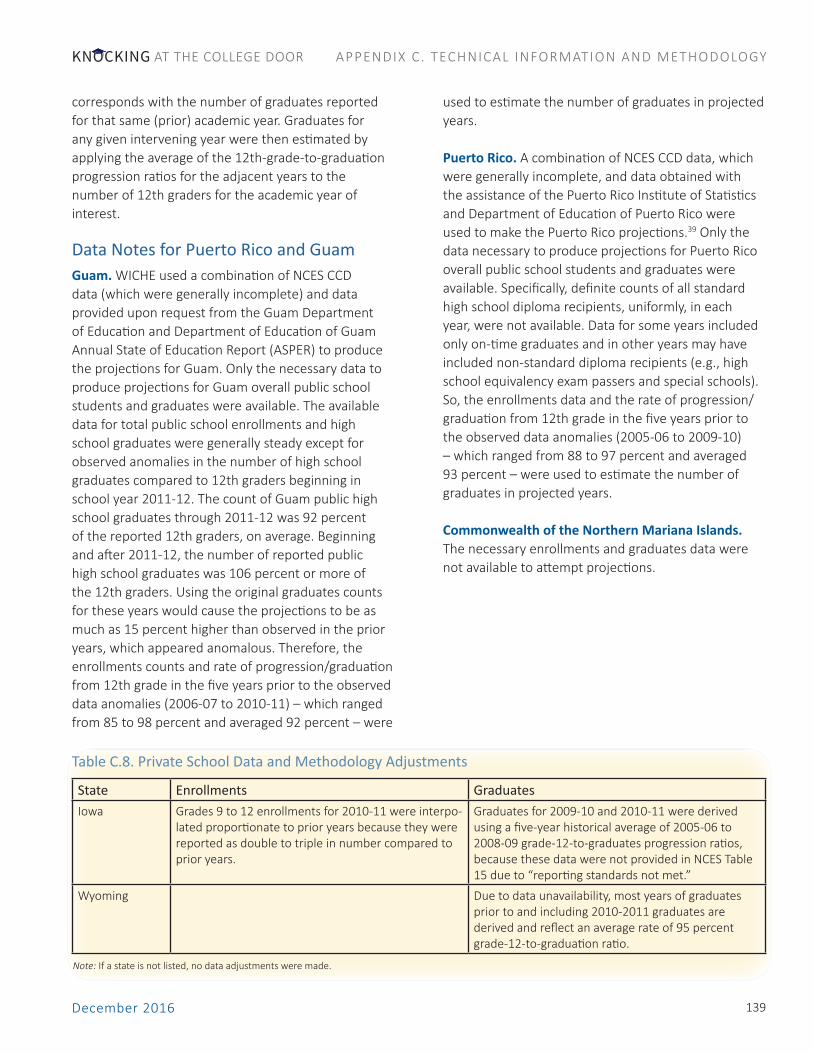
December 2016 139
AT THE COLLEGE DOORKNOCKING APPENDIX C. TECHNICAL INFORMATION AND METHODOLOGY
corresponds with the number of graduates reported for that same (prior) academic year. Graduates for any given intervening year were then estimated by applying the average of the 12th-grade-to-graduation progression ratios for the adjacent years to the number of 12th graders for the academic year of interest.
Data Notes for Puerto Rico and GuamGuam. WICHE used a combination of NCES CCD data (which were generally incomplete) and data provided upon request from the Guam Department of Education and Department of Education of Guam Annual State of Education Report (ASPER) to produce the projections for Guam. Only the necessary data to produce projections for Guam overall public school students and graduates were available. The available data for total public school enrollments and high school graduates were generally steady except for observed anomalies in the number of high school graduates compared to 12th graders beginning in school year 2011-12. The count of Guam public high school graduates through 2011-12 was 92 percent of the reported 12th graders, on average. Beginning and after 2011-12, the number of reported public high school graduates was 106 percent or more of the 12th graders. Using the original graduates counts for these years would cause the projections to be as much as 15 percent higher than observed in the prior years, which appeared anomalous. Therefore, the enrollments counts and rate of progression/graduation from 12th grade in the five years prior to the observed data anomalies (2006-07 to 2010-11) – which ranged from 85 to 98 percent and averaged 92 percent – were
used to estimate the number of graduates in projected years.
Puerto Rico. A combination of NCES CCD data, which were generally incomplete, and data obtained with the assistance of the Puerto Rico Institute of Statistics and Department of Education of Puerto Rico were used to make the Puerto Rico projections.39 Only the data necessary to produce projections for Puerto Rico overall public school students and graduates were available. Specifically, definite counts of all standard high school diploma recipients, uniformly, in each year, were not available. Data for some years included only on-time graduates and in other years may have included non-standard diploma recipients (e.g., high school equivalency exam passers and special schools). So, the enrollments data and the rate of progression/graduation from 12th grade in the five years prior to the observed data anomalies (2005-06 to 2009-10) – which ranged from 88 to 97 percent and averaged 93 percent – were used to estimate the number of graduates in projected years.
Commonwealth of the Northern Mariana Islands. The necessary enrollments and graduates data were not available to attempt projections.
Table C.8. Private School Data and Methodology Adjustments
State Enrollments GraduatesIowa Grades 9 to 12 enrollments for 2010-11 were interpo-
lated proportionate to prior years because they were reported as double to triple in number compared to prior years.
Graduates for 2009-10 and 2010-11 were derived using a five-year historical average of 2005-06 to 2008-09 grade-12-to-graduates progression ratios, because these data were not provided in NCES Table 15 due to “reporting standards not met.”
Wyoming Due to data unavailability, most years of graduates prior to and including 2010-2011 graduates are derived and reflect an average rate of 95 percent grade-12-to-graduation ratio.
Note: If a state is not listed, no data adjustments were made.

Projections of High School Graduates140
AT THE COLLEGE DOORKNOCKING APPENDIX C. TECHNICAL INFORMATION AND METHODOLOGY
Endnotes1 Richard S. Grip, “Projecting Enrollment in Rural Schools: A Study of Three Vermont School Districts,” Journal of Research in Rural Education 19, 3 (November 2004): 1-6. See also Robert C. Shaw, “Enrollment Forecasting: What Works Best?” NASSP Bulletin 68, 468 (January 1984): 52-58.2 Western Interstate Commission for Higher Education, “Knocking at the College Door Methodology Review,” accessed October 24, 2016, http://www.wiche.edu/pub/knocking-methodology-review.3 Ibid.4 Ibid.5 In addition, graduates for California were imputed by NCES in the CCD, because the state did not report them. Robert Stillwell, Jennifer Sable, Christopher Plotts, and Amber Noel, “NCES Common Core of Data State Dropout and Completion Data File: School Year 2008-09,” U.S. Department of Education National Center for Education Statistics, 2011, accessed October 13, 2016, http://nces.ed.gov/ccd/pdf/INsdr08gen1a.pdf.6 William J. Hussar and Tabitha M. Bailey “Projections of Education Statistics to 2024, 43rd Edition,” U.S. Department of Education, National Center for Education Statistics, 2016, accessed October 13, 2016, https://nces.ed.gov/pubsearch/pubsinfo.asp?pubid=2015073. 7 WICHE attempted to obtain more recent data through the NCES staff listed on the website and through the WICHE staff’s network of professional contacts. WICHE held off considering the projections final until the last possible moment (mid-September 2016), past which it would not have been possible to release the projections by early December 2016. NCES released several First Look reports and graduation rates for school year 2014-15 in the first part of October 2016, which suggested that new data were imminent. But as of October 18, 2016 (after most states’ Fall student count dates for the 2016-17 school year), the latest CCD enrollments and graduate data available were for school year 2013-14 and 2012-13, respectively.8 Where the state-sourced data are sufficient to produce projections by race/ethnicity, the difference between the simulated and official projections has some additional dispersion, but it appeared generally in line with what can be seen in WICHE’s Historical Accuracy analysis.9 Only the public school student data from the CCD uniformly include race/ethnicity detail; private school data from the Private School Survey do not include race/ethnicity detail in the grade-level enrollments or graduate data. Therefore, all references to students by race/ethnicity refer to public school students only.10 WICHE consulted multiple sources to determine whether there is a commonly accepted method for bridging the multiracial data to prior categories. While there is official guidance about methods for distributing multiracial individuals into the distinct categories when the data are available in individual-record form, there is none for distributing them based on aggregated data, such as CCD. For one recent example of NCES reporting using 2008-09 CCD data, see Chris Chapman, Jennifer Laird, and Angelina KewalRamani, Trends in High School Dropout and Completion Rates in the United States: 1972–2008, NCES 2011-012, Washington, D.C.: National Center for Education Statistics, Institute of Education Sciences, U.S. Department of Education, 2010, accessed March 31, 2012, http://nces.ed.gov/pubs2011/2011012.pdf. See also Susan Aud, William Hussar, Grace Kena, Kevin Bianco, Lauren Frohlich, Jana Kemp, and Kim Tahan, The Condition of Education 2011, NCES 2011-033. Washington, D.C.: U.S. Department of Education, National Center for Education Statistics, 2011, accessed November 26, 2012, http://nces.ed.gov/pubs2011/2011033.pdf.11 Brian Duncan and Stephen J. Trejo, “The Complexity of Immigrant Generations: Implications for Assessing the Socioeconomic Integration of Hispanics and Asians,” National Bureau of Economic Research, NBER Working Paper No. 21982 (February 2016), accessed October 17, 2016, http://www.nber.org/papers/w21982; Gary D. Sandefur, Mary E. Campbell, and Jennifer Eggerling-Boeck, “Racial and Ethnic Identification, Official Classifications, and Health Disparities,” In Critical Perspectives on Racial and Ethnic Differences in Health in Late Life. Washington, D.C.: National Academies Press, 2004, accessed October 17, 2016, https://www.ncbi.nlm.nih.gov/books/NBK25522/.
12 D’Vera Cohn, “Millions of Americans changed their racial or ethnic identity from one census to the next,” Pew Research Center, May 5, 2014, accessed October 1, 2016, http://www.pewresearch.org/fact-tank/2014/05/05/millions-of-americans-changed-their-racial-or-ethnic-identity-from-one-census-to-the-next/.13 Bridged-Race Population Estimates from 1990 to 2015 also suggest that there has not been a net decline in individuals with Black origins. U.S. Department of Health and Human Services, Centers for Disease Control and Prevention, National Center for Health Statistics, “Bridged-Race Population Estimates,” available on CDC WONDER Online Database, accessed August 25, 2016, http://wonder.cdc.gov/bridged-race-v2015.html.14 Ibid; Cohn. 15 Stephen Coelen and Joseph B. Berger, New England 2020: A Forecast of Educational Attainment and Its Implications for the Workforce of New England States. Quincy, MA: Nellie Mae Foundation, 2006:1.16 Approximately, because births are reported for calendar years January to December, while enrollments are reported for school years and therefore do not overlap precisely.17 2015 preliminary births obtained from Brady E. Hamilton, Ph.D., Joyce A. Martin, M.P.H., and Michelle J. K. Osterman, M.H.S., "Births: Preliminary Data for 2015," U.S. Department of Health and Human Services, Centers for Disease Control and Prevention, National Center for Health Statistics, June 2, 2016, accessed September 6, 2016, http://www.cdc.gov/nchs/data/nvsr/nvsr65/nvsr65_03.pdf. 18 Deborah D. Ingram, Jennifer D Parker, Nathaniel Schenker, James A. Weed, Brady Hamilton, Elizabeth Arias, and Jennifer H. Madans, United States Census 2000: Population with Bridged Race Categories. Washington, D.C.: National Center for Health Statistics, 2003, accessed August 16, 2012, http://www.cdc.gov/nchs/data/series/sr_02/sr02_135.pdf.19 Ibid; Brian Duncan and Trejo, Stephen J., 2016, and Gary D. Sandefur, Mary E. Campbell, and Jennifer Eggerling-Boeck, “Racial and Ethnic Identification, Official Classifications, and Health Disparities,” In Critical Perspectives on Racial and Ethnic Differences in Health in Late Life. Washington, D.C.: National Academies Press, 2004, accessed October 17, 2016, https://www.ncbi.nlm.nih.gov/books/NBK25522/.20 For example, Jiaquan Xu, Sherry L. Murphy, Kenneth D. Kochanek, and Sherry L. Murphy, “Deaths: Final Data for 2013.” National Vital Statistics Reports 64, no. 2. Atlanta: Centers for Disease Control and Prevention, National Center for Health Statistics, Division of Vital Statistics, 2016, accessed November 2, 2016, http://www.cdc.gov/nchs/data/nvsr/nvsr64/nvsr64_02.pdf; Jim Hull, “Better Late Than Never? Examining late high school graduates," Center for Public Education, 2009, accessed October 15, 2016, http://www.centerforpubliceducation.org/Main-Menu/Staffingstudents/Better-late-than-never-At-a-glance/Better-Late-than-Never-Examining-late-high-school-graduates-.html.21 Ibid; Western Interstate Commission for Higher Education, Knocking at the College Door Methodology Review.22 Of course, intrastate movements might occur even more frequently than cross-state movements, but these projections should be affected only by cross-state movements.23 Pew Research Center, “Modern Immigration Wave Brings 59 Million to U.S., Driving Population Growth and Change Through 2065: Views of Immigration’s Impact on U.S. Society Mixed,” Washington, D.C.: Pew Research Center, 2015. http://www.pewhispanic.org/2015/09/28/modern-immigration-wave-brings-59-million-to-u-s-driving-population-growth-and-change-through-2065/.24 Audrey Singer, “Contemporary Immigrant Gateways Revisited, 2014.” Washington, D.C.: Brookings Institute, 2014, accessed April 6, 2016, http://www.brookings.edu/research/papers/2015/12/01-metropolitan-immigrant-gateways-revisited-singer. 25 Ana Gonzalez-Barrera, “More Mexicans Leaving than Coming to the US.” Washington, D.C.: Pew Research Center, 2015, accessed April 6, 2015, http://www.pewhispanic.org/files/2015/11/2015-11-19_mexican-immigration__FINAL.pdf.26 U.S. Department of Homeland Security, “Deferred Action for Childhood Arrivals,” accessed October 11, 2016, https://www.dhs.gov/deferred-action-childhood-arrivals.
http://www.pewhispanic.org/2015/09/28/modern-immigration-wave-brings-59-million-to-u-s-driving-popul
http://www.pewhispanic.org/2015/09/28/modern-immigration-wave-brings-59-million-to-u-s-driving-popul
http://www.brookings.edu/research/papers/2015/12/01-metropolitan-immigrant-gateways-revisited-singer
http://www.brookings.edu/research/papers/2015/12/01-metropolitan-immigrant-gateways-revisited-singer

December 2016 141
AT THE COLLEGE DOORKNOCKING APPENDIX C. TECHNICAL INFORMATION AND METHODOLOGY
27 Jeanne Batalova, Sarah Hooker, and Randy Capps, with James D. Bachmeier, “DACA at the Two-Year Mark: A National and State Profile of Youth Eligible and Applying for Deferred Action.” Washington, D.C.: Migration Policy Institute, 2014, accessed October 18, 2016. http://www.migrationpolicy.org/research/daca-two-year-mark-national-and-state-profile-youth-eligible-and-applying-deferred-action#overlay-context=research/deferred-action-childhood-arrivals-one-year-mark-profile-currently-eligible-youth-and.28 Office of Refugee Resettlement, Unaccompanied Children Released to Sponsors by State. Washington, D.C.: Office of Refugee Resettlement, 2016, accessed April 6, 2016, http://www.acf.hhs.gov/programs/orr/programs/ucs/state-by-state-uc-placed-sponsors.29 California Department of Education, “California High School Exit Examination (CAHSEE),” accessed October 18. 2016, http://www.cde.ca.gov/ta/tg/hs/.30 Fermin Leal, “Uncertain Impact of California’s High School Exit Exam,” EdSource, August 30, 2015, accessed October 18, 2016, https://edsource.org/2015/uncertain-impact-of-californias-high-school-exit-exam/85387.31 See for example, Community College Research Center, Concurrent Courses Initiative, multiple reports, http://www.tc.columbia.edu/centers/concurrentcourses/ and National Alliance of Concurrent Enrollment Partnerships, Research on Dual and Concurrent Enrollment Student Outcomes, multiple reports, http://www.nacep.org/research-policy/research-studies/.32 For example, Zeke Perez, 50-State Comparison: Statewide Longitudinal Data Systems, Education Commission of the States, 2016, accessed October 18, 2016, http://www.ecs.org/state-longitudinal-data-systems/.33 Becky Vevea, “Admitting Dropouts Were Miscounted, Chicago Lowers Graduation Rates," National Public Radio, October 2, 2015, accessed October 17, 2016, http://www.npr.org/sections/ed/2015/10/02/445152363/admitting-dropouts-were-miscounted-chicago-lowers-graduation-rates.34 Brady Hamilton, Joyce Martin, Michelle Osterman, Sally Curtin and T.J. Matthews, National Vital Statistics Reports, Volume 64, Number 12, “Births: Final Data for 2014," U.S. Department of Health and Human Services, Centers for Disease Control and Prevention, National Center for Health Statistics, December 23, 2015, accessed November 2, 2016, from http://www.cdc.gov/nchs/data/nvsr/nvsr64/nvsr64_12.pdf; Joyce Martin, Brady Hamilton, Michelle Osterman, Sally Curtin and T.J. Mathews, National Vital Statistics Reports, Volume 64, Number 1, “Births: Final Data for 2013," U.S. Department of Health and Human Services, Centers for Disease Control and Prevention, National Center for Health Statistics, January 15, 2015, accessed November 2, 2016, http://www.cdc.gov/nchs/data/nvsr/nvsr64/nvsr64_01.pdf; Joyce Martin, Brady Hamilton, Michelle Osterman, Sally Curtin and T.J. Mathews, National Vital Statistics Reports, Volume 62, Number 9, “Births: Final Data for 2012," U.S. Department of Health and Human Services, Centers for Disease Control and Prevention, National Center for Health Statistics, December 30, 2013, accessed November 2, 2016, http://www.cdc.gov/nchs/data/nvsr/nvsr62/nvsr62_09.pdf.35 GED Testing Service, “2013 Annual Statistical Report on the GED Test: The Close of the 2002 Series GED Test,” accessed October 24, 2016, http://www.gedtestingservice.com/uploads/files/5b49fc887db0c075da20a68b17d313cd.pdf.36 HiSET Program, “2014 Annual Statistical Report on the HiSET Exam,” accessed October 24, 2016, http://hiset.ets.org/s/pdf/2014_annual_statistical_report.pdf.37 Stephen Brougham, Nancy Swaim, Randall Parmer, Allison Zotti, Allison, and Sarah Dial, Private School Universe Survey (PSS): Public-Use Data File User’s Manual for School Year 2011–12. Washington, D.C.: U.S. Department of Education National Center for Education Statistics, 2014, accessed October 13, 2016, https://nces.ed.gov/pubs2014/2014351.pdf.38 U.S. Department of Education, National Center for Education Statistics, “Percentage of Private Schools with 12th-graders, Number of Graduates, Graduation Rate, and Percentage of Graduates who Attended 4-Year Colleges, by Selected Characteristics: United States, 2010–11,” accessed October 15, 2016, https://nces.ed.gov/surveys/pss/tables1112.asp.39 Orville Disdier, April 19, 2016, correspondence with the author.

Projections of High School Graduates142
AT THE COLLEGE DOORKNOCKING
December 2016 143
AT THE COLLEGE DOORKNOCKING REFERENCES
REFERENCES
Abel, Jaison R. and Richard Dietz. “The Causes and Consequences of Puerto Rico’s Declining Population,” New York: Federal Reserve Bank of New York, 2014. Accessed on May 15, 2016, www.newyorkfed.org/medialibrary/media/research/current_issues/ci20-4.pdf.
Aud, Susan, William Hussar, Grace Kena, Kevin Bianco, Lauren Frohlich, Jana Kemp, and Kim Tahan. The Condition of Education 2011, NCES 2011-033. Washington, D.C.: U.S. Department of Education, National Center for Education Statistics, 2011. Accessed on November 26, 2012, http://nces.ed.gov/pubs2011/2011033.pdf.
Batalova, Jeanne, Sarah Hooker, and Randy Capps, with James D. Bachmeier. “DACA at the Two-Year Mark: A National and State Profile of Youth Eligible and Applying for Deferred Action.” Washington, D.C.: Migration Policy Institute, 2014. Accessed on October 18, 2016, http://www.migrationpolicy.org/research/daca-two-year-mark-national-and-state-profile-youth-eligible-and-applying-deferred-action#overlay-context=research/deferred-action-childhood-arrivals-one-year-mark-profile-currently-eligible-youth-and.
Brougham, Stephen, Nancy Swaim, Randall Parmer, Allison Zotti, Allison, and Sarah Dial. Private School Universe Survey (PSS): Public-Use Data File User’s Manual for School Year 2011–12. Washington, D.C.: U.S. Department of Education, National Center for Education Statistics, 2014. Accessed on 13 October 2016, https://nces.ed.gov/pubs2014/2014351.pdf
Brown, Ann and Renee Stepler. “Statistical Portrait of the Foreign-Born Population in the United States.” Washington, D.C.: Pew Research Center, April 19, 2016. Accessed on October 15, 2016, www.pewhispanic.org/2016/04/19/statistical-portrait-of-the-foreign-born-population-in-the-united-states-trends/.
California Department of Education. “California High School Exit Examination (CAHSEE).” Accessed on October 18. 2016, http://www.cde.ca.gov/ta/tg/hs/.
Carnevale, Anthony, Nicole Smith, and Jeff Strohl. “Recovery: Job Growth and Requirements through 2020.” Washington, D.C.: Georgetown Center on Education and the Workforce,” (June 2013). Accessed on October 27, 2016, https://cew.georgetown.edu/wp-content/uploads/2014/11/Recovery2020. FR_.Web_.pdf.
Center for Public Education. “School Choice: What the Research Says.” Alexandria, VA: National School Boards Association, 2015. Accessed on March 30, 2016, www.centerforpubliceducation.org/schoolchoice.
Chapman, Chris, Jennifer Laird, and Angelina KewalRamani. Trends in High School Dropout and Completion Rates in the United States: 1972–2008 (NCES 2011-012). Washington, D.C.: National Center for Education Statistics, Institute of Education Sciences, U.S. Department of Education, 2010. Accessed on March 31, 2012, http://nces.ed.gov/pubs2011/2011012.pdf.
Coelen, Stephen and Joseph B. Berger. New England 2020: A Forecast of Educational Attainment and Its Implications for the Workforce of New England States. Quincy, MA: Nellie Mae Foundation, 2006.
Cohn, D’Vera. “Millions of Americans Changed Their Racial or Ethnic Identity from one Census to the Next.” Washington, D.C.: Pew Research Center, May 5, 2014. Accessed on October 1, 2016, http://www.pewresearch.org/fact-tank/2014/05/05/millions-of-americans-changed-their-racial-or-ethnic-identity-from-one-census-to-the-next/.
Duncan, Brian and Stephen J. Trejo. “The Complexity of Immigrant Generations: Implications for Assessing the Socioeconomic Integration of Hispanics and Asians.” National Bureau of Economic Research, NBER Working Paper No. 21982 (February 2016). Accessed on October 17, 2016, http://www.nber.org/papers/w21982.
Ewert, Stephanie. “The Decline in Private School Enrollment.” SEHSD Working Paper Number FY12-117. Washington, D.C.: U.S. Census Bureau, 2013. Accessed October 15, 2016, https://www.census.gov/hhes/school/files/ewert_private_school_enrollment.pdf.
Gaither, Milton. “All the Available State Homeschooling Data, 2011” (February 6, 2012). Accessed on October 27, 2016, https://gaither.wordpress.com/2012/02/06/all-the-available-state-homeschooling-data-2011/.
GED Testing Service. “2013 Annual Statistical Report on the GED Test: The Close of the 2002 Series GED Test.” Accessed on October 24, 2016, http://www.gedtestingservice.com/uploads/files/5b49fc887db0c075da20a68b17d313cd.pdf.

Projections of High School Graduates144
AT THE COLLEGE DOORKNOCKING REFERENCES
Gonzalez-Barrera, Ana. “More Mexicans Leaving than Coming to the US.” Washington, D.C.: Pew Research Center, 2015. Accessed on April 6, 2015, http://www.pewhispanic.org/files/2015/11/2015-11-19_mexican-immigration__FINAL.pdf.
Grip, Richard S. “Projecting Enrollment in Rural Schools: A Study of Three Vermont School Districts.” Journal of Research in Rural Education 19, 3 (November 2004): 1-6.
Hamilton, Brady, Joyce Martin, Michelle Osterman, Sally Curtin and T.J. Matthews. National Vital Statistics Reports, Volume 64, Number 12, “Births: Final Data for 2014.” U.S. Department of Health and Human Services, Centers for Disease Control and Prevention, National Center for Health Statistics, December 23, 2015. Accessed November 2, 2016, http://www.cdc.gov/nchs/data/nvsr/nvsr64/nvsr64_12.pdf.
Hamilton, Brady, Joyce A. Martin, and Michelle J. K. Osterman. "Births: Preliminary Data for 2015." U.S. Department of Health and Human Services, Centers for Disease Control and Prevention, National Center for Health Statistics, June 2, 2016. Accessed on September 6, 2016, http://www.cdc.gov/nchs/data/nvsr/nvsr65/nvsr65_03.pdf.
HiSET Program. “2014 Annual Statistical Report on the HiSET Exam.” Accessed on 24 October 2016, http://hiset.ets.org/s/pdf/2014_annual_statistical_report.pdf.
Hull, Jim. “Better Late Than Never? Examining Late High School Graduates.” Center for Public Education, 2009. Accessed on October 15, 2016, http://www.centerforpubliceducation.org/Main-Menu/Staffingstudents/Better-late-than-never-At-a-glance/Better-Late-than-Never-Examining-late-high-school-graduates-.html.
Hussar, William J. Hussar and Tabitha M. Bailey. “Projections of Education Statistics to 2024: Forty-Third Edition.” Washington, D.C.: National Center for Education Statistics, April 2016. Accessed on October 27, 2016, http://nces.ed.gov/pubs2015/2015073.pdf.
Ingram, Deborah D., Jennifer D Parker, Nathaniel Schenker, James A. Weed, Brady Hamilton, Elizabeth Arias, and Jennifer H. Madans. United States Census 2000: Population with Bridged Race Categories. Washington, D.C.: National Center for Health Statistics, 2003. Accessed August 16, 2012, http://www.cdc.gov/nchs/data/series/sr_02/sr02_135.pdf.
Jordan, Miriam. “Mexican Immigration to U.S. Reverses.” Wall Street Journal, November 19, 2015. Accessed on October 15, 2016, www.wsj.com/articles/mexican-immigration-to-u-s-reverses-1447954334.
Kena, Grace, Lauren Musu-Gillette, Jennifer Robinson, Xiaolei Wang, Amy Rathbun, Jijun Zhang, Sidney Wilkinson-Flicker, Amy Barmer, Erin Dunlop Velez, Thomas Nachazel, Allison Dziuba, Wyatt Smith, Victoria Nelson, Virginia Robles-Villalba, William Soo, and DeLicia Ballard. “The Condition of Education 2015.” Washington, D.C.: National Center for Education Statistics, 2015. Accessed October 15, 2016, http://nces.ed.gov/pubs2015/2015144.pdf.
Krogstad, Jens Manual. “Historic Population Losses Continue Across Puerto Rico.” Washington D.C.: Pew Research Center, 2016. Accessed on May 15, 2016, http://www.pewresearch.org/fact-tank/2016/03/24/historic-population-losses-continue-across-puerto-rico/.
Leal, Fermin. “Uncertain Impact of California’s High School Exit Exam.” EdSource, August 30, 2015. Accessed on October 18, 2016, https://edsource.org/2015/uncertain-impact-of-californias-high-school-exit-exam/85387.
Livingston, Gretchen. “Is U.S. Fertility at an All-Time Low? It Depends.” Washington, D.C.: Pew Research Center, February 24, 2015. Accessed on October 6, 2016, www.pewresearch.org/fact-tank/2015/02/24/is-u-s-fertility-at-an-all-time-low-it-depends/.
Lumina Foundation. "A Stronger Nation 2016." Indianapolis: Lumina Foundation, 2016. Accessed on October 15, 2016, https://www.luminafoundation.org/stronger_nation2016.
Marcus, Jon. “The Demise of Private Schools.” The Atlantic, September 2, 2015. Accessed on October 31, 2016, https://www.theatlantic.com/education/archive/2015/09/parochial-schools-demise/403369/.
Martin, Joyce Brady Hamilton, Michelle Osterman, Sally Curtin and T.J. Mathews, National Vital Statistics Reports, Volume 64, Number 1, “Births: Final Data for 2013.” U.S. Department of Health and Human Services, Centers for Disease Control and Prevention, National Center for Health Statistics, January 15, 2015. Accessed on November 2, 2016, http://www.cdc.gov/nchs/data/nvsr/nvsr64/nvsr64_01.pdf.
http://www.pewresearch.org/fact-tank/2016/03/24/historic-population-losses-continue-across-puerto-ri
http://www.pewresearch.org/fact-tank/2016/03/24/historic-population-losses-continue-across-puerto-ri

December 2016 145
AT THE COLLEGE DOORKNOCKING REFERENCES
Martin, Joyce, Brady Hamilton, Michelle Osterman, Sally Curtin and T.J. Mathews. National Vital Statistics Reports, Volume 62, Number 9, “Births: Final Data for 2012.” U.S. Department of Health and Human Services, Centers for Disease Control and Prevention, National Center for Health Statistics, December 30, 2013. Accessed on November 2, 2016, http://www.cdc.gov/nchs/data/nvsr/nvsr62/nvsr62_09.pdf.
Miron, Gary, Charisse Gulosino and Brian Horvitz. “Virtual Schools in the U.S. 2014: Politics, Performance, Policy and Research Evidence.” Boulder, CO: National Education Policy Center, University of Colorado Boulder, 2014. Accessed on October 27, 2016, http://nepc.colorado.edu.
Musu-Gillette, Lauren, Jennifer Robinson, Joel McFarland, Angelina KewalRamani, Anlan Zhang, and Sidney Wilkinson-Flicker. “Status and Trends in the Education of Racial and Ethnic Groups 2016.” Washington, D.C.: U.S. Department of Education, National Center for Education Statistics, 2016. Accessed on October 27, 2016, http://nces.ed.gov.
National Alliance for Public Charter Schools. “A Growing Movement: America’s Largest Charter School Communities” (December 2014). Accessed on October 27, 2016, http://www.publiccharters.org/wp-content/uploads/2014/12/2014_Enrollment_Share_FINAL.pdf.
National Center for Education Statistics, Condition of Education. “Private School Enrollment" (May 2016). Accessed on October 2, 2016, http://nces.ed.gov/programs/coe/indicator_cgc.asp.
National Center for Education Statistics. “Digest of Education Statistics, Table 100-High School Graduates, By Sex and Control of School: Selected Years, 1869-70 through 2007-2008.” Accessed on October 7, 2016, https://nces.ed.gov/programs/digest/d07/tables/dt07_100.asp.
National Center for Education Statistics. “Homeschooling Fast Facts.” Accessed on October 31, 2016, https://nces.ed.gov/fastfacts/display.asp?id=91.
National Center for Education Statistics. “The Nation’s Report Card.” Accessed on October 27, 2016, http://nces.ed.gov/nationsreportcard/.
National Center for Education Statistics, Private School Survey Universe Data Tables. “Percentage Distribution of Students, By Racial/Ethnic Background, and Percentage Minority Students in Private Schools, By Selected Characteristics: United States.” Accessed on September 26, 2016, https://nces.ed.gov/surveys/pss/tableswhi.asp.
National Center for Education Statistics. “Public High School Graduation Rates” (May 2016). Accessed on October 27, 2016, http://nces.ed.gov/programs/coe/indicator_coi.asp.
Office of Refugee Resettlement. Unaccompanied Children Released to Sponsors by State. Washington, D.C.: Office of Refugee Resettlement, 2016. Accessed on April 6, 2016, http://www.acf.hhs.gov/programs/orr/programs/ucs/state-by-state-uc-placed-sponsors.
Passel, Jeffrey S. and D’Vera Cohn. “Overall Number of U.S. Unauthorized Immigrants Holds Steady Since 2009.” Washington, D.C.: Pew Research Center, September 20, 2016. Accessed October 26, 2016, http://www.pewhispanic.org/2016/09/20/overall-number-of-u-s-unauthorized-immigrants-holds-steady-since-2009/.
Perez, Zeke. 50-State Comparison: Statewide Longitudinal Data Systems. Education Commission of the States (2016). Accessed on October 18, 2016, http://www.ecs.org/state-longitudinal-data-systems/.
Pew Research Center. “Modern Immigration Wave Brings 59 Million to U.S., Driving Population Growth and Change Through 2065: Views of Immigration’s Impact on U.S. Society Mixed.” Washington, D.C.: Pew Research Center, September, 2015. Accessed on October 27, 2016, http://www.pewhispanic.org/2015/09/28/modern-immigration-wave-brings-59-million-to-u-s-driving-population-growth-and-change-through-2065/.
Population Reference Bureau. “World Population Data Sheet 2014: The Decline in U.S. Fertility” (December 2014). Accessed on October 6, 2016, http://www.prb.org/Publications/Datasheets/2014/2014-world-population-data-sheet/us-fertility-decline-factsheet.aspx.
Prescott, Brian T. and Peace Bransberger. Knocking at the College Door: Projections of High School Graduates, 8th Edition. Boulder, CO: Western Interstate Commission for Higher Education, 2012.
Sandefur, Gary D., Mary E. Campbell, and Jennifer Eggerling-Boeck. “Racial and Ethnic Identification, Official Classifications, and Health Disparities.” In Critical Perspectives on Racial and Ethnic Differences in Health in Late Life. Washington, D.C.: National Academies Press, 2004. Accessed on October 17 2016, https://www.ncbi.nlm.nih.gov/books/NBK25522/.
http://www.pewhispanic.org/2016/09/20/overall-number-of-u-s-unauthorized-immigrants-holds-steady-sin
http://www.pewhispanic.org/2016/09/20/overall-number-of-u-s-unauthorized-immigrants-holds-steady-sin
http://www.pewhispanic.org/2016/09/20/overall-number-of-u-s-unauthorized-immigrants-holds-steady-sin
http://www.pewhispanic.org/2015/09/28/modern-immigration-wave-brings-59-million-to-u-s-driving-popul
http://www.pewhispanic.org/2015/09/28/modern-immigration-wave-brings-59-million-to-u-s-driving-popul
http://www.pewhispanic.org/2015/09/28/modern-immigration-wave-brings-59-million-to-u-s-driving-popul

Projections of High School Graduates146
AT THE COLLEGE DOORKNOCKING REFERENCES
Shaw, Robert. “Enrollment Forecasting: What Works Best?” NASSP Bulletin 68, 468 (January 1984): 52-58.
Singer, Audrey. “Contemporary Immigrant Gateways Revisited, 2014.” Washington, D.C.: Brookings Institute, 2014. Accessed on April 6, 2016, http://www.brookings.edu/research/papers/2015/12/01-metropolitan-immigrant-gateways-revisited-singer.
Stillwell, Robert, Jennifer Sable, Christopher Plotts, and Amber Noel. “NCES Common Core of Data State Dropout and Completion Data File: School Year 2008-09.” U.S. Department of Education National Center for Education Statistics, 2011. Accessed on October 13, 2016, http://nces.ed.gov/ccd/pdf/INsdr08gen1a.pdf.
United States Department of Defense Education Activity (DoDEA). “Pacific Area Guam Schools Enrollment Data.” Accessed on October 15, 2016, http://www.dodea.edu/datacenter/enrollment_display.cfm.
United States Department of Education, National Center for Education Statistics. “Percentage of Private Schools with 12th-graders, Number of Graduates, Graduation Rate, and Percentage of Graduates who Attended 4-year Colleges, by Selected Characteristics: United States, 2010–11.” Accessed on 15 October 2016, https://nces.ed.gov/surveys/pss/tables1112.asp.
United States Department of Homeland Security. “Deferred Action for Childhood Arrivals.” Accessed on October 11, 2016, https://www.dhs.gov/deferred-action-childhood-arrivals.
United States Government Accountability Office. “K-12 Education: Better Use of Information Could Help Agencies Identify Disparities and Address Racial Concerns” (GAO-16-345, April 2016). Accessed on October 27, 2016, www.gao.gov/assets/680/676745.pdf.
Vevea, Becky. “Admitting Dropouts Were Miscounted, Chicago Lowers Graduation Rates.” National Public Radio, October 2, 2015. Accessed 17 October 2016, http://www.npr.org/sections/ed/2015/10/02/445152363/admitting-dropouts-were-miscounted-chicago-lowers-graduation-rates.
Western Interstate Commission for Higher Education. “Knocking at the College Door Methodology Review.” Boulder, CO: Western Interstate Commission for Higher Education, 2012. Accessed October 15, 2016, www.wiche.edu/pub/knocking-methodology-review.
Xu, Jiaquan, Sherry L. Murphy, Kenneth D. Kochanek, and Sherry L. Murphy. “Deaths: Final Data for 2013.” National Vital Statistics Reports 64, no. 2. Atlanta: Centers for Disease Control and Prevention, National Center for Health Statistics, Division of Vital Statistics, 2016. Accessed on November 2, 2016, http://www.cdc.gov/nchs/data/nvsr/nvsr64/nvsr64_02.pdf.
http://www.brookings.edu/research/papers/2015/12/01-metropolitan-immigrant-gateways-revisited-singer
http://www.brookings.edu/research/papers/2015/12/01-metropolitan-immigrant-gateways-revisited-singer

December 2016 147
Errata
ERRATA LIST
AT THE COLLEGE DOORKNOCKING
1. Chapter 1, p.7, Figure 1. Source note was Originally: Source: William J. Hussar and Tabitha M. Bailey. “Projections of Education Statistics to 2024: Forty-Third Edition.” Changed to: Source: William J. Hussar and Tabitha M. Bailey. “Projections of Education Statistics to 2024: Forty-Third Edition,” Table 9 (1979 to 2012). And, Western Interstate Commission for Higher Education, “Knocking at the College Door,” 2016 (2013 to 2032).
2. Chapter 3, p.20, Table 3.1.
Originally: Changed to:
3. Four instances that were Originally: “Native American/Alaska Native” were Corrected to: “American Indian/Alaska Native”: Chapter 2, page 17, Sidebar; Chapter 2, page 18, Endnote 4; and Chapter 4, page 42, Endnote 5.
4. Chapter 4, page 36, Figure 4.3, the column label under the sixth chart was Originally: “Two or More Races.” It was Corrected to: “Private Schools.”
5. Appendix A, Notes for pages 52 to 55, region data tables, Information was added: “See Figure 3.1. Regional Divisions of the U.S. on page 19 for the states covered by this region.
Projections of High School Graduates20
AT THE COLLEGE DOORKNOCKING CHAPTER 3. REGIONAL AND STATE VARIATION
projection period – an average of 1.25 million high school graduates per year.
Figure 3.3 shows each region’s contribution to the projected change in the number of graduates at several points in time, relative to the last year of reported high school graduate counts (2012-13).The West generated 25 percent of the nation’s high school graduates in the early 2000s. By 2009-10, high school graduates from the West represented about 29 percent of the total (813,400 graduates); that number is projected to be about 30 percent of the total throughout the projection period. The West is projected to reach its new high point in 2023-24 with about 860,000 high school graduates. It will remain the second-highest-producing region behind the South during the course of these projections, although it is expected to drop back slightly to 28 percent of the total (on average, about 785,000 graduates) by the
early 2030s.
Four of the 10 states that produce the greatest number of high school graduates are located in the South and West (see Table 3.1). In 2012-13, these four high-producing Southern and Western states generated about 1.05 million high school graduates (30 percent of the U.S. total); California alone produced 455,900 (13 percent of the total), Texas added another 9 percent (314,400 graduates), Florida another 5 percent (176,300 graduates) and Ohio another 4 percent (135,000 graduates). By 2025-26, Texas is projected to gain 2 percentage points in the share of the U.S. total, while California will drop a percentage point.
In 2025-26, Georgia (110,000 graduates) and Virginia (93,000) will round out the top five Southern states that generate the largest number of high school graduates in that region, while Washington (77,000 graduates), Arizona (72,000), Colorado (62,000) and Oregon (38,000) will join California as the top five states in the West.
Figure 3.4 on the following pages show these trends in more detail. Each state’s year-over-year change is shown, grouped by region and sorted by the state’s relative number of high school graduates. Years with fewer graduates than the previous year are shown as blue, years with about the same number of graduates
2019-20 2024-25 2029-30
250,000
200,000
150,000
100,000
50,000
0
-50,000
-100,000
-150,000
-200,000
-250,000
Figure 3.3. Change in High School Graduates from School Year 2012-13, by Region
South West Midwest Northeast
2019-20 2024-25 2029-30
South 32,200 117,900 7,100
West -11,500 24,900 -45,900
Midwest -41,200 -29,700 -92,700
Northeast -42,000 -26,200 -72,300
Table 3.1. Top 10 States that Produce a Majority of U.S. High School Graduates 2012-13 2025-26 CA 455,900 13% CA 431,000 12% TX 314,400 9% TX 374,700 11% NY 211,600 6% NY 214,500 6% FL 176,300 5% FL 193,000 5% IL 153,300 4% IL 142,600 4% OH 135,000 4% PA 139,700 4% PA 134,800 4% MI 97,500 3% MI 111,200 3% NJ 102,900 3% NJ 109,000 3% NC 110,100 3% NC 100,700 3% OH 374,700 3% TOTAL 55% TOTAL 54%
Table 3.1. Top 10 States that Produce a Majority of U.S. High School Graduates 2012-13 2025-26 CA 455,900 13% CA 431,000 12% TX 314,400 9% TX 374,700 11% NY 211,600 6% NY 214,500 6% FL 176,300 5% FL 193,000 5% IL 153,300 4% IL 142,600 4% PA 145,800 4% PA 139,700 4% OH 135,000 4% OH 118,700 3% MI 111,200 3% MI 97,500 3% NJ 109,000 3% NJ 102,900 3% NC 100,700 3% NC 110,100 3% TOTAL 55% TOTAL 54%

Western Interstate Commission for Higher Education3035 Center Green Drive, Suite 200Boulder, CO 80301-2205
www.wiche.edu/knocking #knocking2016
KNOCKINGAT THE COLLEGE DOOR