Kiribati: Development Performance &...
17
Kiribati: Development Performance & Challenges
Transcript of Kiribati: Development Performance &...
Kiribati: Development Performance & Challenges

Outline
Development performance Key policy reforms Development challenges

Development performance

Kiribati Growth Performance
Source: Kiribati National Statistics Office
Figure 1: Real growth & per capita Figure 2: GDP per capita vs South Pacific
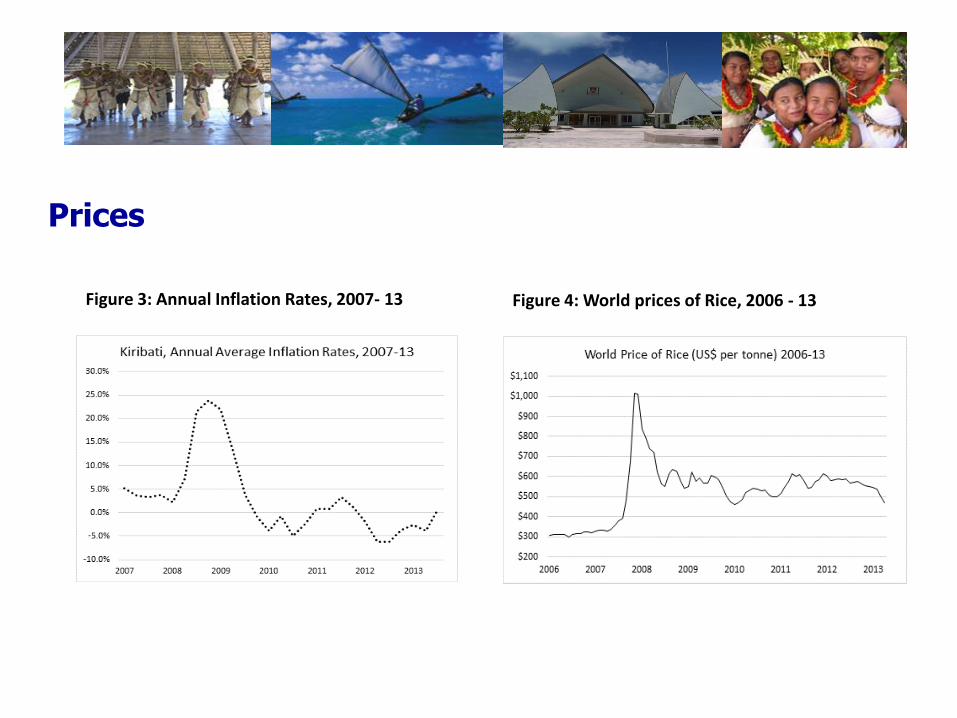
Prices
Figure 3: Annual Inflation Rates, 2007- 13 Figure 4: World prices of Rice, 2006 - 13
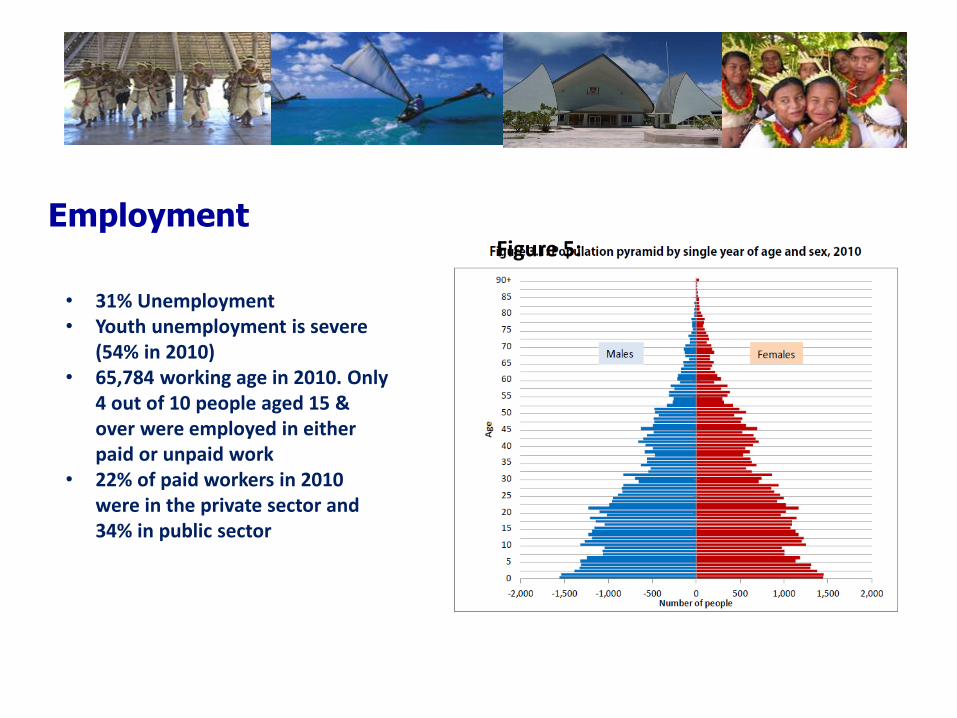
Employment
• 31% Unemployment • Youth unemployment is severe
(54% in 2010) • 65,784 working age in 2010. Only
4 out of 10 people aged 15 & over were employed in either paid or unpaid work
• 22% of paid workers in 2010 were in the private sector and 34% in public sector
Figure 5:

Trade
Figure 7: Seamen’s Remittances, 1999 to 2013
Source: SPMS
Figure 6:

Finance
0.00
100.00
200.00
300.00
400.00
500.00
600.00
700.00
197819801982198419861988199019921994199619982000200220042006200820102012
Figure 9: Sovereign Wealth Fund (RERF) value (A$m)
0
20000
40000
60000
80000
100000
120000
140000
160000
2005 2006 2007 2008 2009 2010 2011
Total recurrent revenue Total recurrent expenditures
Figure 8: Recurrent Revenue and Expenditures (A$m)
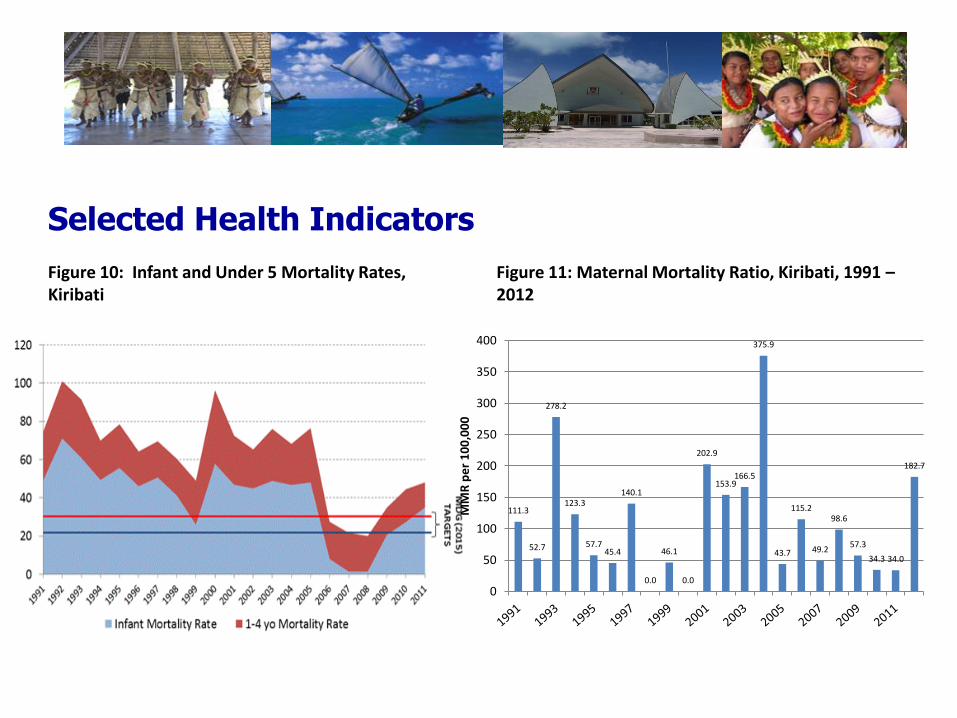
Selected Health Indicators
Figure 11: Maternal Mortality Ratio, Kiribati, 1991 – 2012
Figure 10: Infant and Under 5 Mortality Rates, Kiribati
111.3
52.7
278.2
123.3
57.7 45.4
140.1
0.0
46.1
0.0
202.9
153.9 166.5
375.9
43.7
115.2
49.2
98.6
57.3
34.3 34.0
182.7
0
50
100
150
200
250
300
350
400
MM
R p
er
10
0,0
00
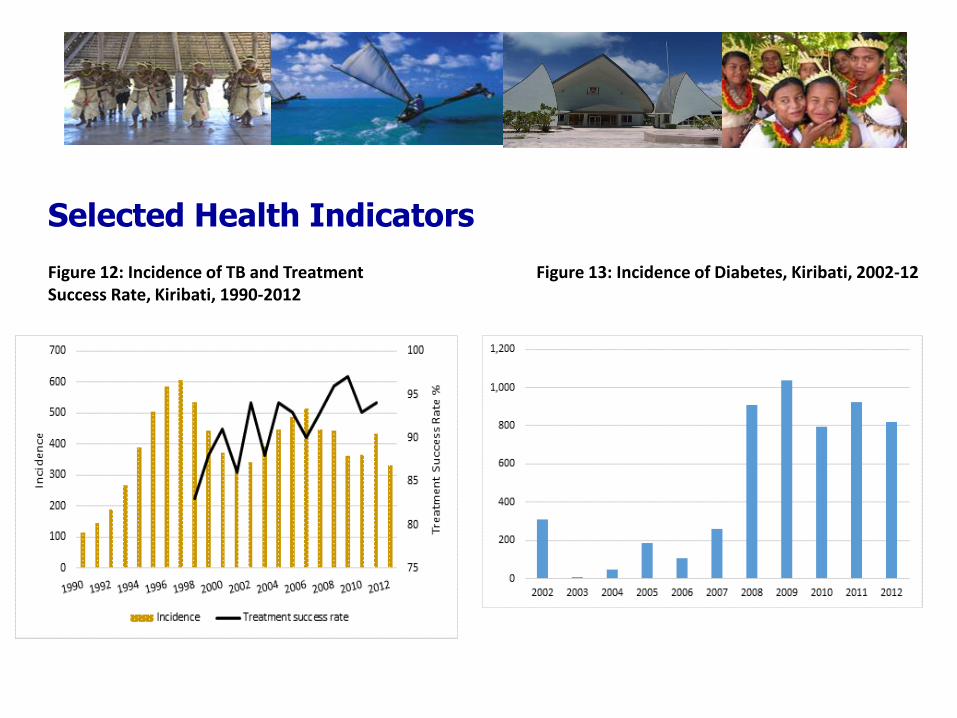
Selected Health Indicators
Figure 13: Incidence of Diabetes, Kiribati, 2002-12 Figure 12: Incidence of TB and Treatment Success Rate, Kiribati, 1990-2012

Selected Education Indicators
Figure 15: Proportion of female and male students starting year 1 and reaching year 5, Kiribati, 2006-12
Figure 14: Net enrolment rates for females and males, Primary School, Kiribati, 2006-12
Source: Ministry of Education
Key policy reforms

Policy reforms
• Expanding and diversifying the government revenue base • Implementing a new tax regime & modernising tax system • Improving public finance management system • Improving government fiscal position through SOE reform
program • Accelerating private sector development (including the
creation of conducive environment for public private partnerships in ecotourism, in country fish processing and sea-bed exploration/research)

Policy reforms (cont’d)
• Reviewing vocational training and tailoring courses to internal and external labour markets
• Improving livelihoods through effective implementation of subsidies – copra, seaweed
• Enhancing food security and sustainable livelihood through adequate support to the small scale artisanal fishermen and processing of value added fish products
• Adopting an Education Partners in Kiribati (EPiK) strategy to manage partner’s support for achievement of national goals for education

Major development challenges
Major development challenges
• Achieving sustainable growth and addressing the severe youth unemployment issue
• Achieving fiscal sustainability and improving efficacy of public institutions
• Addressing the high population growth rate and high population concentration in urban South Tarawa
• Short of achieving most of the MDG targets

Some thoughts in accelerating development performance !!
• Accelerate implementation of existing reform programs
• Redirecting investments toward productive sectors • Deepen engagement with all development stakeholders • Explore new ways of doing business for public institutions