KION GROUP AG Q1 2020 Update Call€¦ · Group figures Industrial Trucks & Services Supply Chain...
19
KION GROUP AG Q1 2020 Update Call Gordon Riske (CEO), Anke Groth (CFO) Frankfurt, 28 April 2020
Transcript of KION GROUP AG Q1 2020 Update Call€¦ · Group figures Industrial Trucks & Services Supply Chain...

KION GROUP AGQ1 2020 Update Call
Gordon Riske (CEO), Anke Groth (CFO) Frankfurt, 28 April 2020

Agenda
2 KION GROUP AG | Q1 2020 Update Call | 28 April 2020
1. Highlights
2. Market Update
3. Financial Update

KION started solidly into a year with ample challenges
Q1 2020 Financial Key Figures
KION GROUP AG | Q1 2020 Update Call | 28 April 20203
Order intake Revenue Adj. EBIT1 Free Cashflow
1. Adjusted for PPA items and non-recurring items
€2.1bn
-1.8% y-o-y
€2.0bn
-2.7% y-o-y
-€222m
-€304m y-o-y
€144m
-21.0% y-o-y
Margin of 7.1%
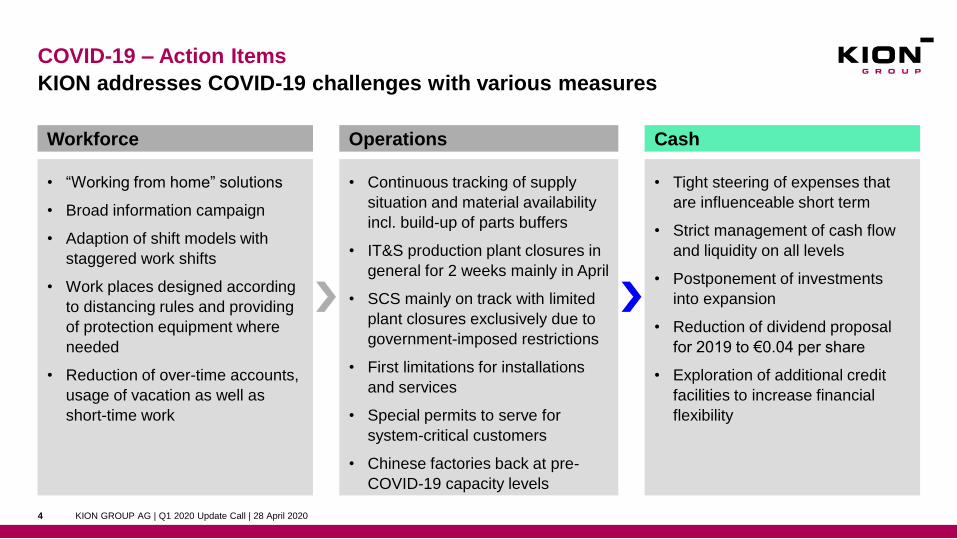
KION addresses COVID-19 challenges with various measures
COVID-19 – Action Items
KION GROUP AG | Q1 2020 Update Call | 28 April 20204
• “Working from home” solutions
• Broad information campaign
• Adaption of shift models with
staggered work shifts
• Work places designed according
to distancing rules and providing
of protection equipment where
needed
• Reduction of over-time accounts,
usage of vacation as well as
short-time work
CashWorkforce
• Tight steering of expenses that
are influenceable short term
• Strict management of cash flow
and liquidity on all levels
• Postponement of investments
into expansion
• Reduction of dividend proposal
for 2019 to €0.04 per share
• Exploration of additional credit
facilities to increase financial
flexibility
• Continuous tracking of supply
situation and material availability
incl. build-up of parts buffers
• IT&S production plant closures in
general for 2 weeks mainly in April
• SCS mainly on track with limited
plant closures exclusively due to
government-imposed restrictions
• First limitations for installations
and services
• Special permits to serve for
system-critical customers
• Chinese factories back at pre-
COVID-19 capacity levels
Operations

Only selected factories are closed
Current Status of Production Plants as of 28 April 2020
Title of presentation | first name last name | date5
Closed
SummervilleSalt Lake City
Monterrey
Indaiatuba
Holland
Pune
Xiamen
Jingjiang
Sozhou
Sydney
Châtellerault
Offenbach
Hamburg
Českŷ Krumlov
Luzzara
Zwijndrecht
Geisa
Reutlingen
Dinklage
Stříbro
Milan
Aschaffenburg
Weilbach
Open

Agenda
6 KION GROUP AG | Q1 2020 Update Call | 28 April 2020
1. Highlights
2. Market Update
3. Financial Update

Market significantly impacted by COVID-19 development
Industrial Truck Market
KION GROUP AG | Q1 2020 Update Call | 28 April 20207
Source: WITS/FEM
Order intake unit growth y-o-y (in %)
North America
Q2/19 Q3/19 Q4/19 Q1/20
-8.5% +0.8% -0.4% +3.6%
Western Europe
Q2/19 Q3/19 Q4/19 Q1/20
-10.4% -7.7% -4.1% -5.5%
South/Central America
Q2/19 Q3/19 Q4/19 Q1/20
-12.4% +4.1% +11.0% -8.5%
Eastern Europe
Q2/19 Q3/19 Q4/19 Q1/20
-6.7% -11.9% +0.5% -3.5%
China
Q2/19 Q3/19 Q4/19 Q1/20
-4.5% +4.2% +26.8% -21.1%
World
Q2/19 Q3/19 Q4/19 Q1/20
-7.6% -2.5% +5.1% -9.4%

Q1 2020
Market KION
Western Europe -5.5% -11.1%
Eastern Europe -3.5% -23.4%
China -21.1% -19.8%
North America +3.6% -23.4%
South/Central America -8.5% -22.2%
World346.2
-9.4%
45.9
-14.2%
KION not immune against COVID-19 effects especially in March
Industrial Truck Market
KION GROUP AG | Q1 2020 Update Call | 28 April 20208
Source: WITS/FEM
Industrial trucks: Market by region
Order intake FY 2019 (in ‘000 units)
Industrial trucks: Regional development
Eastern
Europe
6%
Western
Europe
27%
China
31%
South/
Central
America
3%
North
America
18%
Other 15%
Total: 1,509
Order intake (in ‘000 units) and growth y-o-y (in %)

Agenda
9 KION GROUP AG | Q1 2020 Update Call | 28 April 2020
1. Highlights
2. Market Update
3. Financial Update

Solid start into the year despite challenging environment
Q1 2020 Key Financials
KION GROUP AG | Q1 2020 Update Call | 28 April 202010
2,081
Q1 2019 Q1 2020
2,118
Q1 2019 Q1 2020
2,083 2,028
182 144
Q1 2020Q1 2019
93 68
Q1 2019 Q1 2020
8.8% 7.1%
-1.8% -2.7%
-21.0% -27.2%
Order intake Revenue Adj. EBIT and margin Net income
(in €m) (in €m) (in €m and %) (in €m)
Order book of €3.6bn
stable vs. year-end
FX effect of +€6m1
Moderate decrease mainly
driven by IT&S new
business
FX effect of +€6m1
Margin impacted by lower
volume, higher fixed costs
and strategic projects
FX effect of +2m1
Operating performance
1. Translation effects

Decreasing topline and product launches impact performance
Industrial Trucks & Services
KION GROUP AG | Q1 2020 Update Call | 28 April 202011
Key financials¹
Order intake
(in €m)
Revenue
(in €m)
Adj. EBIT and margin
(in €m and %)
1,510 1,394
1,509 1,442
149 97
Q1 2019 Q1 2020
9.9% 6.7%
Q1 2019 Q1 2020
Q1 2019 Q1 2020
-7.7%
-4.4%
-35.0%
1. Translation effects in Q1 2020: order intake: -€5m; revenue: -€4m; adjusted EBIT: €0m 2. In 2018 growth rate reflects 2017 restatements due to the initial application of IFRS 15 and IFRS 16
+7.0%
FY
2014
+1.7%-6.0%
FY
2013
6.4
+5.0%
+9.8%
+6.1%+7.1%
+5.2%+5.6%
FY
2015
+2.9%
+3.4%
FY
2016
+9.3%
5.9
4.7
FY
2017
+6.4%
FY
2018
+11.2%
FY
2019
5.24.5
5.05.6
IT&S new and service business2
(in €bn and change in % y-o-y)
1.4
-2.4%
Q1
2019
Q1
2020
1.5
-6.3%
New business Services

Notable order intake development and further margin improvement
Supply Chain Solutions
KION GROUP AG | Q1 2020 Update Call | 28 April 202012
Key financials¹
1. Translation effects in Q1 2020: order intake: +€11m; revenue: +€10m; adjusted EBIT: +€2m2. Eight quarter rolling average order intake (in €m)
Order intake
(in €m)
Revenue
(in €m)
Adj. EBIT and margin
(in €m and %)
603 686
569 581
48 59
Q1 2019 Q1 2020
8.5% 10.1%
Q1 2019 Q1 2020
Q1 2019 Q1 2020
+13.8%
+2.2%
+21.8%
Recent SCS order intake
396
874
598 556 603506
839 823686
Q1
2020
Q1
2018
Q3
2018
Q1
2019
Q3
2019
565 583 590 633 649 686
Q3
2019
Q1
2019
Q1
2018
Q3
2018
Q1
2020
Rolling average order intake2
(in €m)
(in €m)
+12.3%

(in €m)
Q1
2020
Q1
2019 Change
Adjusted EBITDA 351 379 -7.4%
D&A -207 -197
Adjusted EBIT 144 182 -21.0%
Non-recurring items (NRI) -2 -1
PPA items -22 -22
Reported EBIT 120 159 -24.3%
Net financial expenses -26 -25
EBT 94 134 -29.5%
Taxes -27 -41
Net income 68 93 -27.2%
Reported EPS €0.58 €0.79 -26.6%
EPS driven by weaker topline
Adjusted EBITDA to Net Income
KION GROUP AG | Q1 2020 Update Call | 28 April 202013
Explanations
Reduced taxes in the
reporting period due to
operating performance and
tax incentives
1

FCF impacted by strategic investments and NWC
Free Cash Flow Statement
KION GROUP AG | Q1 2020 Update Call | 28 April 202014
(in €m)
Q1
2020
Q1
2019
Reported EBITDA 349 378
Change in Net Working Capital (NWC) -122 -43
Taxes paid -47 -35
Pension payments -5 -5
Other -90 -18
Rental capex (net) -42 -49
Change in leased assets and lease receivables/
liabilities, non-cash deferral of leasing profits-105 -95
CF from operating activities -61 132
Operating capex -81 -56
Acquisitions -86 0
Other 6 6
CF from investing activities -162 -50
Free cash flow -222 82
Description
Q1 2019 with very low trade
payables due to phasing
effects
1
4 DAI acquisition
3 Operating capex increase
due to capacity expansions
2 Higher tax payments due
to higher earnings in 2019

Solid balance sheet
Net Debt
KION GROUP AG | Q1 2020 Update Call | 28 April 202015
(in €m)
31 Mar
2020
31 Dec
2019
Adjusted LTM EBITDA 1,630 1,658
Adjusted LTM industrial EBITDA1 1,294 1,324
Net financial debt 1,875 1,609
Liabilities from procurement leases 485 486
Liabilities from short-term rental financing2 578 616
Industrial net operating debt (INOD) 2,938 2,711
Net pension liabilities 1,063 1,212
Industrial net debt 4,001 3,923
Leverage on net financial debt 1.2x 1.0x
Leverage on industrial net operating debt 2.3x 2.0x
Leverage on industrial net debt 3.1x 3.0x
Description
Increase in net financial
debt to fund working
capital needs and DAI
acquisition.
Net pension liabilities
decreased due to higher
discount rates, driven by
higher risk premium for
corporate bonds
1
3
1. Excludes LTM EBITDA for long-term leasing 2. Includes liabilities from short-term rental financing and liabilities from financial services (rental)
Decrease in STR
liabilities in line with fleet
development
2
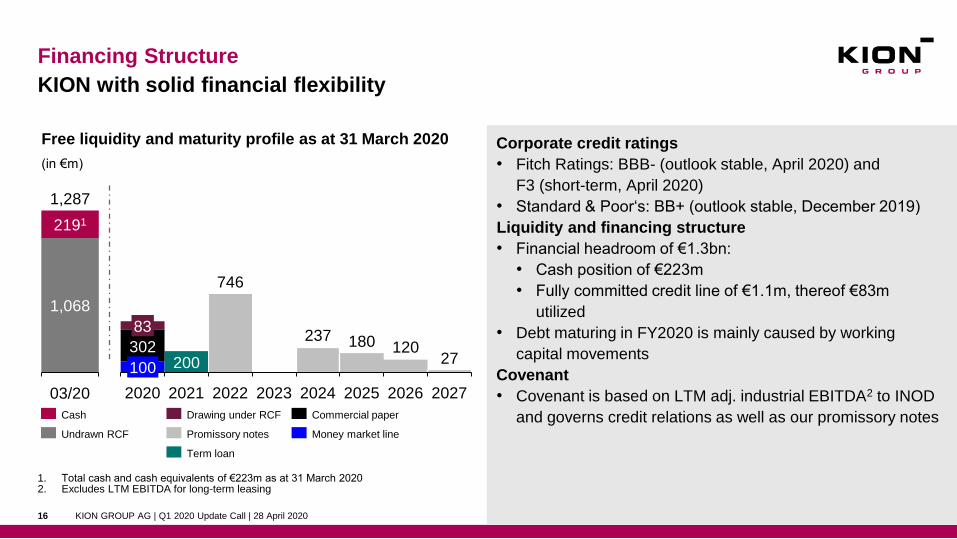
Corporate credit ratings
• Fitch Ratings: BBB- (outlook stable, April 2020) and
F3 (short-term, April 2020)
• Standard & Poor‘s: BB+ (outlook stable, December 2019)
Liquidity and financing structure
• Financial headroom of €1.3bn:
• Cash position of €223m
• Fully committed credit line of €1.1m, thereof €83m
utilized
• Debt maturing in FY2020 is mainly caused by working
capital movements
Covenant
• Covenant is based on LTM adj. industrial EBITDA2 to INOD
and governs credit relations as well as our promissory notes
KION with solid financial flexibility
Financing Structure
Free liquidity and maturity profile as at 31 March 2020
KION GROUP AG | Q1 2020 Update Call | 28 April 202016
(in €m)
1,287
2191
03/20
1,068
Cash
Undrawn RCF
200
746
237 180 12027
302
2020 2026
100
83
2021 2023 20242022 2025 2027
Drawing under RCF
Promissory notes
Term loan
Commercial paper
Money market line
1. Total cash and cash equivalents of €223m as at 31 March 2020 2. Excludes LTM EBITDA for long-term leasing

Financial Calendar
KION GROUP AG | Q1 2020 Update Call | 28 April 202017
Date Event
30 July 2020 Interim report for the period ended 30 June 2020 (Q2 2020) and analyst call
29 October 2020 Quarterly statement for the period ended 30 September 2020 (Q3 2020) and analyst call
Subject to change without notice

Key Financials
KION GROUP AG | Q1 2020 Update Call | 28 April 202018
Industrial Trucks & Services Supply Chain SolutionsGroup figures
(in €m)
Q1
2020
FY
2019
Q4
2019
Q3
2019
Q2
2019
Q1
2019
FY
2018
Order intake 2,081 9,112 2,577 2,338 2,079 2,118 8,657
Revenue 2,028 8,807 2,282 2,160 2,281 2,083 7,996
Adj. EBITDA1 351 1,657 433 420 425 379 1,555
Adj. EBITDA
margin in %1 17.3 18.8 19.0 19.4 18.6 18.2 19.4
Adj. EBIT1 144 851 226 217 225 182 790
Adj. EBIT
Margin in %1 7.1 9.7 9.9 10.1 9.9 8.8 9.9
Q1
2020
FY
2019
Q4
2019
Q3
2019
Q2
2019
Q1
2019
FY
2018
1,394 6,330 1,753 1,494 1,573 1,510 6,211
1,442 6,410 1,711 1,553 1,638 1,509 5,922
280 1,409 382 348 355 324 1,340
19.4 22.0 22.3 22.4 21.7 21.5 22.6
97 695 199 170 178 149 655
6.7 10.8 11.6 10.9 10.8 9.9 11.1
Q1
2020
FY
2019
Q4
2019
Q3
2019
Q2
2019
Q1
2019
FY
2018
686 2,771 823 839 506 603 2,425
581 2,379 567 601 642 569 2,055
74 289 68 80 78 62 232
12.7 12.1 12.0 13.4 12.2 10.9 11.3
59 228 52 64 64 48 180
10.1 9.6 9.2 10.7 9.9 8.5 8.8
1. Adjusted for PPA items and non-recurring items

© 2020 KION GROUP AG. All rights reserved
Disclaimer
KION GROUP AG | Q1 2020 Update Call | 28 April 202019
This document has been prepared by KION GROUP AG (the “Company”) solely for informational purposes. This disclaimer shall apply in all respects to the entire presentation (including all slides of this document), the oral presentation of the slides by representatives of the Company (or any person on behalf of the Company), any question-and-answer session that follows the oral presentation, hard copies of the slides as well as any additional materials distributed at, or in connection with this presentation (collectively, the “Presentation”). By attending the meeting (or conference call or video conference) at which the Presentation is made, or by reading the written materials included in the Presentation, you (i) acknowledge and agree to all of the following restrictions and undertakings, and (ii) acknowledge and confirm that you understand the legal and regulatory sanctions attached to the misuse, disclosure or improper circulation of the Presentation.
The Presentation is private and confidential and may not be reproduced, redistributed or disclosed in any way in whole or in part to any other person without the prior written consent of the Company.None of the Company, its affiliates or any of their respective directors, officers, employees, agents or any other person shall have any liability whatsoever (in negligence or otherwise) for any loss howsoever
arising from any use of the Presentation or its contents or otherwise arising in connection with the Presentation. The information and opinions contained in this Presentation do not purport to be comprehensive, are provided as at the date of the document and are subject to change without notice. The Company is not under any obligation to update or keep current the information contained in the Presentation.
The Presentation does not constitute or form part of, and should not be construed as, an offer to sell or issue, or the solicitation of an offer to purchase, subscribe to or acquire, securities of the Company, its affiliates or an inducement to enter into investment activity in the United States or any other country. No part of this Presentation, nor the fact of its distribution, should form the basis of, or be relied on by any person in connection with, any contract or commitment or investment decision whatsoever.
Certain industry, market and competitive position data contained in this Presentation, if any, come from official or third party sources. Third party industry publications, studies and surveys generally state that the data contained therein has been obtained from sources believed to be reliable, but that there is no guarantee of the accuracy or completeness of such data. While the Company believes that each of these publications, studies and surveys has been prepared by a reputable source, the Company has not independently verified the data contained therein, and the Company assumes no responsibility whatsoever in respect of the accuracy and completeness of any such data. In addition, certain industry, market and competitive position data contained in this Presentation come from the Company's own internal research and certain estimates are based on the knowledge and experience of the Company's management in the market in which the Company operates. While the Company believes that such research and estimates are reasonable and reliable, they, and their underlying methodology and assumptions, have not been verified by any independent source for accuracy or completeness and are subject to change without notice. The Company, therefore, also assumes no responsibility whatsoever in respect of the accuracy and completeness of any such research and estimates. Accordingly, no reliance should be placed on any of the industry, market or competitive position data contained in this Presentation.
Statements in the Presentation, including those regarding the possible or assumed future or other performance of the Company and its affiliates or its industry or other trend projections, constitute forward-looking statements. These statements reflect the Company’s current knowledge and expectations and projections about future events and may be identified by the context of such statements or words such as “anticipate”, “believe”, “expect”, “intend”, “project” and “target”. By their nature, forward-looking statements involve known and unknown risks, uncertainties, assumptions and other factors because they relate to events and depend on circumstances that will occur in the future whether or not outside the control of the Company. Such factors may cause actual results, performance or developments to differ materially from those expressed or implied by such forward-looking statements. Accordingly, no assurance is given that such forward-looking statements will prove to have been correct. They speak only as at the date of the Presentation and the Company undertakes no obligation to update these forward-looking statements.
IFRS financial information for any previous fiscal year figures is adjusted in the Presentation as necessary pursuant to changes to IFRS or other mandatory reclassifications. The addition of the totals presented may result in rounding differences. In addition to figures prepared in accordance with IFRS, the Presentation also includes certain non-GAAP financial performance measures (e.g., EBITDA, EBITDA margin, adjusted EBITDA, adjusted EBITDA margin, adjusted EBIT, adjusted net profit, free cash flow, gross debt, and net debt, order intake, order book and ROCE). These non-GAAP measures have been included because we believe that investors may find them helpful to measure our performance as reported under the relevant IFRS measures. However, these non-GAAP measures should be considered only in addition to, but not in isolation or as a substitute for, the information prepared in accordance with IFRS. Non-GAAP financial performance measures are not subject to IFRS or any other generally accepted accounting principles, and other companies that report similarly named non-GAAP measures may define or calculate these financial performance measures in different ways.