KING & SPALDING LLP ON BEHALF OF BEAR CREEK...
68
May 29, 2015 RPA Inc. T 55 University Ave. Suite 501 I Toronto, ON, Canada M5J 2H7 I + 1 (416) 947 0907 www.rpacan.com KING & SPALDING LLP ON BEHALF OF BEAR CREEK MINING CORPORATION TECHNICAL REVIEW OF THE SANTA ANA PROJECT AND CORANI PROJECT, PUNO, PERU Authors: Graham G. Clow, P.Eng. Ian Weir, P.Eng. C. Kathleen Altman, Ph.D., P.E. Ann Katharine Masun, M.Sc., P.Geo.
Transcript of KING & SPALDING LLP ON BEHALF OF BEAR CREEK...

May 29, 2015
RPA Inc. T55 University Ave. Suite 501 I Toronto, ON, Canada M5J 2H7 I + 1 (416) 947 0907 www.rpacan.com
KING & SPALDING LLP ON BEHALF OFBEAR CREEK MINING CORPORATION
TECHNICAL REVIEW OF THESANTA ANA PROJECT AND CORANIPROJECT, PUNO, PERU
Authors:Graham G. Clow, P.Eng.Ian Weir, P.Eng.C.Kathleen Altman, Ph.D., P.E.AnnKatharine Masun, M.Sc., P.Geo.

www.rpacan.com
Bear Creek Mining Corporation – Santa Ana Project, Project #2426 Technical Review – May 29, 2015
Page i
TABLE OF CONTENTS PAGE
1 INTRODUCTION AND SUMMARY ................................................................................... 1-1
2 DISCLAIMER ..................................................................................................................... 2-1
3 CONCLUSIONS AND RECOMMENDATIONS ................................................................. 3-1 Santa Ana Project ........................................................................................................... 3-1 Corani Project ................................................................................................................. 3-3
4 QUALIFICATIONS OF RPA .............................................................................................. 4-1
5 PROPERTY LOCATION, STATUS AND ACCESS ........................................................... 5-1
6 GEOLOGY AND MINERAL RESOURCES ....................................................................... 6-1
7 MINING AND MINERAL RESERVES ............................................................................... 7-1
8 MINERAL PROCESSING .................................................................................................. 8-1
9 ACCESSIBILITY, INFRASTRUCTURE, AND MANPOWER ............................................. 9-1
10 ENVIRONMENTAL AND SOCIAL CONSIDERATIONS ............................................... 10-1
11 CAPITAL COSTS .......................................................................................................... 11-1
12 OPERATING COSTS .................................................................................................... 12-1
13 PROJECT EXECUTION PLAN ..................................................................................... 13-1
14 EXTENDED LIFE CASE ................................................................................................ 14-1
15 PROJECT CASH FLOW ............................................................................................... 15-1
16 CORANI PROJECT ....................................................................................................... 16-1
17 SIGNATURE PAGE ....................................................................................................... 17-1
18 SOURCES OF INFORMATION ..................................................................................... 18-1 Santa Ana ..................................................................................................................... 18-1 Corani ........................................................................................................................... 18-2
19 APPENDIX A ................................................................................................................. 19-1
20 APPENDIX B ................................................................................................................. 20-1

www.rpacan.com
Bear Creek Mining Corporation – Santa Ana Project, Project #2426 Technical Review – May 29, 2015
Page ii
LIST OF TABLES PAGE
Table 3-1 RPA Revised Base Case and Other Adjustments .............................................. 3-3 Table 6-1 Mineral Resource Classification Parameters ..................................................... 6-7 Table 6-2 Santa Ana Mineral Resources (July 12, 2010 Exclusive of Reserves)............. 6-11 Table 6-3 Santa Ana Mineral Resources (July 12, 2010 Inclusive of Reserves) .............. 6-12 Table 7-1 Santa Ana Mineral Reserves (July 12, 2010) ..................................................... 7-1 Table 7-2 Mine Production Schedule – FSU Base Case .................................................... 7-3 Table 7-3 Mine Equipment List for Primary Mine Operations – FSU Base Case ............... 7-6 Table 7-4 Mine Equipment List for HeaP Leach Loading and Maintenance – FSU Base Case ..................................................................................................................................... 7-6 Table 7-5 RPA Revised COG ............................................................................................. 7-7 Table 7-6 RPA Revised Mineral Resources ....................................................................... 7-7 Table 7-7 RPA Revised Mineral Reserves ......................................................................... 7-8 Table 9-1 Manpower Requirements – FSU Base Case ..................................................... 9-3 Table 11-1 Capital Cost Summary – FSU Base Case ...................................................... 11-1 Table 12-1 Operating Costs – FSU Base Case ................................................................ 12-1 Table 13-1 Project Execution Plan – FSU Base Case ..................................................... 13-1 Table 14-1 Whittle Optimization Parameters – Extended Life Case ................................ 14-1 Table 14-2 RPA Extended Life Mineral Resources .......................................................... 14-3 Table 14-3 RPA Extended Life Mineral Potential ............................................................. 14-3 Table 14-4 Operating Costs – Extended Life Case .......................................................... 14-4 Table 14-5 Capital Cost Differences Between RPA Revised Base Case and Extended Life Case ................................................................................................................................... 14-4 Table 16-1 Project Cash Flow Parameters Summary ...................................................... 15-1 Table 17-1 Corani Mineral Resources (May 2015, Exclusive of Reserves) ..................... 16-4 Table 17-2 Corani Mineral Reserves (May 2015) ............................................................. 16-5 Table 17-3 Capital Cost Summary ................................................................................... 16-8 Table 17-4 Operating Costs – FSU Base Case ................................................................ 16-8 Table 17-5 Project Cash Flow Parameters Summary ...................................................... 16-9
LIST OF FIGURES PAGE
Figure 5-1 Property Location Map ...................................................................................... 5-2 Figure 6-1 3D Isometric View of Block Model Zones .......................................................... 6-4 Figure 6-2 3D Isometric View of Block Silver Grades ......................................................... 6-8 Figure 6-3 3D Isometric View of Block Model Classification .............................................. 6-9 Figure 6-4 Isolated Blocks Shown on Section 466,200E .................................................. 6-10 Figure 7-1 Dilution and Ore Losses on a Typical Mining Bench ......................................... 7-2 Figure 7-2 Final Pit Design ................................................................................................. 7-5 Figure 8-1 Column Test Recovery Vs. Time ...................................................................... 8-2 Figure 14-1 Comparison of Extended Life Case versus FSU Pit Design ......................... 14-2

www.rpacan.com
Bear Creek Mining Corporation – Santa Ana Project, Project #2426 Technical Review – May 29, 2015
Page 1-1
1 INTRODUCTION AND SUMMARY RPA Inc. (RPA) was retained by King & Spalding LLP (K&S) on behalf of Bear Creek Mining
Corporation (BCM) for the completion of a technical review of BCM’s Santa Ana Silver Project
(the Project), located in Peru. The review also included a technical review of BCM’s Corani
Project (Corani), also located in Peru.
On June 25, 2011, the Peruvian government issued Supreme Decree DS-032-2011, which
rescinded BCM’s rights to operate on the Santa Ana Project concessions. This resulted in a
complete stoppage of activities. On August 12, 2014, BCM announced that it had commenced
arbitration proceedings against the government of Peru, pursuant to Article 824 of the Free
Trade Agreement between Canada and Peru.
This report summarizes the results of RPA’s technical review. RPA understands that the
review will be used by K&S and its damages consultant, FTI Consulting Inc. (FTI), to prepare
a damages report in connection with the arbitration proceedings.
SANTA ANA PROJECT The Project is located 120 km southeast of the city of Puno, Peru at an elevation of 4,150 masl
to 4,300 masl. Prior to being nationalized by the Peruvian government, BCM held clear title to
5,400 ha of mineral claims that encompass the Project.
A Feasibility Study (FS) was completed by Ausenco Vector, Independent Mining Consultants
(IMC), and Resource Development Inc. (RDi) and disclosed in a NI 43-101 Technical Report
dated October 21, 2010. An updated Feasibility Study (FSU) was completed by the same
consultants and disclosed in a NI 43-101 Technical Report dated April 1, 2011. MTB Project
Management Professionals, Inc. (MTB) completed the financial analysis for the Santa Ana
Project using capital and operating cost estimates provided by other members of the FSU
team. The detailed process design for the Project was completed by Heap Leach Consulting
S.A.C. of Lima, Peru. RDi was responsible for review and interpretation of the process test
results, development of the flow sheet, development of the process design criteria, and
estimation of the quantity of the consumable items in the process plant, as well as signing off
as the Qualified Person for the Technical Reports.

www.rpacan.com
Bear Creek Mining Corporation – Santa Ana Project, Project #2426 Technical Review – May 29, 2015
Page 1-2
The FSU was based on open pit mining and heap leach processing with a mine life of 11 years,
producing a total of 47.4 million ounces of silver. The processing operation includes three
crushing stages and two classification stages, heap leaching, and recovery by Merrill-Crowe
zinc precipitation.
Preproduction capital was estimated to be $71.6 million and sustaining capital was estimated
to average $1.4 million per year over the 11 year life of the mine.
CORANI PROJECT RPA was requested to prepare a high level technical review of the information used as a basis
for the Corani Project Feasibility Study (Corani FS), which is scheduled to be published June
2015. The Corani FS is being developed by M3 Engineering & Technology Corporation (M3)
with the assistance of Global Resource Engineering (GRE).
Corani is 100% owned by BCM. The Project will comprise an open pit mine producing 7.8
million tonnes of silver/lead/zinc ore over 18 years. A conventional flotation plant will produce
lead and zinc concentrates containing silver. The primary revenue mineral is silver.
Preproduction capital is estimated to be $628.1 million and sustaining capital is estimated to
average $4 million per year over the 18 year life of the mine.
RPA TEAM RPA’s team for the study included:
• Graham Clow, P.Eng., Chairman, Principal Mining Engineer • Katharine Masun, P.Geo., Senior Geologist • Ian Weir, P.Eng., Senior Mining Engineer • Kathleen Altman, Ph.D., P.E., Director of Metallurgy and Mineral Processing, Principal
Metallurgist
No site visit was conducted as part of this review. References are shown in Section 18.

www.rpacan.com
Bear Creek Mining Corporation – Santa Ana Project, Project #2426 Technical Review – May 29, 2015
Page 2-1
2 DISCLAIMER This report has been prepared by RPA at the request of K&S and FTI, on behalf of BCM, solely
for use in the Arbitration. Conditions and limitations of use apply to this report. This report
shall not be used nor relied upon by any other party, nor for any other purpose, without the
written consent of RPA. RPA accepts no responsibility for damages, if any, suffered by any
third party as a result of decisions made or actions based on this report.
The information, conclusions, opinions, and estimates contained herein are based on:
a. information available to RPA at the time of preparation of this report,
b. assumptions, conditions, and qualifications as set forth in this report, and
c. data, reports, and opinions supplied to BCM and other third party sources.
While it is believed that the information contained herein is reliable under the conditions and
subject to the limitations set forth herein, this report is based in part on information not within
the control of RPA and RPA does not guarantee the validity or accuracy of conclusions or
recommendations based upon that information.
The report is intended to be read as a whole, including the Introduction and Summary and
Appendices, and sections should not be read or relied upon out of context. The information
contained in this report may not be modified or reproduced in any form, electronic or otherwise,
except for the use in the Arbitration unless the RPA’s express permission has been obtained.

www.rpacan.com
Bear Creek Mining Corporation – Santa Ana Project, Project #2426 Technical Review – May 29, 2015
Page 2-2
LIST OF ABBREVIATIONS Units of measurement used in this report conform to the metric system. All currency in this
report is US dollars (US$) unless otherwise noted.
% per cent $/ha dollar per hectare C$ Canadian dollars cm centimetre cm2 square centimetre g gram g/ cm3 grams per cubic centimetre g/t gram per tonne ha hectare kg kilogram km kilometre lb pound m metre masl metres above sea level Mlb million pounds Moz million ounces Mt million tonnes oz Troy ounce (31.1035g) oz/t, oz/ton ounce per short ton ppm part per million t metric tonne t/m3 tonnes per cubic metre US$ United States dollar

www.rpacan.com
Bear Creek Mining Corporation – Santa Ana Project, Project #2426 Technical Review – May 29, 2015
Page 3-1
3 CONCLUSIONS AND RECOMMENDATIONS SANTA ANA PROJECT Based on a review of the available documentation, RPA considers the FSU to be a reasonable
representation of the Project as planned, with some modifications as described below. RPA
is of the opinion that an appropriate economic analysis of the Project can be made using the
FSU and available data.
In addition, RPA offers the following conclusions on the Santa Ana Project:
GEOLOGY AND MINERAL RESOURCES • In RPA’s opinion, the Mineral Resources have been estimated according to industry
standards and are compliant with reporting requirements under NI43-101.
• Measured and Indicated Resources underlying the Mineral Reserves were evaluated at a revised cut-off grade of 17.5 g/t Ag to reflect a revised Ag price of $16.50 versus $13.00.
MINING AND MINERAL RESERVES • In RPA’s opinion, the design of the open pits and the production schedule are
reasonable.
• An equipment list was provided by IMC to estimate the size of fleet required to generate a basis for operating and capital costs.
• No dilution and extraction factors were incorporated in the Mineral Reserve estimate.
RPA recommends the use of 5% and 95% for dilution and mining extraction factors respectively.
• The mine design appears to be slightly conservative. Based on geotechnical work
carried out to date, there exists the possibility of increasing the overall slope angles in some sections of the pit.
METALLURGICAL TESTWORK AND MINERAL PROCESSING • Based on a review of the metallurgical test program and results, RPA is in agreement
with the metal recoveries assumed for leaching of the different ore zones.

www.rpacan.com
Bear Creek Mining Corporation – Santa Ana Project, Project #2426 Technical Review – May 29, 2015
Page 3-2
INFRASTRUCTURE • Santa Ana is well positioned to connect with existing infrastructure in the area.
ENVIRONMENTAL AND SOCIAL ASPECTS • RPA’s review of available data suggests that BCM was in compliance and intended to
comply with the Peruvian permitting process and to demonstrate corporate social responsibility.
CAPITAL COSTS • Capital costs estimates were generally carried out to a satisfactory level for the process
design and overall site infrastructure, although the costs include factored estimates for the indirect costs, which is not optimal, but not uncommon.
• The direct capital costs for process and infrastructure are approximately $42.7 million
which is the same order of magnitude as the 2011 InfoMine Cost Model (InfoMine) for a 10,000 tpd heap leach operation, which is $40 million.
• Since the capital costs appear reasonable, no changes were made.
• In RPA’s opinion the contingency level for Owner’s costs should be increase from 10%
to 30%.
OPERATING COSTS • RPA has reviewed the operating costs in the financial model 0911 - Santa Ana
Financial Model 12OCT10 Rev 2 - finer crush - Herbs Rec. Mining cost data were not provided in detail.
• For the revised FSU case, RPA has adjusted contractor mining costs upwards by 25%
from $1.68 per tonne moved to $2.10 per tonne moved. The re-handle cost of crushed material to the leach pad of $0.71 per tonne moved appears reasonable. There are some additional costs for items such as dewatering and geotechnical monitoring that are not accounted for in the FSU operating cost estimate but will be covered under the adjusted mining cost.
• Processing costs are supported by an appropriate level of detail and appear
reasonable.
• G&A estimates do not contain detailed supporting information to be able to confirm their level of accuracy. In RPA’s opinion, the contingency should be adjusted from 5% to 30% to reflect the level of uncertainty in the estimate.
Table 3-1 shows RPA’s recommended changes to the BCM FSU Base Case for economic
evaluation.

www.rpacan.com
Bear Creek Mining Corporation – Santa Ana Project, Project #2426 Technical Review – May 29, 2015
Page 3-3
TABLE 3-1 RPA REVISED BASE CASE AND OTHER ADJUSTMENTS Bear Creek Mining Corporation – Santa Ana Project
Description
RPA Revised
Base Case BCM Base
Case Comments Mineral Reserve 45.9 Mt
44.9 g/t Ag
37.1 Mt 53.0 g/t Ag
Measured and Indicated Resources underlying the Mineral Reserves were evaluated at a revised cut-off grade of 17.5 g/t Ag to reflect a revised Ag price of $16.50 versus $13.00.
Dilution 5% 0% Global dilution factor of 5% added to account for inevitable mixing of ore with waste.
Extraction 95% 100% Global mining extraction factor of 95% added to account for ore lenses that are too small to separate from waste.
Mining costs increased $2.10/t moved
$1.68/t moved
For a contract mining operation at the proposed production rate, RPA expects mine operating costs should be in the range of $2.00/t moved to $2.50/t moved for Santa Ana.
Owner’s capital costs $5.1 M $4.2 M Change contingency from 10% to 30%
G&A $5.2 M/year $4.2 M/year Change contingency from 5% to 30%
RPA has prepared three production schedules and associated cash flows, both based on the
revisions shown in Table 3-1. The RPA Revised Base Case is based on Mineral Reserves.
The Extended Life Case is based on Mineral Reserves plus a portion of Mineral Resources
including Inferred material.
CORANI PROJECT Based on the high level technical review of the available documentation RPA considers the
Corani FS to be a reasonable representation of the Project as planned. RPA is of the opinion
that an appropriate economic analysis of the Project can be made using the cash flow model
along with available data provided. RPA is of the opinion that the Corani FS work was carried
out in a thorough and diligent manner.

www.rpacan.com
Bear Creek Mining Corporation – Santa Ana Project, Project #2426 Technical Review – May 29, 2015
Page 4-1
4 QUALIFICATIONS OF RPA RPA is a group of technical professionals who have provided advice to the mining industry for
nearly 30 years. During this time, RPA has grown into a highly respected organization
regarded as the specialty firm of choice for resource and reserve work. RPA provides services
to the mining industry at all stages of project development from exploration and resource
evaluation through scoping, prefeasibility and feasibility studies, financing, permitting,
construction, operation, closure and rehabilitation. Our portfolio of customers includes clients
in banking (both debt and equity), institutional investors, government, major mining companies,
exploration and development firms, law firms, individual investors, and private equity ventures.
RPA offices are located in Canada, the United States, and the United Kingdom. Our
professionals work globally, visiting mines and projects on six continents. Our home office is
located in Toronto, Ontario, and the company is 100% owned by its employees.
Our mission is to apply our broad and deep experience to provide objective, independent
advice. Our vision is to enable mining industry operators and investors to make the right
decisions for business success. Clients return to RPA repeatedly because of the accurate,
credible technical reports and advice we deliver, reports that are accepted and relied on time
and time again, among financial institutions and major regulatory bodies worldwide.
RPA has carried out independent valuations of more than a thousand mineral exploration
properties across Canada and in other countries, usually in conjunction with financial
transactions involving mining companies in general, but also in connection with litigations or
arbitrations where the market value of the mining property is at issue.
RPA monitors the exploration and mining markets and maintains an extensive database of
mineral property transactions worldwide.

www.rpacan.com
Bear Creek Mining Corporation – Santa Ana Project, Project #2426 Technical Review – May 29, 2015
Page 5-1
5 PROPERTY LOCATION, STATUS AND ACCESS The Santa Ana property (Figure 5-1) covers an area of 5,400 ha to the south of the village of
Huacullani. The approximate UTM grid coordinates for the centre of the main portion of the
property are 8,158,000 m North and 466,000 m East using the Provisional South American
Datum (PSAD) 1956, Zone 19.
The property consists of six claims: Karina 9-A, Karina 1, Karina 2, Karina 5, Karina 6, and
Karina 7. BCM has executed its option to acquire a 100% interest in the six mineral claims
which comprises 5,400 ha. BCM completed the acquisition process of the mineral rights in
late 2007 and at the time of expropriation, BCM held clear title to the claims.

70° 69°
17S
17°
MinesDept. capitalProv. capitalDistr. capitalCommunitySheet # 100,000Prov. nameProv. cap. nameDept. cap. nameProv. limitDept. limit
Legend:
19S
PSAD56/UTM 19S
72°18S
78°
0 5 25
Kilometres
10 15 20
May 2015 Source: VDG del Peru S.A.G., 2005.
Location Map
Santa Ana Silver Project
Bear Creek Mining Corporation
Department of Puno, Peru
Figure 5-1
5-2
ww
w.rp
acan
.co
m

www.rpacan.com
Bear Creek Mining Corporation – Santa Ana Project, Project #2426 Technical Review – May 29, 2015
Page 6-1
6 GEOLOGY AND MINERAL RESOURCES RPA completed an examination of the Santa Ana Mineral Resource estimate as reported in
the FSU.
The review included:
• Drill hole database verification using tools within GEMS and additional verification in Excel.
• Review of the drill hole collar elevations with respect to topography surfaces.
• Preliminary silver grade capping analysis.
• Assay, composite, and block model statistics review and comparison.
• A check of local silver grade bias using trend plots of the assays, composites, and block model grades.
• Review of silver variography to ensure that grade interpolation parameters are reasonable.
• Checks for significant unnatural banding and smearing in the block model.
• A visual examination of the values of the block model on section and a comparison to assay and composite grades.
• A check for local silver grade bias using trend plots of the assays, composites, and block model grades.
• Block model tonnage and grade verification in GEMS.
• Exporting block models to Excel for further tonnage and grade confirmation.
• An assessment of the Mineral Resource classification criteria.
GEOLOGY AND MINERALIZATION The Santa Ana deposit occupies a broad volcanic upland that lies between extensive
exposures of thin-bedded grey lithic sandstones and red beds of the Puno group (Cretaceous
to Lower Tertiary) that underlie both Huacullani and the region to the south of the deposit. The
central and western portion of the upland is occupied by a sequence of fine-grained andesite
flows and autobreccias that possibly belong to the Tertiary Tacaza group, strike generally north
or northeast, and dip to the west at angles ranging from 15° to 60°. To the west, these Tertiary
flows are capped by coarse-grained dacitic porphyry that, in turn, is overlain unconformably by
a thick sequence of Miocene-Pliocene dacitic volcanoclastic rocks. The andesite flows,
autobreccias, and dacitic porphyry host the mineralization.

www.rpacan.com
Bear Creek Mining Corporation – Santa Ana Project, Project #2426 Technical Review – May 29, 2015
Page 6-2
Earlier descriptions of the mineralization defined a northern Anomaly A and a southerly
Anomaly B. Drilling has since connected these zones so that they represent major structural
orientations that contain continuous mineralization.
The mineralized host rock is described as primarily volcanic andesites with minor dykes and
intrusive. Potassium feldspars are the predominant gangue mineral, followed by illite and
chlorite. The quartz content is low (less than ten percent), and the carbonate content is less
than five percent. The majority of mineralization is within two major structural trends and
hosted within the andesite unit. Both vein and disseminated mineralization occur within these
trends. The northern two-thirds of the deposit has a strong north-south trend, and the southern
third of the deposit is generally oriented northeasterly. A flexure in the structure, bending to
the west, is thought to be responsible for this prominent bend. The mineralization is generally
vertical.
Higher grade zones (>200 g/t Ag) within the deposit are associated with veins, vein swarms,
breccias, and open space fillings. These zones are ubiquitous, but are not spatially
continuous.
RESOURCE DATABASE The current Santa Ana Mineral Resource estimate is based on an updated resource estimation
by IMC in 2010.
The resource database includes collar locations, down hole survey data, assay, and composite
data from 349 drill holes and 60,144 m of drilling. The resource database includes data
available as of June 2010.
A total of 28,696 Ag assay samples and 12,205 composite samples were included in the
database. Each of the sampled intervals was also assayed for Cu, Pd, and Zn. Cu, Pd, and
Zn were modelled, however, the heap leach process applied for metal recovery at Santa Ana
only recovers Ag.
The resource database was checked by IMC for errors, including a comparison of the June
2010 database against the previously provided 2009 data. As part of the incremental data
validation, IMC checked drill hole collar elevation versus topographic information. The primary

www.rpacan.com
Bear Creek Mining Corporation – Santa Ana Project, Project #2426 Technical Review – May 29, 2015
Page 6-3
focus in the 2010 resource update was verification of silver, and IMC completed spot checks
of certificates of assays versus assay information recorded in the database, and a review of
the QA/QC data.
RPA received the Santa Ana drill hole database from IMC as a series of CSV files, a block
model as a CSV file, and DXF line data for the topographic digital terrain model (DTM),
resource floating cone pit shell, and the reserve pit shell. Only model blocks below the
topography surface were included in the CSV file. IMC also provided RPA with simple statistics
for Ag, which included the grade range and mean grade of the assays, composites, and
mineralized blocks.
RPA imported the drill hole database, block model, and DXF files in Dassault Systèmes
GEOVIA GEMS Version 6.7 (GEMS). Surfaces were created from the DXF lines. RPA
validated the resource database with tools within GEMS, and carried out additional verification
in MS Excel.
RPA reviewed the collar elevations with respect to topography surfaces and found that more
than 25% of the drill collars deviated more than three metres from the surveyed topography
surface (either above or below). It is RPA’s opinion that this would not result in a material
impact to the resource estimate.
GEOLOGICAL MODEL IMC created a simple rock type model in which four estimation zones were coded directly into
the block model (Figure 6-1). No wireframe solids were used. The zones account for both the
lithology and grade estimation domains.
The mineralized andesite was separated in two zones based on the predominant
mineralization direction, which were coded as Zone 1 and Zone 2 in the block model (Figure
6-1). Zone 1 has a north-south orientation to the mineralization, and Zone 2 is north 40° east.
Post-mineralization volcanics overlie the mineralized andesites on the western edge of the
deposit (Zone 3), and a sedimentary unit was added to the block model as Zone 4 (Figure 6-
1). Zones 3 and 4 are barren and no grades were assigned to these blocks in the model.

Zone 2
Zone 1
Zone 3
Zone 4
Looking Northeast
0 100 500
Metres
200 300 400
May 2015
Santa Ana Silver Project
3D Isometric View ofBlock Model Zones
Bear Creek Mining Corporation
Department of Puno, Peru
Figure 6-1
6-4
ww
w.rp
acan
.co
m

www.rpacan.com
Bear Creek Mining Corporation – Santa Ana Project, Project #2426 Technical Review – May 29, 2015
Page 6-5
IMC reviewed the statistics of the assay from the mineralized zones and concluded that
capping Ag to 1,000 g/t was required to limit the influence of high grade outliers on the block
grade distribution. At 1,000 g/t Ag, 21 samples were capped (<0.1%), resulting in a 3% metal
loss. Critically, however, more than 20% of the metal content remained within the 99th
percentile of the sample population. RPA completed a preliminary capping analysis on the Ag
assays using decile analysis and cumulative frequency plots, and investigated the impact of a
lower Ag capping grade. It is RPA’s opinion that the Ag grade-capping factor, together with
high grade interpolation restrictions used by IMC, is acceptable.
Assays were composited by IMC to five metre lengths starting from the collar of each drill hole.
Any composite that was less than 2.5 m was discarded. A total of 11,142 composite samples
occur within Zones 1 and 2. These composite values were used to interpolate grade into the
resource blocks.
RPA compiled, reviewed, and confirmed IMC’s simple statistics for the resource Ag assays
and composites, capped and raw.
BLOCK MODEL A 3D block model comprising blocks that were 5 m by 5 m by 5 m in the X, Y, and Z directions
was created by IMC. The model was intersected with the topographic DTM to exclude whole
blocks that extended above the surface.
The Santa Ana deposit is proposed to be mined by open pit. The selection of the small block
size was based on a number of judgments including the width of high grade mineralization and
the potential to ultimately mine the deposit with smaller mining equipment.
DENSITY BCM collected data for density determination on a regular basis, and IMC completed a spot
check on the calculation method. In total, 843 density measurements were documented and
provided to IMC. IMC reported that the density results correlated with rock type but showed
no correlation with the Ag grade of the sample. As a result, each block zone in the model was
assigned a single density value. IMC applied 2.469 t/m3 to all blocks within mineralized Zones
1 and 2. Zone 3 was assigned a density of 2.059 t/m3, and Zone 4 was assigned a density of

www.rpacan.com
Bear Creek Mining Corporation – Santa Ana Project, Project #2426 Technical Review – May 29, 2015
Page 6-6
2.318 t/m3. RPA reviewed the density data and is of the opinion that the spatial representativity
is appropriate within the mineralized blocks.
GRADE ESTIMATION Block grades were estimated for Ag and Zn using Indicator Kriging (IK) in Zones 1 and 2. Lead
and copper were estimated using Ordinary Kriging (OK). The IK procedure was used to
establish a computer generated grade boundary (a “discriminator” value) for Ag and Zn by
interpolating indicator values between zero and one into the blocks. The grade boundaries
were used to domain the Ag and Zn blocks into low and moderate grade populations. A
discriminator value of 15.0 g/t was used for Ag and 0.13% for Zn. This was done by assigning
whole blocks that had a greater than 50% probability of being above the discriminator grade
to the moderate grade domain. All other blocks were assigned to the low grade domain. Zones
1 and 2 utilize different search orientations, but the zone boundaries were treated as soft
boundaries for the indicator assignment, such that composites from both zones could be used
to inform a block.
Once the Ag and Zn indicators codes were assigned to the model, the block grades were
estimated using OK for low and moderate grade domains for each metal. The indicator
boundaries between the low and moderate grade domains were treated as hard boundaries.
The extent and direction of the range of influence determined by variography for Ag was used
to establish the search area for grade interpolation. IMC used a single pass for metal grade
estimation. A maximum of ten composites and a minimum of two were used to assign block
grades. A maximum of three composites per drill hole were allowed within the search process.
RPA reviewed variography for Ag, and confirmed the directions and ranges reported by IMC.
In order to limit the influence of high grade composite samples, IMC used a high grade limit
during grade interpolation. The range of influence of Ag composite samples with grades that
exceeded 200 g/t Ag was limited to a 33 m radius. In RPA’s opinion, this is a reasonable
approach.
Once metal grades were assigned to blocks, a distance limit was applied to constrain the
downward extrapolation of grade below the bottom of drill holes. This was a necessary step
since the interpolation was unconstrained, with an extensive vertical search (90 m). IMC used

www.rpacan.com
Bear Creek Mining Corporation – Santa Ana Project, Project #2426 Technical Review – May 29, 2015
Page 6-7
an Inverse Distance (ID) procedure to clip the mineralization at a 30 m limit. Informed blocks
beyond this limit where assigned zero metal grades. Figure 6-2 shows the Ag block grades of
the model. RPA considers this method to restrict extensive vertical grade interpolation
acceptable.
CLASSIFICATION IMC classified the blocks as Measured, Indicated, or Inferred based on the Ag grade estimate.
The kriged standard deviation (square root of the kriged variance) together with the number of
composites used to inform the Ag block grade were used to establish the block classification.
The classification parameters are summarized in Table 6-1 below.
TABLE 6-1 MINERAL RESOURCE CLASSIFICATION PARAMETERS Bear Creek Mining Corporation - Santa Ana Project
Category Classification Parameters
Measured Silver grade was estimated, and the kriged standard deviation is less than or equal to 0.65, and 4 or more composites used to estimate the grade (2 or more drill holes)
Indicated Silver grade was estimated, and the kriged standard deviation is less than or equal to 1.05
Inferred A silver grade was estimated
The Santa Ana Mineral Resource classification is driven solely by the detailed block-by-block
attributes generated by geostatistical estimation methods and not by the continuity of geology
and mineralization. The result is a “spotted dog” output in which individual drill holes are
surrounded by halos of Measured, Indicated, and Inferred Resource blocks, and isolated small
“islands” of one classification embedded in another (Figures 6-3 and 6-4). While RPA does
not consider this to be best practice, it does not change our opinion that the Mineral Resources
have been estimated according to industry standards and are compliant with reporting
requirements under NI43-101.

Looking Northeast
Ag Grade (g/t)
>5-15
>1-5
>50-100
>15-50
<1
>200
>100-200
0 100 500
Metres
200 300 400
May 2015
Santa Ana Silver Project
3D Isometric View ofBlock Silver Grades
Department of Puno, Peru
Bear Creek Mining Corporation
Figure 6-2
6-8
www.rpacan.com

Looking Northeast
Classification
Inferred
Indicated
Measured
0 100 500
Metres
200 300 400
May 2015
Santa Ana Silver Project
3D Isometric View ofBlock Model Classification
Department of Puno, Peru
Bear Creek Mining Corporation
Figure 6-3
6-9
www.rpacan.com

Looking East
Topography
Reserve Pit Shell
Resource Pit Shell
0 50
Metres
100 150 200
Classification
Inferred
Indicated
Measured
Isolated Block of Inferred
Isolated Block of Measured
May 2015
Santa Ana Silver Project
Isolated Blocks Shown onSection 466,200E
Department of Puno, Peru
Bear Creek Mining Corporation
Figure 6-4
6-1
0
ww
w.rp
acan
.co
m

www.rpacan.com
Bear Creek Mining Corporation – Santa Ana Project, Project #2426 Technical Review – May 29, 2015
Page 6-11
RPA further examined the continuity of Measured and Indicated blocks within the resource pit
shell and noted several small areas of Inferred embedded within the more continuous
Measured and Indicated blocks. It is RPA’s opinion that these blocks should be manually
reclassified to smooth out the “spotted dog” classification and provide a more continuous
domain for mine designs and Mineral Reserve estimation.
MINERAL RESOURCE REPORTING Mineral Resources were estimated as of July 12, 2010, and are summarized exclusive and
inclusive of Mineral Reserves in Tables 6-2 and 6-3, respectively. IMC estimated Measured,
Indicated, and Inferred Mineral Resources at a 15.0 g/t Ag cut-off grade. For the purposes of
resource reporting, IMC constrained the block model to a computer generated open pit surface
using the floating cone algorithm to establish the component of the block model that fulfills the
reporting code requirement of “reasonable prospects for eventual economic extraction”. The
open pit geometry was generated using a $16.00 per ounce Ag price, 70% Ag recovery under
heap leaching, and the operating costs established in the PEA prepared by IMC in April 2009
(news release dated April 20, 2009).
TABLE 6-2 SANTA ANA MINERAL RESOURCES (JULY 12, 2010 EXCLUSIVE OF RESERVES)
Bear Creek Mining Corporation - Santa Ana Project
Category Tonnes Silver Lead Zinc Contained Silver kt g/t % % Moz
Measured 13,386 34.6 0.30 0.50 14.9 Indicated 51,337 35.1 0.30 0.50 57.9
Measured + Indicated 64,723 35.0 0.30 0.50 72.8 Inferred 21,632 40.6 0.32 0.50 28.2
1. CIM definitions were followed for Mineral Resources. 2. No lead and zinc will be recovered. 3. Cut-off grade 15.0 g/t Ag.

www.rpacan.com
Bear Creek Mining Corporation – Santa Ana Project, Project #2426 Technical Review – May 29, 2015
Page 6-12
TABLE 6-3 SANTA ANA MINERAL RESOURCES (JULY 12, 2010 INCLUSIVE OF RESERVES)
Bear Creek Mining Corporation - Santa Ana Project
Category Tonnes Silver Lead Zinc Contained Silver kt g/t % % Moz
Measured 22,337 43.8 0.33 0.57 31.5 Indicated 79,463 40.9 0.31 0.52 104.5
Measured + Indicated 101,800 41.5 0.31 0.53 136.0 Inferred 21,632 40.6 0.32 0.49 28.2
1. CIM definitions were followed for Mineral Resources. 2. No lead and zinc will be recovered. 3. Cut-off grade 15.0 g/t Ag.
RPA completed a check estimate on the Santa Ana Mineral Resources to validate the tonnage
and grade reported in Tables 6-2 and 6-3. There was excellent agreement between RPA’s
tabulated tonnes and grade for each metal and IMC’s reported figures. At a cut-off grade of
15.0 g/t Ag, the difference was approximately 0.5% for Measured and Indicated tonnages, and
less than 0.75% for Inferred. Contained Ag differed by approximately 1.5% for Measured and
Indicated Resources, and 1.9% for Inferred Resources.
In all cases, RPA’s tabulated tonnes and grade was the lower value. The reason for the slight
discrepancy is likely related to the way the block model was constrained. IMC used whole
blocks and RPA constrained the resources using a topographic surface, the open pit surface,
and partial percentages.
RPA OBSERVATIONS AND CONCLUSIONS It is RPA’s opinion that the drill hole database is adequate to support a Mineral Resource
estimate. The composite lengths are appropriate and although the grade interpolation is
unconstrained, the application of an indicator cut-off surface and constraining the resource
estimate to an open pit shell reduces the risk of overestimation of contained tonnage and
metals. Assay, composite, and block model statistics support the observations made by IMC,
and the search parameters used for metal grade interpolation into the block models are
acceptable. RPA was able to confirm the grades and tonnages of the Santa Ana Mineral
Resource estimate as reported in the FSU.
It is RPA’s opinion, based on this, that the Measured, Indicated, and Inferred tonnage and
grade of the Santa Ana Mineral Resource estimate are acceptable.

www.rpacan.com
Bear Creek Mining Corporation – Santa Ana Project, Project #2426 Technical Review – May 29, 2015
Page 6-2
RPA has made no revisions to the FSU Base Case for geology and Mineral Resources

www.rpacan.com
Bear Creek Mining Corporation – Santa Ana Project, Project #2426 Technical Review – May 29, 2015
Page 7-1
7 MINING AND MINERAL RESERVES MINERAL RESERVES Mineral Reserves total 37.1 million tonnes at a grade of 53 g/t Ag, 0.34% Pb, and 0.6% Zn.
Due to the low grades of Pb and Zn, these elements will not be recovered during processing.
The Mineral Reserves as of March 2012 as estimated by IMC are shown in Table 7-1.
TABLE 7-1 SANTA ANA MINERAL RESERVES (JULY 12, 2010) Bear Creek Mining Corporation - Santa Ana Project
Category Tonnes Silver Lead Zinc Contained Silver kt g/t % % Moz
Proven 8,951 57.6 0.37 0.7 16.6 Probable 28,126 51.5 0.33 0.6 46.6
Proven + Probable 37,077 53.0 0.34 0.6 63.2
1. CIM definitions were followed for Mineral Reserves. 2. No lead and zinc will be recovered. 3. Cut-off grade 27 g/t Ag years 1 to 5, 24 g/t Ag years 6 to 11.
The Mineral Reserve estimation does not account for dilution and extraction factors. RPA
recommends applying global dilution and extraction factors of 5% and 95% respectively.
Figure 7-1 shows the expected dilution and ore losses on a typical mining bench.
MINE PRODUCTION
Mining is proposed to be carried out at an elevated cut-off grade of 27 g/t from Year 1 to Year
5 and material between 27 g/t and 34 g/t is stockpiled for later processing. From Year 6
onward, the cut-off grade of 24 g/t Ag will be used. Material between 27 g/t Ag and 34g/t Ag
is stockpiled in the first five years and is processed at the end of the mine life. The cut-off
grade is raised to 27 g/t Ag for the material going to the stockpile to account for the additional
$0.88/t cost to re-handle the material to the crusher. The mine production schedule is
presented in Table 7-2.

Plan View 4,200 m Bench5 m Slice
Ore Losses
Ore Losses
Dilution
< 24
Ag Grade (g/t)
> 34
24 - 34
0 100 500
Metres
200 300 400
N
May 2015
Santa Ana Silver Project
Dilution and Ore Losseson a Typical Mining Bench
Department of Puno, Peru
Bear Creek Mining Corporation
Figure 7-1
7-2
ww
w.rp
acan
.co
m

www.rpacan.com
Bear Creek Mining Corporation – Santa Ana Project, Project #2426 Technical Review – May 29, 2015
Page 7-3
TABLE 7-2 MINE PRODUCTION SCHEDULE – FSU BASE CASE Bear Creek Mining Corporation - Santa Ana Project
Crusher Feed Low Grade at 27 g/t Time Period Cut-off Ore Silver To Stockpile Silver Waste Total Material
(g/t) (kt) (g/t) (kt) (g/t) (kt) (kt) PPQ1 - - - - - 23 23 PPQ2 34 37 52.6 16 29.9 599 652 PPQ3 34 182 49.3 67 30.5 1,260 1,509 PPQ4 34 196 49.0 100 30.4 1,115 1,411 Y1,Q1 34 721 51.8 254 30.7 2,085 3,060 Y1,Q2 34 791 56.4 269 30.5 2,000 3,060 Y1,Q3 34 832 62.1 219 30.5 2,009 3,060 Y1,Q4 34 841 66.5 173 30.4 2,046 3,060 Y2 30 3,600 60.5 329 28.4 8,571 12,500 Y3 32 3,600 59.1 494 29.6 8,606 12,700 Y4 33 3,600 57.6 953 30.0 8,147 12,700 Y5 28 3,600 59.0 90 27.5 8,550 12,240 Y6 24 3,600 55.6 7,725 11,325 Y7 24 3,600 53.1 7,552 11,152 Y8 24 3,600 49.7 5,844 9,444 Y9 24 3,600 47.0 4,706 8,306 Y10 24 1,713 44.8 1,789 3,502 Total 34,113 55.0 2,964 29.9 72,627 109,704
PIT DESIGN A pit design was carried out using the floating cone analysis as a guide to design the
pushbacks for the final pit. Six phases were designed for the development of a practical mine
production schedule.
The following criteria were followed in designing the phases:
• Bench Height: five metres • Inter-ramp Slope Angle: 40° • Haul Road Width: 21 m • Haul Road Gradient: 10% • Minimum pushback width: approximately 100 m
It appears that the pit design is slightly conservative given that the geotechnical results indicate
that the inter-ramp slopes are higher than the 40° used in the inter-ramp pit slopes. According
to the FSU, the recommended inter-ramp slope angle is 40° for sectors of low rock quality
designation (RQD) rock mass and use a five metre single bench design. The post-

www.rpacan.com
Bear Creek Mining Corporation – Santa Ana Project, Project #2426 Technical Review – May 29, 2015
Page 7-4
mineralization tuff and andesite, both with high RQD, have a recommended inter-ramp slope
angle of 43° and 44°, respectively, permitting the use of a 10 m double bench design.
Furthermore, given the multiple pit bottoms, an opportunity exists to decrease the ramp to a
single lane for the lower sections of the pit bottoms (the last few benches, for example).
RPA agrees with the recommendations in the FSU for monitoring of pit wall stability with the
use of prisms and permanent survey stations.
Open pit slope stability is sensitive to the estimated phreatic condition. Therefore, RPA
strongly recommends maintaining the phreatic surface as far as possible from the slope faces
by implementing permanent horizontal drains and pumping water from the open pit bottom
during operation. Installation of piezometers around the final pit area is recommended for
monitoring the impact of the pumping and drainage measures during operation, and for
permanent review of slope stability.
Costs for pit wall monitoring and water management are not accounted for in the mine
operating costs. These costs are captured within the additional 25% contingency in the
adjusted $2.10/t moved unit rate suggested by RPA.
The final pit design is presented in Figure 7-2.
WASTE DUMPS AND STOCKPILES The waste dump is located at the southwest end of the pit. Waste rock is dumped downhill
from a constant elevation of 4,255 m, which allows for efficient operation and reduced haulage
cycle times since the trucks do not have to travel uphill to reach the top of the dump.
The low grade stockpile is located adjacent to the crusher, which will reduce haulage cycle
times.

467,0
00 E
466,5
00 E
466,0
00 E
8,159,000 N
8,158,500 N
8,158,000 N
8,157,500 N
8,159,000 N
8,158,500 N
8,158,000 N
8,157,500 N
467,0
00 E
466,5
00 E
466,0
00 E
0 100 500
Metres
200 300 400N
May 2015 Source: Independent Mining Consulting Inc., 2010.
Santa Ana Silver Project
Final Pit Design
Department of Puno, Peru
Bear Creek Mining Corporation
Figure 7-2
7-5
www.rpacan.com

www.rpacan.com
Bear Creek Mining Corporation – Santa Ana Project, Project #2426 Technical Review – May 29, 2015
Page 7-6
MINE EQUIPMENT The mine equipment used to develop contractor costs are presented in Table 7-3 and Table
7-4. The actual equipment used in the operation will depend on the contractor’s fleet.
TABLE 7-3 MINE EQUIPMENT LIST FOR PRIMARY MINE OPERATIONS – FSU BASE CASE
Bear Creek Mining Corporation - Santa Ana Project
Year Equipment Type Type -1 1 2 3 4 5 6 7 8 9 10 11 Blast Hole Drill 45,000 lb (Units) 3 3 3 3 3 3 3 3 3 3 3 0 Wheel Loader 8.6 m3 (Units) 2 3 3 3 3 3 3 3 2 2 2 2 Haul Truck 63 t (Units) 7 9 10 11 11 11 11 11 11 11 11 11 Track Dozer 310 hp (Units) 3 3 3 3 3 3 3 3 3 3 3 3 Motor Grader 14 ft (Units) 1 2 2 2 2 2 2 2 2 2 2 2 Water Truck 50,000 l (Units) 1 1 1 1 1 1 1 1 1 1 1 1 Atlas Copco Drill ROC D7 (Units) 1 1 1 1 1 1 1 1 1 1 1 Excavator 2 yd3 (Units) 1 1 1 1 1 1 1 1 1 1 1 1 TOTAL (Units) 19 23 24 25 25 25 25 25 24 24 24 21
TABLE 7-4 MINE EQUIPMENT LIST FOR HEAP LEACH LOADING AND MAINTENANCE – FSU BASE CASE
Bear Creek Mining Corporation - Santa Ana Project
Year Equipment Type Type -1 1 2 3 4 5 6 7 8 9 10 11
Wheel Loader 8.6 m3 (Units) 2 3 3 3 3 3 3 3 2 2 2 2 Haul Truck 63 t (Units) 7 9 10 11 11 11 11 11 11 11 11 11 Track Dozer 310 hp (Units) 3 3 3 3 3 3 3 3 3 3 3 3 TOTAL (Units) 19 23 24 25 25 25 25 25 24 24 24 21
RPA OBSERVATIONS AND CONCLUSIONS RPA makes the following observations and conclusions:
• Mineral Reserves were estimated based on 100% conversion of Measured and
Indicated Resources without the application of dilution and extraction factors. RPA would expect mineral extraction of 95% with a global dilution of 5%.
• The proposed mining method is appropriate for the deposit.
• The pit design appears to be slightly conservative. A 40° inter-ramp slope was used
for the pit design whereas the geotechnical report recommends the use of up to 44° in some sections of the pit.

www.rpacan.com
Bear Creek Mining Corporation – Santa Ana Project, Project #2426 Technical Review – May 29, 2015
Page 7-7
• No loading rates for shovels and loaders were provided, nor equipment availabilities, utilization, etc. Material consumption rates (diesel, ANFO, etc.) were also not supplied.
• Haul cycle times were provided for the various haul profiles and appear to be carried
out in a thorough manner.
For the RPA Revised Base Case, RPA has adjusted the cut-off grade calculation to reflect the
change in metal price forecast consensus, as of the June 2011 date of expropriation, as well
as make an adjustment to the metallurgical recovery based on the addition of a third stage
crushing circuit. The adjustments result in a reduction of COG from 24 g/t Ag to 17.5 g/t Ag
as shown in Table 7-5. The COG parameters used for the FSU were developed earlier in the
initial FS. The FSU COG was not updated to reflect the updated process G&A costs and
revised metallurgical recovery.
TABLE 7-5 RPA REVISED COG Bear Creek Mining Corporation - Santa Ana Project
Parameter Unit FSU RPA Revised Process and G&A Costs $/t ore 6.69 6.69 Recovery % 70.0 75.0 Refining Cost $/oz 0.40 0.40 Refining Recovery % 99.7 99.7 Ag Price $/oz 13.00 16.50 COG* g/t 24.0 17.5
*COG is rounded to nearest 0.5 g/t.
RPA reported the Mineral Resources from the FSU design pit at a COG of 17.5 g/t Ag. The
resulting tonnes, grade, and contained silver are presented in Table 7-6.
TABLE 7-6 RPA REVISED MINERAL RESOURCES Bear Creek Mining Corporation - Santa Ana Project
Category Tonnes Silver Contained Silver
kt g/t Moz Measured 11,364 50.1 18.3 Indicated 34,695 46.1 51.5
Measured + Indicated 46,059 47.1 69.8
1. CIM definitions were followed for Mineral Resources. 2. No lead and zinc will be recovered. 3. Cut-off grade of 17.5 g/t Ag.
www.rpacan.com
Bear Creek Mining Corporation – Santa Ana Project, Project #2426 Technical Review – May 29, 2015
Page 7-8
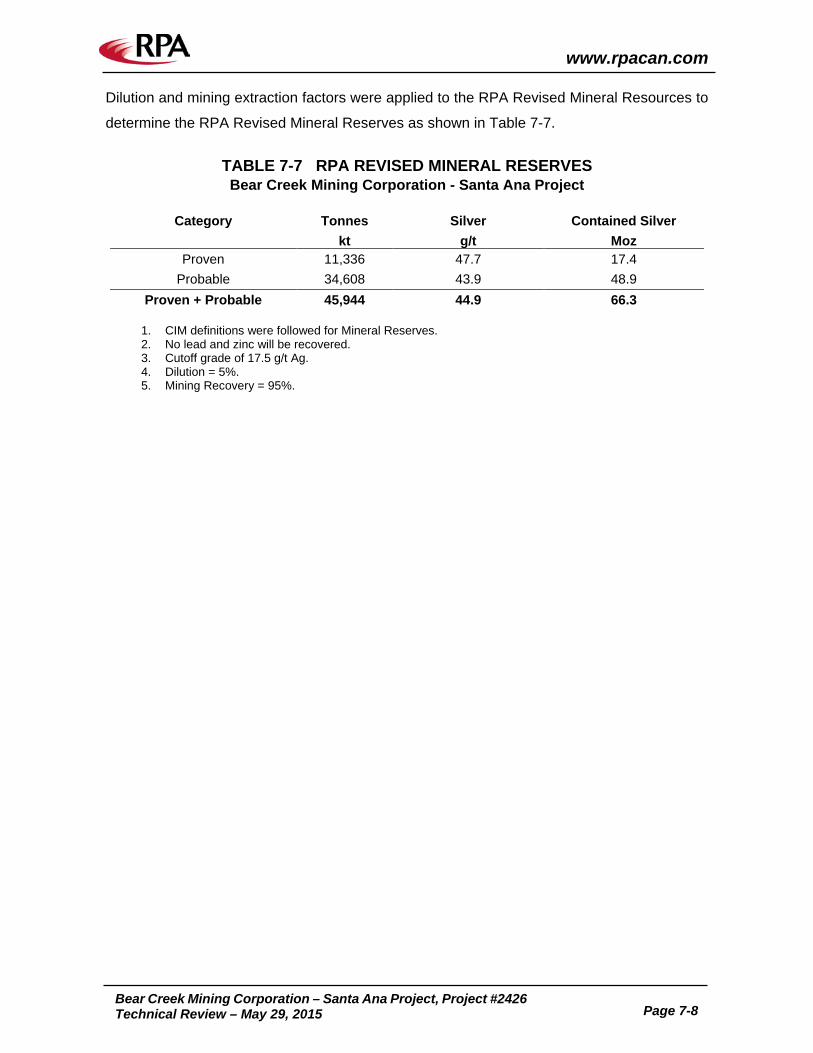
Dilution and mining extraction factors were applied to the RPA Revised Mineral Resources to
determine the RPA Revised Mineral Reserves as shown in Table 7-7.
TABLE 7-7 RPA REVISED MINERAL RESERVES Bear Creek Mining Corporation - Santa Ana Project
Category Tonnes Silver Contained Silver
kt g/t Moz Proven 11,336 47.7 17.4
Probable 34,608 43.9 48.9 Proven + Probable 45,944 44.9 66.3
1. CIM definitions were followed for Mineral Reserves. 2. No lead and zinc will be recovered. 3. Cutoff grade of 17.5 g/t Ag. 4. Dilution = 5%. 5. Mining Recovery = 95%.

www.rpacan.com
Bear Creek Mining Corporation – Santa Ana Project, Project #2426 Technical Review – May 29, 2015
Page 8-1
8 MINERAL PROCESSING RPA reviewed metallurgical data from ALS, Laboratorio Plenge, and McClelland Laboratories
Inc.
The testwork was conducted in four phases using the following samples:
• Ten coarse reject samples ranging in grade from 50 g/t Ag to 238 g/t Ag.
• Two composite samples called High Grade core composite (~115 g/t Ag) and Heap
Grade core composite (~37 g/t Ag).
• One Core Composite sample (~55 g/t Ag).
The test data in the reports consisted of:
• 20 bottle roll tests (BRTs) using the ten coarse reject samples.
• Four agitated cyanidation tests using two composite samples (high grade leach and
heap grade leach samples).
• Two “partial” agitated cyanidation tests using the high grade leach sample for 48 hours and 168 hours.
• Six BRTs using the core composite sample at four particle sizes.
• One column leach test for pulp agglomeration using 20% pre-leached High Grade pulp ground to P80 150 microns.
• Two column leach tests using the High Grade and Heap Grade core samples.
• Four column leach tests using the Core Composite at four particle sizes.
SILVER RECOVERY The FSU study team estimated that the Ag recovery would be 75% over a period of 180 days,
however, the column test was only conducted for 110 days so the estimate is based on
extrapolation of the data to a period of 180 days (Figure 8-1).
RPA has plotted the data and found that the actual recovery may be one to two percent lower
since the leach curve (described by the formula in Figure 8-1) flattens significantly towards the
end of the leach cycle. Also, assuming a recovery of 75% would not take into account the

www.rpacan.com
Bear Creek Mining Corporation – Santa Ana Project, Project #2426 Technical Review – May 29, 2015
Page 8-2
impact of other unit operations such as Merrill-Crowe Zn precipitation which would reduce the
Ag recovery somewhat from the extraction that occurs in heap leaching.
FIGURE 8-1 COLUMN TEST RECOVERY VS. TIME
RPA OBSERVATIONS AND CONCLUSIONS RPA has made several observations with respect to metallurgical testing and processing.
• The Ag extraction appeared to be independent of the head grade.
• Samples that had a sulphide sulphur concentration of approximately 0.25% had lower
Ag extraction in the cyanide leach tests run at 10 mesh but no significant difference was observed when they were ground to minus 200 mesh.
• Pulp agglomeration did not appear to be effective at improving Ag extraction.
• The process design in the FSU is based on column tests.
• Production from the last two years of operation come from processing low grade stockpiles that have average Ag grades between 30 g/t and 40 g/t. No tests have been conducted on samples in this grade range.
• The cyanide consumption for the column test conducted at 9.5 mm was 1.64 kg/t, which means the consumption in a heap leach operation would be approximately 0.4 kg/t to 0.5 kg/t (i.e., 25% to 30% of the laboratory consumption).

www.rpacan.com
Bear Creek Mining Corporation – Santa Ana Project, Project #2426 Technical Review – May 29, 2015
Page 8-3
• The lime consumption was 3.5 kg/t.
RPA has made no revisions to the FSU Base Case for processing.

www.rpacan.com
Bear Creek Mining Corporation – Santa Ana Project, Project #2426 Technical Review – May 29, 2015
Page 9-1
9 ACCESSIBILITY, INFRASTRUCTURE, AND MANPOWER ACCESS Access to the property is by driving west 44 km from Desaguadero on paved and gravel roads
to the village of Huacullani, then south on a good dirt road another 4.9 km to the Santa Ana
Project site. In good weather, two-wheel drive vehicles can easily access the property. Off
road or wet weather travel requires four-wheel drive vehicles.
In order to develop the Santa Ana Project, it will be necessary to improve the existing mine
access road between the existing interstate highway and the Project site. Additional mine site
roads will also be necessary for daily operation of the mine.
In general terms, the roads included in the FSU have a total width of 7.2 m including a diversion
ditch. The slopes along these access roads are generally intended to be kept between 4 and
10%. Due to the relative steepness of the property some roadway sections will require slopes
as great as 15% or more.
WATER The amount of fresh water required by the Santa Ana Project facilities is approximated at 73.8
m3/hour (20.5 L/s) with a peak delivery of 109.4 m3/hour (30.4 L/s). The well field and water
supply pipeline will be designed for this peak demand.
Water quantities are limited and environmentally and socially sensitive in the region of the
Santa Ana mine. Groundwater near the facilities was, therefore, not considered as a main
source of water for the project; however an area does exist for auxiliary, short-term
groundwater supply in fractured andesitic rocks if required.
The primary water supply for the project will be from the basin-fill deposits of the Challacollo
Valley along the Callacame River, which lies 7.8 km from the mining facilities. A 339 ha parcel
along the Callacame River was explored using surface resistivity geophysical methods. After
completion of geophysics, a piezometer and a water supply test well were drilled in the area.

www.rpacan.com
Bear Creek Mining Corporation – Santa Ana Project, Project #2426 Technical Review – May 29, 2015
Page 9-2
Aquifer testing of the water supply test well was conducted to determine aquifer parameters.
It is estimated that three production wells in the area will meet the water supply needs for the
Project, including back-up capacity.
POWER Power for exploration was supplied by generators. For mining operations, electrical power to
the Santa Ana facilities will be provided from the Peruvian grid (Sistema Electrico
Interconectado Nacional - SEIN). A new line would be built connecting the existing Pomata
substation in the town of Pomata to the Santa Ana substation. In addition, there will be 10kV
primary lines and distribution substations.
The electrical power transmission line would supply the power required for the future Santa
Ana operations with a power of 6MW.
The Project area has a moderate topography (elevations generally vary from 4,150 masl to
4,300 masl) so the construction of site access roads is relatively simple compared to other
projects in Peru where there is more severe topography, typical of alpine terrain.
There is only one small structure on the property and the exploration group used it during the
drilling phase for offices and accommodations. The mine development plan describes
installation of all new site infrastructure for the project.
MANPOWER The estimated contractor personnel to operate and maintain the equipment is summarized in
Table 9-1. Contractor supervisory staff is included in Table 9-1, however, the owners,
supervisory, engineering, and geology staff at the mine are not included in the personnel list
because they are included in the owner’s cost.

www.rpacan.com
Bear Creek Mining Corporation – Santa Ana Project, Project #2426 Technical Review – May 29, 2015
Page 9-3
TABLE 9-1 MANPOWER REQUIREMENTS – FSU BASE CASE Bear Creek Mining Corporation - Santa Ana Project
Areas LOM Average
Personnel Mine Operations 186 Process 83 G&A 39 Total 308
RPA OBSERVATIONS AND CONCLUSIONS RPA’s review of available data suggests that the Santa Ana has favourable infrastructure. The
Project has good road access with nearby power and water supply available. The site is well
suited for a heap leach pad and the waste dump design allows for efficient dumping.
RPA has made no revisions to the FSU Base Case for accessibility, infrastructure, or
manpower.

www.rpacan.com
Bear Creek Mining Corporation – Santa Ana Project, Project #2426 Technical Review – May 29, 2015
Page 10-1
10 ENVIRONMENTAL AND SOCIAL CONSIDERATIONS The following description is largely taken from the FSU.
The Santa Ana Project has been designed to meet industry standards of environmental
compliance. The heap leach and solution ponds have been designed to industry standards of
containment and stability. The waste rock storage facilities are designed to capture and
manage any flows that may originate from the waste rock. Finally, an initial closure plan has
been developed that will provide covers for both the heap leach and waste rock facilities that
will result in safe and environmentally compliant closure of the mine. The laboratory tests
conducted on samples of spent ore and waste rock have shown that the site has a very low
potential to produce acid rock drainage (ARD).
In 2010, BCM was advancing the permitting process and submitted the Environmental and
Social Impact Assessment (ESIA) community participation plan to the Peruvian authorities in
December 2010, which was approved in January 2011. All additional necessary permitting
would be processed once the ESIA itself has been approved by the national government.
BCM maintained good working relationships with the local communities based on information
in the FSU.
RPA OBSERVATIONS AND CONCLUSIONS RPA’s review of available data suggests that BCM was in compliance and intended to comply
with the Peruvian permitting process and to demonstrate corporate social responsibility.
RPA has made no revisions to the FSU Base Case for environmental and social
considerations.

www.rpacan.com
Bear Creek Mining Corporation – Santa Ana Project, Project #2426 Technical Review – May 29, 2015
Page 11-1
11 CAPITAL COSTS The estimated Project capital costs are summarized in Table 11-1 below.
TABLE 11-1 CAPITAL COST SUMMARY – FSU BASE CASE Bear Creek Mining Corporation – Santa Ana Project
Area Units Cost Direct Cost Mining $ '000 Processing $ '000 16,874 Infrastructure $ '000 25,794 Total Direct Cost $ '000 42,669 Other Costs Preproduction Mine Development & Equipment $ '000 9,909 Owners $ '000 4,226 Indirect Costs (EPCM, Freight, Insurance, etc) $ '000 7,947 Spare Parts $ '000 833 Subtotal Costs $ '000 65,583 Contingency $ '000 6,031 Initial Capital Cost $ '000 71,613
RPA OBSERVATIONS AND CONCLUSIONS MINE All mining is carried out by contractors and capital costs for mine equipment are amortized
over a seven year period at a cost of capital of 5%. The total cost of mining equipment over
the life of mine, taking into consideration the cost of capital, is $31.5 million comprising $12.9
million for initial capital and $18.6 million for sustaining capital. This expenditure is built into
the operating cost of the contractor cost.
PROCESS RPA reviewed the capital costs in the financial model 0911 - Santa Ana Financial Model
12OCT10 Rev 2 - finer crush - Herbs Rec. The costs are the correct order of magnitude and
they have been adjusted to include three-stage crushing based on the more recent testwork
and the increased recovery. The estimated capital costs are also similar to the costs for a
10,000 tpd heap leach operation in the InfoMine cost model, which are approximately $40
million for the process and infrastructure.

www.rpacan.com
Bear Creek Mining Corporation – Santa Ana Project, Project #2426 Technical Review – May 29, 2015
Page 11-2
All capital costs for the process and infrastructure reportedly include 15% for EPCM and 15%
for contingency.
INFRASTRUCTURE Detailed estimates were carried out for on-site infrastructure requirements, which include:
• Electrical supply • Water supply • Camp • Buildings and offices • Access roads
RPA reviewed the Other Costs comprising: Preproduction Mine Development and Equipment,
Owner’s Costs, Indirect Costs, and Spare Parts. RPA found that the Owner’s Costs’ estimates
do not contain detailed supporting information to be able to confirm their level of accuracy and
only consider a contingency of 10%. In RPA’s opinion, this contingency should be adjusted to
30% to reflect the level of uncertainty in the estimate. The contingency adjustment results in
a change from $4.3 M to $5.1 M.

www.rpacan.com
Bear Creek Mining Corporation – Santa Ana Project, Project #2426 Technical Review – May 29, 2015
Page 12-1
12 OPERATING COSTS The estimated Project operating costs are summarized in Table 12-1 below.
TABLE 12-1 OPERATING COSTS – FSU BASE CASE Bear Creek Mining Corporation – Santa Ana Project
Area Units Cost
Mine to Crusher $/t moved 1.68 Crusher to Leach Pad $/t milled 0.71 Mine $/t milled 5.60 Process $/t milled 3.49 General & Administration $/t milled 1.17 Total $/t milled 10.26
RPA OBSERVATIONS AND CONCLUSIONS MINE Mine cost estimates do not contain detailed supporting information to be able to confirm their
level of accuracy, and RPA has adjusted mining costs to what it considers a reasonable level
based on in-house experience. The plan for the operation of the mine is to use a contract
miner. IMC developed mining costs of $1.68 per tonne of material mined (ore and waste) and
$0.71 per tonne for the rehandling of the crushed ore onto the heap leach. Separate budgetary
quotes were received from local mining contractors, but did not contain a detailed breakdown
For a small, hard rock open pit, RPA would expect mining costs to be in the $2.00 to $2.50 per
tonne moved range based on in-house experience. Infomine estimates $2.86 per tonne moved
for same size operation (this would be somewhat lower based on lower labour costs in Peru).
RPA recommends adjusting the mine operating cost upwards by 25% to $2.10 per tonne
moved. This will also serve to capture some of the operating costs such as dewatering and
geotechnical monitoring, which are not accounted for in the FSU operating cost estimate but
will be covered under the adjusted mining cost.
PROCESS RPA has reviewed the operating costs in the financial model 0911 - Santa Ana Financial Model
12OCT10 Rev 2 - finer crush - Herbs Rec. The process operation costs are reasonable based
on RPA’s experience with similar projects.

www.rpacan.com
Bear Creek Mining Corporation – Santa Ana Project, Project #2426 Technical Review – May 29, 2015
Page 12-2
GENERAL AND ADMINISTRATION G&A costs estimates do not contain detailed supporting information to be able to confirm the
level of accuracy and only consider a contingency of 5%. In RPA’s opinion, this contingency
should be adjusted to 30% to reflect the level of uncertainty in the estimate, however, this does
not materially impact the overall G&A cost estimates.

www.rpacan.com
Bear Creek Mining Corporation – Santa Ana Project, Project #2426 Technical Review – May 29, 2015
Page 13-1
13 PROJECT EXECUTION PLAN The FSU PEP projected pre-production to be carried out over a 24 month period commencing
immediately after the release of the FSU report (October 2010). Table 13-1 below illustrates
the major milestones in the development plan.
Following ESIA approval, BCM was expected to advance the permitting process by obtaining
the necessary construction and operating permits. In late 2011, once the proper permits were
obtained, the principal off-site project infrastructure was expected to be developed. This would
include the power line, the upgrading of the access road, the construction of the water supply
pipe line, and drilling of any additional production water wells. Any temporary construction
housing would be installed in preparation for the on-site construction.
On site construction was expected to start in the second quarter of 2012 and continue through
the dry season. Commercial production was expected to start in early part of the fourth quarter
of 2012, with full mill production commencing in Q1 2013.
TABLE 13-1 PROJECT EXECUTION PLAN – FSU BASE CASE Bear Creek Mining Corporation – Santa Ana Project
Item/Period Q4 Q1 Q2 Q3 Q4 Q1 Q2 Q3 Q4
2010 2011 2011 2011 2011 2012 2012 2012 2012 ESIA Review Detailed Engineering Permitting Off-site Infrastructure Construction Site Development Production
RPA OBSERVATIONS AND CONCLUSIONS The PEP appears reasonable and RPA has made no revisions to the FSU Base Case.

www.rpacan.com
Bear Creek Mining Corporation – Santa Ana Project, Project #2426 Technical Review – May 29, 2015
Page 14-1
14 EXTENDED LIFE CASE In order to further understand the potential value of the Project, RPA prepared a life of mine
scenario that included the assumption that some of the Mineral Resources, including Inferred
material would be converted into Indicated Resources with further drilling.
OPEN PIT OPTIMIZATION An open pit optimization was carried out by RPA incorporating Measured, Indicated, and
Inferred Resources using updated parameters. Whittle software was used to evaluate the
resource blocks incorporating the parameters shown in Table 14-1.
TABLE 14-1 WHITTLE OPTIMIZATION PARAMETERS – EXTENDED LIFE CASE
Bear Creek Mining Corporation – Santa Ana Project
Parameter Unit Input Pit Slopes degrees 40 Mining Waste Cost $/tonne 2.10 Mining Ore Cost $/tonne 2.81 Process Cost $/tonne 3.49 G&A Cost $/tonne 1.45 Process and G&A Cost $/tonne 4.94 Mining Extraction % 95 Mining Dilution % 5 Ag Price $/oz Ag 16.50 Met. Recovery % 75 TC/RC $/oz Ag 0.63 Royalties $/oz Ag 0.23 Total Charges $/oz Ag 0.86 COG g/t 14.0
The results from the Whittle optimization are shown relative to the FSU Base Case pit design
in Figure 14-1.

TopographyFSU Reserve Pit
Extended Life Pit
< 14.00
Ag Grade (g/t)
> 24.00
14.00 - 24.00
0 100
Metres
200 300 400
May 2015
Santa Ana Silver Project
Looking East
King & Spalding LLP
Department of Puno, PeruComparison of Extended Life Case
Versus FSU Pit Design
Figure 14-1
14-2
ww
w.rp
acan
.co
m

www.rpacan.com
Bear Creek Mining Corporation – Santa Ana Project, Project #2426 Technical Review – May 29, 2015
Page 14-3
The total Mineral Resources reported out of the RPA Extended Life Case are presented in
Table 14-2.
TABLE 14-2 RPA EXTENDED LIFE MINERAL RESOURCES Bear Creek Mining Corporation - Santa Ana Project
Category Tonnes Silver Contained Silver
kt g/t Moz Measured 19,111 44.2 27.2 Indicated 62,073 41.7 83.2 Inferred 12,080 43.7 17.0 M, I, & I 93,264 42.5 127.3
1. CIM definitions were followed for Mineral Resources. 2. No lead and zinc will be recovered. 3. Cut-off grade of 14 g/t Ag.
Dilution and extraction factors were applied to the Mineral Resources and the additional
Extended Life material was reduced by 25% to account for the uncertainty of future conversion
to Mineral Reserves. The results indicate the potential for 81.3 Mt at a grade of 41.1 g/t Ag for
a total of 107.3 Moz Ag and are presented in Table 14-3.
TABLE 14-3 RPA EXTENDED LIFE MINERAL POTENTIAL Bear Creek Mining Corporation - Santa Ana Project
Category Tonnes Silver Contained Silver
kt g/t Moz RPA Revised Base Case 45,944 44.9 66.3 Additional Extended Life* 35,315 36.1 41.0 RPA Extended Life Case 81,259 41.1 107.3
1. CIM definitions were followed for Mineral Resources. 2. No lead and zinc will be recovered. 3. Cut-off grade of 14 g/t Ag. 4. Mining Factors: Dilution = 5% and Mining Extraction = 95%. 5. *All M, I, & I material outside RPA Revised Base Case plus additional Inferred Resources within
RPA Revised Base Case with 75% factor applied to account for non-convertible resources.
OPERATING COSTS The Extended Life Case operating costs are summarized in Table 14-4. The overall stripping
ratio was reduced from 1.96 to 1.18 (waste:ore) from the FSU Base Case to the Extended Life
Case, mainly as a result of including Inferred Resources which were previously classified as
waste in the case of the former.

www.rpacan.com
Bear Creek Mining Corporation – Santa Ana Project, Project #2426 Technical Review – May 29, 2015
Page 14-4
Total operating costs for the Extended Life Case are $9.93/t milled.
TABLE 14-4 OPERATING COSTS – EXTENDED LIFE CASE Bear Creek Mining Corporation – Santa Ana Project
Area Units Cost
Mine to Crusher $/t moved 2.10 Crusher to Leach Pad $/t milled 0.71 Mine $/t milled 4.99 Process $/t milled 3.49 General & Administration $/t milled 1.45 Total $/t milled 9.93
ONGOING CAPITAL COSTS The estimated sustaining capital costs and reclamation costs were changed to reflect the
longer mine life. All other initial capital costs remain unchanged from the RPA Revised Base
Case.
Based on the additional material mined, it was determined that two additional heap leach pads
were required in Year 11 and Year 15 at the cost of $5 M each. Sustaining capital of $0.3 M
per year was considered based on similar costs used in the RPA Revised Base Case. The
differences in ongoing capital costs between the RPA Revised Base Case and Extended Life
Case is presented in Table 14-5.
TABLE 14-5 CAPITAL COST DIFFERENCES BETWEEN RPA REVISED BASE CASE AND EXTENDED LIFE CASE
Bear Creek Mining Corporation – Santa Ana Project
Area Units RPA Revised Base
Case Extended Life Case
Sustaining Capital $ '000 15,008 28,308 Reclamation and Closure $ '000 10,662 18,512 Total $ '000 25,669 46,819

www.rpacan.com
Bear Creek Mining Corporation – Santa Ana Project, Project #2426 Technical Review – May 29, 2015
Page 15-1
15 PROJECT CASH FLOW A pre-tax Cash Flow Projection has been generated from the Life of Mine production schedule
and capital and operating cost estimates. A summary of the key criteria is provided below in
Table 16-1 for each scenario: FSU Base Case, RPA Revised Base Case, and RPA Extended
Life Case. The RPA Revised Base Case and Extended Life Case are shown in Appendix A
and Appendix B, respectively.
TABLE 16-1 PROJECT CASH FLOW PARAMETERS SUMMARY Bear Creek Mining Corporation – Santa Ana Project
Parameter Units FSU Base
Case RPA Revised
Base Case RPA Extended
Life Case Production Rate Mtpa 3.6 3.6 3.6 Mine Life years 11 13 24 Total Ore Production Mt 37.1 45.9 81.3 LOM Metal Price $/oz Ag 14.50 24.71 23.76 Heap Leach Recovery % 75.0 75.0 75.0 Payable Silver % 99.8 99.8 99.8 TC/RC & Transport $/oz Ag 0.63 0.63 0.63 Net Revenue $M 653 1,185 1,845 Operating Cost $/t leached 10.26 10.41 9.93 Capital Cost $M 97 98 119 Undiscounted Pre-Tax Cash Flow $M 178 598 908
The metal prices used in the cash flow are provided by FTI and are based on a mix of futures,
spot, and consensus forecasts.
RPA’s assumption of using $16.50 per ounce silver for cut-off grade calculation for Mineral
Resource and Mineral Reserve estimation is not intended to be used as a basis for establishing
the Fair Market Value or Net Present Value of the Project. It is considered best practice for
cut-off grade estimation to use a long term price that applies to the potential life of the Mineral
Resources and Mineral Reserves.

www.rpacan.com
Bear Creek Mining Corporation – Santa Ana Project, Project #2426 Technical Review – May 29, 2015
Page 16-1
16 CORANI PROJECT RPA was requested to prepare a high level technical review of the information used as a basis
for the Corani Project Feasibility Study (Corani FS), which is scheduled to be published June
2015. The Corani FS is being developed by M3 Engineering & Technology Corporation (M3)
with the assistance of Global Resource Engineering (GRE).
Corani is 100% owned by Bear Creek Mining. The Project will comprise an open pit mine
producing 7.8 million tonnes of silver/lead/zinc ore over 18 years. A conventional flotation
plant will produce lead and zinc concentrates containing silver. The primary revenue mineral
is silver.
Based on the review of the available documentation RPA considers the Corani FS to be a
reasonable representation of the Project as planned. RPA is of the opinion that an appropriate
economic analysis of the Project can be made using the cash flow model along with available
data provided. RPA held a discussion with GRE to review the various Corani FS inputs and
methods used to develop the geology, metallurgy, and mining for the project. RPA is of the
opinion that the Corani FS work was carried out in thorough and diligent manner.
PROJECT LOCATION The Project site is located in the Andes Mountains of south-eastern Peru at elevations of 4,800
masl to 5,100 masl, specifically within the Cordillera Vilcanota of the Eastern Cordillera. The
site is located in the Region of Puno immediately east of the continental divide separating the
Pacific and Atlantic drainages.
The site location is approximately 160 km in a direct line to the southeast of the major city of
Cusco, with Universal Transverse Mercator (UTM) coordinate ranges of 312,000E to 322,000E
and 8,443,000N to 8,451,000N, using UTM, Zone 19S, Provisional South American datum,
PSAD 56.

www.rpacan.com
Bear Creek Mining Corporation – Santa Ana Project, Project #2426 Technical Review – May 29, 2015
Page 16-2
GEOLOGY AND MINERAL RESOURCES In general, economic mineralization at Corani are comprised of freibergite (silver-bearing
tetrahedrite), non- argentiferous galena, sphalerite, pyrite, marcasite, other silver sulphosalts
(myrargyrite, pyrargyrite-proustite), boulangerite, acanthite, and minor native silver.
The Corani deposit is comprised of low sulphidation epithermal silver, lead, and zinc
mineralization within stock works, veins, and breccias, and hosted in pre-mineral tuffs and
andesite flows.
There are three main zones of mineralization in the Corani deposit: Main (zone 1), Minas (zone
2), and Este (zone 3). Mineralization is generally continuous between the Minas and Main
zones. Vein structures are typically associated with the Main and Minas zones, and the Este
zone appears to be a broader zone of veinlets and stock works.
The Main, Minas, and Este areas are generally structurally controlled along a predominant
north-northwest strike. The Este area is limited by the overlying post mineral tuff.
Mineralization in surface outcrops, and drill core is generally associated with iron and
manganese oxides, barite, and silica. Silicification is both pervasive and structurally controlled
in veins.
The resource database includes collar locations, down hole survey data, assay, and composite
data from 470 drill holes, 25 surface trenches totalling 85,198 m of drilling, and 2,924 m of
trenching. The resource database includes data available as of May 2015. RPA understands
that no additional drilling was completed on the Corani deposit after 2011.
A total of 34,649 assay samples and 8,872 composite samples were included in the database.
Each of the sampled intervals was assayed for Ag, Pb, Zn, Cu, and some for Au.
Assays were composited by GRE to nominal eight metre length composites respecting rock
type lengths starting from the collar of each drill hole. GRE utilized a technique that changed
the composite length slightly within each rock type in order to have composites of equal length
that respected the lithological boundaries As a result, composite length as small as 0.4 m and
as long as 10.65 m were included in the composite table. These composite values were used
to interpolate grade into the resource blocks. RPA understands that neither assay nor
composite were capped to limit the influence of high grade samples.

www.rpacan.com
Bear Creek Mining Corporation – Santa Ana Project, Project #2426 Technical Review – May 29, 2015
Page 16-3
A 3D block model comprising blocks that were 15 m by 15 m by 8 m in the X, Y, and Z directions
was created by GRE. The model was intersected with the topographic DTM to exclude whole
blocks that extended above the surface.
BCM collected data for density determinations on a regular basis. In total, 964 density
measurements were documented within the assay table.
RPA was not provided with information on block grade estimation procedures, or Mineral
Resource classification methodology. RPA completed a visual review on vertical and plan
sections throughout the Corani deposit, and is of the opinion that the classification is driven by
detailed block-by-block attributes generated by geostatistical estimation methods and not by
the continuity of geology and mineralization. The result is an output in which individual drill
holes are surrounded by halos of Measured, Indicated, and Inferred Resource blocks, and
isolated small “islands” of one classification embedded in another.
RPA further examined the continuity of Measured and Indicated blocks within the resource pit
shell. Measured blocks regularly occurred in isolation, or in small groups surrounding a drill
hole imbedded in continuous areas of Indicated blocks. Several isolated blocks of Inferred
were also noted. It is RPA’s opinion that these blocks should be manually reclassified to
Indicated to smooth out the classification and provide a more continuous domain for mine
designs and Mineral Reserve estimation. This will likely result in a material decrease in the
tonnage and contained metals within the Measured Mineral Resources in the Corani deposit,
but would be accompanied by an increase in tonnage and grade of Indicated Mineral
Resources. The reclassification of Inferred Mineral Resources is limited to a few blocks, and
in RPA’s opinion would not have a material impact on the Mineral Resource estimate.
The Mineral Resources used, reported exclusive of Mineral Reserves, are presented in Table
17-1.

www.rpacan.com
Bear Creek Mining Corporation – Santa Ana Project, Project #2426 Technical Review – May 29, 2015
Page 16-4
TABLE 17-1 CORANI MINERAL RESOURCES (MAY 2015, EXCLUSIVE OF RESERVES)
Bear Creek Mining Corporation - Corani Project
Category Tonnes Silver Lead Zinc Contained Silver
Contained Lead
Contained Zinc
kt g/t % % Moz Mlb Mlb Measured 9,353 28.8 0.53 0.30 8.7 108.4 61.6 Indicated 64,059 26.1 0.48 0.36 53.7 682.2 512.8
Measured + Indicated 73,413 26.4 0.49 0.35 62 791 574 Inferred 31,231 40.6 0.74 0.51 40.8 510.6 352.4
1. CIM definitions were followed for Mineral Resources. 2. The Mineral Resource is the tonnage contained within the 30$/oz silver, 1.425 $/lb lead, and 1.50 $/lb zinc prices
Whittle pit using a 20 $/oz silver, 0.95 $/lb lead, and 1.00 $/lb zinc prices at a cut-off of 11 $/tonne NSR.
The current Corani Mineral Resource estimate is based on an updated resource estimation by
GRE in 2015.
RPA completed a check estimate on the Corani Mineral Resources to validate the tonnage
and grade reported in Table 17-1. There was excellent agreement between RPA’s tabulated
tonnes and grade for each metal and GRE’s reported figures.
RPA OBSERVATIONS AND CONCLUSIONS It is RPA’s opinion that the drill hole database is adequate to support a Mineral Resource
estimate. The composite lengths are appropriate. Assay, composite, and block model
statistics were not provided to RPA, and search parameters used for metal grade interpolation
into the block models are not known. RPA was able to confirm the grades and tonnages of
the Corani Mineral Resource estimate as reported by GRE.

www.rpacan.com
Bear Creek Mining Corporation – Santa Ana Project, Project #2426 Technical Review – May 29, 2015
Page 16-5
MINING AND MINERAL RESERVES MINERAL RESERVES The Mineral Reserves used as a basis for the life of mine plan are presented in Table 17-2.
TABLE 17-2 CORANI MINERAL RESERVES (MAY 2015) Bear Creek Mining Corporation - Corani Project
Category Tonnes Silver Lead Zinc Contained
Silver Contained
Lead Contained
Zinc kt g/t % % Moz Mlb Mlb
Proven 19,855 69.1 1.09 0.72 44.1 478.7 313.4 Probable 117,843 48.6 0.88 0.57 184.3 2,289.2 1,470.7
Proven + Probable 137,698 51.6 0.91 0.59 228 2,768 1,784
1. CIM definitions were followed for Mineral Reserves 2. Mineral Reserve is contained within the $20/oz Ag designed pit and utilizes variable NSR cut-off grades
to maximize early cash flows.
Mining extraction and dilution factors were not applied to convert the Mineral Resources to
Mineral Reserves. The Mineral Reserve contains Measured and Indicated Resources within
the designed pit, using various elevated cut-offs for different time periods and mill feed needs.
RPA is of the opinion that some consideration for dilution and mining extraction should be
applied to the Mineral Reserves.
Low grade ore was not stockpiled due to the likelihood of the mineralization oxidizing over
time. In RPA’s opinion, low grade ore, which is above the economic cut-off but not included in
the LOM, should be stockpiled separately from waste for potential future processing. MINING Mining is planned to be carried out at a rate of 7.8 Mt over a mine life of 18 years. The mine
plan includes the entire Mineral Reserves shown in Table 17-2 and the movement of 232 Mt
of waste for a stripping ratio of 1.68 (waste:ore) and total material mined of 369 Mt over the
LOM.
Mining will be carried out using front end loaders (FELs) and 136 tonne capacity haul trucks
and standard support equipment. Equipment requirements over the LOM are based on
detailed haul routes, equipment manufacturer’s ratings, and assumed equipment utilizations
and availabilities. Appropriate considerations were made for working in altitude. In RPA’s
opinion, the work carried out by GRE was done to industry standards.

www.rpacan.com
Bear Creek Mining Corporation – Santa Ana Project, Project #2426 Technical Review – May 29, 2015
Page 16-6
RPA OBSERVATIONS AND CONCLUSIONS • No dilution and extraction factors were incorporated in the Mineral Reserve estimate.
RPA recommends the use of 5% and 95% for dilution and mining extraction factors respectively.
• Low grade material should be stockpiled separately from waste.
• In RPA’s opinion, the design of the open pits, production schedule, and equipment
selected to carry out the operation is reasonable.
METALLURGICAL TESTWORK AND MINERAL PROCESSING RPA reviewed the metallurgical information presented in the 2011 Corani Feasibility Study
(2011 Corani FS) (M3, 2011). From 2005 to 2011, metallurgical testing was undertaken to
understand the mineral deposit as a whole and the composite samples used in testing
appeared to span the mineralogical range of the Corani ores (mixed sulphide and transitional).
Testing evaluated grindability, grind size, lead and zinc flotation (ore variability and
optimization), flotation reagents, and locked cycle flotation performance. Metallurgical
testwork results were used for process flowsheet design and metal recoveries were used in
mine design calculations.
To update the Corani FS, GRE applied a geometallurgical approach to improve lead, zinc, and
silver recoveries (GRE, 2015a–c). Metallurgical data from 2005 to 2011 was assembled into
a single database for evaluation. Mineralogical drivers of recovery were identified and
validated and a statistical model for predicting lead and zinc recovery from geologic log
observations was developed and silver recovery was predicted from information related to
lead. Model equations were applied to each block in the block model to produce recovery
predictions for every block. The updated model for lead, zinc and silver recovery more closely
matches metallurgical test results.
RPA OBSERVATIONS AND CONCLUSIONS
• In RPA’s opinion, the metallurgical testing carried out is appropriate for the level of study and supports the process design.
• RPA is in agreement with the geometallurgical approach to modelling lead, zinc, and silver recoveries and the concentrate grades and recoveries achieved are reasonable.

www.rpacan.com
Bear Creek Mining Corporation – Santa Ana Project, Project #2426 Technical Review – May 29, 2015
Page 16-7
INFRASTRUCTURE The mine is located 30 km from a new high-voltage power line with abundant capacity to meet
the Project needs. The project has technically and environmentally favorable sites for tailing
and waste rock storage. Additionally the mine plan is amenable to sequenced backfilling of
the pit, reducing operating costs, and eliminating environmental pit lake liability at closure.
Access to the mining operations will be via a new 63 km road to be built over generally flat and
gently sloping topography. The new mine access road will connect at the town of Macusani to
the Interoceanic Highway; a two-lane, paved highway connecting to the Peruvian highway
system and to the Port of Matarani.
RPA OBSERVATIONS AND CONCLUSIONS • In RPA’s opinion the Corani Project has favorable infrastructure to support the mining
operation.
ENVIRONMENTAL AND SOCIAL ASPECTS RPA reviewed the information on environmental studies, permitting and social or community
impact presented in the 2011 Corani FS (M3, 2011). Key areas of consideration included:
• Environmental baseline studies (air, noise, groundwater, surface water, biological, and geochemical, and geochemical and groundwater characterization).
• Permits required to execute the Corani Project.
• Reclamation and Closure (includes general site conditions, project components such
as open pit areas, waste rock facilities, surface water management, water collection pond systems, plant facilities and related infrastructure, fresh water dam, and the tailings storage facility (TSF), monitoring and maintenance, and closure schedule).
• Socioeconomics and Community (to continue with community relations activities and to develop methods to address any identified community impacts and enhance the economic and social development opportunities).
RPA OBSERVATIONS AND CONCLUSIONS
• RPA’s review of available data suggests that BCM was in compliance and intended to comply with the Peruvian permitting process and to demonstrate corporate social responsibility.

www.rpacan.com
Bear Creek Mining Corporation – Santa Ana Project, Project #2426 Technical Review – May 29, 2015
Page 16-8
CAPITAL COSTS Capital costs over the LOM total $751 M comprising $628 M initial capital, $71 M sustaining
capital, and $53 M reclamation and closure. Capital costs are presented in Table 17-3.
TABLE 17-3 CAPITAL COST SUMMARY Bear Creek Mining Corporation – Corani Project
Area Units Cost Direct Cost Mining $ '000 55,010 Processing & Infrastructure $ '000 401,431 Total Direct Cost $ '000 456,441 Indirects and Owner’s Costs $ '000 89,721 Subtotal Costs $ '000 546,163 Contingency (15%) $ '000 81,924 Initial Capital Cost $ '000 628,087 Sustaining Capital $ '000 71,163 Reclamation and Closure $ '000 52,710 Total Capital Cost $ '000 751,959
RPA OBSERVATIONS AND CONCLUSIONS
• Contingency of 15%, applied to total contracted costs, is reasonable.
• In RPA’s opinion, capital cost estimates were carried out to a level of detail appropriate for this level of study.
OPERATING COSTS The operating costs used in the Corani FS are presented in Table 17-4.
TABLE 17-4 OPERATING COSTS – FSU BASE CASE Bear Creek Mining Corporation – Santa Ana Project
Area Units Cost
Mine $/t milled 5.19 Process $/t milled 8.77 General & Administration $/t milled 1.55 Total $/t milled 15.50

www.rpacan.com
Bear Creek Mining Corporation – Santa Ana Project, Project #2426 Technical Review – May 29, 2015
Page 16-9
A summary of the key criteria is provided below in Table 17-5 for the Corani FS.
TABLE 17-5 PROJECT CASH FLOW PARAMETERS SUMMARY Bear Creek Mining Corporation – Corani Project
Parameter Units Corani FS
Production Rate Mtpa 7.8 Mine Life years 18 Total Ore Production Mt 138 Silver Price $/oz Ag 20.00 Lead Price $/lb Pb 0.95 Zinc Price $/lb Zn 1.00 Silver Recovery % 73.0 Lead Recovery % 64.0 Zinc Recovery % 55.0 Silver Recovered koz 164 Lead Recovered kt 789 Zinc Recovered kt 486 Lead Concentrate kt 1,394 Payable Silver koz 146 Payable Lead kt 747 Zinc Concentrate kt 919.2 Payable Silver koz 5.5 Payable Zinc kt 413 TC/RC & Transport $M 831 Net Revenue $M 4,663 Operating Cost $/t milled 15.50 Capital Cost $M 752 Undiscounted Pre-Tax Cash Flow $M 1,776
RPA OBSERVATIONS AND CONCLUSIONS
• In RPA’s opinion, operating cost estimates were carried out to a level of detail appropriate for this level of study.

www.rpacan.com
Bear Creek Mining Corporation – Santa Ana Project, Project #2426 Technical Review – May 29, 2015
Page 17-1
17 SIGNATURE PAGE This report titled “Technical Review of the Santa Ana Project and Corani Project, Puno, Peru”
and dated May 29, 2015 was prepared and signed by the following authors:
Graham G. Clow, P.Eng. Principal Mining Engineer Ian C. Weir, P.Eng Senior Mining Engineer Kathleen Ann Altman, Ph.D., P.E. Principal Metallurgist Katharine Masun, M.Sc., P.Geo. Senior Geologist

www.rpacan.com
Bear Creek Mining Corporation – Santa Ana Project, Project #2426 Technical Review – May 29, 2015
Page 18-1
18 SOURCES OF INFORMATION SANTA ANA 0911 - Santa Ana Financial Model 12OCT10 Rev 2 - finer crush - Herbs Rec.xls Ausenco Vector, Bear Creek Mining Company S.A. Proyecto Santa Ana Informe de Ingenieria
Estudio de Factibilidad Definitiva, January 21, 2011. ALS Bottle Roll Test Data. Bear Creek Mining Corporation, Revised Feasibility Study, Santa Ana Project - Puno, Peru NI
43-101 Technical Report, Update to the 21-Oct-2010 Report; Dated April 1, 2011 Bear Creek Mining Corporation, Feasibility Study, Santa Ana Project, Puno, Perú, NI 43-101
Technical Report; dated October 21, 2010 Bear Creek Mining Corporation, Proyecto Santa Ana, Resumen Ejecutivo; dated December
2010 (Environmental Impact Assessment) Bear Creek Mining Corporation, Revised Feasibility Study, Santa Ana Project - Puno, Peru NI
43-101 Technical Report, Update to the 21-Oct-2010 Report; Dated April 1, 2011. Bear Creek Mining Corporation, Feasibility Study, Santa Ana Project, Puno, Perú, NI 43-101
Technical Report; dated October 21, 2010. International Mining Consultants, 2010a, 5mContourTopo_PSAD56.dxf International Mining Consultants, 2010b, Basic_Stats_3Apr2015.xlsx International Mining Consultants, 2010c, ContractorCost_EngineersEstimate_3Apr15.xls International Mining Consultants, 2010d, HaulProfileTransferMemo_27Aug10.pdf International Mining Consultants, 2010e, Haulprof9aug.xls International Mining Consultants, 2010f, Mine_Cost_Summary_Spreadsheets_15Sep.xls International Mining Consultants, 2010g, Mine_Equipment_Summary_3Apr2015.doc International Mining Consultants, 2010h, ReservePit.dxf International Mining Consultants, 2010i, ResourceFloatingCone.dxf International Mining Consultants, 2010j, SA_Assay_Information_18Apr15.zip International Mining Consultants, 2010k, SA_Composite_Information_18Apr15.zip International Mining Consultants, 2010l, SA_model2010.zip

www.rpacan.com
Bear Creek Mining Corporation – Santa Ana Project, Project #2426 Technical Review – May 29, 2015
Page 18-2
InfoMine, 2011, Mine Cost Services, Cost Models Section. Laboratorio Plenge, Metallurgical Investigation No, 6537-6546, Bear Creek Mining Company,
Cyanidation and Flotation, February 20, 2007. McClelland Laboratories, Inc., Report on Heap Leach, Pulp Agglomeration Heap Leach
Amenability Evaluation – Santa Ana High-Grade and Heap-Grade Core Composites, February 15, 2008.
McClelland Laboratories, Inc., Report on Phase 2 Metallurgical Evaluation – Santa Ana Core
Composite (DDH-SA-MET; drill holes 01, 02A, 03), March 23, 2011. Process Flowsheets and Other Design Documents by Heap Leaching Consulting S.A.C. Santa Ana Resource Update and Preliminary Economic Assessment, IMC Inc, Vector Peru
S.A.C, Resource Development, Inc., May 26, 2009
CORANI Global Resource Engineering, 2015a, GRE Analysis for RPA.xls (May 22, 2015). Global Resource Engineering, 2015b, Summary of Geometallurgical Methods (May 22, 2015). Global Resource Engineering, 2015c, GRE Notes for RPA (May 22, 2015). Global Resource Engineering, 2015d, 140135-1027 Basis of Capital Cost Estimate.docx Global Resource Engineering, 2015e, 40135 - Corani Bankable Study - RF100 Capex
05082015.pdf Global Resource Engineering, 2015f, Corani_BM_20150428.zip Global Resource Engineering, 2015g, Corani_Fin_Model_140135_R13_100%._Lease_
Purchase.xlsx Global Resource Engineering, 2015h, Corani Owner Cost 2015 Update Rev1.xlsx Global Resource Engineering, 2015i, Corani_Whtl_Results_V4.xlsx Global Resource Engineering, 2015j, Economic Model_Working_20150522.pdf Global Resource Engineering, 2015k, GRE_Corani Economic Model 20150522_RF100.xlsx Global Resource Engineering, 2015l, RPA K&S BCM Corani CF.xlsm Global Resource Engineering, 2015m, reserve_pit.dxf Global Resource Engineering, 2015n, resource_pit.dxf Global Resource Engineering, 2015o, resource and reserve-4.xlsx

www.rpacan.com
Bear Creek Mining Corporation – Santa Ana Project, Project #2426 Technical Review – May 29, 2015
Page 18-3
Global Resource Engineering, 2015p, topo.dxf M3 Engineering & Technology Corporation, 2011, Corani Project, Form NI 43-101F1 Technical
Report, Feasibility Study, Puno, Peru, Revision 0, prepared for Bear Creek Mining Corporation (December, 2011).

www.rpacan.com
Bear Creek Mining Corporation – Santa Ana Project, Project #2426 Technical Review – May 29, 2015
Page 19-1
19 APPENDIX A RPA REVISED FSU BASE CASE CASH FLOW

Date: Santa Ana RPA 2010 2011 2012 2013 2014 2015 2016 2017 2018 2019 2020 2021 2022 2023 2024 2025INPUTS INPUTS UNITS TOTAL Year -3 Year -2 Year -1 Year 1 Year 2 Year 3 Year 4 Year 5 Year 6 Year 7 Year 8 Year 9 Year 10 Year 11 Year 12 Year 13 Year 14-18
MININGOpen Pit Mining
Operating Days 4,050 4,410 days 4,410 90 360 360 360 360 360 360 360 360 360 360 360 360 -Tonnes milled per day 9,155 10,418 tonnes / day 10,418 6,644 11,389 10,914 11,372 12,647 10,250 10,000 10,000 10,000 10,000 10,000 10,000 9,389 -Tonnes moved per day 27,087 24,876 tonnes / day 24,876 35,664 31,246 31,822 32,366 32,521 31,107 28,844 28,422 24,256 21,480 14,364 10,000 9,389 -
Production 37,077 45,944 '000 tonnes 45,944 598 4,100 3,929 4,094 4,553 3,690 3,600 3,600 3,600 3,600 3,600 3,600 3,380 -Au 0.01 0.01 g/t 0.01 0.01 0.01 0.01 0.01 0.01 0.01 0.01 0.01 0.01 0.01 0.01 0.01 0.01 -Ag 53.00 44.90 g/t 44.90 39.10 46.96 50.51 48.70 45.83 50.65 48.28 46.11 43.16 40.81 38.90 38.90 38.90 -Waste 72,627 63,760 '000 tonnes 63,760 2,612 7,148 7,527 7,558 7,155 7,509 6,784 6,632 5,132 4,133 1,571 - - -Total Moved 109,704 109,704 '000 tonnes 109,704 3,210 11,248 11,456 11,652 11,708 11,199 10,384 10,232 8,732 7,733 5,171 3,600 3,380 -Stripping Ratio 1.39 w:o 1.39 4.37 1.74 1.92 1.85 1.57 2.03 1.88 1.84 1.43 1.15 0.44 - - -
Contained Ounces 63,180 66,325 koz 66,325 752 6,190 6,381 6,410 6,708 6,009 5,588 5,337 4,995 4,724 4,502 4,502 4,227 -
Crusher FeedProduction 34,113 42,980 '000 tonnes 42,980 415 3,185 3,600 3,600 3,600 3,600 3,600 3,600 3,600 3,600 3,600 3,600 3,380 -Au 0.01 0.01 g/t 0.01 0.01 0.01 0.01 0.01 0.01 0.01 0.01 0.01 0.01 0.01 0.01 0.01 0.01 -Ag 55.01 45.94 g/t 45.94 42.94 51.68 52.53 51.32 50.02 51.23 48.28 46.11 43.16 40.81 38.90 38.90 38.90 -Waste 72,627 63,760 '000 tonnes 63,760 2,612 7,148 7,527 7,558 7,155 7,509 6,784 6,632 5,132 4,133 1,571 - - -Total Moved 106,740 106,740 '000 tonnes 106,740 3,027 10,333 11,127 11,158 10,755 11,109 10,384 10,232 8,732 7,733 5,171 3,600 3,380 -Stripping Ratio 1.96 1.48 w:o 1.48 6.29 2.24 2.09 2.10 1.99 2.09 1.88 1.84 1.43 1.15 0.44 - - -
Contained Ounces 57,317 63,478 koz 63,478 573 5,292 6,080 5,940 5,789 5,930 5,588 5,337 4,995 4,724 4,502 4,502 4,227 -
StockpileOpening
Tonnes '000 tonnes - - 183 1,098 1,427 1,921 2,874 2,964 2,964 2,964 2,964 2,964 2,964 2,964 2,744Ag Grade g/t - - 30.39 30.51 30.03 29.92 29.94 29.87 29.87 29.87 29.87 29.87 29.87 29.87 29.87Au Grade g/t - - - - - - - - - - - - - - -
AdditionTonnes 2,964 2,964 '000 tonnes 2,964 183 915 329 494 953 90 - - - - - - - -Ag Grade 29.87 29.87 g/t 29.87 30.39 30.54 28.40 29.60 30.00 27.50 - - - - - - - -Au Grade - - g/t - - - - - - - - - - - - - -
DeductionTonnes 2,964 2,964 '000 tonnes 2,964 - - - - - - - - - - 220 2,744Ag Grade 29.87 29.87 g/t 29.87 30.54 30.51 30.03 29.92 29.94 29.87 29.87 29.87 29.87 29.87 29.87 29.87 29.87Au Grade g/t - - - - - - - - - - - - - -
ClosingTonnes '000 tonnes - 183 1,098 1,427 1,921 2,874 2,964 2,964 2,964 2,964 2,964 2,964 2,964 2,744 -Ag Grade g/t - 30.39 30.51 30.03 29.92 29.94 29.87 29.87 29.87 29.87 29.87 29.87 29.87 29.87 -Au Grade g/t - - - - - - - - - - - -
PROCESSINGMill Feed 37,077 45,944 '000 tonnes 45,944 3,600 3,600 3,600 3,600 3,600 3,600 3,600 3,600 3,600 3,600 3,600 3,600 2,744
Au 0.01 0.01 g/t 0.01 0.01 0.01 0.01 0.01 0.01 0.01 0.01 0.01 0.01 0.01 0.01 0.01 0.01Ag 53.00 44.90 g/t 44.90 50.67 52.53 51.32 50.02 51.23 48.28 46.11 43.16 40.81 38.90 38.90 38.35 29.87Contained Au 7,152 7,508 oz 7,509 588 588 588 588 588 588 588 588 588 588 588 588 448Contained Ag 63,179,803 66,324,692 oz 66,324,692 5,864,712 6,080,324 5,939,622 5,788,870 5,929,572 5,587,868 5,336,615 4,994,910 4,723,557 4,502,455 4,502,455 4,438,578 2,635,155
Current Year RecoveryAu 100.0% 100.0% % 100% 100% 100% 100% 100% 100% 100% 100% 100% 100% 100% 100% 100% 100%Ag 65.8% 65.8% % 66% 66% 66% 66% 66% 66% 66% 66% 66% 66% 66% 66% 66% 66%
Previous Year Residual RecoveryAu 0.0% 0.0% % 0% 0% 0% 0% 0% 0% 0% 0% 0% 0% 0% 0% 0% 0%Ag 9.2% 9.2% % 9% 9% 9% 9% 9% 9% 9% 9% 9% 9% 9% 9% 9% 9%
Net RecoveryAu 67% 67% % 67% 67% 61% 62% 63% 62% 64% 66% 68% 70% 71% 71% 72% 76%Ag 75% 75% % 75% 75% 75% 75% 75% 75% 75% 75% 75% 75% 75% 75% 75% 75%Total Average Recovery 75% 75% % 75% 75% 75% 75% 75% 75% 75% 75% 75% 75% 75% 75% 75% 75%
Current Year RecoveryAu 6,930 7,509 oz 7,509 588 588 588 588 588 588 588 588 588 588 588 588 448Ag 41,577,170 43,646,749 oz 43,646,749 3,859,432 4,001,321 3,908,728 3,809,522 3,902,114 3,677,247 3,511,903 3,287,035 3,108,464 2,962,961 2,962,961 2,920,926 1,734,135
Previous Year Residual RecoveryAu - - oz - - - - - - - - - - - - - -Ag 5,807,682 6,096,770 oz 6,096,770 - 539,102 558,922 545,988 532,131 545,064 513,654 490,558 459,148 434,204 413,879 413,879 408,008 242,232
Total RecoveredAu 4,788 5,033 oz 5,033 395 361 365 371 367 377 387 399 410 418 419 422 341 - Ag 47,384,852 49,743,519 oz 49,743,519 3,859,432 4,540,423 4,467,650 4,355,510 4,434,245 4,222,311 4,025,557 3,777,593 3,567,612 3,397,165 3,376,841 3,334,805 2,142,143 242,232
REVENUEMetal Prices Input UnitsAu US$950 /oz Au US$1375 /oz Au US$/oz Au 1,375$ 1,505$ 1,502$ 1,515$ 1,539$ 1,316$ 1,316$ 1,316$ 1,316$ 1,316$ 1,316$ 1,316$ 1,316$ 1,316$ 1,316$ Ag US$14.50 /oz Ag US$24.71 /oz Ag US$/oz Ag 24.71$ 33.20$ 31.83$ 30.78$ 22.21$ 22.21$ 22.21$ 22.21$ 22.21$ 22.21$ 22.21$ 22.21$ 22.21$ 22.21$ 22.21$
Exchange Rate 1.00$ 1.00$ US$/ US$ 1.00$ 1.00$ 1.00$ 1.00$ 1.00$ 1.00$ 1.00$ 1.00$ 1.00$ 1.00$ 1.00$ 1.00$ 1.00$ 1.00$ 1.00$ 1.00$ 1.00$ 1.00$
Au Payable Percentage 95.00% 95.00% US$ '000 95% 95% 95% 95% 95% 95% 95% 95% 95% 95% 95% 95% 95% 95% 95%Ag Payable Percentage 99.75% 99.75% US$ '000 100% 99.75% 99.75% 99.75% 99.75% 99.75% 99.75% 99.75% 99.75% 99.75% 99.75% 99.75% 99.75% 99.75% 99.75%Au Payable oz 4,781 376 343 347 352 348 358 368 379 389 398 398 400 324 -Ag Payable oz 49,619,160 3,849,783 4,529,072 4,456,481 4,344,621 4,423,159 4,211,755 4,015,493 3,768,149 3,558,692 3,388,672 3,368,399 3,326,468 2,136,787 241,626
Au Gross Revenue 4,321$ 6,574$ US$ '000 6,574$ 565$ 516$ 525$ 542$ 458$ 471$ 484$ 499$ 512$ 523$ 524$ 527$ 427$ -$ Ag Gross Revenue 685,363$ 1,226,112$ US$ '000 1,226,112$ 127,813$ 144,160$ 137,170$ 96,494$ 98,238$ 93,543$ 89,184$ 83,691$ 79,039$ 75,262$ 74,812$ 73,881$ 47,458$ 5,367$ Total Gross Revenue 689,683$ 1,232,686$ US$ '000 1,232,686$ 128,378$ 144,676$ 137,696$ 97,036$ 98,697$ 94,015$ 89,668$ 84,190$ 79,551$ 75,785$ 75,336$ 74,408$ 47,885$ 5,367$
Transport & TreatmentAu US$ '000 -$ -$ -$ -$ -$ -$ -$ -$ -$ -$ -$ -$ -$ -$ -$ Ag US$0.63 /oz Ag US$0.63 /oz Ag US$ '000 31,260$ 2,425$ 2,853$ 2,808$ 2,737$ 2,787$ 2,653$ 2,530$ 2,374$ 2,242$ 2,135$ 2,122$ 2,096$ 1,346$ 152$
Total Charges 29,778$ 31,260$ US$ '000 31,260$ 2,425$ 2,853$ 2,808$ 2,737$ 2,787$ 2,653$ 2,530$ 2,374$ 2,242$ 2,135$ 2,122$ 2,096$ 1,346$ 152$
Net Smelter Return 659,906$ 1,201,426$ US$ '000 1,201,426$ 125,953$ 141,823$ 134,888$ 94,299$ 95,910$ 91,361$ 87,138$ 81,816$ 77,309$ 73,651$ 73,214$ 72,312$ 46,538$ 5,214$
Royalty NSR 1% 1% US$ '000 7,718$ 600$ 600$ 600$ 600$ 600$ 600$ 600$ 600$ 600$ 600$ 600$ 600$ 465$ 52$ 2% 2% US$ '000 7,740$ 1,200$ 1,200$ 1,200$ 686$ 718$ 627$ 543$ 436$ 346$ 273$ 264$ 246$ -$ -$ 3% 3% US$ '000 1,280$ 179$ 655$ 447$ -$ -$ -$ -$ -$ -$ -$ -$ -$ -$ -$
47,998$ Net Revenue 652,707$ 1,184,688$ US$ '000 1,184,688$ 123,974$ 139,368$ 132,641$ 93,013$ 94,592$ 90,134$ 85,995$ 80,780$ 76,363$ 72,778$ 72,350$ 71,466$ 46,073$ 5,162$ Unit NSR 17.60$ 25.79$ US$/t milled 25.79$ 34.44$ 38.71$ 36.84$ 25.84$ 26.28$ 25.04$ 23.89$ 22.44$ 21.21$ 20.22$ 20.10$ 19.85$ 16.79$ -$
CUT-OFF GRADE
OPERATING COSTMining (Open Pit) 1.68$ 2.10$ US$/t moved 2.10$ 3.15$ 2.02$ 2.04$ 2.09$ 2.08$ 2.11$ 2.11$ 1.95$ 1.93$ 2.13$ 2.21$ 2.21$ 2.21$ 1.38$ -$ Crusher to Plant (Open Pit) 0.71$ 0.71$ US$/t moved 0.71$ 0.71$ 0.71$ 0.71$ 0.71$ 0.71$ 0.71$ 0.71$ 0.71$ 0.71$ 0.71$ 0.71$ 0.71$ 0.71$ 0.71$ 0.71$ Mining (Open Pit) 5.60$ 5.48$ US$/t milled 5.48$ -$ 6.51$ 7.03$ 7.19$ 6.93$ 7.22$ 6.81$ 6.27$ 5.39$ 5.28$ 3.89$ 2.92$ 2.87$ 2.09$ -$ Processing 3.49$ 3.49$ US$/t milled 3.49$ 3.49$ 3.49$ 3.49$ 3.49$ 3.49$ 3.49$ 3.49$ 3.49$ 3.49$ 3.49$ 3.49$ 3.49$ 3.49$ 3.49$ 4.49$ G&A 1.17$ 1.45$ US$/t milled 1.45$ -$ 1.45$ 1.45$ 1.45$ 1.45$ 1.45$ 1.45$ 1.45$ 1.45$ 1.45$ 1.45$ 1.45$ 1.45$ 1.45$ 1.45$ Total Unit Operating Cost 10.26$ 10.41$ US$/t milled 10.41$ 3.49$ 11.45$ 11.97$ 12.13$ 11.87$ 12.16$ 11.75$ 11.21$ 10.33$ 10.22$ 8.83$ 7.86$ 7.81$ 7.03$ 5.94$
Mining (Open Pit) 189,681$ 228,475$ US$ '000 228,475$ 9,533$ 20,873$ 22,738$ 23,341$ 22,376$ 23,429$ 21,953$ 20,000$ 16,847$ 16,441$ 11,432$ 7,957$ 7,773$ 3,782$ -$ Crusher to Plant (Open Pit) 26,173$ 32,620$ US$ '000 32,620$ -$ 2,556$ 2,556$ 2,556$ 2,556$ 2,556$ 2,556$ 2,556$ 2,556$ 2,556$ 2,556$ 2,556$ 2,556$ 1,948$ -$ Processing 129,274$ 160,190$ US$ '000 160,190$ -$ 12,552$ 12,552$ 12,552$ 12,552$ 12,552$ 12,552$ 12,552$ 12,552$ 12,552$ 12,552$ 12,552$ 12,552$ 9,567$ -$ G&A 43,380$ 66,753$ US$ '000 66,753$ -$ 5,231$ 5,231$ 5,231$ 5,231$ 5,231$ 5,231$ 5,231$ 5,231$ 5,231$ 5,231$ 5,231$ 5,231$ 3,987$ -$ Total Operating Cost 388,508$ 488,038$ US$ '000 488,038$ 9,533$ 41,212$ 43,076$ 43,680$ 42,715$ 43,767$ 42,291$ 40,338$ 37,185$ 36,779$ 31,770$ 28,295$ 28,111$ 19,285$ -$
Operating Cashflow 264,199$ 696,650$ US$ '000 696,650$ (9,533)$ 82,763$ 96,292$ 88,962$ 50,298$ 50,825$ 47,843$ 45,657$ 43,594$ 39,583$ 41,008$ 44,055$ 43,355$ 26,788$ 5,162$
CAPITAL COSTDirect Cost
Mining US$ '000 -$ -$ -$ -$ -$ -$ -$ -$ -$ -$ -$ -$ -$ -$ -$ Processing 16,874$ 16,874$ US$ '000 16,874$ 3,375$ 13,499$ -$ -$ -$ -$ -$ -$ -$ -$ -$ -$ -$ -$ -$ -$ Infrastructure 25,794$ 25,794$ US$ '000 25,794$ 5,159$ 20,636$ -$ -$ -$ -$ -$ -$ -$ ` -$ ` ` ` ` -$ Tailings -$ -$ US$ '000 -$ -$ -$ -$ -$ -$ -$ -$ -$ -$ -$ -$ -$ -$ -$ -$ -$
Total Direct Cost 42,669$ 42,669$ US$ '000 42,669$ -$ 8,534$ 34,135$ -$ -$ -$ -$ -$ -$ -$ -$ -$ -$ -$ -$ -$ -$
Other Costs23% Preprod Mine Dev & Equipment 9,909$ 9,909$ US$ '000 9,909$ -$ -$ 9,909$ -$ -$ -$ -$ -$ -$ -$ -$ -$ -$ -$ -$ -$ -$ 12% Owners 4,226$ 5,098$ US$ '000 5,098$ -$ -$ 5,098$ -$ -$ -$ -$ -$ -$ -$ -$ -$ -$ -$ -$ -$ -$ 19% Indirect Costs (EPCM, Freight, Insurance, etc) 7,947$ 7,947$ US$ '000 7,947$ -$ 1,589$ 6,357$ -$ -$ -$ -$ -$ -$ -$ -$ -$ -$ -$ -$ -$ -$ 2% Spare Parts 833$ 833$ US$ '000 833$ -$ -$ 833$ -$ -$ -$ -$ -$ -$ -$ -$ -$ -$ -$ -$ -$ -$
Subtotal Costs 65,583$ 66,455$ US$ '000 66,455$ -$ 10,123$ 56,331$ -$ -$ -$ -$ -$ -$ -$ -$ -$ -$ -$ -$ -$ -$ -$
14% Contingency 6,031$ 6,031$ US$ '000 6,031$ -$ 1,206$ 4,824$ -$ -$ -$ -$ -$ -$ -$ -$ -$ -$ -$ -$ -$ -$ Initial Capital Cost 71,613$ 72,485$ US$ '000 72,485$ -$ 11,329$ 61,156$ -$ -$ -$ -$ -$ -$ -$ -$ -$ -$ -$ -$ -$ -$
Sustaining 15,008$ 15,008$ US$ '000 15,008$ -$ -$ -$ 497$ 6,525$ 449$ 298$ 5,940$ 278$ 187$ 200$ 205$ 429$ -$ -$ -$ -$ Working Capital -$ -$ US$ '000 -$ -$ 440$ 1,469$ 13,746$ 2,098$ (867)$ (4,961)$ 338$ (502)$ (446)$ (536)$ (540)$ (335)$ (5)$ (229)$ (2,417)$ (7,253)$ Reclamation and closure 10,662$ 10,662$ US$ '000 10,662$ -$ -$ -$ 4$ 8$ 12$ 16$ 20$ 24$ 28$ 32$ 36$ 1,062$ 2,089$ 3,601$ 65$ 3,667$
Total Capital Cost 97,283$ 98,154$ US$ '000 98,154$ -$ 11,769$ 62,625$ 14,247$ 8,631$ (406)$ (4,648)$ 6,298$ (200)$ (231)$ (305)$ (300)$ 1,156$ 2,084$ 3,371$ (2,352)$ (3,586)$
CASH FLOWPre-Tax Cashflow 598,496$ US$ '000 598,496$ -$ (11,769)$ (72,158)$ 68,515$ 87,661$ 89,367$ 54,946$ 44,526$ 48,043$ 45,888$ 43,899$ 39,883$ 39,851$ 41,971$ 39,984$ 29,141$ 8,749$ Cumulative Pre-Tax Cashflow US$ '000 -$ (11,769)$ (83,927)$ (15,412)$ 72,249$ 161,616$ 216,562$ 261,088$ 309,131$ 355,019$ 398,918$ 438,801$ 478,652$ 520,623$ 560,607$ 589,747$ 598,496$
K&S - Santa AnaRPA - Cash Flow Summary - Revised FSU Base Case
19-2
ww
w.rp
acan
.co
m

www.rpacan.com
Bear Creek Mining Corporation – Santa Ana Project, Project #2426 Technical Review – May 29, 2015
Page 20-1
20 APPENDIX B RPA EXTENDED LIFE CASE CASH FLOW

Date: Santa Ana RPA Revised BC RPA Extended Life 2010 2011 2012 2013 2014 2015 2016 2017 2018 2019 2020 2021 2022 2023 2024 2025 2026 2027 2028 2029 2030 2031 2032 2033 2034 2035 2036 2037 2038 2039 2040INPUTS INPUTS INPUTS UNITS TOTAL Year -3 Year -2 Year -1 Year 1 Year 2 Year 3 Year 4 Year 5 Year 6 Year 7 Year 8 Year 9 Year 10 Year 11 Year 12 Year 13 Year 14 Year 15 Year 16 Year 17 Year 18 Year 19 Year 20 Year 21 Year 22 Year 23 Year 24 Year 25 Year 26 Year 27 Year 28
MININGOpen Pit Mining
Operating Days 4,050 4,410 8,370 days 8,370 90 360 360 360 360 360 360 360 360 360 360 360 360 360 360 360 360 360 360 360 360 360 360 360Tonnes milled per day 9,155 10,418 9,708 tonnes / day 9,708 6,644 11,389 10,914 11,372 12,647 10,250 10,000 10,000 10,000 10,000 10,000 10,000 10,000 10,000 10,000 10,000 10,000 10,000 10,000 10,000 10,000 10,000 7,486 -Tonnes moved per day 27,087 24,876 20,716 tonnes / day 20,716 35,664 31,246 31,822 32,366 32,521 31,107 28,844 28,422 24,256 21,480 14,364 10,000 10,000 18,085 18,085 18,085 18,085 18,085 18,085 18,085 18,085 18,085 13,539 -
Production 37,077 45,944 81,259 '000 tonnes 81,259 598 4,100 3,929 4,094 4,553 3,690 3,600 3,600 3,600 3,600 3,600 3,600 3,600 3,600 3,600 3,600 3,600 3,600 3,600 3,600 3,600 3,600 2,695 -Au 0.01 0.01 0.01 g/t 0.01 0.01 0.01 0.01 0.01 0.01 0.01 0.01 0.01 0.01 0.01 0.01 0.01 0.01 0.01 0.01 0.01 0.01 0.01 0.01 0.01 0.01 0.01 0.01 0.01Ag 53.00 44.90 41.08 g/t 41.08 39.10 46.96 50.51 48.70 45.83 50.65 48.28 46.11 43.16 40.81 38.90 38.90 38.73 36.12 36.12 36.12 36.12 36.12 36.12 36.12 36.12 36.12 36.12 - - - - -Waste 72,627 63,760 92,135 '000 tonnes 92,135 2,612 7,148 7,527 7,558 7,155 7,509 6,784 6,632 5,132 4,133 1,571 - - 2,911 2,911 2,911 2,911 2,911 2,911 2,911 2,911 2,911 2,179 -Total Moved 109,704 109,704 173,394 '000 tonnes 173,394 3,210 11,248 11,456 11,652 11,708 11,199 10,384 10,232 8,732 7,733 5,171 3,600 3,600 6,511 6,511 6,511 6,511 6,511 6,511 6,511 6,511 6,511 4,874 -Stripping Ratio 1.39 1.13 w:o 1.13 4.37 1.74 1.92 1.85 1.57 2.03 1.88 1.84 1.43 1.15 0.44 - - 0.81 0.81 0.81 0.81 0.81 0.81 0.81 0.81 0.81 0.81 - - - - -
Contained Ounces 63,180 66,325 107,332 '000 ounces
Crusher FeedProduction 34,113 42,980 78,295 '000 tonnes 78,295 415 3,185 3,600 3,600 3,600 3,600 3,600 3,600 3,600 3,600 3,600 3,600 3,600 3,600 3,600 3,600 3,600 3,600 3,600 3,600 3,600 3,600 2,695 - - - - -Au 0.01 0.01 0.01 g/t 0.01 0.01 0.01 0.01 0.01 0.01 0.01 0.01 0.01 0.01 0.01 0.01 0.01 0.01 0.01 0.01 0.01 0.01 0.01 0.01 0.01 0.01 0.01 0.01 0.01 0.01 0.01 0.01 0.01Ag 55.01 45.94 41.51 g/t 41.51 42.94 51.68 52.53 51.32 50.02 51.23 48.28 46.11 43.16 40.81 38.90 38.90 38.73 36.12 36.12 36.12 36.12 36.12 36.12 36.12 36.12 36.12 36.12 36.12 36.12 36.12 36.12 36.12Waste 72,627 63,760 92,135 '000 tonnes 92,135 2,612 7,148 7,527 7,558 7,155 7,509 6,784 6,632 5,132 4,133 1,571 - - 2,911 2,911 2,911 2,911 2,911 2,911 2,911 2,911 2,911 2,179 - - - - -Total Moved 106,740 106,740 170,430 '000 tonnes 170,430 3,027 10,333 11,127 11,158 10,755 11,109 10,384 10,232 8,732 7,733 5,171 3,600 3,600 6,511 6,511 6,511 6,511 6,511 6,511 6,511 6,511 6,511 4,874 - - - - -Stripping Ratio 1.96 1.48 1.18 w:o 1.18 6.29 2.24 2.09 2.10 1.99 2.09 1.88 1.84 1.43 1.15 0.44 - - 0.81 0.81 0.81 0.81 0.81 0.81 0.81 0.81 0.81 0.81 - - - - -
Contained Ounces 57,317 63,478 104,485 '000 ounces 104,485 573 5,292 6,080 5,940 5,789 5,930 5,588 5,337 4,995 4,724 4,502 4,502 4,483 4,180 4,180 4,180 4,180 4,180 4,180 4,180 4,180 4,180 3,129
StockpileOpening
Tonnes '000 tonnes - - 183 1,098 1,427 1,921 2,874 2,964 2,964 2,964 2,964 2,964 2,964 2,964 2,964 2,964 2,964 2,964 2,964 2,964 2,964 2,964 2,964 2,964 2,059 (0) - - -Ag Grade g/t - - 30.39 30.51 30.03 29.92 29.94 29.87 29.87 29.87 29.87 29.87 29.87 29.87 29.87 29.87 29.87 29.87 29.87 29.87 29.87 29.87 29.87 29.87 29.87 - - - -Au Grade g/t - - - - - - - - - - - - - - - - - - - - - - - - 1.00 - - - -
AdditionTonnes 2,964 2,964 2,964 '000 tonnes 2,964 183 915 329 494 953 90 - - - - - - - - - - - - - - - - - - - - - -Ag Grade 29.87 29.87 29.87 g/t 29.87 30.39 30.54 28.40 29.60 30.00 27.50 - - - - - - - - - - - - - - - - - - - - - -Au Grade - - - g/t - - - - - - - - - - - - - - - - - - - - - - - - - - - -
DeductionTonnes 2,964 2,964 2,964 '000 tonnes 2,964 - - - - - - - - - - - - - - - - - - - - 905 2,059 - - - -Ag Grade 29.87 29.87 29.87 g/t 29.87 30.54 30.51 30.03 29.92 29.94 29.87 29.87 29.87 29.87 29.87 29.87 29.87 29.87 29.87 29.87 29.87 29.87 29.87 29.87 29.87 29.87 29.87 29.87 - - - -Au Grade g/t - - - - - - - - - - - - - - - - - - - - - - - - - - - -
ClosingTonnes '000 tonnes (0) 183 1,098 1,427 1,921 2,874 2,964 2,964 2,964 2,964 2,964 2,964 2,964 2,964 2,964 2,964 2,964 2,964 2,964 2,964 2,964 2,964 2,964 2,059 (0) (0) - - -Ag Grade g/t - 30.39 30.51 30.03 29.92 29.94 29.87 29.87 29.87 29.87 29.87 29.87 29.87 29.87 29.87 29.87 29.87 29.87 29.87 29.87 29.87 29.87 29.87 29.87 - - - - -Au Grade g/t - - - - - - - - - - - -
PROCESSINGMill Feed 37,077 45,944 81,259 '000 tonnes 81,259 3,600 3,600 3,600 3,600 3,600 3,600 3,600 3,600 3,600 3,600 3,600 3,600 3,600 3,600 3,600 3,600 3,600 3,600 3,600 3,600 3,600 3,600 2,059 - - - -
Au 0.01 0.01 0.01 g/t 0.01 0.01 0.01 0.01 0.01 0.01 0.01 0.01 0.01 0.01 0.01 0.01 0.01 0.01 0.01 0.01 0.01 0.01 0.01 0.01 0.01 0.01 0.01 0.01Ag 53.00 44.90 41.08 g/t 41.08 50.67 52.53 51.32 50.02 51.23 48.28 46.11 43.16 40.81 38.90 38.90 38.73 36.12 36.12 36.12 36.12 36.12 36.12 36.12 36.12 36.12 34.55 29.87Contained Au 7,152 7,508 13,280 oz 13,280 588 588 588 588 588 588 588 588 588 588 588 588 588 588 588 588 588 588 588 588 588 588 337 - - - -Contained Ag 63,179,803 66,324,692 107,331,911 oz 107,331,911 5,864,712 6,080,324 5,939,622 5,788,870 5,929,572 5,587,868 5,336,615 4,994,910 4,723,557 4,502,455 4,502,455 4,482,763 4,180,223 4,180,223 4,180,223 4,180,223 4,180,223 4,180,223 4,180,223 4,180,223 4,180,223 3,998,463 1,977,721 - - - -
Current Year RecoveryAu 100.0% 100.0% 97.5% % 97% 100% 100% 100% 100% 100% 100% 100% 100% 100% 100% 100% 100% 100% 100% 100% 100% 100% 100% 100% 100% 100% 100% 0%Ag 65.8% 65.8% 65.8% % 66% 66% 66% 66% 66% 66% 66% 66% 66% 66% 66% 66% 66% 66% 66% 66% 66% 66% 66% 66% 66% 66% 66% 66%
Previous Year Residual Recovery 0%Au 0.0% 0.0% 0.0% % 0% 0% 0% 0% 0% 0% 0% 0% 0% 0% 0% 0% 0% 0% 0% 0% 0% 0% 0% 0% 0% 0% 0% 0%Ag 9.2% 9.2% 9.2% % 9% 9% 9% 9% 9% 9% 9% 9% 9% 9% 9% 9% 9% 9% 9% 9% 9% 9% 9% 9% 9% 9% 9% 9%
Net RecoveryAu 67% 67% 70% % 70% 67% 61% 62% 63% 62% 64% 66% 68% 70% 71% 71% 71% 73% 73% 73% 73% 73% 73% 73% 73% 73% 74% 75%Ag 75% 75% 75% % 75% 75% 75% 75% 75% 75% 75% 75% 75% 75% 75% 75% 75% 75% 75% 75% 75% 75% 75% 75% 75% 75% 75% 75%Total Average Recovery 75% 75% 75% % 75% 75% 75% 75% 75% 75% 75% 75% 75% 75% 75% 75% 75% 75% 75% 75% 75% 75% 75% 75% 75% 75% 75% 75% - - - -
Current Year RecoveryAu 6,930 7,509 12,944 oz 12,944 588 588 588 588 588 588 588 588 588 588 588 588 588 588 588 588 588 588 588 588 588 588 - - - - -Ag 41,577,170 43,646,749 70,632,654 oz 70,632,654 3,859,432 4,001,321 3,908,728 3,809,522 3,902,114 3,677,247 3,511,903 3,287,035 3,108,464 2,962,961 2,962,961 2,950,003 2,750,908 2,750,908 2,750,908 2,750,908 2,750,908 2,750,908 2,750,908 2,750,908 2,750,908 2,631,296 1,301,492 - - - -
Previous Year Residual RecoveryAu - - - oz - - - - - - - - - - - - - - - - - - - - - - - - - - - - -Ag 5,807,682 6,096,770 9,866,279 oz 9,866,279 - 539,102 558,922 545,988 532,131 545,064 513,654 490,558 459,148 434,204 413,879 413,879 412,069 384,259 384,259 384,259 384,259 384,259 384,259 384,259 384,259 384,259 367,551 181,798 - - - -
Total RecoveredAu 4,788 5,033 9,264 oz 9,264 395 361 365 371 367 377 387 399 410 418 419 420 430 432 432 432 432 432 432 432 432 438 253 - - - - -Ag 47,384,852 49,743,519 80,498,933 oz 80,498,933 3,859,432 4,540,423 4,467,650 4,355,510 4,434,245 4,222,311 4,025,557 3,777,593 3,567,612 3,397,165 3,376,841 3,363,882 3,162,978 3,135,167 3,135,167 3,135,167 3,135,167 3,135,167 3,135,167 3,135,167 3,135,167 3,015,555 1,669,043 181,798 - - - -
REVENUEMetal Prices Input UnitsAu US$950 /oz Au US$1375 /oz Au US$1348 /oz Au US$/oz Au 1,348$ 1,505$ 1,502$ 1,515$ 1,539$ 1,316$ 1,316$ 1,316$ 1,316$ 1,316$ 1,316$ 1,316$ 1,316$ 1,316$ 1,316$ 1,316$ 1,316$ 1,316$ 1,316$ 1,316$ 1,316$ 1,316$ 1,316$ 1,316$ 1,316$ Ag US$14.50 /oz Ag US$24.71 /oz Ag US$23.76 /oz Ag US$/oz Ag 23.76$ 33.20$ 31.83$ 30.78$ 22.21$ 22.21$ 22.21$ 22.21$ 22.21$ 22.21$ 22.21$ 22.21$ 22.21$ 22.21$ 22.21$ 22.21$ 22.21$ 22.21$ 22.21$ 22.21$ 22.21$ 22.21$ 22.21$ 22.21$ 22.21$
Exchange Rate 1.00$ 1.00$ 1.00$ US$/ US$ 1.00$ 1.00$ 1.00$ 1.00$ 1.00$ 1.00$ 1.00$ 1.00$ 1.00$ 1.00$ 1.00$ 1.00$ 1.00$ 1.00$ 1.00$ 1.00$ 1.00$ 1.00$ 1.00$ 1.00$ 1.00$ 1.00$ 1.00$ 1.00$ 1.00$ 1.00$ 1.00$ 1.00$
Au Payable Percentage 95.00% 95.00% 95.00% US$ '000 95% 95% 95% 95% 95% 95% 95% 95% 95% 95% 95% 95% 95% 95% 95% 95% 95% 95% 95% 95% 95% 95% 95% 95% 95%Ag Payable Percentage 99.75% 99.75% 99.75% US$ '000 99.75% 99.75% 99.75% 99.75% 99.75% 99.75% 99.75% 99.75% 99.75% 99.75% 99.75% 99.75% 99.75% 99.75% 99.75% 99.75% 99.75% 99.75% 99.75% 99.75% 99.75% 99.75% 99.75% 99.75% 99.75%Au Payable oz 8,800 376 343 347 352 348 358 368 379 389 398 398 399 409 410 410 410 410 410 410 410 410 416 240 - - - - -Ag Payable oz 80,297,686 3,849,783 4,529,072 4,456,481 4,344,621 4,423,159 4,211,755 4,015,493 3,768,149 3,558,692 3,388,672 3,368,399 3,355,472 3,155,070 3,127,329 3,127,329 3,127,329 3,127,329 3,127,329 3,127,329 3,127,329 3,127,329 3,008,016 1,664,871 181,344 - - - -
Au Gross Revenue 4,321$ 6,574$ 11,861$ US$ '000 11,861$ 565$ 516$ 525$ 542$ 458$ 471$ 484$ 499$ 512$ 523$ 524$ 525$ 538$ 539$ 539$ 539$ 539$ 539$ 539$ 539$ 539$ 547$ 316$ -$ -$ -$ -$ -$ Ag Gross Revenue 685,363$ 1,226,112$ 1,907,482$ US$ '000 1,907,482$ 127,813$ 144,160$ 137,170$ 96,494$ 98,238$ 93,543$ 89,184$ 83,691$ 79,039$ 75,262$ 74,812$ 74,525$ 70,074$ 69,458$ 69,458$ 69,458$ 69,458$ 69,458$ 69,458$ 69,458$ 69,458$ 66,808$ 36,977$ 4,028$ -$ -$ -$ -$ Total Gross Revenue 689,683$ 1,232,686$ 1,919,344$ US$ '000 1,919,344$ 128,378$ 144,676$ 137,696$ 97,036$ 98,697$ 94,015$ 89,668$ 84,190$ 79,551$ 75,785$ 75,336$ 75,050$ 70,612$ 69,997$ 69,997$ 69,997$ 69,997$ 69,997$ 69,997$ 69,997$ 69,997$ 67,355$ 37,293$ 4,028$ -$ -$ -$ -$
Transport & TreatmentAu US$ '000 -$ -$ -$ -$ -$ -$ -$ -$ -$ -$ -$ -$ -$ -$ -$ -$ -$ -$ -$ -$ -$ -$ -$ -$ -$ -$ -$ -$ -$ Ag US$0.63 /oz Ag US$0.63 /oz Ag US$0.63 /oz Ag US$ '000 50,588$ 2,425$ 2,853$ 2,808$ 2,737$ 2,787$ 2,653$ 2,530$ 2,374$ 2,242$ 2,135$ 2,122$ 2,114$ 1,988$ 1,970$ 1,970$ 1,970$ 1,970$ 1,970$ 1,970$ 1,970$ 1,970$ 1,895$ 1,049$ 114$ -$ -$ -$ -$
Total Charges 29,778$ 31,260$ 50,588$ US$ '000 50,588$ 2,425$ 2,853$ 2,808$ 2,737$ 2,787$ 2,653$ 2,530$ 2,374$ 2,242$ 2,135$ 2,122$ 2,114$ 1,988$ 1,970$ 1,970$ 1,970$ 1,970$ 1,970$ 1,970$ 1,970$ 1,970$ 1,895$ 1,049$ 114$ -$ -$ -$ -$ -$
Net Smelter Return 659,906$ 1,201,426$ 1,868,756$ US$ '000 1,868,756$ 125,953$ 141,823$ 134,888$ 94,299$ 95,910$ 91,361$ 87,138$ 81,816$ 77,309$ 73,651$ 73,214$ 72,936$ 68,624$ 68,027$ 68,027$ 68,027$ 68,027$ 68,027$ 68,027$ 68,027$ 68,027$ 65,460$ 36,244$ 3,913$ -$ -$ -$ -$ $.00/oz Ag
Royalty NSR 1% 1% 1% US$ '000 13,602$ 600$ 600$ 600$ 600$ 600$ 600$ 600$ 600$ 600$ 600$ 600$ 600$ 600$ 600$ 600$ 600$ 600$ 600$ 600$ 600$ 600$ 600$ 362$ 39$ -$ -$ -$ -$ 2% 2% 2% US$ '000 9,319$ 1,200$ 1,200$ 1,200$ 686$ 718$ 627$ 543$ 436$ 346$ 273$ 264$ 259$ 172$ 161$ 161$ 161$ 161$ 161$ 161$ 161$ 161$ 109$ -$ -$ -$ -$ -$ -$ 3% 3% 3% US$ '000 1,280$ 179$ 655$ 447$ -$ -$ -$ -$ -$ -$ -$ -$ -$ -$ -$ -$ -$ -$ -$ -$ -$ -$ -$ -$ -$ -$ -$ -$ -$
Net Revenue 652,707$ 1,184,688$ 1,844,556$ US$ '000 1,844,556$ 123,974$ 139,368$ 132,641$ 93,013$ 94,592$ 90,134$ 85,995$ 80,780$ 76,363$ 72,778$ 72,350$ 72,077$ 67,852$ 67,267$ 67,267$ 67,267$ 67,267$ 67,267$ 67,267$ 67,267$ 67,267$ 64,751$ 35,882$ 3,874$ -$ -$ -$ -$ Unit NSR 17.60$ 25.79$ 22.70$ US$/t milled 22.70$ 34.44$ 38.71$ 36.84$ 25.84$ 26.28$ 25.04$ 23.89$ 22.44$ 21.21$ 20.22$ 20.10$ 20.02$ 18.85$ 18.69$ 18.69$ 18.69$ 18.69$ 18.69$ 18.69$ 18.69$ 18.69$ 17.99$ 17.42$ -$ -$ -$ -$ -$
CUT-OFF GRADE
OPERATING COSTMining (Open Pit) 1.68$ 2.10$ 2.10$ US$/t moved 2.10$ 3.15$ 2.02$ 2.04$ 2.09$ 2.08$ 2.11$ 2.11$ 1.95$ 1.93$ 2.13$ 2.21$ 2.21$ 2.21$ 1.38$ 2.10$ 2.10$ 2.10$ 2.10$ 2.10$ 2.10$ 2.10$ 2.10$ 2.10$ 1.38$ 1.38$Crusher to Plant (Open Pit) 0.71$ 0.71$ 0.71$ US$/t moved 0.71$ 0.71$ 0.71$ 0.71$ 0.71$ 0.71$ 0.71$ 0.71$ 0.71$ 0.71$ 0.71$ 0.71$ 0.71$ 0.71$ 0.71$ 0.71$ 0.71$ 0.71$ 0.71$ 0.71$ 0.71$ 0.71$ 0.71$ 0.71$ 0.71$ 0.71$Mining (Open Pit) 5.60$ 5.48$ 4.99$ US$/t milled 4.99$ -$ 6.51$ 7.03$ 7.19$ 6.93$ 7.22$ 6.81$ 6.27$ 5.39$ 5.28$ 3.89$ 2.92$ 2.92$ 3.20$ 4.51$ 4.51$ 4.51$ 4.51$ 4.51$ 4.51$ 4.51$ 4.51$ 3.90$ 2.09$ -$Processing 3.49$ 3.49$ 3.49$ US$/t milled 3.49$ 3.49$ 3.49$ 3.49$ 3.49$ 3.49$ 3.49$ 3.49$ 3.49$ 3.49$ 3.49$ 3.49$ 3.49$ 3.49$ 3.49$ 3.49$ 3.49$ 3.49$ 3.49$ 3.49$ 3.49$ 3.49$ 3.49$ 3.49$ 3.49$ 4.49$G&A 1.17$ 1.45$ 1.45$ US$/t milled 1.45$ -$ 1.45$ 1.45$ 1.45$ 1.45$ 1.45$ 1.45$ 1.45$ 1.45$ 1.45$ 1.45$ 1.45$ 1.45$ 1.45$ 1.45$ 1.45$ 1.45$ 1.45$ 1.45$ 1.45$ 1.45$ 1.45$ 1.45$ 1.45$ 1.45$Total Unit Operating Cost 10.26$ 10.41$ 9.93$ US$/t milled 9.93$ 3.49$ 11.45$ 11.97$ 12.13$ 11.87$ 12.16$ 11.75$ 11.21$ 10.33$ 10.22$ 8.83$ 7.86$ 7.86$ 8.14$ 9.45$ 9.45$ 9.45$ 9.45$ 9.45$ 9.45$ 9.45$ 9.45$ 8.84$ 7.03$ 5.94$
Mining (Open Pit) 189,681$ 228,475$ 357,551$ US$ '000 357,551$ 9,533$ 20,873$ 22,738$ 23,341$ 22,376$ 23,429$ 21,953$ 20,000$ 16,847$ 16,441$ 11,432$ 7,957$ 7,955$ 8,974$ 13,672$ 13,672$ 13,672$ 13,672$ 13,672$ 13,672$ 13,672$ 13,672$ 11,483$ 2,839$ -$ -$ -$ -$ -$ Crusher to Plant (Open Pit) 26,173 32,620$ 57,694$ US$ '000 57,694$ -$ 2,556$ 2,556$ 2,556$ 2,556$ 2,556$ 2,556$ 2,556$ 2,556$ 2,556$ 2,556$ 2,556$ 2,556$ 2,556$ 2,556$ 2,556$ 2,556$ 2,556$ 2,556$ 2,556$ 2,556$ 2,556$ 2,556$ 1,462$ -$ -$ -$ -$ -$ Processing 129,274$ 160,190$ 283,322$ US$ '000 283,322$ -$ 12,552$ 12,552$ 12,552$ 12,552$ 12,552$ 12,552$ 12,552$ 12,552$ 12,552$ 12,552$ 12,552$ 12,552$ 12,552$ 12,552$ 12,552$ 12,552$ 12,552$ 12,552$ 12,552$ 12,552$ 12,552$ 12,552$ 7,180$ -$ -$ -$ -$ -$ G&A 43,380$ 66,753$ 118,064$ US$ '000 118,064$ -$ 5,231$ 5,231$ 5,231$ 5,231$ 5,231$ 5,231$ 5,231$ 5,231$ 5,231$ 5,231$ 5,231$ 5,231$ 5,231$ 5,231$ 5,231$ 5,231$ 5,231$ 5,231$ 5,231$ 5,231$ 5,231$ 5,231$ 2,992$ -$ -$ -$ -$ -$ Total Operating Cost 388,508$ 488,038$ 816,631$ US$ '000 816,631$ 9,533$ 41,212$ 43,076$ 43,680$ 42,715$ 43,767$ 42,291$ 40,338$ 37,185$ 36,779$ 31,770$ 28,295$ 28,294$ 29,312$ 34,011$ 34,011$ 34,011$ 34,011$ 34,011$ 34,011$ 34,011$ 34,011$ 31,821$ 14,473$ -$ -$ -$ -$ -$
Operating Cashflow 264,199$ 696,650$ 1,027,925$ US$ '000 1,027,925$ (9,533)$ 82,763$ 96,292$ 88,962$ 50,298$ 50,825$ 47,843$ 45,657$ 43,594$ 39,583$ 41,008$ 44,055$ 43,784$ 38,539$ 33,256$ 33,256$ 33,256$ 33,256$ 33,256$ 33,256$ 33,256$ 33,256$ 32,929$ 21,408$ 3,874$ -$ -$ -$ -$
CAPITAL COSTDirect Cost
Mining -$ US$ '000 -$ -$ -$ -$ -$ -$ -$ -$ -$ -$ -$ -$ -$ -$ -$ -$ -$ -$ -$ -$ -$ -$ -$ -$ -$ -$ -$ -$ -$ Processing 16,874$ 16,874$ 16,874$ US$ '000 16,874$ 3,375$ 13,499$ -$ -$ -$ -$ -$ -$ -$ -$ -$ -$ -$ -$ -$ -$ -$ -$ -$ -$ -$ -$ -$ -$ -$ -$ -$ -$ -$ -$ Infrastructure 25,794$ 25,794$ 25,794$ US$ '000 25,794$ 5,159$ 20,636$ -$ -$ -$ -$ -$ -$ -$ -$ -$ -$ -$ -$ -$ -$ -$ -$ -$ -$ -$ -$ -$ -$ -$ -$ -$ -$ -$ -$ Tailings -$ -$ -$ US$ '000 -$ -$ -$ -$ -$ -$ -$ -$ -$ -$ -$ -$ -$ -$ -$ -$ -$ -$ -$ -$ -$ -$ -$ -$ -$ -$ -$ -$ -$ -$ -$
Total Direct Cost 42,669$ 42,669$ 42,669$ US$ '000 42,669$ -$ 8,534$ 34,135$ -$ -$ -$ -$ -$ -$ -$ -$ -$ -$ -$ -$ -$ -$ -$ -$ -$ -$ -$ -$ -$ -$ -$ -$ -$ -$ -$ -$
Other Costs23% Preprod Mine Dev & Equipment 9,909$ 9,909$ 9,909$ US$ '000 9,909$ -$ -$ 9,909$ -$ -$ -$ -$ -$ -$ -$ -$ -$ -$ -$ -$ -$ -$ -$ -$ -$ -$ -$ -$ -$ -$ -$ -$ -$ -$ -$ -$ 12% Owners 4,226$ 5,098$ 5,098$ US$ '000 5,098$ -$ -$ 5,098$ -$ -$ -$ -$ -$ -$ -$ -$ -$ -$ -$ -$ -$ -$ -$ -$ -$ -$ -$ -$ -$ -$ -$ -$ -$ -$ -$ -$ 19% Indirect Costs (EPCM, Freight, Insurance, etc) 7,947$ 7,947$ 7,947$ US$ '000 7,947$ -$ 1,589$ 6,357$ -$ -$ -$ -$ -$ -$ -$ -$ -$ -$ -$ -$ -$ -$ -$ -$ -$ -$ -$ -$ -$ -$ -$ -$ -$ -$ -$ -$
2% Spare Parts 833$ 833$ 833$ US$ '000 833$ -$ -$ 833$ -$ -$ -$ -$ -$ -$ -$ -$ -$ -$ -$ -$ -$ -$ -$ -$ -$ -$ -$ -$ -$ -$ -$ -$ -$ -$ -$ -$ Subtotal Costs 65,583$ 66,455$ 66,455$ US$ '000 66,455$ -$ 10,123$ 56,331$ -$ -$ -$ -$ -$ -$ -$ -$ -$ -$ -$ -$ -$ -$ -$ -$ -$ -$ -$ -$ -$ -$ -$ -$ -$ -$ -$ -$
-$ 14% Contingency 6,031$ 6,031$ 6,031$ US$ '000 6,031$ -$ 1,206$ 4,824$ -$ -$ -$ -$ -$ -$ -$ -$ -$ -$ -$ -$ -$ -$ -$ -$ -$ -$ -$ -$ -$ -$ -$ -$ -$ -$ -$ -$
Initial Capital Cost 71,613$ 72,485$ 72,485$ US$ '000 72,485$ -$ 11,329$ 61,156$ -$ -$ -$ -$ -$ -$ -$ -$ -$ -$ -$ -$ -$ -$ -$ -$ -$ -$ -$ -$ -$ -$ -$ -$ -$ -$ -$ -$
Sustaining 15,008$ 15,008$ 28,308$ US$ '000 28,308$ -$ -$ -$ 497$ 6,525$ 449$ 298$ 5,940$ 278$ 187$ 200$ 205$ 429$ 5,000$ 300$ 300$ 300$ 5,000$ 300$ 300$ 300$ 300$ 300$ 300$ 300$ 300$ -$ -$ -$ -$ -$ Working Capital -$ -$ (0)$ US$ '000 (0)$ -$ 440$ 1,469$ 13,746$ 2,098$ (867)$ (4,961)$ 338$ (502)$ (446)$ (536)$ (540)$ (335)$ 145$ (150)$ (276)$ (308)$ 150$ 9$ 9$ 9$ 9$ 9$ 9$ (227)$ (2,642)$ (3,102)$ (3,450)$ -$ (100)$ -$ Reclamation and closure 10,662$ 10,662$ 18,512$ US$ '000 18,512$ -$ -$ -$ 4$ 8$ 12$ 16$ 20$ 24$ 28$ 32$ 36$ 1,062$ 2,089$ 3,601$ 65$ 820$ 820$ 820$ 820$ 820$ 820$ 820$ 820$ 820$ 469$ 741$ 737$ 733$ 730$ 726$
Total Capital Cost 97,283$ 98,154$ 119,305$ US$ '000 119,305$ -$ 11,769$ 62,625$ 14,247$ 8,631$ (406)$ (4,648)$ 6,298$ (200)$ (231)$ (305)$ (300)$ 1,156$ 7,234$ 3,751$ 89$ 813$ 5,970$ 1,129$ 1,129$ 1,129$ 1,129$ 1,129$ 1,129$ 894$ (1,873)$ (2,361)$ (2,713)$ 733$ 630$ 726$
CASH FLOWPre-Tax Cashflow 598,496$ 908,620$ US$ '000 908,620$ -$ (11,769)$ (72,158)$ 68,515$ 87,661$ 89,367$ 54,946$ 44,526$ 48,043$ 45,888$ 43,899$ 39,883$ 39,851$ 36,821$ 40,033$ 38,450$ 32,443$ 27,286$ 32,127$ 32,127$ 32,127$ 32,127$ 32,127$ 32,127$ 32,036$ 23,281$ 6,235$ 2,713$ (733)$ (630)$ (726)$ Cumulative Pre-Tax Cashflow US$ '000 -$ (11,769)$ (83,927)$ (15,412)$ 72,249$ 161,616$ 216,562$ 261,088$ 309,131$ 355,019$ 398,918$ 438,801$ 478,652$ 515,473$ 555,506$ 593,956$ 626,399$ 653,685$ 685,811$ 717,938$ 750,064$ 782,191$ 814,318$ 846,444$ 878,480$ 901,761$ 907,997$ 910,710$ 909,976$ 909,347$ 908,620$
RPA - Cash Flow Summary - Extended Life CaseK&S - Santa Ana
ww
w.rp
acan
.co
m
20-2