Kinetics ofmetabolic pathways
6
Biochem. J. (1986) 234, 169-174 (Printed in Great Britain) Kinetics of metabolic pathways A system in vitro to study the control of flux Nestor V. TORRES,* Fatima MATEO,* Enrique MELENDEZ-HEVIA*t and Henrik KACSERt *Departanento de Bioquimica, Facultad de Biologia, Universidad de La Laguna, 38000 Tenerife, Canary Islands, Spain, and tDepartment of Genetics, University of Edinburgh, Edinburgh EH9 3JN, Scotland, U.K. A method for determining Control Coefficients is proposed for systems studied in vitro and applied to a model pathway. Rat liver extract, which converts glucose into glycerol 3-phosphate, was used with the addition to the incubation mixture of fructose-bisphosphate aldolase, triose-phosphate isomerase and glycerol- 3-phosphate dehydrogenase as 'auxiliary' enzymes, which leaves all the control on the first three enzymes. The flux of the metabolic pathway was recorded by assaying NADH decay. Flux Control Coefficients (CJE) of hexokinase, glucose-6-phosphate isomerase and phosphofructokinase were calculated by titration of the system with increasing quantities of extraneous enzymes. It is shown that the summation property is fulfilled. The applicability of this procedure to study the control in any metabolic pathway is discussed. Possible relevance of the method to conditions in vivo and its limitations are considered. INTRODUCTION Control of flux in metabolic pathways is shared among several, if not all, points of the system. The quantitative contribution of each element can be expressed by means of several coefficients of control, rigorously defined in their theory of control of Kacser & Burns (1973) and Heinrich & Rapoport (1974a). Earlier steps towards a theory are Higgins (1963, 1965), Kacser (1963), Kacser & Burns (1968), Burns (1969) and Savageau (1969, 1971a,b, 1972), and later developments are Kacser & Burns (1979, 1981), Heinrich & Rapoport (1974b,c, 1975, 1977, 1983), Rapoport et al. (1976), Kacser (1983), Fell & Sauro (1985) and others [see reviews by Groen et al. (1982a), Porteous (1983) and Westerhoff et al. (1984)]. Control Coefficients of a flux with respect to enzyme activity, CJE ('Sensitivity Coefficients' or 'Control Strengths' in the previous literature; see Burns et al., 1985), are systemic coefficients of which there are as many involved in a given metabolic pathway as there are enzymes. The Flux Control Coefficient, C{ , of the metabolic pathway flux for an individual enzyme, Ei, within it, is defined as: CJ/J -J &?J/e (1) where J is the flux of the system and ei is the activity of any enzyme Ei. Thus the Control Coefficient is defined as the fractional change of flux produced as a result of an infinitesimal fractional change in the activity of an individual enzyme. Sensitivity of the systems to changes in concentration or activity of different enzymes can be very different, and thus the particular values of these coefficients give information on the distribution of control in the metabolic pathways among all enzymes involved in it. A number of studies have dealt with the relationships between the flux of a metabolic system in vivo and the concentrations or activities of particular enzymes with the use of genetic means to alter the enzyme parameters (see, e.g., Flint et al., 1981; Kacser & Burns, 1981; Middleton & Kacser, 1983). With the use of a variety of theorems and methods arising from the Control Theory, mito- chondrial respiration has been investigated in a part- system of isolated mitochondria. Values of the Flux Control Coefficients, at various rates of respiration, have been determined for the different steps in this stystem (see, e.g., Groen et al., 1982b; Wanders et al., 1984). Control Theory is concerned with the study of metabolic pathways within the whole system in order to determine the regulatory effects of each enzyme on the total flux, i.e. it applies to situations in vivo (Kacser & Burns, 1979). Although a study of metabolic regulation must be made in vivo in order to draw physiological conclusions, part-systems or systems studied in vitro can nevertheless be used to explore certain aspects of control distribution. In the present paper such a method is described and is demonstrated by reference to a model system in vitro. The possible relevance of such results to the situation in vivo and the limitations of the method are indicated. METHODOLOGY The flux carried by a pathway is normally a positive function of the activity of any of its enzymes. In many cases this relationship can be represented by a hyperbolic function (Kacser & Burns, 1979; see also Waley, 1964): Qlei Q2+ei (2) where Q1 and Q2 are constants that are functions of the kinetic parameters of all the other (constant) enzymes [for examples of this see, e.g., Kacser & Burns (1981), Flint et al. (1981), Middleton & Kacser (1983) and Salter et al. (1986)]. The Control Coefficient defines the response of the flux, at the value it has, to a small (infinitesimal) $ To whom correspondence should be addressed. Vol. 234 169
Transcript of Kinetics ofmetabolic pathways
Biochem. J. (1986) 234, 169-174 (Printed in Great Britain)
Kinetics of metabolic pathwaysA system in vitro to study the control of flux
Nestor V. TORRES,* Fatima MATEO,* Enrique MELENDEZ-HEVIA*t and Henrik KACSERt*Departanento de Bioquimica, Facultad de Biologia, Universidad de La Laguna, 38000 Tenerife, Canary Islands, Spain, andtDepartment of Genetics, University of Edinburgh, Edinburgh EH9 3JN, Scotland, U.K.
A method for determining Control Coefficients is proposed for systems studied in vitro and applied to a modelpathway. Rat liver extract, which converts glucose into glycerol 3-phosphate, was used with the additionto the incubation mixture of fructose-bisphosphate aldolase, triose-phosphate isomerase and glycerol-3-phosphate dehydrogenase as 'auxiliary' enzymes, which leaves all the control on the first three enzymes.The flux of the metabolic pathway was recorded by assaying NADH decay. Flux Control Coefficients (CJE)of hexokinase, glucose-6-phosphate isomerase and phosphofructokinase were calculated by titration of thesystem with increasing quantities ofextraneous enzymes. It is shown that the summation property is fulfilled.The applicability of this procedure to study the control in any metabolic pathway is discussed. Possiblerelevance of the method to conditions in vivo and its limitations are considered.
INTRODUCTIONControl of flux in metabolic pathways is shared among
several, if not all, points of the system. The quantitativecontribution of each element can be expressed by meansof several coefficients of control, rigorously defined intheir theory of control of Kacser & Burns (1973) andHeinrich & Rapoport (1974a). Earlier steps towards atheory are Higgins (1963, 1965), Kacser (1963), Kacser& Burns (1968), Burns (1969) and Savageau (1969,1971a,b, 1972), and later developments are Kacser &Burns (1979, 1981), Heinrich & Rapoport (1974b,c, 1975,1977, 1983), Rapoport et al. (1976), Kacser (1983), Fell& Sauro (1985) and others [see reviews by Groen et al.(1982a), Porteous (1983) and Westerhoff et al. (1984)].Control Coefficients of a flux with respect to enzymeactivity, CJE ('Sensitivity Coefficients' or 'ControlStrengths' in the previous literature; see Burns et al.,1985), are systemic coefficients ofwhich there are as manyinvolved in a given metabolic pathway as there areenzymes. The Flux Control Coefficient, C{ , of themetabolic pathway flux for an individual enzyme, Ei,within it, is defined as:
CJ/J-J &?J/e (1)
where J is the flux of the system and ei is the activity ofany enzyme Ei. Thus the Control Coefficient is definedas the fractional change of flux produced as a result ofan infinitesimal fractional change in the activity of anindividual enzyme. Sensitivity of the systems to changesin concentration or activity of different enzymes can bevery different, and thus the particular values of thesecoefficients give information on the distribution ofcontrol in the metabolic pathways among all enzymesinvolved in it.A number of studies have dealt with the relationships
between the flux of a metabolic system in vivo and theconcentrations or activities ofparticular enzymes with the
use of genetic means to alter the enzyme parameters (see,e.g., Flint et al., 1981; Kacser & Burns, 1981; Middleton& Kacser, 1983). With the use of a variety of theoremsand methods arising from the Control Theory, mito-chondrial respiration has been investigated in a part-system of isolated mitochondria. Values of the FluxControl Coefficients, at various rates of respiration, havebeen determined for the different steps in this stystem (see,e.g., Groen et al., 1982b; Wanders et al., 1984).
Control Theory is concerned with the study ofmetabolic pathways within the whole system in order todetermine the regulatory effects of each enzyme on thetotal flux, i.e. it applies to situations in vivo (Kacser &Burns, 1979). Although a study of metabolic regulationmust be made in vivo in order to draw physiologicalconclusions, part-systems or systems studied in vitro cannevertheless be used to explore certain aspects of controldistribution. In the present paper such a method isdescribed and is demonstrated by reference to a modelsystem in vitro. The possible relevance of such results tothe situation in vivo and the limitations of the method areindicated.
METHODOLOGYThe flux carried by a pathway is normally a positive
function of the activity of any of its enzymes. In manycases this relationship can be represented by a hyperbolicfunction (Kacser & Burns, 1979; see also Waley, 1964):
QleiQ2+ei
(2)
where Q1 and Q2 are constants that are functions of thekinetic parameters of all the other (constant) enzymes [forexamples of this see, e.g., Kacser & Burns (1981), Flintet al. (1981), Middleton & Kacser (1983) and Salter et al.(1986)]. The Control Coefficient defines the response ofthe flux, at the value it has, to a small (infinitesimal)
$ To whom correspondence should be addressed.
Vol. 234
169

N. V. Torres and others
change in the activity of the enzyme at the value it has.From its definition (eqn. 1) we can derive the expressionfor the coefficient by forming the derivative of function(2) and multiplying this by the scaling or normalizingfactor ei/J. This gives:
CjQi = (3)or
CJE= Q2 (4)
We here use eqns. (2) and (3) to obtain a formulationthat can be used experimentally. Inverting eqn. (2) gives:
1 Q21-.-+- ~~~~~(5)J Q1 es Q1
a straight line whose intercept at 1 /ei = 0 gives the valueof Q1. The data for such a line can be obtained if a seriesof enzyme activities are available and the fluxesmeasured.
Q1 is a parameter of the system whose physicalsignificance is the maximal flux of the pathway obtainedwhen the activity of Ei tends to infinity, i.e. the flux ofthe system after addition of sufficient enzyme activity sothat this enzyme in no way limits the flux.
so that eqn. (3,Qi =",": liMei.oo J = Jmax. (ej)) is:
CJ -Jmax.(e) -JJmax. (ei)
For each enzyme in a pathway there will, in general,be a different Jmax., and the determination of these valueswill allow the calculation of the control coefficients foreach enzyme at a given J.An important consequence of the theory is the
establishment of the summation property that states thatthe sum of all Flux Control Coefficients of a metabolicpathway is equal to unity, i.e.:
nz CJE= (7)i-1
For a studied system in vitro, such as the extract of aparticular tissue, the variation in each enzyme activity canbe produced by adding more enzyme to the extract. Onecan thus 'titrate' the flux (measured in some suitablemanner) by successive additions of enzyme. In this way,by using eqn. (5), the values of the different Jmax. areobtainable. The source of such added enzyme isirrelevant, provided that account is taken ofthe differencein kinetic constants of the endogenous and added enzymespecies. We must bear in mind that ei values express totalactivity of the enzymes in the system, which are those ofthe extract plus those added in the titration procedure.This makes it necessary to assay the enzyme activity in theextract before titration. On the other hand the system canbe titrated with an enzyme from any biological source,provided that ei values, i.e. V/Km, are plotted. ControlCoefficient values can thus be calculated according toeqn. (3) by using only the value of J (the flux beforeenzyme addition in titration experiments) and Q1 values,after verification of the hyperbolic relationship betweenflux and enzyme activity, processing data by means ofeqn. (5).A practical problem of this titration method arises
from the summation property. If the number of enzymesis reasonably large some Control Coefficients will besmall, and this has often been observed (Kacser & Bums,1981). Titration ofsuch enzyme steps is not likely to resultin clearly observable increases in flux. If the pathway is'shortened' by the addition of large enzyme activitiesdistal to the part to be investigated, then ControlCoefficients of steps with such 'auxiliary' enzymesbecome virtually zero, and the coefficients of theremaining steps are increased, since EC!= 1. As isdiscussed below, the ratios of the Control Coefficients sodetermined will be the same as in the whole system.The method is shown by Scheme 1.
THE MODEL SYSTEMOur experimental system consists of a soluble extract
from rat liver with glucose, ATP and NADH assubstrates, which converts glucose into glycerol 3-phosphate by means of enzymes of the glycolytic
X0 0*S, -S2 0 S3 - S4 - SS S6 ) 7 -
El E2 E3 E4 E5 E6 E7 E8
(1) -- +auxiliary enzymes E4, E5, E6 ...32CJE = 1
i-iEnzyme titration
(2) auxiliaries E1, E25
1 CjEi = 1i-3
Enzyme titration
auxiliaries E., E7. . .
(3) auxiliaries E1, EV, 3, E47
1 C i = Ii-5
Enzyme titration
Scheme 1. Arrangement of the steps in the experimental approach to obtain anl Control Coefficient values in a metabolic pathwayThe ratios of Control Coefficients of the pathway thyMes are obtained Cby determining.thes# A9efie1W ifragnents of thepathway with the use of auxiliary enzymes. v
1986
auxiliaries
etc.
170

Kinetics of metabolic pathways
pathway. Previous experiments on glycolysis in vitro(Melendez-Hevia et al., 1984) show an important fluxtowards glycerol 3-phosphate with rat liver extracts,hexokinase (EC 2.7.1.2) and phosphofructokinase (EC2.7.1.11) being the enzymes mainly responsible for thecontrol of the system. Thus glycerol 3-phosphateproduction by rat liver extracts is a useful system to beused as a model to study control distribution. Fructose-bisphosphate aldolase (EC 4.1.2.13), triose-phosphateisomerase (EC 5.3. 1. 1) and glycerol-3-phosphate dehydro-genase (EC 1.1.1.8) were added in large concentrations as'auxiliary' enzymes in all experiments so that their Con-trol Coefficients were virtually zero. The other enzymes,hexokinase (EC 2.7.1.1), glucose-6-phosphate isomerase(EC 5.3.1.9) and phosphofructokinase (EC 2.7.1.1 1),were present at liver extract concentrations. Thereforethey must account for the total control of this modifiedmetabolic pathway and their Control Coefficients mustadd up to unity. Acceleration of the last three steps byadding their corresponding auxiliary enzymes also resultsin a simple linear pathway from glucose to glycerol3-phosphate, thus avoiding drainage of glyceraldehyde3-phosphate towards L-lactate or to the pentosephosphate cycle, which would involve negative ControlCoefficients. Steady state was ensured by the followingexperimental conditions. (1) The flux produced with5 mM-glucose does not result in significant changes ofglucokinase saturation. (2) ATP concentration wasbuffered by phosphocreatine and creatine kinase (EC2.7.3.2). (3) The system as described, however, has a longtransition time, since fructose 2,6-bisphosphate, aneffector for phosphofructokinase, is produced (Hers &Van Schaftingen, 1982). The long transition time wasshortened by adding this effector to the incubationmixture in order to obtain a more rapid approach to thesteady state. This steady state was verified by observinga constant flux and constant glucose 6-phosphate andfructose 6-phosphate concentrations during each experi-ment. Flux of the pathway was assayed by recordingNADH decay in the glycerol-3-phosphate dehydrogenasereaction. The kinetics of the three enzymes were studiedin the same conditions as those for the system fluxexperiments; their activities were assayed and their Kmvalues were determined and found to be as described inthe literature under similar conditions (Pilkis, 1975;Castafno et al., 1979) (results not shown). In applying thisapproach it is necessary to assay the commercial enzymesused in titration experiments under the same conditionsas occur in the system, in order to obtain their kineticparameters. The results of these activity assays were thesame as those indicated by the manufacturer, and theirKm values were also the same as those described in theliterature (Bergmeyer, 1974). Glycogen degradationduring the assays was not significant, glucose being theonly source of carbon. Enzyme activities were assayedafter a number of experiments; there was no significantloss of activity, indicating that proteolysis was negligible.
MATERIALS AND METHODSChemicalsATP, NADH, phosphocreatine, fructose 6-phosphate,
fructose 2,6-bisphosphate, glucose 6-phosphate, chickenegg-white trypsin inhibitor (type II), Hepes, streptomycinsulphate, penicillin, hexokinase, glucose-6-phosphateisomerase, phosphofructokinase, fructose-bisphosphate
aldolase, triose-phosphate isomerase, glycerol-3-phosphate dehydrogenase, glucose-6-phosphate dehydro-genase and creatine kinase were purchased from SigmaChemical Co., St. Louis, MO, U.S.A. Glucose mono-hydrate and other reagents were obtained from E. Merck,Darmstadt, Germany.
Animals and dietsFemale Wistar albino rats (180-220 g), fed on a
standard laboratory diet (65% carbohydrate, 11% fat,24% protein) ad libitum, were used in all experiments.Animals were housed at 20-22 °C with light from 07:00to 19:00 h. They were killed between 90 and 100 days ofage.
Preparation of rat liver extractsLivers were obtained under ether anaesthesia between
09:00 and 10:00 h, cooled, chopped and homogenized at1 g/3 ml in 50 mM-Hepes/l0 mM-sodium phosphatebuffer, pH 7.4, containing 100 mM-KCl, 10 mM-MgCl2and 1 mg of trypsin inhibitor/ml by using a Potter-Elvehjem homogenizer with Teflon pestle (about1000 rev./min during 1 min) in an ice-cold bath. Thehomogenates were clarified twice by centrifugation at27000 g in a Sorvall RC-5B centrifuge with a SorvallRC-34 rotor at 3-4 'C for 20 and 10 min respectively. Theresulting supernatants were used immediately for kineticexperiments, enzyme assays and protein measurements.
Enzyme and protein assaysHexokinase (glucokinase) assays were carried out as
described by Pilkis (1975), with 1 mM-ATP. Glucose-6-phosphate isomerase was assayed as described byNoltmann (1966). The phosphofructokinase assay wasdesigned in our laboratory and in accordance withpublished methods (Castanlo et al., 1979), with 1 mM-ATP.All enzyme activities are expressed in units (/tmol ofproduct produced/min). Velocity of the reaction wascontinuously monitored by recording change in absorb-ance at 340 nm with a Hitachi 100-60 spectrophotometer(Hitachi, Tokyo, Japan). Temperature was stabilized at35 °C with a thermocirculator (Churchill InstrumentsCo., Perivale, Middx., U.K.). Fructose-bisphosphatealdolase, triose-phosphate isomerase, glycerol-3-phosphate dehydrogenase and the commercial enzymesused in titration experiments (hexokinase, glucose-6-phosphate isomerase and phosphofructokinase) wereassayed as indicated in Bergmeyer (1974) and their Kmvalues determined in the same conditions as that of theexperimental system. Protein concentrations were assayedin a Hepes-free sample by the method of Lowry et al.(1951), with bovine serum albumin (Sigma Chemical Co.)as standard.
Titration experimentsAll titration experiments were carried out in the cuvette
of a Hitachi 100-60 spectrophotometer. Fluxes weremeasured by continuous recording of NADH decay at340 nm and 35 'C. The total volume of the incubationmixture was 2 ml, containing 100,l of diluted liverextract. Final concentrations are 1.5 mg of protein/ml,5 mM-glucose, 1 mM-ATP, 0.28 mM-NADH, 2.5 mm-phosphocreatine, 15 /SM-fructose 2,6-biphosphate, 5 unitsof creatine kinase/ml, 1 unit of fructose-bisphosphatealdolase/ml, 5 units of triose-phosphate isomerase/mland 3 units of glycerol-3-phosphate dehydrogenase, the
Vol. 234
171
N. V. Torres and others
auxiliary enzymes being added to the mixture in the samebuffer described above. Reactions were started byaddition ofliver extract to the mixture with substrates andauxiliary enzymes. Flux was measured, after a transitiontime (2-3 min), in the absorbance range from 0.8 to 0.3 A,whereNADH decay was always linear. In titration assaysdiluted enzymes were added to the mixture at convenientconcentrations according to the experiment. Total assaytime was about 10-15 min. Flux values were normalizedwith respect to the value of basal flux (without anytitrating enzyme added, only the auxiliary enzymes beingpresent). This basal flux was taken as 1 in each series ofexperiments. The sums of enzyme activities (basal andadded) were divided by their respective Km values toobtain the corresponding ei parameter values. Reciprocalvalues of flux and ei were inserted in eqn. (5) to obtainthe normalized values of Q1. By using eqn. (3), ControlCoefficients, CJE, were calculated by:
CJG = Q1GK) 1; CJG QI GP-Q1(GK) Q1(GPI)
CJPFK - Ql(PFK) 1 (8)Q1(PFK)
where GK, GPI and PFK represent hexokinase (gluco-kinase), glucose-6-phosphate isomerase and phospho-fructokinase respectively.
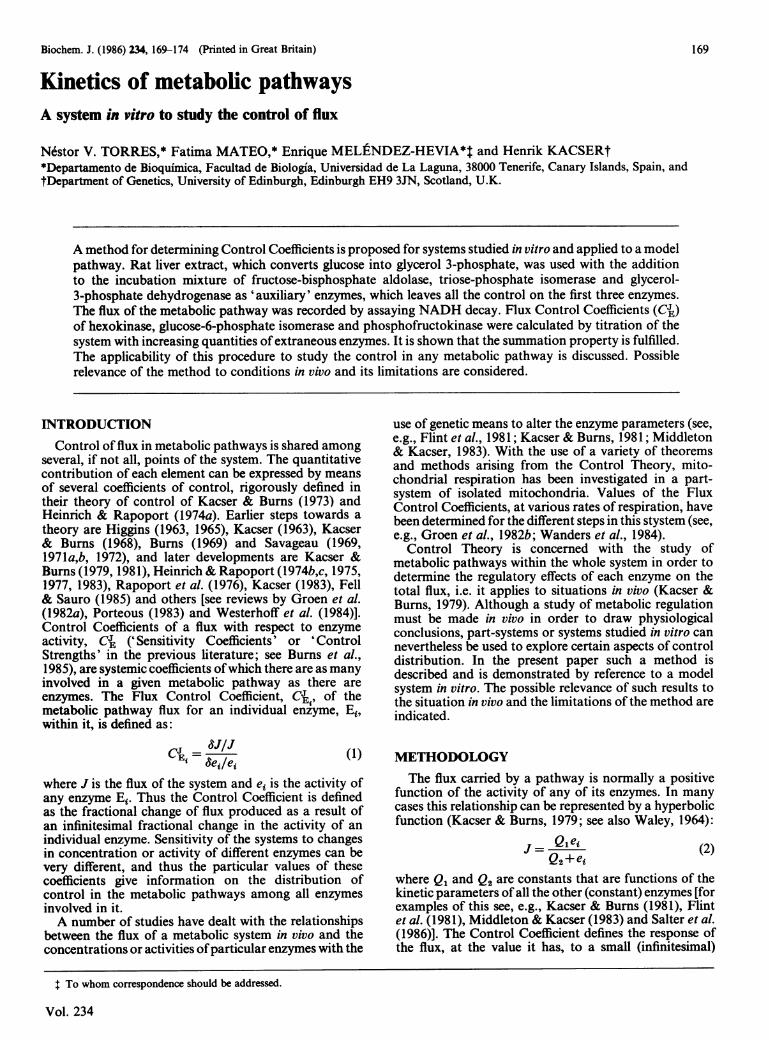
RESULTS AND DISCUSSIONThe results of titration of the system with hexokinase,
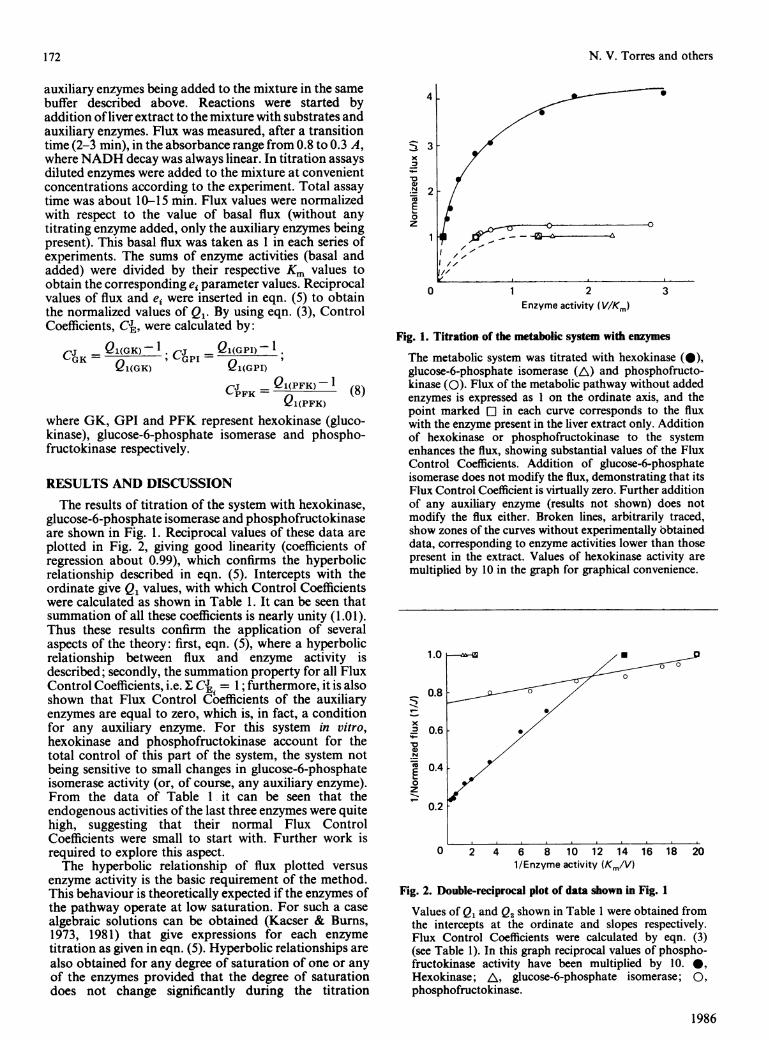
glucose-6-phosphate isomerase and phosphofructokinaseare shown in Fig. 1. Reciprocal values of these data areplotted in Fig. 2, giving good linearity (coefficients ofregression about 0.99), which confirms the hyperbolicrelationship described in eqn. (5). Intercepts with theordinate give Q1 values, with which Control Coefficientswere calculated as shown in Table 1. It can be seen thatsummation of all these coefficients is nearly unity (1.01).Thus these results confirm the application of severalaspects of the theory: first, eqn. (5), where a hyperbolicrelationship between flux and enzyme activity isdescribed; secondly, the summation property for all FluxControl Coefficients, i.e. I CJ = 1; furthermore, it is alsoshown that Flux Control Coefficients of the auxiliaryenzymes are equal to zero, which is, in fact, a conditionfor any auxiliary enzyme. For this system in vitro,hexokinase and phosphofructokinase account for thetotal control of this part of the system, the system notbeing sensitive to small changes in glucose-6-phosphateisomerase activity (or, of course, any auxiliary enzyme).From the data of Table 1 it can be seen that theendogenous activities of the last three enzymes were quitehigh, suggesting that their normal Flux ControlCoefficients were small to start with. Further work isrequired to explore this aspect.The hyperbolic relationship of flux plotted versus
enzyme activity is the basic requirement of the method.This behaviour is theoretically expected if the enzymes ofthe pathway operate at low saturation. For such a casealgebraic solutions can be obtained (Kacser & Burns,1973, 1981) that give expressions for each enzymetitration as given in eqn. (5). Hyperbolic relationships arealso obtained for any degree of saturation of one or anyof the enzymes provided that the degree of saturationdoes not change significantly during the titration
4
:-)3x
2
0
z
0 1 2 3Enzyme activity (V/Km)
Fig. 1. Titration of the metabolic system with enzymes
The metabolic system was titrated with hexokinase (0),glucose-6-phosphate isomerase (A) and phosphofructo-kinase (0). Flux of the metabolic pathway without addedenzymes is expressed as 1 on the ordinate axis, and thepoint marked E] in each curve corresponds to the fluxwith the enzyme present in the liver extract only. Additionof hexokinase or phosphofructokinase to the systemenhances the flux, showing substantial values of the FluxControl Coefficients. Addition of glucose-6-phosphateisomerase does not modify the flux, demonstrating that itsFlux Control Coefficient is virtually zero. Further additionof any auxiliary enzyme (results not shown) does notmodify the flux either. Broken lines, arbitrarily traced,show zones of the curves without experimentally bbtaineddata, corresponding to enzyme activities lower than thosepresent in the extract. Values of hexokinase activity aremultiplied by 10 in the graph for graphical convenience.
1.0
x
.N
E0Z
0.8
0.6
0.4
0.2
0 2 4 6 8 10 12 14 16 18 201/Enzyme activity (Km/V)
Fig. 2. Double-reciprocal plot of data shown in Fig. 1
Values of Q1 and Q2 shown in Table 1 were obtained fromthe intercepts at the ordinate and slopes respectively.Flux Control Coefficients were calculated by eqn. (3)(see Table 1). In this graph reciprocal values of phospho-fructokinase activity have been multiplied by 10. *,Hexokinase; A, glucose-6-phosphate isomerase; 0,phosphofructokinase.
1986
172
1

Kinetics of metabolic pathways 173
Table 1. Parameters of the experimental system and Control Coefficients (CJ)
Enzyme activity is expressed as units (csmol of reaction product produced/min)/mg of protein. The metabolic system in vitrowas carried out in the cuvette of the spectrophotometer to obtain values of flux. Q1 and Q2 parameter values, according to eqn.(5), were obtained from results shown in Fig. 2. Q1 values were normalized, as described in the Materials and methods section,by setting the value of the flux equal to 1 in the system without added enzymes for titration (basal value of flux = 0.02 + 2.5 nmolof glycerol 3-phosphate/min per mg of protein). Control Coefficients (CjE) were calculated from data of normalized Q1 asdescribed in eqn. (3). Note that, for enzymes with CJE = 0, Q1 = 1. As expected from theory, summation of all Flux ControlCoefficients of the system is near unity. Results are given as means + S.D. for three experiments.
ActivityEnzyme (units/mg) QC Q2 C;
Hexokinase 0.07 + 0.002 4.36 + 0.13 0.025 + 0.0007 0.77 + 0.025Glucose-6-phosphate isomerase 0.27 + 0.008 1.00+ 0.06 0.00+ 0.005Phosphofructokinase 0.05 +0.015 1.33 +0.05 0.15 +0.0004 0.24+0.01Fructose-biphosphate aldolase* 1.33 +0.025 1.00 - 0.00Triose-phosphate isomerase* 6.66+0.15 1.00 0.00Glycerol-30-phosphate dehydrogenase* 4.00+0.17 1.00 0.00
Summation of Flux Control Coefficients (E CJE)... 1.01 + 0.015
* Activities of fructose-bisphosphate aldolase, triose-phosphate isomerase and glycerol-3-phosphate dehydrogenase are those ofthe experimental system, after addition of commercial enzymes to make then 'auxiliaries'. Their activities before this addition wererespectively 0.33, 1.66 and 1.00 units/mg of protein.
A
Endogenousactivity
Ile,
Fig. 3. Effects of changes in saturation during ttration
The Figure shows a computer simulation of changes inpathway flux where the degree of saturation of one orseveral enzymes changes significantly during titration.Curve A, increase in saturation; curve B, decrease insaturation.
procedure owing to the movement of the pools. If suchchanges in saturation do occur, the inverse plot willdeviate in the manner given in Fig. 3. Jmax. values soobtained byextrapolation to l/ei = 0 will therefore eitherover- or under-estimate the Q1 parameter (J. S. Hofmeyr& H. Kacser, unpublished work). Titration results willnevertheless be usable if extrapolation is carried out byusing the initial points as indicated in the Figure. This isthe equivalent of estimating the slope of the J-versus-eirelationship by using small differences around the steadystate (modulation). Reciprocal plots (or any other lineartransformation, such as the equivalent of the Eadie-Hofstee plot) will give a better estimate than theestimated tangent of the direct plot.
If the unsaturated conditions apply, the 'shortening'of the pathway will leave the ratios of the ControlCoefficients undisturbed although their absolute valueswill have increased. This will make it practicable tomeasure the relative values of the coefficients, which inthe whole system may be too small to measure with anyaccuracy. By a series of overlapping shortened segmentsall the relative values of the Control Coefficients can beestimated. The determination of the absolute value ofanyone (by whatever method) will then give the absolutevalue of all.The relevance of these considerations to the analysis of
systems in vivo will depend on some information of thesaturation status of the pathway enzymes. A similardeviation from hyperbolicity will occur if negativefeedbacks (or other non-linear interactions) exist andchange substantially during titration. It is further obviousthat if extraction destroys important structural aspects,such as membrane attachments or compartmentations,the behaviour of the system in vitro will not give trueestimates ofthe control relations in the system in vivo. Themethod may, however, be of some value, particularly ifgenetic variation or specific inhibitors are not readilyavailable.
This work was supported by a research grant from theComision Asesora de Investigacion Cientifica y Tecnica (no.567/8 1), and by the Programme for Training of ResearchPersonnel in Spain, from Ministerio de Educacion y Ciencia.
REFERENCESBergmeyer, H. U. (ed.) (1974) Methods in Enzymatic Analysis,2nd edn., Verlag Chemie, Weinheim, and Academic Press,New York
Bums, J. A. (1969) FEBS Lett. 2 (Suppl.) S30-S33Burns, J. A., Cornish-Bowden, A., Groen, A. K., Heinrich, R.,
Kacser, H., Porteous, J. W., Rapoport, S. M., Rapoport,T. A., Stucki, J. W., Tager, J. M., Wanders, R. J. A. &Westerhoff, H. V. (1985) Trends Biochem. Sci. 10, 16
Vol. 234

174 N. V. Torres and others
Castanio, J. G., Nieto, A. & Feliu, J. E. (1979) J. Biol. Chem.254, 5576-5579
Fell, D. A. & Sauro, M. (1985) Eur. J. Biochem. 148, 551-561Flint, H. J., Tateson, R. W., Barthelmess, I. B., Porteous, D. J.,
Donachie, W. D. & Kacser, H. (1981) Biochem. J. 200,155-161
Groen, A. K., Van der Meer, R., Westerhoff, H. V., Wanders,R. J. A., Akerboom, T. P. M. & Tager, J. M. (1982a) inMetabolic Compartmentation (Sies, H., ed.), pp. 9-37,Academic Press, New York
Groen, A. K., Wanders, R. J. A., Westerhoff, H. V., Van derMeer, R. & Tager, J. M. (1982b) J. Biol. Chem. 257,2754-2757
Heinrich, R. & Rapoport, T. A. (1974a) Eur. J. Biochem. 42,89-95
Heinrich, R. & Rapoport, T. A. (1974b) Eur. J. Biochem. 42,97-105
Heinrich, R. & Rapoport, T. A. (1974c) Eur. J. Biochem. 42,107-120
Heinrich, R. & Rapoport, T. A. (1975) BioSystems 7, 130-136Heinrich, R. & Rapoport, T. A. (1977) Prog. Biophys. Mol.
Biol. 32, 1-82Heinrich, R. & Rapoport, T. A. (1983) Biochem. Soc. Trans.
11, 31-35Hers, H.-G. & Van Schaftingen, E. (1982) Biochem. J. 206,1-12Higgins, J. (1963) Ann. N.Y. Acad. Sci. 108,305-321Higgins, J. (1965) in Control of Energy Metabolism (Chance,
B., Estabrook, R. K. & Williamson, J. R., eds.), pp. 13-46,Academic Press, New York
Kacser, H. (1963) in Biological Organisation at the Cellular andSupercellular Level (Harris, R. J. C., ed.), pp. 25-41,Academic Press, New York
Kacser, H. (1983) Biochem. Soc. Trans. 11, 35-40Kacser, H. & Bums, J. A. (1968) in Quantitative Biology ofMetabolism (Locker, A., ed.), pp. 11-23, Springer-Verlag,Berlin-
Kacser, H. & Burns, J. A. (1973) Symp. Soc. Exp. Biol. 27,65-104
Kacser, H. & Burns, J. A. (1979) Biochem. Soc. Trans. 7,1149-1160
Kacser, H. & Burns, J. A. (1981) Genetics 97, 639-666Lowry, 0. H., Rosebrough, N. J., Farr, A. L. & Randall, R. J.
(1951) J. Biol. Chem. 193, 265-275Melendez-Hevia, E., Siverio, J. M. & Perez, J. A. (1984) Int. J.
Biochem. 16, 469-476Middleton, R. J. & Kacser, H. (1983) Genetics 105, 633-
650Noltmann, E. A. (1966) Methods Enzymol. 9, 557-565Pilkis, S. J. (1975) Methods Enzymol. 52C, 31-39Porteous, J. W. (1983) Trends Biochem. Sci. 8, 195-197Rapoport, T. A., Heinrich, R. & Rapoport, S. M. (1976)
Biochem. J. 154, 449-469Salter, M., Knowles, R. G. & Pogson, C. I. (1986) Biochem. J.,
in the pressSavageau, M. A. (1969) J. Theor. Biol. 25, 370-379Savageau; M. A. (1971a) Nature (London) 229, 542-544Savageau, M. A. (1971b) Arch. Biochem. Biophys. 145,
612-621Savageau, M. A. (1972) Curr. Top. Cell. Regul. 6, 63-130Waley, S. G. (1964) Biochem. J. 91, 514-517Wanders, R. J. A., Groen, A. K., Van Roermund, C. W. T. &
Tager, J. M. (1984) Eur. J. Biochem. 142, 417-424Westerhoff, H. V., Groen, A. K. & Wanders, R. J. A. (1984)
Biosci. Rep. 4, 1-22
Received 24 April 1985/19 August 1985; accepted 21 October 1985
1986