Kinetics of yellow dye adsorption onto marble powder · PDF fileKinetics of yellow dye...
14
J. Mater. Environ. Sci. 6 (1) (2015) 79-92 Diouri et al. ISSN : 2028-2508 CODEN: JMESCN 79 Kinetics of yellow dye adsorption onto marble powder sorbents K.Diouri 1 , A. Chaqroune 1 , A. Kherbeche 2 , J.Bentama 2 , A. Lahrichi 3 1 Chemistry department, Faculty of Sciences Dhar Mahraz Fez, Morocco 2 Chemistry department, High School of Technology, Fez Morocco 3 Chemistry department, Faculty of Medicine and Pharmacy of Fez, Morocco Received 17 Feb 2014; Revised 15 December 2014; Accepted 15 December 2014. * Corresponding Author.E-mail:[email protected], Tel: +212 66 1 35 83 66 Abstract The present work aims to evaluate the effect of marble powder, which is an industrial discharge, in the adsorption of yellow dye in the textile industry in Fes Medina.To get more information, the dye has been examined by Ultra-Violet (UV) spectrophotometer, Fourier transform infrared spectroscopy (FTIR) and Raman spectroscopy. The marble powder has also been characterized by physical and chemical technics such as X-ray fluorescence spectroscopy, X-ray Diffraction (XRD) and Scanning Electron Microscopy (SEM).The dye yellow adsorption by marble powder made show excellent performance related to the adsorption potential.In order to improve the rate of reduction we have synthesized materials based on copper and iron supported on marble powder, the results show no significant difference with those obtained with the powder of raw marble. Keywords: Adsorption, Marble, Dye yellow, kinetics 1. Introduction The key environmental issue that arises in the textile industry is the amount of water used for wet processing of textiles and discarded rich chemical load [1], without pre-treatment. However, wastewater from printing units and textile dyeing are often colored and contain residues of dyes and chemicals, which require appropriate treatment [2]. To meet legislative requirements, textile wastewater are most often treated by different physicochemical [3,4] and biological [5,6] methods. Nevertheless, the elimination of textile dyeing effluents in aquatic ecosystems has been considerable attention due to reported data on the mutagenic and genotoxic potential of textile dyes [7-9]. Thereby, can be removed by adsorption process in which the dye binds to the adsorbent. Large number of low-cost and biodegradable adsorbents can be used. These adsorbents can be obtained from natural resources for the elimination of various dyes under different conditions. The adsorption by activated carbon seems to be the best prospect for the elimination of dyes. Despite its effectiveness, this adsorbent is prohibitive and difficult to regenerate after use. Then there is a need to produce relatively inexpensive adsorbents which can be used for the treatment of polluted waters. Recently many researches were more interested by the use of various low-cost adsorbents, which also seem well suited to late substitute activated carbon [10]. A wide variety of low-cost materials such as natural clay [11-13], fly ash bagasse [14-15], sawdust [16], maize cob [17], peat [18-20], rice husk [21], cornelian cherry, apricot kernel, almond shell [22], cotton stalks [23], sunflower stalks [24] orange peel [25], wheat bran [26] ... has been used successfully for the removal of dyes in aqueous medium. The objective of this work is to make our contribution to clean up waters colored by the proposal of a new material which is marble powder where the latter may be better suited to this discoloration. 2. Materials and methods 2.1. Adsorbent and adsorbate Marble powder used in this work was provided in powder form by the “Company Marble Great Northern”.For the realization of our work, we are interested by the elimination of a yellow dye used mainly in traditional industries of textile Fez medina. 2.2. Yellow dye Characterization The structure of this dye used exclusively in industrial producer is unknown.
Transcript of Kinetics of yellow dye adsorption onto marble powder · PDF fileKinetics of yellow dye...

J. Mater. Environ. Sci. 6 (1) (2015) 79-92 Diouri et al. ISSN : 2028-2508 CODEN: JMESCN
79
Kinetics of yellow dye adsorption onto marble powder sorbents
K.Diouri1, A. Chaqroune1, A. Kherbeche2, J.Bentama2, A. Lahrichi3 1 Chemistry department, Faculty of Sciences Dhar Mahraz Fez, Morocco
2Chemistry department, High School of Technology, Fez Morocco 3Chemistry department, Faculty of Medicine and Pharmacy of Fez, Morocco
Received 17 Feb 2014; Revised 15 December 2014; Accepted 15 December 2014. * Corresponding Author.E-mail:[email protected], Tel: +212 66 1 35 83 66 Abstract The present work aims to evaluate the effect of marble powder, which is an industrial discharge, in the adsorption of yellow dye in the textile industry in Fes Medina.To get more information, the dye has been examined by Ultra-Violet (UV) spectrophotometer, Fourier transform infrared spectroscopy (FTIR) and Raman spectroscopy. The marble powder has also been characterized by physical and chemical technics such as X-ray fluorescence spectroscopy, X-ray Diffraction (XRD) and Scanning Electron Microscopy (SEM).The dye yellow adsorption by marble powder made show excellent performance related to the adsorption potential.In order to improve the rate of reduction we have synthesized materials based on copper and iron supported on marble powder, the results show no significant difference with those obtained with the powder of raw marble. Keywords: Adsorption, Marble, Dye yellow, kinetics 1. Introduction The key environmental issue that arises in the textile industry is the amount of water used for wet processing of textiles and discarded rich chemical load [1], without pre-treatment. However, wastewater from printing units and textile dyeing are often colored and contain residues of dyes and chemicals, which require appropriate treatment [2]. To meet legislative requirements, textile wastewater are most often treated by different physicochemical [3,4] and biological [5,6] methods. Nevertheless, the elimination of textile dyeing effluents in aquatic ecosystems has been considerable attention due to reported data on the mutagenic and genotoxic potential of textile dyes [7-9]. Thereby, can be removed by adsorption process in which the dye binds to the adsorbent.
Large number of low-cost and biodegradable adsorbents can be used. These adsorbents can be obtained from natural resources for the elimination of various dyes under different conditions. The adsorption by activated carbon seems to be the best prospect for the elimination of dyes. Despite its effectiveness, this adsorbent is prohibitive and difficult to regenerate after use. Then there is a need to produce relatively inexpensive adsorbents which can be used for the treatment of polluted waters. Recently many researches were more interested by the use of various low-cost adsorbents, which also seem well suited to late substitute activated carbon [10]. A wide variety of low-cost materials such as natural clay [11-13], fly ash bagasse [14-15], sawdust [16], maize cob [17], peat [18-20], rice husk [21], cornelian cherry, apricot kernel, almond shell [22], cotton stalks [23], sunflower stalks [24] orange peel [25], wheat bran [26] ... has been used successfully for the removal of dyes in aqueous medium. The objective of this work is to make our contribution to clean up waters colored by the proposal of a new material which is marble powder where the latter may be better suited to this discoloration. 2. Materials and methods 2.1. Adsorbent and adsorbate Marble powder used in this work was provided in powder form by the “Company Marble Great Northern”.For the realization of our work, we are interested by the elimination of a yellow dye used mainly in traditional industries of textile Fez medina. 2.2. Yellow dye Characterization The structure of this dye used exclusively in industrial producer is unknown.

J. Mater. Environ. Sci. 6 (1) (2015) 79-92 Diouri et al. ISSN : 2028-2508 CODEN: JMESCN
80
To get an idea of the dye composition, analyzes were performed by UV Spectrophotometer, Fourier Transform Infra Red (FTIR) and Raman Spectroscopy. 2.3. Marble powder Characterization The chemical composition of the white marble powder was examined by X-ray fluorescence spectrometry, X-ray Diffraction (XRD), Fourier Transform Infra Red (FTIR), Raman spectroscopy and Scanning Electron Microscopy (SEM). Boehm method which is widely used to determine the chemical surface functions of different adsorbents that were also used to characterize marble powder [27]. In addition, the pH of point of zero charge (PZC) was determined using the method derived pH [28]. To determine the behavior of the marble powder in aqueous media, we studied the temporal evolution of pH and conductivity as a function of time by varying the mass of the adsorbent and the stirring speed. 2.4. Adsorption isotherm The last step is adsorption isotherms study to model the curve, or more precisely to report it by a mathematical equation of the entire curve. Traditional models of Langmuir, Freundlich and Elovich will be used for their simplicity of implementation. The Langmuir model [29] is based on the following assumptions: Forming a single layer of adsorbate on the surface of the adsorbent. The existence of the defined sites of adsorption. The surface is uniform with no interaction between the adsorbed molecules. The Langmuir equation can be written as follows:
!Γ= !Γ∞+ !
!Γ∞!!"
(1) Where Γ is the adsorption capacity in moles of solute per gram of adsorbent (mol/g) or (mg/g), Γ∞ is the maximum capacity of adsorption (mol/g) or (mg/g), Cr is the concentration of residual solute (mol/l) or (mg/l) and K is the equilibrium constant of the torque solute adsorption / adsorbent (l/mol) or (l/mg). The Freundlich model [30], is based on an empirical equation that reflects a variation of energy with the adsorbed amount. This distribution of interaction energies can be explained by heterogeneity of adsorption sites. Unlike the Langmuir model, the Freundlich equation does not provide an upper limit for the adsorption which restricts its application to dilute media. However, this model admits the existence of interactions between adsorbed molecules [31]. It is of the following form:
Ln ( !"! ) = LnK + !
!LnCr (2)
Where m is the mass of the adsorbent (mg/l), Ca is the concentration of solute adsorbed (mol / l) or (mg/l), K and n are constant efficiency characteristics of a given adsorbent vis-à-vis a given solute and Ca/m is the adsorption capacity per unit mass of adsorbent (mol/g) or (mg/g). The Elovich equation is based on the kinetic principle assumes that the number of adsorption sites increases exponentially with adsorption, which implies a multilayer adsorption. It is described by the relation [32]:
Ln Γ!"
= LnKΓ∞ − ΓΓ∞
(3) Where Γ is the adsorption capacity, in moles of solute per gram of adsorbent (mol/g) or (mg/g), Γ∞ is the maximum capacity of adsorption, (mol/g) or (mg/g), Cr is the concentration of residual solute (mol/l) or (mg/l) and K is the equilibrium constant for couples solute adsorption / adsorbent (l/mol) or (l/mg). To study the adsorption isotherm of the dye at 25°C, a volume of one liter of distilled water containing the yellow dye at a concentration 30 g/l and the initial pH is brought into contact with different masses of powder marble. The stirring speed is set at 600 rpm. To determine the instantaneous concentration of the dye with time, the sample is centrifuged for 10 min at 4000 rpm, and the supernatant was immediately measured by a spectrophotometer UV visible. To measure the adsorption isotherms of the yellow dye in the marble powder at 25 °C, the duration of contacting solution-adsorbent was set to 20 min, at which time it is ensured that there is no significant variation concentration of the dye in equilibrium. 2.5. Effect of the mass of the powder of marble and effect of initial concentration of dye In order to study the effect of the mass of the powder of marble and the effect of the initial concentration of the dye, a yellow dye solution of different concentrations and initial pH, agitation is carried (600 rpm) with different mass of the powder of marble. For a contact time determined, 4ml of suspension was removed and then centrifuged for 10 min at a speed of 4000 rpm and the supernatant was immediately assayed by UV visible spectrophotometer. 2.6. Effect of pH on adsorption of the dye To study the effect of pH on the adsorption, a series of dye solution was prepared by adjusting the pH with HCl (0.1 N) and NaOH (0.1 N). 2.7. Synthesis of metallic materials supported on the powder of marble

J. Mater. Environ. Sci. 6 (1) (2015) 79-92 Diouri et al. ISSN : 2028-2508 CODEN: JMESCN
81
In order to improve the results obtained with the adsorption powder of raw marble, we proceeded to the preparation of materials based on copper and iron powder supported on marble. The synthesis of these materials was carried out by the impregnation method [33]. 3. Results and Discussion 3.1. Characterization of dye 3.1.1. Characterization of dye Ultraviolet Spectrophotometer The adsorption spectrum of the yellow dye is illustrated in Fig.1. The latter has two adsorption bands located at 220 and 394 nm. We take into account in the calculation of the rate of reduction peak at 394 nm [33].
Figure : Spectrum of the yellow dye adsorption studied
3.1.2. Characterization of dye Transformed Infra Red Spectroscopy Fourier Infra-Red spectrum of the yellow dye is given in Fig.2.The analysis shows the presence of a peak at 3377 cm-1 due to stretching vibrations the N-H group [34], a peak at 2823 cm-1 characteristic of CH3 [34], a peak at 1586cm-1 refers to the presence of the group-N = N [34], a peak at 1040 cm-1 characteristic the C-N group [34] and a final peak at 664 cm-1 characteristic of the CH group [34].
Figure 2: FTIR spectrum of the yellow dye
3.1.3. Characterization of Raman Spectroscopy dye The Raman spectrum of the yellow dye given in Fig.3, shows the presence of bands between 1300 and 1650 cm-1 which are due to the elastics vibrations of the chromophor group [35]. The peak at 1628 cm-1 is characteristic of the N-H bond shear and C-C stretching, the peak at 1480 cm-1 is characteristic of C-C bonds and C-O stretching, the peak at 1450 cm-1 also shows the presence of the C- C stretch and the peak at 1370 cm-1 shows the presence of the N = N stretch [36]. The results obtained by Raman spectroscopy confirm the results found by FTIR spectroscopy.

J. Mater. Environ. Sci. 6 (1) (2015) 79-92 Diouri et al. ISSN : 2028-2508 CODEN: JMESCN
82
Figure 3:RAMAN spectrum of the yellow dye
3.2. Characterization of the adsorbent 3.2.1. Characterization of marble powder by X-ray fluorescence spectrometry An analysis was made by X-ray fluorescence spectrometry to determine the chemical composition of the powder of marble; the results are shown in Table 1: Table 1: Chemical composition of the powder marble
Chemical compound Results (%) CaO 55.4 SiO2 2.31 SO3 0.61
MgO 0.54 Al2O3 0.19 Fe2O3 0.07 Na2O 0.03 K2O 0.01
Mn2O3 0.01 K2O 0.01 TiO2 0.01
Loss on ignition at 1000 °C 40.81 3.2.2. Characterization of marble powder by X-ray diffraction To determine the structure of the powder of marble, we proceeded to the recording of a spectrum of X-ray Diffraction. The diagram obtained is shown in Fig.4. The examination of this diagram shows that the powder of marble is consisting essentially by: Calcite (CaCO3) [33], Silica (SiO2) [33].

J. Mater. Environ. Sci. 6 (1) (2015) 79-92 Diouri et al. ISSN : 2028-2508 CODEN: JMESCN
83
Figure 4: XRD spectrum of the powder of marble
3.2.3. Characterization of marble powder by Infrared Spectroscopy An examination of the marble powder by FTIR is shown in Fig.5., the analysis spectrum shows the presence of large bands located at 710 cm-1, 1500 cm-1, 1800 cm-1 and 2500cm-1qui correspond to the presence of calcite [37], a band around 1600 cm-1 corresponds to HOH and a band at about 800 cm-1 indicates the presence of Si-O [33]. The results are in perfect agreement with those of XRD.
Figure 5: IR spectrum of the powder of marble
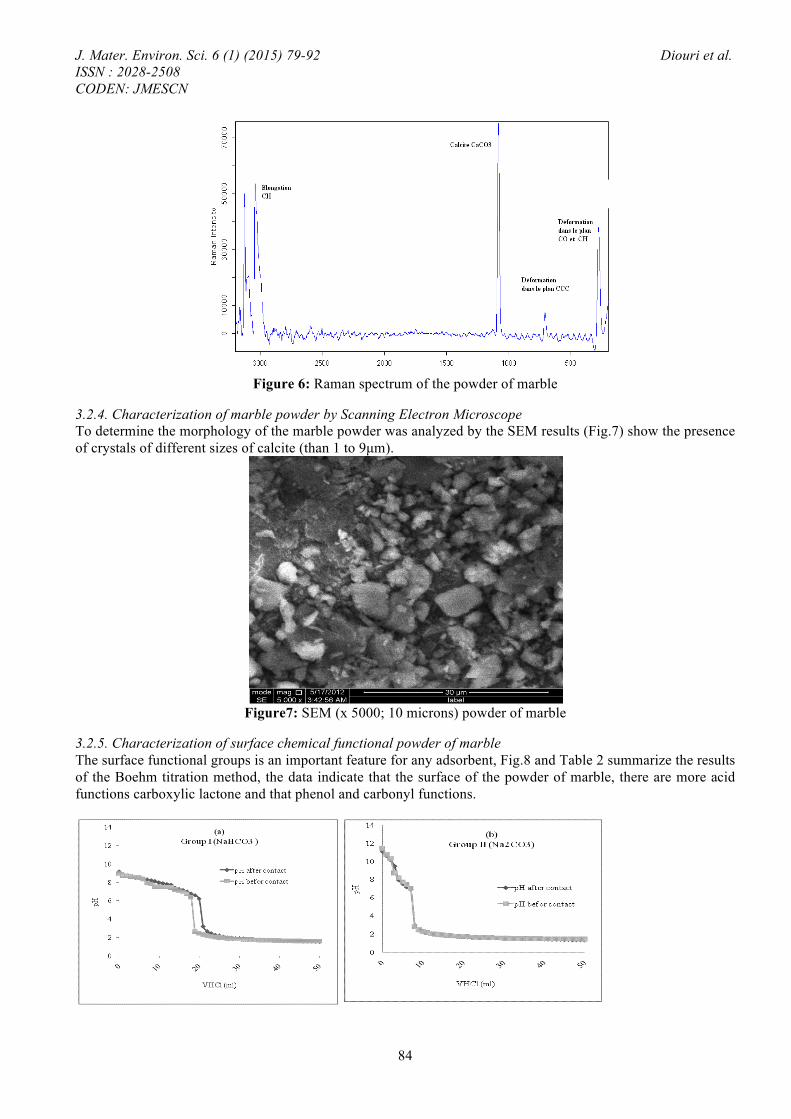
3.2.3. Characterization of marble powder by Raman Spectroscopy The Raman spectrum of the powder of marble is given in Fig.6. It shows the presence of a band at 1086 cm-1, characteristic of calcite CaCO3 [38], a band at 3000 cm-1 characteristic of CH, a band at 750 cm-1 characteristic of CCC and a characteristic band of CH and CO to 300 cm-1 [39].
J. Mater. Environ. Sci. 6 (1) (2015) 79-92 Diouri et al. ISSN : 2028-2508 CODEN: JMESCN
84
Figure 6: Raman spectrum of the powder of marble
3.2.4. Characterization of marble powder by Scanning Electron Microscope To determine the morphology of the marble powder was analyzed by the SEM results (Fig.7) show the presence of crystals of different sizes of calcite (than 1 to 9µm).
Figure7: SEM (x 5000; 10 microns) powder of marble
3.2.5. Characterization of surface chemical functional powder of marble The surface functional groups is an important feature for any adsorbent, Fig.8 and Table 2 summarize the results of the Boehm titration method, the data indicate that the surface of the powder of marble, there are more acid functions carboxylic lactone and that phenol and carbonyl functions.

J. Mater. Environ. Sci. 6 (1) (2015) 79-92 Diouri et al. ISSN : 2028-2508 CODEN: JMESCN
85
Figure 8: Evolution of neutralizing bases NaHCO3 (a), Na2CO3 (b), NaOH (c) C2H5ONa (d) by HCl before
(control) and after contact with the powder of marble. Table 2: Results of the assay of chemical functional surface of the marble powder
Group meq/g GI : Fonction acide carboxylique 0.0105 GII : Fonction lactone 0.0105 GIII : Fonction phénol 0.0055 GIV : Fonction carbonyle 0.0055 ∑ Fonction de surface 0.032
3.2.6. Determining the point of zero charge of the powder of marble The combined influence of all the functional groups of the marble powder determines the pH of point of zero charge (PZC), i.e. the pH where the net surface charge on the powder of marble is zero. In the case where the pH<pHPZC, the surface of the marble powder has a positive charge, whereas at pH>pHPZC surface has a negative charge. [40] Figure9 represents the pH data derived from which pHPZC of the adsorbent can be determined. The pHPZC is the point where the pHfinal =pHinitial [28], for marble powder used in this work the pHPZC = 8.3 this is in agreement with the results found by Shaban E. Ghazy H.M. Gad and Abdullah [37].
Figure 9: Determination of pHPZC
3.2.7. Determining the behavior of the powder of marble in aqueous medium The results of the time course of the pH and conductivity in distilled water in contact with different loadings of the powder of marble are represented in Fig.10 and 11 respectively. The analysis of the kinetic curve of the evolution of pH, shows that there is a rapid increase in pH during the first 10 minutes of contact and then stabilizes at its maximum value is 8. This increase in pH is due to the presence of calcium oxide (CaO). The analysis of the curve of the conductivity kinetic study shows that there is an increase in conductivity during the first 120 minutes of contact and then stabilizes at a maximum value.

J. Mater. Environ. Sci. 6 (1) (2015) 79-92 Diouri et al. ISSN : 2028-2508 CODEN: JMESCN
86
Note that the increase in mass of the powder marble has no significant effect on the temporal evolution of pH, by cons it causes growth electrical conductivity. This is due to the dissolution of minerals present in the powder of marble. These results are similar to those found by M.LAHLOU on diatomite [33]. The analysis of the curve of the conductivity kinetic study shows that there is an increase in conductivity during the first 120 minutes of contact and then stabilizes at a maximum value. Note that the increase in mass of the powder marble has no significant effect on the temporal evolution of pH, by cons it causes growth electrical conductivity. This is due to the dissolution of minerals present in the powder of marble. These results are similar to those found by M.LAHLOU on diatomite [33].
Figure 10: pH Kinetic (25°Cand 1000 rpm stirring speed)
Figure 11: Conductivity Kinetic (25°C and stirring speed 1000 rpm)
We conducted further studies on the influence of the stirring speed on the pH and the conductivity of the suspension. The results obtained for speeds between 300 and 1000 rpm were shown in Fig.12 and 13. According to these two figures we see that the stirring rate has no significant influence on the pH, but contributes to the increase in conductivity. This is due to the presence of the inorganic salts dissolved in the solution. A similar trend was reported in the study of the effect of stirring speed on the pH and conductivity of the diatomite [33], the increase in conductivity could be interpreted by the dispersion of the particles diatomite which considers the interaction forces and particularly the repulsion is negligible.
Figure 12:Kinetic evolution of pH at 25 °Cwith agitation
speedy
Figure 13: Kinetic evolution Conductivity at25 °C with
agitation speedy
3.3. Adsorption isotherm of the yellow dye of the powder of marble 3.3.1. Langmuir model Modeling of the adsorption isotherm of dye yellow powder marble by the Langmuir model was performed with the linearized form m/Ca=f(1/Cr) (figure14).

J. Mater. Environ. Sci. 6 (1) (2015) 79-92 Diouri et al. ISSN : 2028-2508 CODEN: JMESCN
87
Figure14: Langmuir isotherm
From Fig.14, we note that the linearization of the adsorption isotherm of the yellow dye is satisfactory marble powder with a good correlation coefficient R2=0.985. We note that this model is suitable for the adsorption Langmuir. The maximum value of adsorption capacity and the equilibrium constant equal to 41.66 mg/g to 0.015 respectively. 3.3.2. Freundlich model Modeling of the adsorption isotherm of dye yellow powder marble by the Freundlich model was performed with the linearized form Ln (Ca / m) = f (LnCr) (Fig.15).
Figure 15: Freundlich isotherm
We note that the linearization of the adsorption isotherm of the yellow dye powder marble by the Freundlich model is satisfactory (correlation coefficient R2 = 0.984). The value of the adsorption capacity and the equilibrium constants n and KF are equal to 13,07mg/g, 1.36 and 1.08 respectively. 3.3.3. Elovich model Modeling of the adsorption isotherm of dye yellow powder marble by the Elovich model was performed with the linearized form Ln(Ca/m/Cr)=f(Ca/m) (Fig.16).
J. Mater. Environ. Sci. 6 (1) (2015) 79-92 Diouri et al. ISSN : 2028-2508 CODEN: JMESCN
88
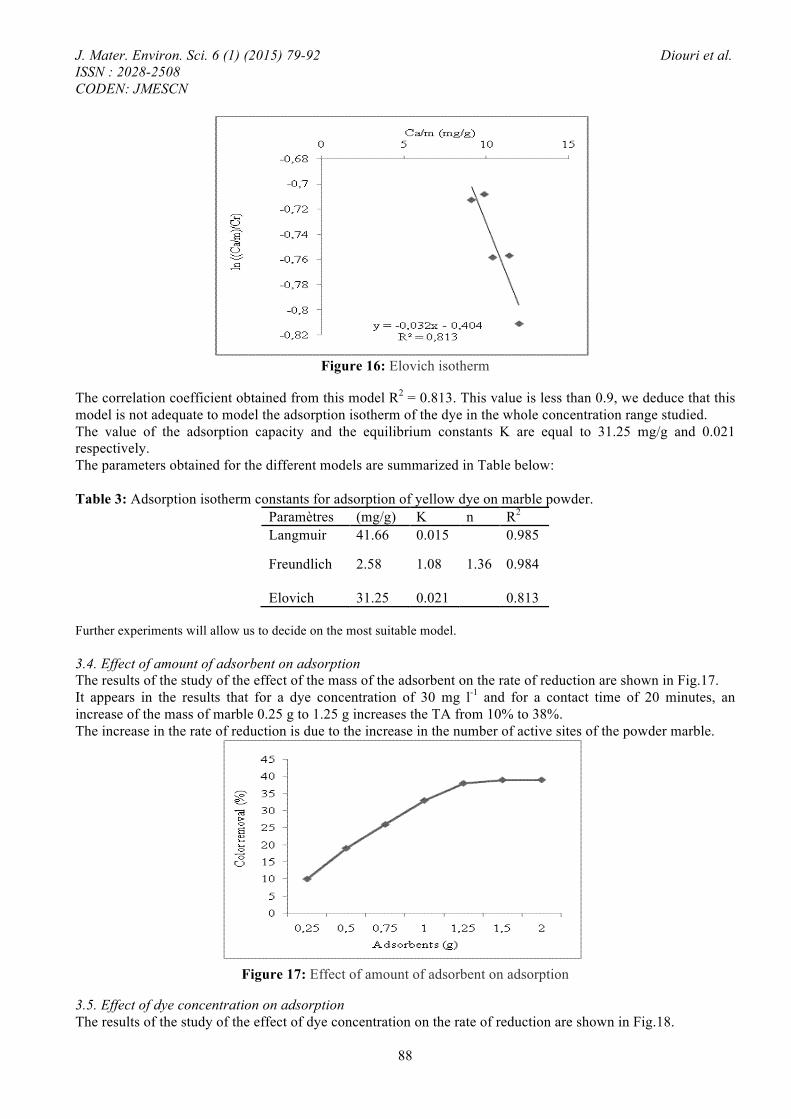
Figure 16: Elovich isotherm
The correlation coefficient obtained from this model R2 = 0.813. This value is less than 0.9, we deduce that this model is not adequate to model the adsorption isotherm of the dye in the whole concentration range studied. The value of the adsorption capacity and the equilibrium constants K are equal to 31.25 mg/g and 0.021 respectively. The parameters obtained for the different models are summarized in Table below: Table 3: Adsorption isotherm constants for adsorption of yellow dye on marble powder.
Paramètres (mg/g) K n R2 Langmuir 41.66 0.015 0.985
Freundlich 2.58 1.08 1.36 0.984
Elovich 31.25 0.021 0.813 Further experiments will allow us to decide on the most suitable model. 3.4. Effect of amount of adsorbent on adsorption The results of the study of the effect of the mass of the adsorbent on the rate of reduction are shown in Fig.17. It appears in the results that for a dye concentration of 30 mg l-1 and for a contact time of 20 minutes, an increase of the mass of marble 0.25 g to 1.25 g increases the TA from 10% to 38%. The increase in the rate of reduction is due to the increase in the number of active sites of the powder marble.
Figure 17: Effect of amount of adsorbent on adsorption
3.5. Effect of dye concentration on adsorption The results of the study of the effect of dye concentration on the rate of reduction are shown in Fig.18.

J. Mater. Environ. Sci. 6 (1) (2015) 79-92 Diouri et al. ISSN : 2028-2508 CODEN: JMESCN
89
The analysis of the temporal evolution of the rate of reduction for a given concentration shows that it increases rapidly during the first 10 minutes and then reached equilibrium around a stationary maximum value. The increase observed during the first ten minutes is probably due to the abundance of active sites on the surface of the adsorbent. According to the curve of Figure 18 the contact time required to reach equilibrium conditions was 20 min. The analysis of the temporal evolution of the TA for different dye concentrations (Fig.19) shows that TA increases from 10% to 40% when the dye concentration from 10 mg/l to 45mg/l. beyond this value, the TA remains unchanged. This is in agreement with the results obtained on clay Fouchana [41,42]. The shapes of the curves are similar and approximately independent of the concentration of the first dye. A similar trend was reported for the adsorption of dyes such as reactive dye adsorption on activated sludge dried [44], metal complex dyes on pine sawdust [45] and Rhodamine-B coal active [46]. On the other hand, the maximum adsorption capacity for a mass of marble powder 1g is around 40 mg/l, confirming that the adsorption of the dye by the yellow powder of marble follows the Langmuir isotherm.
Figure 18: Effect of contact time for different initials concentration on adsorption
Figure 19: Effect of dye concentrationson adsorption
(C ranging from 10 mg/l to 60 mg/l) 3.6. Effect of pH on adsorption The study of the rate of reduction depending on the pH of the dye is shown in Fig.20. This percentage reduction is equal to 48% at pH 5 and pH decreases for basic. The adsorption of the dye is favored under acidic conditions; this trend can be explained as follows: A is an acidic pH i.e. below the pHPZC (which is equal to 8.3), the surface of the adsorbent particles loaded becomes increasingly positive and attracts anions of the yellow dye in a strong manner.

J. Mater. Environ. Sci. 6 (1) (2015) 79-92 Diouri et al. ISSN : 2028-2508 CODEN: JMESCN
90
The result of the increase of the adsorption of the dye by the powder bed in an acid environment, is the same as that found on the adsorption of the dye Acid Orange 10 of the fly ash from the bagasse [47] and the adsorption of dyes Reactive Blue 2, Reactive Red 4 and Reactive Yellow 2 on activated carbon [10].
Figure 20: Effect of pH on adsorption
3.7. Synthesis of metallic materials supported on the powder of marble The results presented in Fig.21 and 22 show the evolution of the rate of reduction in function of time for different percentages of copper and iron respectively supported on the powdered marble. The analysis of these curves shows that the percentage of metal has no significant effect on the rate of reduction of the yellow dye, in contrast to results found by Lahlou and col. for the diatomite where the rate of reduction of the yellow dye showed an increase of 39% to 50% for the material to 0.5% Copper and 39% to 54% for 0.5% of the iron material [33].
Figure 21: Influenceof the percentage ofcopperon adsorption

J. Mater. Environ. Sci. 6 (1) (2015) 79-92 Diouri et al. ISSN : 2028-2508 CODEN: JMESCN
91
Figure 22: Influence of the percentage of ironon adsorption
4. Conclusions Marble powder has shown its effectiveness in removing the dye in aqueous solution. The adsorption is highly dependent on various parameters such as the mass of adsorbent, contact time, pH and initial concentration of the dye. The adsorption capacity increased with increasing the concentration of the yellow dye. Instead, this capacity decreased with increasing pH of the same color. The kinetics of dye adsorption on powdered marble is fast, equilibrium is reached after 20 min. The adsorption isotherms of dye powder of marble rather satisfactorily follow the Langmuir model. References 1. Robinson T., McMullan G., Marchant R., Nigam P. Bioresour. Technol. 77 (2001) 247. 2. Chakraborty S., Purkait M. K., DasGupta S., De S., Basu J. K. Sep. Purif. Technol. 31 (2003) 141. 3. Szygula A., Guibal E., Maria Palacin M. A., Ruiz M., Sastre A. M. J. Environ. Manage. 90 (2009) 2979. 4. Ghoneim, M. M., El-Desoky H. S., Zidan N. M. Desalination 274 (2011) 22. 5. Dos Santos A. B., Cervantes F. J., Van Lier J. B. Bioresour. Technol. 98 (2007) 2369. 6. Khouni I., Marrot B., Amar R. B. Sep. Purif. Technol. 87 (2012) 110. 7. Chung K. T., Cerniglia C. E. Mutat. Res. 277 (1992) 210. 8. Rajaguru P., Chinnasamy, Rafferty J. A. Mutat. Res. 444 (1999) 175. 9. Al-Sabti K. Environ. Saf. 47 (2000) 149. 10. Al-Degs Y. S. Dyes Pigm. 77 (2008) 16. 11. El-Geundi M. S. Adsor. Sci. Technol. 8 (1991) 217. 12. El-Geundi M. S. Adsor. Sci. Technol. 9 (1993) 199. 13. El-Geundi M. S. Adsor. Sci. Technol. 9 (1993)109. 14. Mall I. D., Upadhyay S. N. J. Indian. Pulp. Paper Technol. Assoc. 7 (1995) 51. 15. Swamy M. M., Mall I. D., Prasad B., Mishra I. M. Ind. J. Environ. Health 40 (1998) 67. 16. Poots V. J. P., McKay G., Healy J. J. J. Water Pollut. Control. Fed. 50 (1978) 926. 17. El-Geundi M. S. Adsor. Sci. Technol. 7 (1990) 124. 18. Poots V. J. P., Mckay G., Healy J. J. Water Res. 10 (1976) 106. 19. Allen S. J. Fuel 66 (1987) 1171. 20. Allen S. J., Mckay G., Khader K. Y. H. Environ. Pollut. 56 (1989) 39. 21. Malik P. K. Dyes Pigm. 56 (2003) 239. 22. Demirbas E., Kobya M., Senturk E., Ozkan T. Water SA 30 (2004) 533. 23. Attia A. A., El-Hendawy A. A., Khedr S. A., El-Nabarawy Th. Ads. Sci. Technol. 22 (2004) 411. 24. Sun G., Xu X. Ind. Eng. Chem. Res. 36 (1997) 808. 25. Arami M., Limaee N. Y., Mahmoodi N. M., Tabrizi N. S. J. Colloid Interface Sci. 288 (2005) 371. 26. Sulak M. T., Demirbas E., Kobya M. Bioresour. Technol. 98 (2007) 2590. 27. BAMBA D. (Octobre 2007) « Elimination du Diuron des eaux par des techniques utilisant les ressources naturelles de la CÔTE D’IVOIRE : Photocatalyse solaire et charbon actif de coques de noix de coco » Thèse de doctorat de l’Université de COCODY – ABIDJAN. 28. Hameed B. H., Tan I., Ahmad A. L. Chem. Eng. J. 144 (2008) 235.

J. Mater. Environ. Sci. 6 (1) (2015) 79-92 Diouri et al. ISSN : 2028-2508 CODEN: JMESCN
92
29. Langmuir L. J. Am. Chem. Soc. 40 (1918) 30. Freundlich H. Colloid and Capillary Chemistry, Metheum, London, 1926 31. Mc Kay G. Use of Adsorbents for the Removal of Pollutants From Wastewaters, CRC Press, 1996. 32. N.GHERBI (2008) « Etude expérimentale et identification du processus de rétention des cations métalliques par des matériaux naturels » Thèse de doctorat de la Faculté des Sciences de l'Ingénieur de l’Algérie. 33. M’hmmed LAHLOU (Mars 2008) «Elaboration de matériaux nanométriques supportés sur diatomite et étude des paramètres de contrôle pour l’élimination de certains polluants toxiques en milieux aqueux» Thèse de doctorat de Université Sidi Mohamed Ben Abdellah-FES. 34. Sushama S. Gomare, Dhawal P. Tamboli, Anuradha N. Kagalkar, Sanjay P. Govindwar, Eco-friendly biodegradation of a reactive textile dye Golden Yellow HER by Brevibacilluslaterosporus MTCC 2298. International Biodeterioration& Biodegradation 63 (2009) 582–586. 35. Vosgr.one T., Meixner A. J. J. Lumin. 107 (2004) 13. 36. Andrikopoulos P. C., McCarney K. M., Armstrong D. R., Littleford R. E., Graham D., Smith W. E. J. Mol. Struct. 789 (2006) 59. 37. Shaban E. Ghazy, Abdullah H.M. Gad. Arabian Journal of Chemistry.accepted 31 October 2010. 38. Vagenas N. V., Kontoyannis C. G. Vib. Spectrosc 32 (2003) 261. 39. W. Zhu, T. Wei, X. Zhang, H. Xiao J. Molecular Structure (Theochem) (2008). 40. Al-Degs Y., Khraisheh M., Allen S., Ahmad M. Water Res. 35 (2000) 34. 41. Emna ERRAIS (Mars 2011) « Réactivité de surface d’argiles naturelles Etude de l’adsorption de colorants anioniques », THESE Pour l'obtention du diplôme de DOCTEUR DE L'UNIVERSITE DE STRASBOURG de l’Université de STRASBOURG. 42. Errais E., Duplay J., Darragi F., M'Rabet I., Aubert A., Huber F., Morvan G. Desalination 275 (2011) 74. 43. Al-Ghouti M. A., Khraisheh M., Allen S. J., Ahmad M. N. J. Environ. Manag. 69 (2003) 229. 44. Aksu Z. Biochem. Eng. J. 7 (2001) 79. 45. Ozacar M., Sengil A. I. Bioresour. Technol. 96 (2005) 791. 46. K. Kadirvelu, C. Karthika, N. Vennilamani, S. Pattabhi, Chemosphere 60 (2005) 1009. 47. Indra D. Mall, Vimal C. Srivastava, Nitin K. Agarwal. R. Dyes Pigm. 69 (2006) 210. (2015) http://www.jmaterenvironsci.com