Kinetics of Gas Hydrate Nucleation and Growth of Gas Hydrate Nucleation and Growth by Hailu Kebede...
126
Kinetics of Gas Hydrate Nucleation and Growth by Hailu Kebede Abay Thesis submitted in fulfilment of the requirements for the degree of DOCTOR OF PHILOSOPHY (PhD) Faculty of Science and Technology Department of Petroleum Engineering 2011
-
Upload
duongnguyet -
Category
Documents
-
view
231 -
download
0
Transcript of Kinetics of Gas Hydrate Nucleation and Growth of Gas Hydrate Nucleation and Growth by Hailu Kebede...
Kinetics of Gas HydrateNucleation and Growth
by
Hailu Kebede Abay
Thesis submitted in fulfilment of therequirements for the degree of
DOCTOR OF PHILOSOPHY(PhD)
Faculty of Science and TechnologyDepartment of Petroleum Engineering
2011

University of StavangerNO-4036 StavangerNORWAYwww.uis.no
Copyright c© 2011 Hailu Kebede Abay
ISBN: 978-82-7644-463-6ISSN: 1890-1387

Preface
My PhD dissertation comprises of six papers published in international journalsand proceedings. Three of the six papers are published in the Journal of Energy& Fuels and the rest three in the proceedings of the 7th International Confer-ence on Gas Hydrates. All these papers are preceded by a review followed byproposed future work. The papers are enumerated in chronological order basedon the the dates of publication. I have used Roman numerals in listing andreferencing the papers.
In Paper I, effect of ultralow concentration of methanol on methane hydrateformation is presented.In Paper II, multicomponent gas hydrate nucleation and the effect of coolingrate and gas composition is presented. The methods of paper I has been em-ployed.In Paper III, effect of gas composition on structure II hydrate growth kineticshas been extended from the nucleation study of paper II.In Paper IV, a time-dependent kinetic rate model has been proposed for thekinetics of methane hydrate formation.In Paper V, promotional effect of PVCap on the nucleation of structure II hy-drates is presented.In Paper VI, the effect of PVCap on methane hydrate nucleation and growth ispresented.
Most of these papers are definitely of great interest from both scientific andcommercial perspectives as they have bearing on production and gas pipelineblockage issues. The methods I used are also important for further fundamentalresearch on other similar systems especially for those who are interested on gashydrate nucleation and growth processes.
iii

iv

Acknowledgments
I would like to express my sincere thanks to my supervisor Dr. Thor MartinSvartaas for his continuous supervision and valuable feedbacks. I would like tothank my co-supervisor Dr. Rune Time for his positive attitude for a help. NFRis also greatly acknowledged for the financial support of all my work through aPhD research fellow position.
All my studies were carried out at Stavanger University, Department of PetroleumEngineering. The Department has provided me a motivating environment dur-ing my study and I would like to thank all the academic and administrative staffmembers of the Department who supported me during the course of my study.
I would like also to thank Dr. Helge Hodne for his kind support in provid-ing me the latex format for writing this dissertation. I would like to thank allthe technicians of the Department of Petroleum Engineering, especially SivertB. Drangeid, Svein Myhren, and Ola K. Siqveland, for their technical supportin laboratory work and Latex writing.
I would like also to thank all my friends who encouraged me both academi-cally and socially. Special thanks go to Desalegn Yeshitila and Ke Wei.
Last, but not least, I would like to thank my wife Yimegnushal Abebe, andtwo of my daughters, Hermella Hailu and Mariana Hailu, for their love andcare. Without their support, I would have not been successful in my study andresearch.
v

List of papers
The following six papers are internationally published. All copies of the papersare enclosed in the appendix and referenced by their Roman numerals in thisdissertation as follows:
I Hailu K. Abay and Thor M. Svartaas, Effect of Ultralow Concentration ofMethanol on Methane Hydrate Formation, Energy & Fuels, 24, 752-757,(2010).
II Hailu K. Abay and Thor M. Svartaas, Multicomponent Gas Hydrate Nu-cleation: The Effect of the Cooling Rate and Composition, Energy & Fuels,25, 42-51, (2011).
III Hailu K. Abay, Thor M. Svartaas and Ke Wei, Effect of Gas Compositionon sII Hydrate Growth Kinetics, Energy & Fuels, 25, 1335-1341, (2011).
IV Hailu K. Abay and Thor M. Svartaas, On the Kinetics of Methane HydrateFormation: A Time-dependent Kinetic Rate Model, Proceedings of the 7thInternational Conference on Gas Hydrates, Edinburgh, United Kingdom,July 17-21, 2011.
V Hailu K. Abay, Eirik Hovring and Thor M. Svartaas, Does PVCap PromoteNucleation of Structure II Hydrate? Proceedings of the 7th InternationalConference on Gas Hydrates, Edinburgh, United Kingdom, July 17-21,2011.
VI Hailu K. Abay, Jonas Hovland and Thor M. Svartaas, The Effect of PV-Cap on Methane Hydrate Nucleation and Growth, Proceedings of the 7thInternational Conference on Gas Hydrates, Edinburgh, United Kingdom,July 17-21, 2011.
vii

viii

Nomenclature
AAs Antiagglomerantsc1 Concentration of component 1Ckj Langmuir constant of species k in cavity jD1,2 Interdiffusion coefficient of component 1 in component 2fgk Fugacity of gas component k∆g Driving force for a critical nucleusJ Rate of nucleation min−1
Jq Heat fluxJ1 Mass flux of component 1k Boltzmann constantk Kinetic rate min−1
KHIs Kinetic hydrate inhibitorsLDHIs Low dosage hydrate inhibitorsMEG Monoethylene glycolMeOH MethanolMw Weight average molecular weightmL MilliliterN Average number of nuclein Number of moles of gas consumed∆n Amount of gas hydrates formednw Number of water molecules in unit cellp Probability of nucleationP Pressure barPeq Equilibrium pressure barPm Probability of forming m nuclei∆P Pressure drop barPVCap polyvinylcaprolactumPVP PolyvinylpyrrolidoneR Average growth rate
ix

x
R Universal gas constantrpm Revolution per minuteSNG Synthetic natural gasT Temperature oC∆T Degrees of subcooling oC∆T Hydrate depression temperature oFTHIs Thermodynamic hydrate inhibitorst Induction time min∆t Time interval in forming a nucleiV Volume of gasV Unit volume of N nucleivj Number of type j cavities per water moleculevw Molar volume of water molecule in solutionvhw Molecular volume of water molecule in hydrateW Weight % of inhibitorW ∗ Second derivative of activation energy at the critical sizex wt% of methanoly Composition in gas phasey1 Activity coefficientz Compressibility factorτ Lag time minθkj Fractional filling of cavity j by molecule k∆ϕ∗ Activation energy for the formation of a critical size clusterλ Eigenvalue of the product of growth matrixµ Chemical potentialσ Entropy production

Contents
Preface iii
Acknowledgments v
List of papers vii
Nomenclature ix
Contents xi
1 Introduction 11.1 Gas Hydrates . . . . . . . . . . . . . . . . . . . . . . . . . . . . . 11.2 Hydrate Formation . . . . . . . . . . . . . . . . . . . . . . . . . . 2
1.2.1 Nucleation of Gas Hydrates . . . . . . . . . . . . . . . . . 21.2.2 Growth of Gas Hydrates . . . . . . . . . . . . . . . . . . . 7
1.3 Gas Hydrate Issues . . . . . . . . . . . . . . . . . . . . . . . . . . 91.3.1 Gas Hydrates as Threats . . . . . . . . . . . . . . . . . . 91.3.2 Gas Hydrates as Opportunities . . . . . . . . . . . . . . . 101.3.3 Gas Hydrates as Nuisance . . . . . . . . . . . . . . . . . . 10
2 Objective 15
3 Experimental Setup and Procedure 173.1 Experimental Setup . . . . . . . . . . . . . . . . . . . . . . . . . 173.2 Experimental Procedure . . . . . . . . . . . . . . . . . . . . . . . 18
4 Main Results and Discussion 234.1 Effect of MeOH, PVP and PVCap on Nucleation and Growth . . 23
xi
xii Contents
4.2 Effect of Cooling Rate and Gas Compositions on Nucleation andGrowth . . . . . . . . . . . . . . . . . . . . . . . . . . . . . . . . 28
4.3 Time-dependent Kinetic Rate Model for Single-component Hy-drate Growth . . . . . . . . . . . . . . . . . . . . . . . . . . . . . 33
5 Conclusion 37
6 Proposed Future Work 39
Bibliography 41
Appendix 50
A Paper I 51
B Paper II 61
C Paper III 75
D Paper IV 85
E Paper V 99
F Paper VI 107
Chapter 1
Introduction
1.1 Gas Hydrates
Gas hydrates are ice-like crystalline compounds that are composed of watermolecules (host) with encaged gas molecules (guests). Despite gas hydrateslook like ice, they are quite different from ice as they can exist at temperatureswell above the ice point and also with their structures. The most common gashydrate crystal structures are structure I (sI, cubic), structure II (sII, cubic),and structure H (sH, hexagonal) of which sII is the commonest. Physical andchemical properties of these structures are different [1]. The present work fo-cuses only on sI and sII hydrates. Generally, these structures are composed ofcavities formed from hydrogen-bonded water molecules where the guest moleculeis trapped in the host. A specific number of water molecules is associated witheach gas molecule due to the framework of the crystal type. For example, theideal cubic unit cell of sI hydrate consists of two small pentagonal dodecahedron(512) cavities and six large tetrakaidecahedron (51262) cavities with a total of46 water molecules. SII hydrate is composed of 16 small (512) cavities and 8large hexakaidecahedron (51264) cavities with a total of 136 water molecules.Each cavity is formed from hydrogen-bonded water molecules. Fig. 1.1 shows512, 51262 and 51264 cavities of sI and sII hydrates. The smallest cavity can ac-commodate one guest molecule of suitable size and shape but the largest cavitycan accommodate two guests of suitable combination in size. At high pressuresand at lower temperatures, the process of filling these cages by a guest moleculestarts when hydrates begins to nucleate and grow which is called the process ofhydrate formation.
1

2 Chapter 1
Figure 1.1: Three different cavities of sI and sII hydrates.
1.2 Hydrate Formation
Hydrate formation processes starts with encaging a guest into a host undersuitable low temperature and high pressure conditions. Hydrate formation isphysical rather than chemical in nature. The physical conditions required toform gas hydrates are guests and hosts with the correct conditions of low tem-peratures and high pressures. No strong chemical bonds are formed betweenthe guest and the host. In fact, the guest molecule is free to rotate within thevoid spaces of the host. The process of hydrate formation has two major stages,nucleation and growth.
1.2.1 Nucleation of Gas Hydrates
Nucleation in general is a complex process especially before reaching a steady-state regime [2, 3, 4, 5, 6] where a steady-state nucleation occurs. Besides, itis a stochastic process [7] requiring many experiments to be performed on asystem with the same experimental condition. Prediction of hydrate onset anddeterministic approach on the process of nucleation is unlikely. Attempts inpredicting when and where hydrate plugs form in flow lines [8] or limiting thestochastic nature of gas hydrate crystallization and increase data repeatabil-ity [9] have been made on hydrate formation processes. Induction time mea-surements for water droplets with hydrate memory could be shorter than thedroplets without hydrate memory [10, 11] in sII hydrates. In fact, during asearch for memory effect study in sI hydrates [12], it was proved that there wasno evidence of a significant difference between the structure of water before andafter the hydrate formation, nor in the water around the guest. Induction pe-riod was also shortened by the memory effect on the study [13] on the kinetics ofsH hydrates. A recent investigation [14] also showed that a significant improve-ment in the reproducibility of induction times can be obtained by adding smallamounts of impurities to the hydrate-forming system. However, the appearance

Introduction 3
of a critical nucleus from fresh water experiments is a very random process thatcannot be predicted. For such random process of nucleation, probabilistic ap-proach is more appropriate than deterministic approach due to the nature ofthe system.
The probability Pm of forming exactly m nuclei within a time interval ∆t isgiven by the Poisson distribution law [15, 16]:
Pm =Nmexp(−N)
m!(1.1)
where N(t) is the expected average number of nuclei within the interval ∆t.From this equation, the probability P0 to form m = 0 nuclei is P0 = exp(−N),the probability to form exactly 1 nucleus (m = 1) is P1 = Nexp(−N). Thus,the probability P≥m to form at least m, i.e., m or more than m, nuclei withinthe interval ∆t is:
P≥m = 1− P0 − P1 − P2 − ...− Pm−1 = 1−m−1∑
0
Pi (1.2)
Hence from Eqs. 1.1 and 1.2, we have:
P≥m = 1− exp(−N)i=m−1∑i=0
N i
i!(1.3)
Employing Eq. 1.3, the probability P≥1 that at least 1 nucleus has appeared inthe time interval ∆t is given by:
P≥1 = 1− P0 = 1− e−N (1.4)
Now, the average number of nuclei N appeared in the time interval ∆t andvolume V is related to the stationary nucleation rate J as [17]:
N = JV∆t (1.5)

4 Chapter 1
Inserting the right hand side expression of Eq. 1.5 into Eq. 1.4, the probabilityP ′(∆t) that at least 1 nucleus has appeared in the time interval ∆t becomes:
P ′(∆t) = 1− e−JV∆t (1.6)
Experimental detection of a nuclei requires that the formed nuclei in a solutionhave to grow to a detectable size which could result in a continuous intake of gasmolecules into the solution. This causes a delay called the lag time τ betweenthe time ∆t of appearance of a nucleus and the time t of detection called theinduction time. Thus, ∆t = t − τ , and inserting this expression into Eq. 1.6,the probability P (t) of detecting hydrate crystals per unit volume at time t thatwere nucleated at earlier time becomes:
P (t) = 1− e−J(t−τ) (1.7)
Eq. 1.7 is called the nucleation probability distribution function where J therate of nucleation, t is the induction time and τ is the corresponding lag time,which is the measure of the time necessary for the nucleation rate to attain asteady-state value. Before attaining the steady-state regime, the rate of nucle-ation has a transient regime that corresponds to the time required to attain asteady-state distribution of nuclei [18]. The probability distribution functionof Eq. 1.7, could be applied to analyze nucleation experiments of crystals ingeneral and gas hydrates in particular [19, 20, 21]. Other methods could also beapplied. For example, the rate of nucleation could be determined by countingthe total number of particles detected by cameras [22] or the method of laserlight scattering by measuring the intensity of the scattered light during hydratenucleation [23].
Nucleation is a microscopic phenomenon involving many molecules and too dif-ficult to observe it experimentally. Despite the existence of alternative methodsin studying nucleation, the method based on induction time measurement has abetter advantage as induction time measurement bridges nucleation theory andexperimental investigation [24]. This experimentally accessible induction time isthe measure of the ability of a system to remain in the state of metastable equi-librium and contains valuable information about the kinetics of nucleation [25].

Introduction 5
0
5
10
15
2
4
6
8
10
12
14
16
-50 0 50 100
Gas
con
sum
ptio
n (b
ar) Tem
perature (°C)
Time (min)
Hydrate growth
Nucleation region
Induction time
Heat release at onset of hydrate formation
Cell agitation
Cooling region
Figure 1.2: Experimental measurement of induction time t. The solid red curveis the gas consumption in bars and the broken blue curve is the temperature ofthe system in oC.
Thus, induction time experiments require careful measurements. Fig. 1.2 showshow an experimental induction time could be measured carefully from both gasconsumption curve and the temperature pulse during hydrate formation. Be-fore time zero, a system is allowed to cool down to the desired experimentaltemperature and pressure. At time zero, start of stirring or cell agitation isintroduced to initiate hydrate formation. After some time, the hydrates start togrow which is detected by gas consumption rise accompanied by a temperaturepulse as hydrate formation is an exothermic reaction that releases heat energy.The time taken by the system from the start of stirring to the onset of hydrateformation is the induction time. The nucleation stage may occur before thestart of cell agitation during the cooling sequence [Paper I] in the overlappingregion of Fig. 1.2 between the cooling and nucleation regions.
During the nucleation stage, reactant molecules start clustering before reachinga critical nuclei. Fig. 1.3 shows a conceptual figure showing some molecules rear-ranging themselves to form a critical nuclei. A detailed mathematical derivationon nucleation kinetics of multicomponent systems has been presented [26] basedon cluster dynamics. Phase field theory of nuclei could also be applied in study-
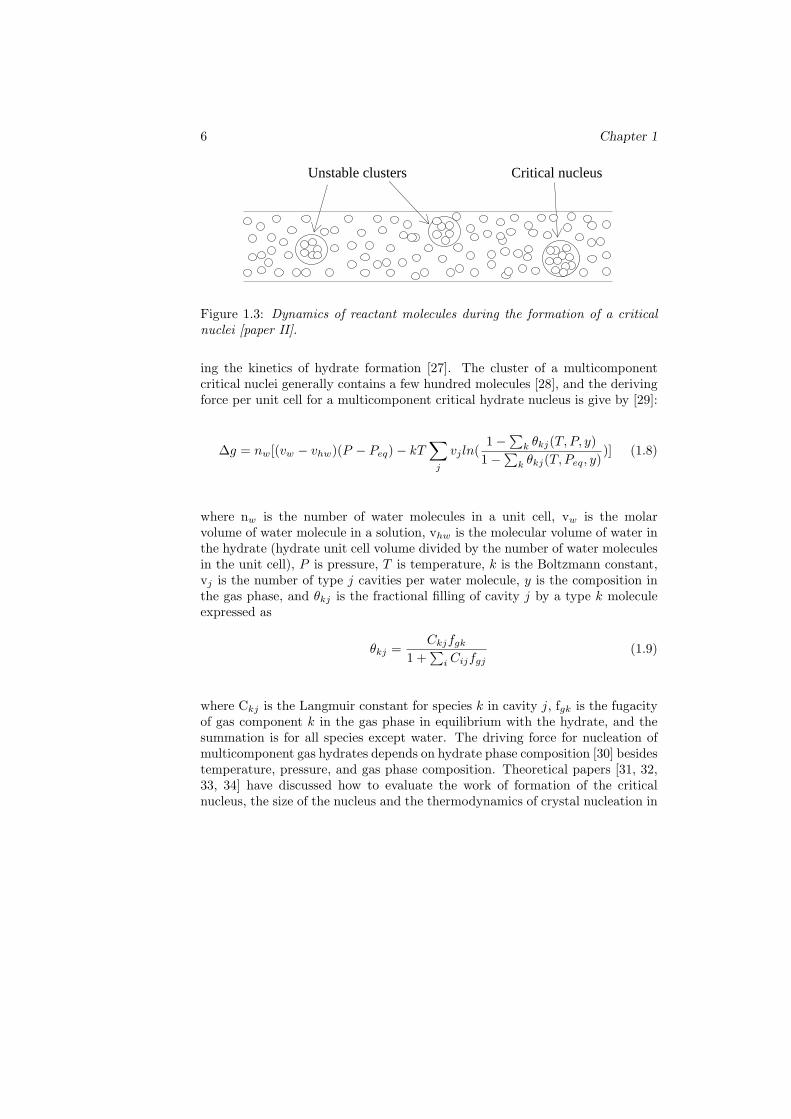
6 Chapter 1
Unstable clusters Critical nucleus
Figure 1.3: Dynamics of reactant molecules during the formation of a criticalnuclei [paper II].
ing the kinetics of hydrate formation [27]. The cluster of a multicomponentcritical nuclei generally contains a few hundred molecules [28], and the derivingforce per unit cell for a multicomponent critical hydrate nucleus is give by [29]:
∆g = nw[(vw − vhw)(P − Peq)− kT∑j
vj ln(1−
∑k θkj(T, P, y)
1−∑k θkj(T, Peq, y)
)] (1.8)
where nw is the number of water molecules in a unit cell, vw is the molarvolume of water molecule in a solution, vhw is the molecular volume of water inthe hydrate (hydrate unit cell volume divided by the number of water moleculesin the unit cell), P is pressure, T is temperature, k is the Boltzmann constant,vj is the number of type j cavities per water molecule, y is the composition inthe gas phase, and θkj is the fractional filling of cavity j by a type k moleculeexpressed as
θkj =Ckjfgk
1 +∑i Cijfgj
(1.9)
where Ckj is the Langmuir constant for species k in cavity j, fgk is the fugacityof gas component k in the gas phase in equilibrium with the hydrate, and thesummation is for all species except water. The driving force for nucleation ofmulticomponent gas hydrates depends on hydrate phase composition [30] besidestemperature, pressure, and gas phase composition. Theoretical papers [31, 32,33, 34] have discussed how to evaluate the work of formation of the criticalnucleus, the size of the nucleus and the thermodynamics of crystal nucleation in
Introduction 7
multicomponent systems. The rate of nucleation is related with the nucleationwork [35] which derives the system to start forming and filling the cavities.Once the system starts filling of the cavities continuously in accordance withEq. 1.9, then the nucleation stage starts transforming to the hydrate growthregion shown in Fig. 1.2 after the onset point.
1.2.2 Growth of Gas Hydrates
The hydrate growth stage is an immediate process that follows the nucleationstage. A very simple but powerful method of studying and analyzing growthexperiments is by using the real gas equation:
PV = znRT (1.10)
where P is pressure, V is gas volume, z is the compressibility factor, n is thenumber of moles, R is the universal gas constant and T is the temperature ofthe gas. For an isochoric system, where the principle of mass conservation holdstrue, the pressure drop in the gas phase caused by hydrate growth gives anestimation of the amount of hydrates formed in the liquid phase. Thus, Eq.1.10 yields:
∆n =V
zRT∆P (1.11)
where ∆n is the amount of gas consumed during hydrate formation (amount ofhydrates formed) and ∆P is the measured experimental pressure drop causedby hydrate formation. Approximating the term V
zRT as the constant of propor-tionality which does not change significantly, we have:
∆n ∝ ∆P
indicating that the amount of gas consumed in the liquid phase and the pressuredrop in the gas phase are directly proportional with each other. This conceptcould be employed to estimate the amount of gas hydrates formed in filling thecavities of Fig. 1.1 for sI and sII systems when the systems meet the appropriateconditions for gas hydrate growth.
Growth processes are very fast reactions specially during the early growth pe-riods. It involves coupled mass and heat transfer since the nucleation stage.

8 Chapter 1
Primarily it is limited by mass transfer of the reactants to the growing crys-tal and a simultaneous removal of heat away from the growing crystal. Suchcoupled heat and mass transfer is a complex process to explain especially for amulticomponent system. A two-component coupled heat and mass transfer pro-cess is the simplest system to describe mathematically. Assuming transport ofheat and mass in a radial direction, the entropy production in a two-componentsystem is given by [36]:
σ = Jq∂
∂r(
1T
) + J1(− 1T
∂µ1,T
∂r) (1.12)
where Jq is heat flux, J1 is mass flux of component 1 and µ1,T = µ01+RTln(c1y1)
is chemical potential with a reference state µ01, c1 is concentration of compo-
nent 1 with y1 as its activity coefficient. Heat is transported in the system byconvection and conduction. The radial flux-force relations for measurable heatflux and molar flux are given by:
Jq = lqq∂
∂r(
1T
) + lqu(− 1T
∂µ1,T
∂r) (1.13)
and
J1 = luq∂
∂r(
1T
) + luu(− 1T
∂µ1,T
∂r) (1.14)
where ∂∂r ( 1
T ) and (− 1T∂µ1,T
∂r ) describe the forces. From Onsager’s reciprocityrelations [37, 38], the coefficient lqu is equal to the coefficient luq and are usedto describe the diffusive transport of heat and mass. If temperature is constant,then:
∂
∂r(
1T
) = 0 (1.15)
and hence Eq. 1.14 becomes:
J1 = −luu1T
∂µ1,T
∂c1
∂c1∂r
(1.16)

Introduction 9
which could be reexpressed as:
J1 = −D1,2∂c1∂r
(1.17)
where D1,2 is the interdiffusion coefficient of component 1 (the solute) in com-ponent 2 (the solvent) which could be measured by spectroscopic and analyticaltechniques. Because hydrate nucleation and growth require transport of a so-lute in a solvent towards the growing hydrate crystal, diffusion of moleculesplay an important role both in the nucleation and growth stages. But, masstransport by diffusion in n-component mixture is described by n(n-1)/2 diffusioncoefficients, and hence multicomponent systems are too difficult to explain ascompared to the simplest two-component system described by Eq. 1.17. Suchapplication of irreversible thermodynamics with more accurate flux equations isvery important in modeling of chemical processes [39].
1.3 Gas Hydrate Issues
Generally, gas hydrate issues could be categorized into three groups dependingon where the hydrates are located and on the nature of the hydrate formation.Gas hydrates are threats for the environmental researchers, opportunities forothers as they are the future energy source and a means of gas storage andtransport, and nuisance for the oil and gas industries.
1.3.1 Gas Hydrates as Threats
Gas hydrates, containing mostly methane, have been formed naturally in theearth and exist in vast quantities in the permafrost and subsea sediments inthe Arctic, the Antarctic, the tropical and subtropical oceans [40, 41, 42]. De-spite the difference of reports on the amount of gas hydrates in nature amongstresearchers, it is believed that 1016 m3 of methane gas exists in solid hydrateform [43]. A more recent study [44] estimated a total volume of 1.2 ×10¹⁷ m3
of methane gas that is globally distributed in ocean sediments which is largerthan worldwide conventional natural gas reserves. This enormous amount ofmethane gas in the hydrate state in the earth could easily be released into theatmosphere if triggered by geological phenomenon such as earth quakes. Gashydrates, containing primarily methane which is a strong greenhouse gas, are
10 Chapter 1
thus environmental threats as they have the potential to change the earth’sclimate leading to increased global warming.
1.3.2 Gas Hydrates as Opportunities
Contrary to the environmental threat, the enormous reserve of methane gasin the hydrate state is considered as the future energy source. The estimatesof the volume of methane gas contained in gas hydrate state is double that ofknown fossil-fuel resources [45]. Besides, the ability of gas hydrates to contain150-180 volumes of gas/volume of hydrate [46] makes them to be considered as ameans for natural gas storage and transport. However, practical exploitation ofthis opportunity requires an ability to preserve the hydrate in a predictable andcontrollable manner [47]. Storage of CO2 in natural gas hydrate reservoirs and atthe same time releasing the hydrocarbon gas trapped in the hydrate state couldbe considered as double opportunities [48]. Thus, being fuel for the future andmeans of transporting and storing natural gases, gas hydrates are opportunitiesto alleviate problems related with these issues. In fact, getting the gas out ofthe natural hydrate state or storing the gas in a hydrate state is a challengethat has attracted many researchers. Gas storage and transportation based onhydrate technology has been a focus for many researchers [49, 50, 51, 52, 53].Specially storing hydrogen molecule in semi-clathrate hydrates with an energydensity comparable to the current fossil fuel has become an opportunity forhydrogen powered vehicles [54, 55, 56, 57].
1.3.3 Gas Hydrates as Nuisance
Gas hydrate as a nuisance in the petroleum industry by plugging oil and gasproduction pipelines and causing costly operations was first discovered and re-ported by Hammerschmidt [58]. Since then, the industrial hydrate concernshave been in flow assurance which is the major technical problem in offshoredevelopment, production, and transportation. Besides production pipelines, thewell and the platform are also susceptible portions of the system where hydrateplugs occur [59]. With regard to flow assurance, the focus has then becomein inhibiting hydrate formation before hydrates form and block pipelines. Ifhydrates form and block pipelines, then dissociating them in a safe way is alsoa challenge as hydrates possess an enormous amount of gas which could causea hydrate projectile that may endanger human life.
In preventing hydrate blockage, thermodynamic hydrate inhibitors (THIs) andlow dosage hydrate inhibitors (LDHIs) have been successfully used. THIs are

Introduction 11
divided into three classes: alcohols, glycols and salts of which methanol (MeOH,CH3OH) and monoethylene glycol (MEG, HOCH2CH2OH) are the most widelyused inhibitors in the gas and oil fields due their effectiveness. The wellheadjumpers and flow lines are parts of the system where, for example methanol,is being added to inhibit the formation of hydrates [60]. When used in largeamounts, THIs prevents hydrate crystallization by shifting the phase boundarythermodynamically to the lower temperature and higher pressure. To approxi-mate the hydrate depression temperature for several THIs in the aqueous liquid,the industry uses the original Hammerschmidt equation [61]:
∆T =2335W
Mw(100−W )(1.18)
where ∆T is the hydrate depression in oF , Mw is the molecular weight of alcoholor glycol, and W is the wt% of the inhibitor in the liquid. From Eq. 1.18, themolecular weight of THIs is the key parameter for the inhibition performance.Thus, MeOH is a better inhibitor than MEG as it has a lower molecular weightwhich could result in a higher performance of inhibition. Hammerschmidt pro-vided also a modification of the molecular weight M when salts were used asinhibitors. Later study [62] showed that the Hammerschmidt equation appliesonly to methanol concentrations less than 0.2 mol fraction, and presented thefollowing equation as an improved version applicable for a wider range as largeas 0.8 mol fraction:
∆T = −129.6ln(1− xMeOH) (1.19)
where ∆T is the hydrate temperature depression below the uninhibited con-dition in oF . All these equations are used for prevention methods before thehydrates form and plug pipelines.
Once the hydrate is formed, it could be dissociated either by depressuriza-tion or heating methods. Fig. 1.4 shows three possible mechanisms of movingthe red circular point, which is within the hydrate forming region (left of theequilibrium curve), into the hydrate free region (right of the equilibrium curve).The method of inhibition by shifting the phase boundary across the red circularpoint leaves that specific point to be on the right side of the hydrate equilib-rium curve. This method is the method how THIs prevent hydrate formation

12 Chapter 1
provided that THIs are used in large amounts.
0.000
20.000
40.000
60.000
80.000
100.000
120.000
140.000
160.000
0.000 5.000 10.000 15.000 20.000 25.000 30.000
Temperature (OC)
Pres
sure
(bar
)Inhibition∆T
Heating
Hydrate free region
Depressurization
Hydrate formingregion
Figure 1.4: An equilibrium curve showing the hydrate forming region with threepossible ways of moving a particular initial condition, represented by the redspot, out of the hydrate forming region. The data has been generated usingCSMGem with 0 and 15 wt% MeOH, where the presence of methanol caused theequilibrium curve to shift to the left.
Unlike the conventional THIs which acts in shifting the phase boundary to lowtemperature and high pressure regions, a recent method of retarding crystalgrowth were achieved by using LDHIs [63] that do not significantly affect thethermodynamics but the kinetics of hydrate formation. LDHIs are divided intotwo classes, kinetic hydrate inhibitors (KHIs or simply KIs) and antiagglom-erants (AAs). KIs are low molecular weight water-soluble polymers such aspolyvinylpyrrolidone (PVP) and polyvinylcaprolactum (PVCap), and AAs aresurfactants (surface acting chemicals). KIs prevent nucleation and growth of hy-drate crystals, whereas AAs do not prevent formation rather they prevent theagglomeration and deposition of hydrate crystals and the consequent hydrateblockage while a transportable hydrate slurry is formed. Both KIs and AAs donot always inhibit hydrate blockage. Studies on KIs [64] and AAs [65, 66, 67]showed that KIs and AAs sometimes promote hydrate formation depending onthe concentration of the chemicals used along with other system conditions. It

Introduction 13
was reported [68] that AAs property decreases in the presence of salt waterwhich indicates that the efficiency of additives in general may depend also onthe water salinity.
Another alternate method of addressing hydrate problems in pipelines withoutusing chemicals such as THIs, KHIs, and AAs or without the help of heatingmethods or heat-retention schemes is the cold flow technology [69, 70, 71, 72].Cold flow technology is emerging as a good candidate for actual field implemen-tation and alleviating hydrate blockage problems in an uninsulated pipelines.In cold flow methods, inert hydrate particles are readily transportable in coldregions, say 4 oC, without deposition or agglomeration surviving long shut-insand restarts without plugging pipelines during flow conditions favoring hydrateformations. The basic concept of cold flow technology is mixing hot reservoirfluid coming out of the wellhead with a recirculating cold stream of hydrate par-ticles acting as seed crystals. This converts all fresh water into inert hydratesenabling the inhibited water not to form sticky hydrates and hence yieldinghydrate particles which are dry, non-depositing, and non-agglomerating.

14 Chapter 2
Chapter 2
Objective
The knowledge of the dynamics of gas hydrate formation, nucleation and growth,is very important in determining the parameters for production of gas hydratesand in understanding plug conditions in oil and gas production pipelines [73].This has drawn a considerable attention in the petroleum industry and in re-search institutes as hydrate plugging on production pipelines causes costly op-erations. In spite of many attempts in understanding nucleation and growthkinetics, still little is known about the process as compared to hydrate thermo-dynamics. The main reason is that hydrate nucleation and growth is a time-dependent processes that is challenging with regard to measurement and mod-eling [74] and hence the kinetics of hydrate nucleation and growth is much lessunderstood than the thermodynamics [75]. Thus, the objective of the presentstudy has been achieving a better understanding of nucleation and growth pro-cesses, and identifying the key factors that are involved in the kinetics. Forthis, multicomponent hydrate formation has been given much intention in thestudy as single-component hydrate studies [76, 77, 78, 79, 80, 81, 82] have beenaddressed well as compared to the multicomponent studies. This is essential instrengthening the knowledge of multicomponent hydrate formation processes asthese processes, specifically sII hydrate nucleation and growth, are the processesencountered in the oil and gas production pipelines. Single-component studieshave also been covered, and a new time-dependent model has been proposed forthe formation process. The interpretation of nucleation and growth measure-ments made in the laboratory and presented in this dissertation are believedto help others to understand the most challenging processes of nucleation andgrowth kinetics.
15


Chapter 3
Experimental Setup andProcedure
3.1 Experimental Setup
The schematic experimental setup used for testing all the nucleation and growthexperiments of this review is shown in Fig. 3.1. Similar high-pressure isochoricapparatus was discussed previously for kinetic hydrate inhibitor (KHI) perfor-mance test [83]. The cylindrical cell was made of titanium with inner volumeof 145 ml from which 50 ml of the cell volume was filled with distilled water(DIW) with or without additives depending on the the objective of the exper-iment. The rest 95 ml of the cell volume was filled with synthetic natural gas(SNG). Temperature and pressure sensors had direct access to the inner partof the cell where the sample fluid was present. A 1/10 DIN Pt100 element ofaccuracy 0.03 oC was connected to a digital signal transmitter for tempera-ture measurements. A Rosemount 3051 TA absolute pressure transmitter wasused for pressure readings. The accuracy of the transmitted temperature andpressure signals were ± 0.1 oC and ± 0.2 bar, respectively. In some of theexperiments, two temperature sensors were used, one in the vapor phase andthe other in the aqueous phase. This enabled us to track the temperature pulseboth in the vapor phase and in the aqueous phase during gas consumption andhydrate growth.
The cell was equipped with a cylindrical cooling cap, and water from a refrig-erated circulator passed through this cap to control the cell temperature. The
17

18 Chapter 3
Temperature control unit
Stirrer blade
Magnet drive
Stirrer magnet
SNG
DIW + Chemical
Temperature sensor
Gas supply cylinder
Pressure sensor
Refrigerated and heating circulator
PC with LabView
Gas inlet/outlet
Cooling cap
Titanium plug
Figure 3.1: Experimental setup drawing.
refrigerated and heating circulator used was Julabo F34 HL ”High Tech” serieswith integrated programmer and temperature stability of ± 0.01 oC. The tem-perature profiles were handled by the integrated programmer, and the internalbath temperature could be logged via an RS 232 interface connection. LabViewwas used to collect system pressure and temperature data points and PT plotswere continuously updated by the PC on the LCD screen during the experiment.
3.2 Experimental Procedure
More or less similar procedures have been used in all the experiments by chang-ing operating P and T conditions. Some of the procedures are without any chem-icals and some with chemicals depending on the objective of the experiment. Forthose experiments with chemicals in solution, three different chemicals, MeOH(liquid), PVP (dry powder, Mw ∼ 15,000) and PVCap (dry powder, Mw ∼6,000) were selected and dissolved in distilled water to the desired concentra-tions in ppm (parts per million by weight). 100 ppm corresponds to 3.12×10⁻³
mol/litre of MeOH or 1.67× 10⁻⁵ mol/litre of PVCap or 6.67× 10⁻⁶ mol/litre

Experimental Setup and Procedures 19
Figure 3.3: Components of the inside part of the autoclave cell. 1 is main cell body with cooling cap, 2 is top lid with two T sensors, 3 is magnet housing (cell bottom), 4 is magnet holder, 5 is stirrer blade, 6 is sliding bearing for balance of stirrer blade / magnet holder
when mounted, 7 are o-ring sealing for top lid (2) and magnet housing (3) and (8) are quick-fit connections for cooling water with closing valve (Gardena type).
Figure 3.2: Components of the inside part of the autoclave cell. 1 is main cellbody with cooling cap, 2 is top lid with two T sensors, 3 is magnet housing (cellbottom), 4 is magnet holder, 5 is stirrer blade, 6 is sliding bearing for balance ofstirrer blade and magnet holder when mounted, 7 are o-ring sealing for top lid(2) and magnet housing (3) and (8) are quick-fit connections for cooling waterwith closing valve (Gardena type).
of PVP. Pure water was considered as 0 ppm baseline for comparison.
Fig. 3.2 shows the inside part of the autoclave cell and the inside cell compo-nents. Referring to the figure, the stirrer blade (5) and the magnet holder (4)were connected through the hole for the connecting axle at the cell bottom. Themagnet housing (3) was filled with a desired solution to displace all dead vol-ume air in the gap between the magnet housing and the magnet holder duringmounting of this section. Excess water solution displaced from the magnet hous-ing into the experimental cell section during this mounting was removed priorto filling the desired amount of solution into the cell. Thereafter, the top lid (2)was mounted and the cell was closed and centered on the magnet drive as shownin Fig. 3.3. This figure shows a photograph of the experimental setup whichwas represented schematically by Fig. 3.1. The cooling bath was connected viathe quick-fit connections (8) and their valves were opened to allow in and outflow of cooling water around the main cell body (1). The bath was adjusted toa desired initial temperature of an experiment, which was kept constant at the

20 Chapter 3
Figure 3.3: Photograph of experimental apparatus.desired level during the preparation of the experiment. After mounting, the cellwas purged twice with 40 bar gas to remove residual air from the cell yielding40 × 40 = 1600 × dilution. Totally, three different gas supply cylinders withthree different synthetic natural gases (SNGs) were used for the study of thepresent work. Molar compositions of each SNG are given in Table 3.1.
Table 3.1: Gas compositions of SNGs used in mole percentage.
Gas component SNG1 (mol%) SNG2 (mol%) SNG7 (mol%)
CH4 (methane) 99.9995 92.51 80.40
C2H6 (ethane) 0 0 10.30
C3H8 ( propane) 0 7.49 5.00
i-C4H10 (i-butane ) 0 0 1.65
n-C4H10 (n-butane ) 0 0 0.72
CO2 (carbon dioxide) 0 0 1.82
N2 (nitrogen) 0 0 0.11
Experimental Setup and Procedures 21
After dilution, the cell was stirred for a while to purge residual air that is presentin the water solution. The amount of gas used was controlled by two pressuregauges, one gauge from the gas cylinder and another gauge connected to theinlet at the top of the cell. After purging was completed, the cell was pressurizedto a desired pressure based on the objective of the experiment. The system wasleft without stirring and cooling for the temperature and pressure values to sta-bilize. At this time, pressure leak test was done simultaneously. The stabilizedfilling pressure and temperature values were taken as the initial condition of thesystem. The initial condition of temperature and pressure lies in the hydratefree region for all experiments. As thermal history of water affects the inductiontime measurement [84], the distilled water used in all experiments were freshand initially at room temperature with the same thermal history prior to load-ing of the cell. After loading, the cell was then cooled down without stirringto a desired temperature using a certain cooling rate depending on the type ofthe experiment and the bath was programmed to keep the desired temperaturelevel throughout the continuing part of the experiment. Having obtained a sta-ble temperature and pressure at the desired level, cell agitation was introducedby the start of the stirrer at 750 rpm.
A stirring rate of 750 rpm was used in all the experiments as induction time isaffected by stirring rate [85]. The start of stirring was considered as the startof the experiment at time zero. Induction time and formation rate are alsodependent on the degree of subcooling in both uninhibited and underinhibitedsystems [86]. Thus, the same degree of subcooling was maintained during theexperiments after stabilized values of temperature and pressure were attained.The stabilized values of temperature and pressure remained constant from timezero to the onset of hydrate formation. After onset of hydrate formation, allexperiments were given enough time to complete the hydrate growth processbefore the experiments were terminated by heating the system and dissociatingthe hydrates in the cell. Prior to the next series of experiments, all the compo-nents of the autoclave cell were disassembled as shown in Fig. 3.2 and cleanedtwice with distilled water and dry air.

22 Chapter 4

Chapter 4
Main Results andDiscussion
The kinetics of hydrate nucleation and modeling of hydrate growth requireda lot of experiments to be performed. The following results and discussionsare based on many experimental data with an extensive theoretical discussionsand fitting of the observed experimental results. To be able to evaluate thekinetics of nucleation and growth, the stochastic approach of classical nucleationtheory and the real gas equations have been employed primarily. To obtainsufficient statistical accuracy, a minimum number of 6 experiments are requiredfor nucleation study. In the present PhD work, a total number of 6 to 10 parallelexperiments were normally run at each condition during nucleation studies. Themain results of the thesis on the kinetics of gas hydrate formation are presentedin three parts, nucleation and growth studies with chemicals, without chemicalsand modeling.
4.1 Effect of MeOH, PVP and PVCap on Nu-cleation and Growth
The effect of MeOH on hydrate formation has been studied on sI methane hy-drates. As there was no question on the inhibition effect of MeOH at high con-centrations, the system in question was studied for low concentrations of MeOH.Low concentrations of MeOH studies have attracted researchers especially fromthe report [87] that underinhibition using methanol at low concentrations en-hanced the rate and amount of hydrates formed in a multicomponent fluid.
23
24 Chapter 4
756
Energy Fuels 2010, 24, 752–757 : DOI:10.1021/ef9009422 Abay and Svartaas
means spontaneous nucleation at the start of stirring or
during the cooling sequence prior to start of stirring.For the 10 ppm concentration, the experimental data and
the probability distribution fit show nonzero probability forvery short induction time. The S-shaped probability distri-
bution function is shifted to the leftmost side compared toother experiments, including the pure water baseline refer-ence. This shift with the nonzero probability for very short
induction time could be an indication that methanol is actingas a promoter at this concentration. Figure 7 also shows that
the range of random nucleation of the 10 ppm experiment isas wide as the range of random nucleation of the pure waterexperiment. However, the rate of nucleation was increasedby a factor of 1.4 as compared to that of the pure water
baseline value.Contrary to the 10 ppm solution experiment, the delay of
the induction time is more pronounced for the 20 ppm
concentration. Unlike the 0 and 10 ppm solutions, theprobability of finding nucleation is zero for low inductiontime, and the range of the probability distribution function is
the narrowest compared to others. This considerable in-crease in induction time and the narrow rightmost prob-ability distribution function could be an indication that the
20 ppm concentration is inhibiting hydrate crystallization.This concentration caused the rate of nucleation to increaseby a factor of 2.9, and it is the largest factor compared toothers. In addition, the five terminated experiments with
measured induction times above 36 h would most probablystrengthen an inhibitory effect if included in the analysis.
As compared to the uninhibited system, the 1.5 and 5 ppm
solutions show nearly similar effect on the rate of nucleation,that is, it is increased by a factor of 1.2 and 1.1, respectively.However, the induction timewas significantly increased. The
tabulated results show that increasing the concentration ofthe additive from1.5 to 5 ppmdid not increase the nucleationrate and the induction time, but rather caused values of J andτ0 to decrease. In fact, increasing concentration did not show
a corresponding increase in nucleation rate and inductiontime for all under-inhibited systems. In otherwords, ultralowconcentrations of methanol showed two opposing effects on
the rate of nucleation of methane hydrate and inductiontime.
Although opposing effects were observed experimentally
on the kinetics of methane hydrates formation, there are stillunanswered questions such as why methanol has dual beha-vior at ultralow concentration and where it is found after
hydrate formation. At room temperature, a moleculardynamics study5 on methanol-water mixtures showed thatmethanol tends to concentrate at the interface between theliquid and the gas phase in such a way that the hydrophobic
(methyl) group is pointing into the vapor phase. On the otherhand, the hydrophilic (hydroxyl) group is able to formhydrogen bonding with the water molecules. The interaction
of hydrophobic and hydrophilic groups with water andmethane molecules may result in deviation from the normalbehavior during the nucleation process depending on the
experimental conditions.In a diluted solution of alcohols, previous studies
showed27 that the pairwise interaction between moleculesof the alcohol is attractive, triple interactions are repulsive,
and higher order interactions are attractive. The magnitudesof these interactions are dependent on the temperature of thesystem. For example, the repulsive interaction decreases its
magnitude when temperature increases. Upon cooling dur-ing the course of the experiment and prior to onset tempera-ture for hydrate formation, the temperature of the system
was continuously decreasing, which could have resulted inan increase in the magnitude of the repulsive interaction.Temperature-dependent interactions between and among
Table 1. Pressure Drop, Nucleation Rate, and Induction Time forUltralow Concentrations of Methanol
number of experiments
concentration
(ppm)
done
(<36 h)
terminated
(>36 h)
ΔP
((std deva)
J
(min-1)
τo
(min)
0 7 0 35.13 ((2:00) 2.28 � 10-3 -53
1.5 10 2 31.26 ((0:44) 2.71 � 10-3 61.18
5 8 1 32.79 ((2:38) 2.43 � 10-3 27.6
10 10 0 31.49 ((0:53) 3.09 � 10-3 -32.26
20 6 5 31.08 ((1:09) 6.54 � 10-3 247.9
aStandard deviation.
Figure 7. Nucleation probabilities vs induction time for ultralowconcentration of methanol.
Figure 8. Temperature vs time graph before onset temperature forhydrate formation.
(27) Nord, L.; Tucker, E. E.; Christian, S. D. J. Solution Chem. 1984,13 (12), 849–867.
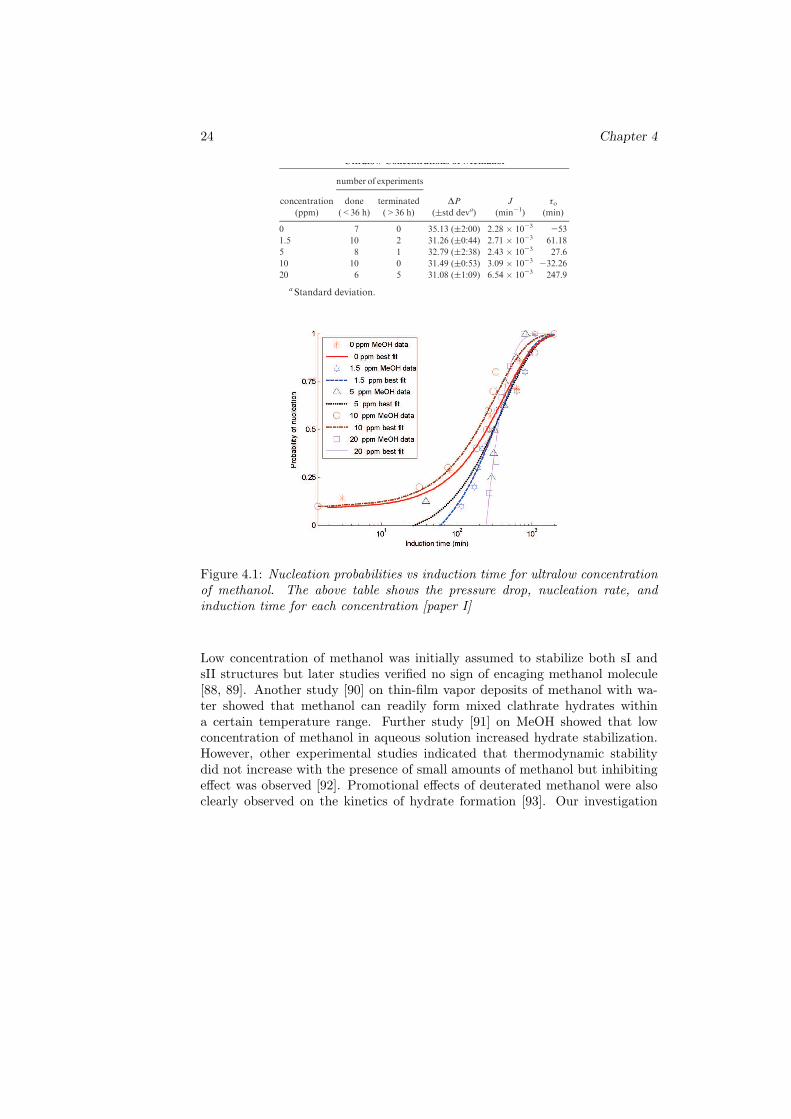
Figure 4.1: Nucleation probabilities vs induction time for ultralow concentrationof methanol. The above table shows the pressure drop, nucleation rate, andinduction time for each concentration [paper I]
Low concentration of methanol was initially assumed to stabilize both sI andsII structures but later studies verified no sign of encaging methanol molecule[88, 89]. Another study [90] on thin-film vapor deposits of methanol with wa-ter showed that methanol can readily form mixed clathrate hydrates withina certain temperature range. Further study [91] on MeOH showed that lowconcentration of methanol in aqueous solution increased hydrate stabilization.However, other experimental studies indicated that thermodynamic stabilitydid not increase with the presence of small amounts of methanol but inhibitingeffect was observed [92]. Promotional effects of deuterated methanol were alsoclearly observed on the kinetics of hydrate formation [93]. Our investigation

Main Results and Discussion 25
on methanol also supports both inhibition and promotion effects on methanehydrate formation [paper I]. The role of MeOH on hydrate crystallization couldbe due to three possible mechanisms: lattice defects, temperature dependentforces, and surface tension effect.
Excluding 1.5 and 5 ppm MeOH the results showed that the nucleation rate in-creases with increasing concentration of MeOH at this ultra low concentrationlevel refereing to the table associated with Fig. 4.1. At 20 ppm MeOH the lagtime showed significant increase. The negative lag times observed for pure waterand 10 ppm MeOH could be due to nucleation taking place during the coolingsequence or non ideal fit of experimental values to the probability distributionfunction. Boundary conditions could be set to eliminate negative lag times, butnucleation could occur prior to defined time zero for the experiment at start ofstirring.
The hydroxyl group of methanol has an effect by hydrogen bonding with wa-ter molecules, whereas the methyl group tends to organize the water moleculesin direct competition for a hydrate guest. This may cause a lattice defect aslattice defects caused by guest-water hydrogen bonding in other systems havebeen reported [94] and a distorted lattice structure may enhance diffusion thatcould possibly affect hydrate formation process. Another possible explanationof methanol effect on the kinetics could be through the temperature-dependentattractive and repulsive forces that could disturb the system’s behavior. In adilute aqueous solution of alcohols, a study [95] showed that alcohol moleculeshave temperature-dependent attractive and repulsive forces, that affect the ac-tivity coefficient of alcohol and water. This may have an effect on the kineticsof sII hydrate formation since the kinetic rate is dependent on the tempera-ture of the system described by the Arrhenius equation. Methanol moleculescould also be easily taken up into hydrogen bonding network of water to formsubstitution-type clusters [96]. Surface tension effects could also be a third pos-sible mechanism. During a molecular dynamics study [97] on methanol-watermixtures, it was observed that the surface tension of the solution was greatlyreduced by adding a small amount of methanol to water. As hydrate forma-tion requires transporting of guest molecules from the gas phase to the growingcluster in the liquid phase, the reduction in surface tension may have an effecton the formation process. Trace amounts of other classes of alcohols such asethanol have been reported [98] in optimizing formation rates of, for example,methane hydrate aggregates.
The effects of the KIs (PVP and PVCap) we used have shown a clear effect
26 Chapter 4
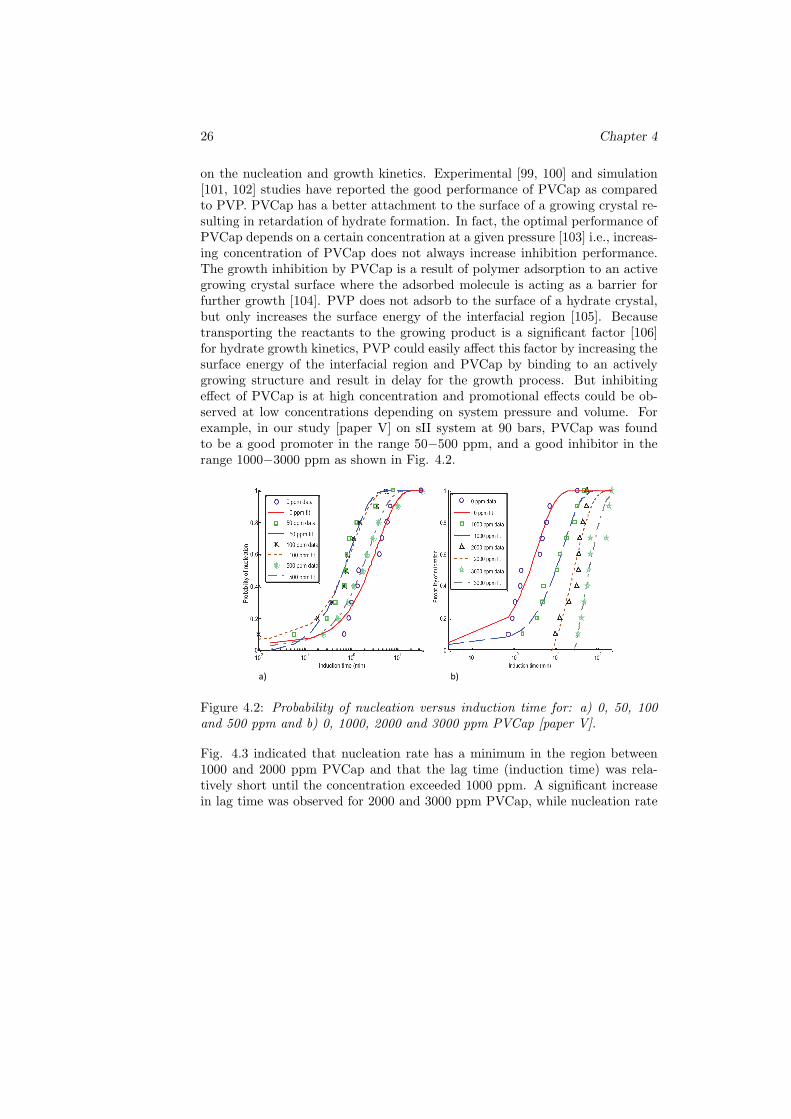
on the nucleation and growth kinetics. Experimental [99, 100] and simulation[101, 102] studies have reported the good performance of PVCap as comparedto PVP. PVCap has a better attachment to the surface of a growing crystal re-sulting in retardation of hydrate formation. In fact, the optimal performance ofPVCap depends on a certain concentration at a given pressure [103] i.e., increas-ing concentration of PVCap does not always increase inhibition performance.The growth inhibition by PVCap is a result of polymer adsorption to an activegrowing crystal surface where the adsorbed molecule is acting as a barrier forfurther growth [104]. PVP does not adsorb to the surface of a hydrate crystal,but only increases the surface energy of the interfacial region [105]. Becausetransporting the reactants to the growing product is a significant factor [106]for hydrate growth kinetics, PVP could easily affect this factor by increasing thesurface energy of the interfacial region and PVCap by binding to an activelygrowing structure and result in delay for the growth process. But inhibitingeffect of PVCap is at high concentration and promotional effects could be ob-served at low concentrations depending on system pressure and volume. Forexample, in our study [paper V] on sII system at 90 bars, PVCap was foundto be a good promoter in the range 50−500 ppm, and a good inhibitor in therange 1000−3000 ppm as shown in Fig. 4.2.
attractive and repulsive forces, that affect the activity coefficient of alcohol and water. This may have an effect on the kinetics of sII hydrate formation since the kinetic rate is dependent on the temperature of the system described by the Arrhenius equation. Methanol molecules could also be easily taken up into hydrogen bonding network of water to form substitution-type clusters [87]. Surface tension effects could also be a third possible mechanism. During a molecular dynamics study [88] on methanol-water mixtures, it was observed that the surface tension of the solution was greatly reduced by adding a small amount of methanol to water. As hydrate formation requires transporting of guest molecules from the gas phase to the growing cluster in the liquid phase, the reduction in surface tension may have an effect on the formation process. Trace amounts of other classes of alcohols such as ethanol have been reported [89] in optimizing formation rates of, for example, methane hydrate aggregates. The effects of the KIs (PVP and PVCap) we used have shown a clear effect on the nucleation and growth kinetics. Experimental [90, 91] and simulation [92, 93] studies have reported the good performance of PVCap as compared to PVP. PVCap has a better attachment to the surface of a growing crystal resulting in retardation of hydrate formation. In fact, the optimal performance of PVCap depends on a certain concentration at a given pressure [94] i.e., increasing concentration of PVCap does not always increase inhibition performance. The growth inhibition by PVCap is a result of polymer adsorption to an active growing crystal surface where the adsorbed molecule is acting as a barrier for further growth [95]. PVP does not adsorb to the surface of a hydrate crystal, but only increases the surface energy of the interfacial region [96]. Because transporting the reactants to the growing product is a significant factor [97] for hydrate growth kinetics, PVP could easily affect this factor by increasing the surface energy of the interfacial region and PVCap by binding to an actively growing structure and result in delay for the growth process. But inhibiting effect of PVCap is at high concentration and promotional effects could be observed at low concentrations depending on system pressure and volume. For example, in our study [paper V] on sII system at 90 bars, PVCap was found to be a good promoter in the range 50 – 500 ppm (cf. Figure 4.2a), and a good inhibitor in the range 1000 – 3000 ppm (cf. Figure 4.2b).
a) b)
Figure 4.2: Probability of nucleation versus induction time for: a) 0, 50, 100and 500 ppm and b) 0, 1000, 2000 and 3000 ppm PVCap [paper V].
Fig. 4.3 indicated that nucleation rate has a minimum in the region between1000 and 2000 ppm PVCap and that the lag time (induction time) was rela-tively short until the concentration exceeded 1000 ppm. A significant increasein lag time was observed for 2000 and 3000 ppm PVCap, while nucleation rate
Main Results and Discussion 27
inhibition performance. Achieving full inhibition
also depends on the degree of subcooling, type of
polymer, molecular weight of polymer, and
solution agitation [12]. The initial degree of
subcooling (12 oC), type of polymer (PVCap),
molecular weight (6000), and solution agitation
(750 rpm) were all kept the same in all PVCap
experiments to examine the effect of concentration
change on nucleation of sII hydrates as accurately
as possible. Because transporting the reactants to
the growing product is a significant factor [13] for
hydrate kinetics, PVCap at these concentrations
could easily affect this factor by binding to an
actively nucleating structure and result in delay for
the process.
With regard to inhibition, PVCap was reported to
be the best inhibitor as compared to other LDHIs
such as polyvinylpyrrolidone (PVP). Experimental
[14, 15] and molecular dynamics simulation [16,
17] studies have reported the good performance of
PVCap as compared to PVP. Despite its good
performance as an inhibitor at high concentrations,
it is also a good promoter of sII hydrates at low
concentrations. But the promotional effect of
PVCap is only at low concentrations depending on
system pressure and volume. In our system at 90
bars, PVCap was found to be a good promoter in
the range 50 – 500 ppm, and a good inhibitor in
the range 1000 – 3000 ppm.
10-1
100
101
102
0
0.2
0.4
0.6
0.8
1
Induction time (min)
Pro
bab
ility
of
nul
cea
tion
0 ppm data
0 ppm fit
1000 ppm data
1000 ppm fit
2000 ppm data
2000 ppm fit
3000 ppm data
3000 ppm fit
Figure 5. Probability of nucleation versus
induction time for 0, 1000, 2000 and 3000 ppm
PVCap.
Concentration
(ppm)
Nucleation
rate
(1/min)
Lag time
(min)
0 0.27 -0.16
50 1.01 0.02
100 0.88 -0.07
500 0.39 -0.05
1000 0.07 -0.52
2000 0.04 8.27
3000 0.61 29.56
Table 2: Estimated nucleation rate and induction
time for 0 – 3000 ppm PVCap.
0
0.2
0.4
0.6
0.8
1
1.2
0
5
10
15
20
25
30
0 500 1000 1500 2000 2500 3000 3500
Effect of PVCap on J and #
Nu
cle
ati
on
Ra
te, J [
min-1
]
Lag tim
e, #
[min
]
Concentration [ppm]
Figure 6. Nucleation rate (left axis, red curve), and
lag time (right axis, green curve) as function of
PVCap concentration.
CONCLUSION
Structure II gas hydrates were produced from a
seven-component synthetic natural gas (SNG7) in
the presence of PVCap as an additive. Several
concentrations of PVCap in the range between 50 -
3000 ppm were investigated on the effect of sII
hydrate nucleation. The experimental results were
used to fit the theoretical nucleation probability
distribution function. The rate of nucleation and
the lag times were estimated for all concentrations
of PVCap used. The results showed that PVCap in
the range 50-500 ppm has increased rate of
nucleation, whereas, the range 1000-2000 ppm has
reduced rate of nucleation as compared to the pure
water base line experiment. For concentrations in
the range 2000 to 3000 ppm, the lag time was
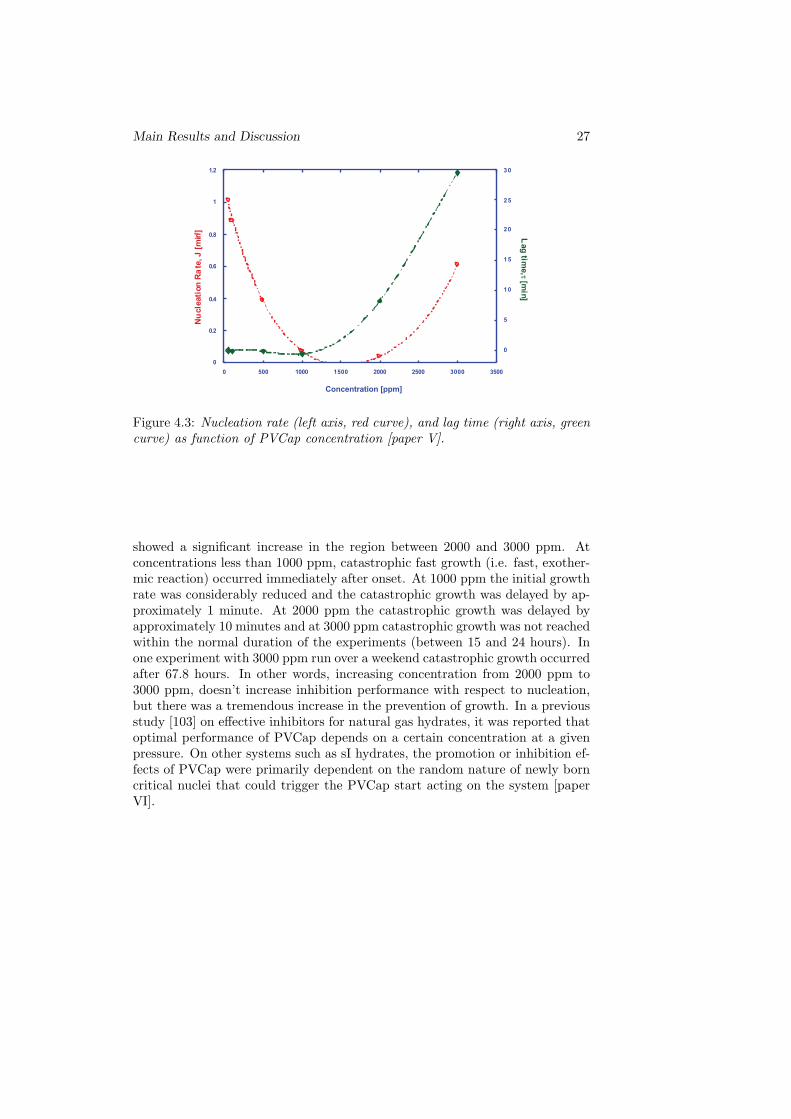
Figure 4.3: Nucleation rate (left axis, red curve), and lag time (right axis, greencurve) as function of PVCap concentration [paper V].
showed a significant increase in the region between 2000 and 3000 ppm. Atconcentrations less than 1000 ppm, catastrophic fast growth (i.e. fast, exother-mic reaction) occurred immediately after onset. At 1000 ppm the initial growthrate was considerably reduced and the catastrophic growth was delayed by ap-proximately 1 minute. At 2000 ppm the catastrophic growth was delayed byapproximately 10 minutes and at 3000 ppm catastrophic growth was not reachedwithin the normal duration of the experiments (between 15 and 24 hours). Inone experiment with 3000 ppm run over a weekend catastrophic growth occurredafter 67.8 hours. In other words, increasing concentration from 2000 ppm to3000 ppm, doesn’t increase inhibition performance with respect to nucleation,but there was a tremendous increase in the prevention of growth. In a previousstudy [103] on effective inhibitors for natural gas hydrates, it was reported thatoptimal performance of PVCap depends on a certain concentration at a givenpressure. On other systems such as sI hydrates, the promotion or inhibition ef-fects of PVCap were primarily dependent on the random nature of newly borncritical nuclei that could trigger the PVCap start acting on the system [paperVI].

28 Chapter 4
0
0.4
0.8
1.2
1.6
2
2.4
2.8
2 3 4 5 6
SNG2
SNG2 repeat
SNG7
SNG7 repeatR
ate
of n
ucle
atio
n (m
in-1
)
Cooling rate (oC/h)
Figure 4.4: Rate of nucleation versus cooling rate for SNG2 and SNG7 [paperII].
4.2 Effect of Cooling Rate and Gas Composi-tions on Nucleation and Growth
The effects of THIs and KHIs on the kinetics of hydrate formation have beena focus whereas gas composition itself as a kinetic parameter has never beeninvestigated with and without additives. While the main focus is investigatingthe effect of gas composition on sII hydrate growth kinetics, we also studiedthe effects of low concentrations of MeOH, PVP, and PVCap on the kinetics.Hence, another goal of this PhD study was to investigate the effect of coolingrate and gas compositions on nucleation and growth of gas hydrates withoutadditives. Such findings on system responses are very important for a reliableevaluation of the effect of additives on hydrate formation processes. SNG2 andSNG7 of Table 3.1 have been used in studying the effect of gas composition onthe kinetics of sII hydrate formation and on the stochastic nature of nucleation.For cooling rate effects, three different cooling rates of 2, 4 and 6 ◦C/h havebeen used, keeping other parameters that could affect the kinetics the same forboth SNG2 and SNG7. The result of the effect of gas composition and coolingrates on nucleation is plotted in Fig. 4.4. The experimental results showed that
Main Results and Discussion 29
the rate of nucleation is dependent on gas composition, and different gas com-positions responded differently on the same cooling rate. For the slower coolingrate of 2 ◦C/h, the rates of nucleation in both systems were of comparable mag-nitude at the selected P and T conditions. However, for the faster cooling rateof 6 ◦C/h, SNG2 gave increased nucleation rate while the nucleation rate wasreduced for SNG7.
The observed results of Fig. 4.4 could be explained in three ways: the depen-dence of the critical size on temperature and gas composition, chemical oscilla-tions due to solubility change of individual gas components, and coupled massand heat fluxes during cooling. It is known that some molecules saturate theliquid water at the experimental temperature and pressure and hence the liquidin equilibrium with hydrate is not pure water [107]. Natural gases actively dis-solve in water and solubility of natural gases decrease with increasing molecularweight of hydrocarbons. The presence of inorganic gases like carbon dioxide andnitrogen could affect the solubility of the natural gas in water. The presenceof the acid gas CO2 in SNG7 increases the solubility of the hydrocarbon gasesin water, whereas the presence of the other inorganic gas N2 decreases the gassolubility in water [108]. In our SNG7, the N2 content is very low (0.11 %) andeffects of nitrogen on solubility can most probably be neglected. The systempressure also changes in accordance with the real gas equation when the tem-perature changes. The change in the temperature and pressure of the systeminduces a change in the solubility of the components in both SNG2 and SNG7.The main reason is that solubility of gas in water depends on temperature, thepartial pressure of the gas over the liquid water, the nature of the solvent andthe nature of the gas from Henry’s solubility law. The hydrate formation processcould change the solubility of the organic gases and may show divergence fromthe normal Henry’s law of solubility [109]. Inorganic gases may also change thesolubility trend in the presence of hydrates. Solubility of CO2 increases with de-creasing temperature in the absence of gas hydrate but this trend gets reversedin the presence of gas hydrates i.e., solubility of CO2 decreases with decreasingtemperature in the hydrate formation region [110].
The chemical potential of each molecule in the cluster will also affect the soluteconcentration at which the n-sized cluster can coexist with the solution whichis called cluster solubility [111]. The dynamics of clusters play a major role inthe kinetics of nucleation [112]. All these conditions make SNG7 difficult toequilibrate the system easily as compared to SNG2, where only two hydrocar-bon molecules are present. Since hydrate formation in the bulk water is like”vacuuming” of dissolved gas from the water phase to the region of the growing
30 Chapter 4
0.0
4.0
8.0
12
16
0.00 50.0 100 150 200
0 ppm SNG20 ppm SNG750 ppm MeOH SNG2 50 ppm MeOH SNG750 ppm PVCap SNG250 ppm PVCap SNG7
50 ppm PVP SNG250 ppm PVP SNG7
Gas
con
sum
ptio
n (b
ar)
Time (min)
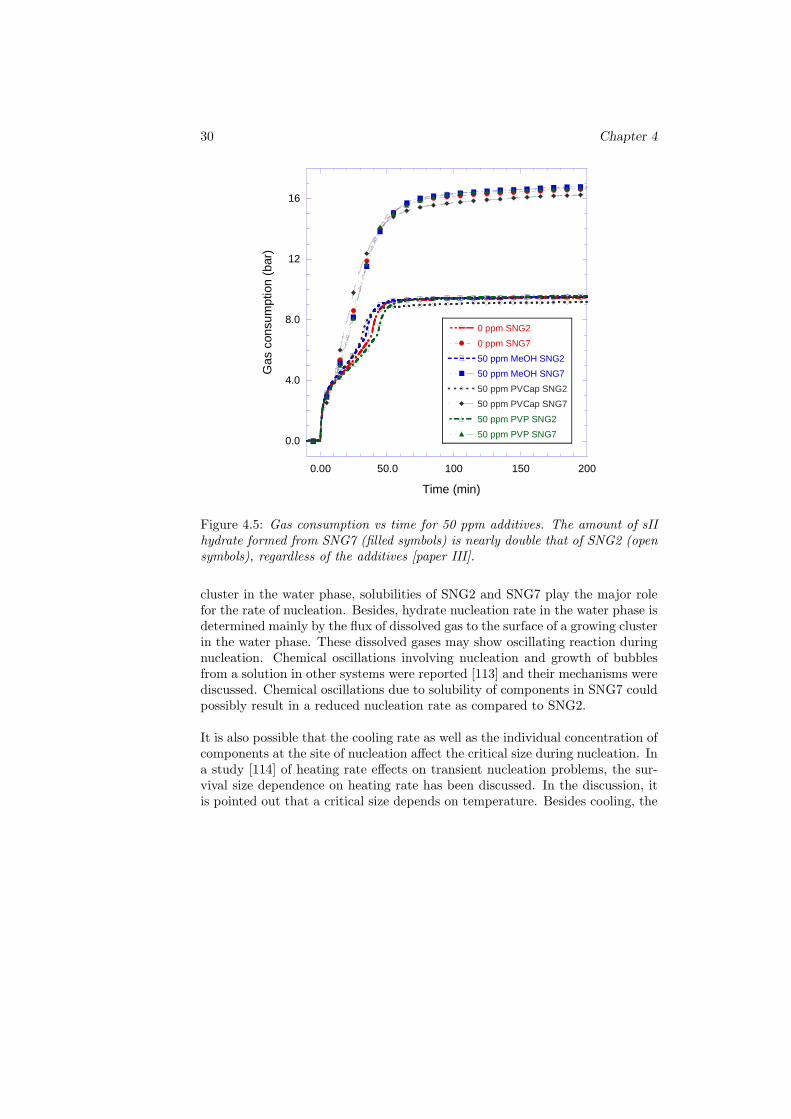
Figure 4.5: Gas consumption vs time for 50 ppm additives. The amount of sIIhydrate formed from SNG7 (filled symbols) is nearly double that of SNG2 (opensymbols), regardless of the additives [paper III].
cluster in the water phase, solubilities of SNG2 and SNG7 play the major rolefor the rate of nucleation. Besides, hydrate nucleation rate in the water phase isdetermined mainly by the flux of dissolved gas to the surface of a growing clusterin the water phase. These dissolved gases may show oscillating reaction duringnucleation. Chemical oscillations involving nucleation and growth of bubblesfrom a solution in other systems were reported [113] and their mechanisms werediscussed. Chemical oscillations due to solubility of components in SNG7 couldpossibly result in a reduced nucleation rate as compared to SNG2.
It is also possible that the cooling rate as well as the individual concentration ofcomponents at the site of nucleation affect the critical size during nucleation. Ina study [114] of heating rate effects on transient nucleation problems, the sur-vival size dependence on heating rate has been discussed. In the discussion, itis pointed out that a critical size depends on temperature. Besides cooling, the

Main Results and Discussion 31
0 20 40 60 80 100 120 140-0.1
0
0.1
0.2
0.3
0.4
0.5
0.6
0.7
Time (min)
Gro
wth
rate
(bar
/min
)0 ppm50 ppm MeOH50 ppm PVCap50 ppm PVP100 ppm MeOH100 ppm PVCap100 ppm PVP
Figure 4.6: Growth rate versus time curves of SNG2 experiments for 50 and 100ppm concentrations of MeOH, PVP and PVCap [paper III].
presence of an additive could also change solubility of gas species [115] which inturn may affect the rate of nucleation in the region of the growing cluster leadingto even a more complex processes that are challenging to describe. The effect ofcomposition difference on the growth process is more simple to explain as com-pared to the nucleation process. For example, Eq. 1.11 could easily be employedin analyzing the results of Fig. 4.5. One can clearly see that the amount of sIIhydrates formed from SNG7 was nearly twice of the amount of hydrate formedfrom SNG2 with and without the additives. Similar difference was observed forexperiments with 100 ppm additives in solution implying that difference in gascomposition matters for the amount of hydrate formation. The main reasonwhy SNG7 produced more hydrates than SNG2 and thus gave greater pressuredrop could be explained by the gas compositions and the individual content oflarge cavity preferring components in the mixtures. Both systems are waterexcess and the conversion of water into sII hydrate is limited by the amount ofsII formers available.
Fig. 4.6 shows the growth rate curves of sII hydrates produced from SNG2.

32 Chapter 4
0 20 40 60 80 100 120 140-0.05
0
0.05
0.1
0.15
0.2
0.25
0.3
0.35
0.4
Time (min)
Gro
wth
rate
(bar
/min
)
0 ppm
50 ppm MeOH
50 ppm PVCap
50 ppm PVP
100 ppm MeOH
100 ppm PVCap
100 ppm PVP
Figure 4.7: Growth rate versus time curves of SNG7 experiments for 50 and 100ppm concentrations of MeOH, PVP and PVCap [paper III].
Time zero represents onset for hydrate formation. For SNG2 maximum growthrate occurred at onset, and then growth rates for all SNG2 systems decayedover the next 18−20 min after onset. In this period, the rates showed fluctua-tions before finally decaying towards zero value at the end of the process. Thestructure of the growth curves of SNG7 was also different as compared to thestructure of the growth curves of SNG2. As shown in Fig. 4.7, the growth ratesof sII hydrate produced from SNG7 initially increased to attain a maximumvalue, and then decreased to zero. Such differences in growth patterns for thesame hydrate structure could be considered as a finger print of the effect of gascomposition on growth kinetics. These sII hydrate growth curve structures wereunique for each SNG, and the effects of the additives on these growth curveswere shifting the curves up or down based on the concentration and type of thechemicals used while the unique structure remained the same. The increasedinitial growth rate of sII hydrate produced from SNG2 as compared to the hy-drate produced from SNG7 could be due to the large number of critical nucleiin SNG2 as compared to SNG7. In a multicomponent gas hydrate nucleationstudy [116] of sII hydrates from both SNG2 and SNG7, it was shown that SNG2system nucleates more easily than SNG7 system. Moreover, as discussed beforeon the difference of the total amount of hydrate formation from SNG2/SNG7,
Main Results and Discussion 33
more options of guest molecules for 51264 cage fillings may contribute to anincreased overall hydrate formation. Despite its promotion on hydrate forma-tion, more options of guest molecules available in SNG7, however, may reducethe growth rate, especially during the starting period of the growth process.With abundant guest molecules in both SNGs for 51264 cage fillings, 51264 cagefillings may become the rate-limiting step in hydrate formation. The multiple51264 cage filling molecules (ethane, propane, i-butane, n-butane, carbon diox-ide and nitrogen) in SNG7 may compete with each other in occupying 51264
cages and thus reduce the initial growth rate in an observable manner. Ethaneas the main large cavity filling gas was discussed previously [117, 118, 119, 120].
4.3 Time-dependent Kinetic Rate Model for Single-component Hydrate Growth
The growth rate is expressed as the rate by which the amount of gas molecule isconverted to hydrate [121]. Another goal in this dissertation is thus investigat-ing the dependence of growth rates on the driving force and modeling hydrateformation. A comprehensive review [122] on modeling of hydrate formation ki-netics showed that growth models considered a constant kinetic rate parameterfor many reasons. The reason for having time-dependent kinetic rate could beexplained in terms of the driving force of the system. The driving force could bethe difference in chemical potential [123, 124, 125] or the degree of subcooling.In fact, the degree of subcooling does not represent the real driving force inall systems, but in systems with one type of guest molecule, single-componentsystems, the driving force for hydrate formation is proportional to the degree ofsubcooling over a wide pressure range [126].
Though the degree of subcooling is a good representative of the driving force,it is not constant during the whole growth period of hydrates as shown in Fig.4.8. The figure shows the PT path from onset of hydrate growth at an initialsubcooling of ∆Tinitial = 4 ◦C, to the end of the growth process in the vicinityof the hydrate equilibrium curve at ∆Tfinal = 0 ◦C. The rate of hydrate growthis a function of the degree of subcooling while the degree of subcooling is notactually constant during growth. A study [127] on methane hydrate forma-tion indicated that formation rates are dependent on the degree of subcooling.Methane hydrate film growth studies [128, 129, 130, 131] on the rate of forma-tion also showed the dependence of the rate of hydrate growth on the degreeof subcooling used. A flow loop experiment study [132] also used the degree ofsubcooling as the driving force for hydrate formation, and the formation rate

34 Chapter 4
was found proportional to the driving force. In addition to these studies, aheat transfer modeling study [133] showed an explicit dependence of the rate ofmethane hydrate formation on the degree of subcooling. Such time-dependentdriving force may suggest a time-dependent kinetic rate k(t), which could bederived from PVT relation as:
k3 =−1tln(
PV
znoRT) (4.1)
where no is the initial number of moles of the free gas, k3 is a kinetic rate con-stant in the late growth region (region 3 of Fig. 4.8), and t is the time. Thisgives the kinetic rate of single-component hydrate formation at any time for thefirst-order reaction in the late growth region.
region 1
CT oinitial 4≈∆
0=∆ finalT
region 2
region 3
5.5
6.0
6.5
7.0
7.5
8.0
8.5
9.0
9.5
280 282 284 286 288 290
Pres
sure
(MPa
)
Temperature (K)
hydrate-water-gas equilibrium line
Figure 4.8: Variation of the degree of subcooling during hydrate growth [paperIV].
Originally, the kinetic rate parameter based on the theories of crystallization and
Main Results and Discussion 35
mass transfer at a gas-liquid interface [134] accounts for the combined diffusionand reaction of the guest molecule during the modeling of hydrate formation.Another paper [135] indicated that changing the magnitude of the kinetic rateparameter has an effect on the rate and gas consumption. During a mechanisticmodel studies [136] for hydrate formation, different rate constants within a singleexperiment were reported. Hence, a good advantage of the proposed model maybe that it gives information about the kinetic rate from the easily accessiblethermodynamic conditions of the system at any time during hydrate formation.However, the present model was tested for a stirring rate of 750 rpm, and itdoes not include the effect of rpm on the rate constant. It is reported [137, 138]that stirring rate has an effect on the rate of methane hydrate crystallization.The inverse time dependence of Eq. 4.1 shows that the kinetic rate decreases astime increases, which could be explained by the reduction in the driving forcewith time. One, thus, could express the decreasing hydrate growth in the liquidwater phase by employing the time-dependent rate as
r = −nok3 (4.2)
where k3 is given by Eq. 4.1. This model, Eq. 4.2, predicts the hydrate growthrate for the pure water reference and for systems with THIs and KIs in solution.The model still requires to be certified and/or improved on other systems atdifferent operating P and T conditions.


Chapter 5
Conclusion
My PhD research was focused on the kinetics of sI and sII hydrate formationmainly nucleation and growth. Both single and multicomponent systems havebeen considered in studying the nucleation and growth processes. The effect ofmethanol on the kinetics of sI hydrate has been studied from pure methane gas(SNG1). The effects of chemicals (MeOH, PVP, PVCap) and gas compositionon the kinetics of sII hydrate formation have been investigated by using two dif-ferent multicomponent gases, SNG2 and SNG7. Other factors that could affectthe kinetics such as initial degree of subcooling, operating T and P, stirring rate,type and molecular weights of the chemicals were all kept constant to examinethe effect of the gas composition alone.
The nucleation probability distribution function, the real gas equation, andthe principle of irreversible thermodynamics have been employed in an attemptto understand the experimental results. The most important results can beconcluded as follows: The dependence of the critical size on temperature andgas composition, chemical oscillations due to solubility change of individual gascomponents and coupled mass and heat fluxes during cooling were the possibleexplanation for the reason that the two-component system (SNG2) nucleatedeasily as compared to the seven-component system (SNG7). However, on theprocess of hydrate formation after nucleation, SNG7 favored the growth of sIIhydrate as compared to SNG2. For all aqueous solutions, the amount of hydrateformed from SNG7 was twice the amount of hydrate formed from SNG2 due toconcentration differences in the large 51264 cavity preferring gas components inthe mixtures.
37

38 Chapter 5
The effects of the additives MeOH, PVP, and PVCap on the structure of thegrowth curves have also been studied. Growth rate curves of sII hydrates pro-duced from SNG2 and SNG7 were different. The additives only shifted thegrowth curves of sII hydrates formed from both SNG2 and SNG7. The growthcurves of SNG2 and SNG7 were unique for each composition, and this uniquecurve structure was not affected by the presence of the additives confirming thatgas composition itself played a major role in sII hydrate growth kinetics.
Promotion and inhibition effects of thermodynamic (MeOH) and kinetic (PV-Cap) inhibitors were also studied in underinhibited systems for both sI andsII hydrates. Concentration dependent effects on the nucleation of sI hydratewas not observed on both chemicals when the chemicals were used in smallamounts due to the stochastic nature of nucleation besides other factors suchas temperature-dependent long-range forces, lattice defects and surface tensioneffects. The effect of PVCap on growth was clear and concentration depen-dent up to a certain limit. However, increasing concentration did not increasegrowth inhibition as the chemical had an optimal performance at a certain con-centration as at a given pressure. A time-dependent kinetic rate model has beenproposed for the formation of sI hydrate crystals. Both MeOH and PVCap havebeen tested on the model and the model reflects the effects of the chemicals onsI hydrate growth. The model could be utilized for testing the effect of otheradditives.
Chapter 6
Proposed Future Work
Despite its importance, researchers have been focusing on effects of chemicalsfor studying the kinetics of hydrate formation. Through measurements and in-tensive theoretical studies, we have confirmed that difference in gas compositionaffects nucleation and growth kinetics. Such effects are very important for a re-liable evaluation of the effects of THIs and KHIs on hydrate formation kinetics.The effect of gas composition studies on nucleation and growth kinetics weredone by using only two types of gases with a specific molar composition requir-ing further studies on different systems.
Different types of gases with different molar compositions would be of great in-terest in continuing further investigation of gas composition effects and hence de-termining the role of each molecule by carefully selecting the types of moleculeswhich may affect the kinetics strongly. Changing experimental conditions andthe method of the procedures used in this study would also be a good futurework. Temperature dependent processes are unpredictable and changing theoperating P and T conditions and the degrees of subcooling may give a clue fora novel research. The proposed time-dependent kinetic rate model could alsobe proved or disproved on different systems in different operating conditions.
39


Bibliography
[1] Sloan E. D. Energy Fuels. 1998, 12, 191-196.
[2] Frade, J. R.; Kharton, V. V.; Lopez, D. M.; Nunez, P.; Abrantes, J. C. C.Thermochim. Acta 2005, 435, 85-91.
[3] Kelton, K. F.; Geer, A. L.; Thompson, C. V. J. Chem. Phys. 1983, 79,6261.
[4] Kelton, K. F.; Narayan, K. L.; Levine, L. E.; Cull, T. C.; Ray, C. S. J.Non-Cryst. Solids 1996, 204, 13-31.
[5] Davis, M. J. J. Am. Ceram. Soc. 2001, 84, 492-496.
[6] Frade, J. R.; Queiroz, C. M.; Fernandes, M. H. J. Non-Cryst. Solids 2004,333, 271-277.
[7] Wilson P. W.; Lester, D.; Haymet, A. D. J. Chem. Eng. Sci. 2005, 60,2937-2941.
[8] Boxall, J.; Davies, S.; Koh, A.; Sloan, E. D. Predicting when and wherehydrate plugs form in oil-dominated flowlinws, SPE 129538, Offshore Tech-nology Conference, Houston, 5-8 May 2008, pp 80-86.
[9] Duchateau, C.; Peytavy, J. L.; Glenat, P.; Pou, T. E.; Hidalgo, M.;Dicharry, C. Energy Fuels. 2009, 23, 962-966.
[10] Sarshar, M.; Esmaeilzadeh, F.; Fathikaljahi, J. Oil and Gas Science Tech-nology - Rev. IFP. 2008, 63, 657-667.
[11] Deng-lin, S.; Qiang, W.; Bao-yong, Z. J. Coal Science Engineering. 2008,14, 280-282.
41
42 Bibliography
[12] Buchanan, P.; Soper, A. K.; Thompson, H.; Westacott R. E.; Creek, J. L.;Hobson, G.; Koh, C. A. J. Chem. Phys. 2005, 123, 164507-1−164507-7.
[13] Lee, J. D.; Susilo, R.; Englezos, P. Energy Fuels. 2005, 19, 1008-1015.
[14] Jensen, L.; Thomsen, K.; Solms, N. V. Energy Fuels. 2011, 25, 17-23.
[15] Toschev, S.; Milchev, A.; Stoyanov, S. J. Cryst. Growth. 1972, 13/14,123-127.
[16] Alexander Milchev. Electrocrystallization. Fundamentals of Nucleation andGrowth; Kluwer Ac. Publ.: Norwell, Massachusetts, 2002; p 165.
[17] Jiang, S. and Ter Host, J. H. J. Cryst. Growth Des. 2011, 11, 256-261.
[18] Frade, J. R.; Queiroz, C. M.; Fernandes, M. H. J. Non-Cryst. Solids. 2004,333, 263-270.
[19] Tsuchiyama, A. Am. Mineral. 1983, 68, 687-698.
[20] Takeya, S.; Hori, A.; Hondoh, T.; Uchida, T. J. Phys. Chem. B. 2000, 104(17), 4164-4168.
[21] Abay, H. K.; Svartaas, T. M. Energy Fuels. 2010, 24, 752-757.
[22] Osegovic, J. P.; Tatro, S. R.; Holman, S. A.; Ames, A. L.; Max, M. D. J.Pet. Sci. Eng. 2007, 56, 42-46.
[23] Parent, J. S.; Bishnoi, P. R. Chem. Eng. Comm. 1996, 144, 51-64.
[24] Nguyen, T. N. P.; Kim, K.-J. Int. J. Pharm. 2008, 364, 1-8.
[25] Kashchiev, D.; Firoozabadi, A. J. Cryst. Growth. 2003, 250, 499-515.
[26] Vehkamaki, H. Classical Nucleation Theory in Multicomponent Systems;Springer: Berlin, Heidelberg, 2006; pp 97−113.
[27] Kvamme, B.; Graue, A.; Aspenes, E.; Kuznetsova, T.; Granasy, L.; Toth,G.; Pusztai, T. Tegze, G. Phys. Chem. Chem. Phys. 2004, 6, 2327-2334.
[28] Wilemski, G. J. Chem. Phys. 1983, 80, 1370-1372.
[29] Anklam, M. R.; Firoozabadi, A. J. Chem. Phys. 2004, 121 (23), 11867-11875.
[30] Abbas, I. A.; Mohsen, V. S.; Farshad, V. Iran. J. Chem. Chem. Eng. 2007,26 (2), 63-70.

Bibliography 43
[31] Oxtoby, D. W.; Kashchiev, D. J. Chem. Phys. 1994, 100 (10), 7665-7671.
[32] Debenedetti, P. G.; Reiss, H. J. Chem. Phys. 1998, 108 (13), 5498-5505.
[33] Laaksonen, A.; McGraw, R.; Vehkamaki, H. J. Chem. Phys. 1999, 111 (5),2019-2027.
[34] Djikaev, Y. S.; Tabazadeh, A.; Reiss, H. J. Chem. Phys. 2003, 118 (14),6572-6581.
[35] Nishioka, K.; Kusaka, I. J. Chem. Phys. 1992, 96 (7), 5370-5376.
[36] Kjelstrup, S.; Bedeaux, D.; Johannesen, E. Elements of Irreversible Ther-modynamics for Engineers; Tapir Academic Press: Trondheim, 2006; p34.
[37] Onsager, L. Phys. Rev. 1931, 37, 405-426.
[38] Onsager, L. Phys. Rev. 1931, 38, 2265-2279.
[39] Taylor, R.; Krishna, R. Multicomponent Mass Transfer ; Willy: New York,1993.
[40] Chersky, N. J.; Makogon, Y. F. Oil Gas Int. 1970, 10 (8), 82-84.
[41] Makogon, Y. F.; Trebin, F. A.; Trofimuk, A. A.; Tsarev, V. P.; Chersky,N. V. Dokl. Acad. Sci.: USSR-Earth Sci. Sect. 1972, 196, 197-200.
[42] Peter Englezos. Ind. Eng. Chem. Res. 1993, 32, 1251-1274.
[43] Kvenvolden, K. A. Chem. Geol. 1988a, 41-51.
[44] Klauda, J. B.; Sandler, S. I. Energy Fuels. 2005, 19, 459-470.
[45] Prensky S. A review of gas hydrates and formation evaluation of hydrate-bearing reservoirs, SPWLA 36th Annual Logging Symposium, 26-29 June1995, pp 1-12.
[46] Sun, Z. G.; Ma, R. S.; Wang, R. Z.; Guo, K. H.; Fa, S. S. Energy Fuels.2003, 17, 1180-1185.
[47] Stern, L. A.; Cirone, S.; Kirby, S. H.; Durham, W. B. Energy Fuels. 2001,15, 499-501.
[48] Kvamme, B.; Graue, A.; Buanes, T.; Kuznetsova, T.; Ersland, G. J. Green-house Gas Control I. 2007, 236-246.

44 Bibliography
[49] Gudmundsson, J. S.; Brrehaug, A. In Proceedings of the 2nd InternationalConference on Natural Gas Hydrates, Toulouse, France, June 2-6, 1996; pp439-446.
[50] Khokhar, A. A.; Sloan, E. D. Fluid Phase Equilib. 1998, 150-151, 383-392.
[51] Zhong, Y.; Rogers, R. E. Chem. Eng. Sci. 2000, 55, 4175-4187.
[52] Gudmundsson, J. S. In Proceedings of the 4th International Conference onNatural Gas Hydrates, Yokohama, Japan, May 19-23, 2002; pp 997-1002.
[53] Guo, Y. K.; Fan, S. S.; Guo, K. H.; Chen, Y. In Proceedings of the 4thInternational Conference on Natural Gas Hydrates, Yokohama, Japan, May19-23, 2002; pp 1040-1043.
[54] Lokshin, K. A.; Zhao, Y.; Mao, W. L.; Mao, H.; Hemley, R. J.; Lobanov,M. V.; Greenblatt, M. In Proceedings of the 5th International Conferenceon Gas Hydrates, Trondheim, Norway, June 12-16, 2005.
[55] Strobel, T. A.; Taylor, C. J.; Hester, K. C.; Miller, K. T.; Koh, C. A.;Sloan, E. D. In Proceedings of the 5th International Conference on GasHydrates, Trondheim, Norway, June 12-16, 2005.
[56] Strobel, T. A.; Kim, Y.; Koh, C. A.; Sloan, E. D. In Proceedings of the 6thInternational Conference on Gas Hydrates, Vancouver, Canada, July 6-10,2008.
[57] Sugahara, T.; Hashimoto, S.; Mori, H.; Sakamoto, J.; Ogata, K.; Ohgaki,K. In Proceedings of the 6th International Conference on Gas Hydrates,Vancouver, Canada, July 6-10, 2008.
[58] Hammerschmidt, E. G. Ind. Eng. Chem. 1934, 26, 851.
[59] Sloan, E. D. Hydrate Engineering, Monograph 21; Society of PetroleumEngineers: Richardson, TX, 2000; p 5.
[60] Cooley, C.; Wallace, B. K.; Gudimetla, R. In the SPE Annual Techni-cal Conference and Exhibition, Denver, Colorado, October 5-8, 2003; SPE84350.
[61] Hammerschmidt, E. G. Gas 1939, 15 (5), 30.
[62] Nielsen, R. B; Bucklin, R. W. Hydrocarbon Process 1983, 62 (4), 71-78.
[63] Kelland, M. A. Energy Fuels. 2006, 20, 825-847.

Bibliography 45
[64] Abay, H. K.; Hovring, E.; Svartaas, T. M. In Proceedings of the 7nd Interna-tional Conference on Gas Hydrates, Edinburgh, Scotland, United Kingdom,July 17-21, 2011; pp xxx-yyy.
[65] Karaaslan, U.; Parlaktuna, M. Energy Fuels. 2000, 14, 1103-1107.
[66] Karaaslan, U.; Parlaktuna, M. Energy Fuels. 2002, 16, 1387-1391.
[67] Karaaslan, U.; Parlaktuna, M. Energy Fuels. 2002, 16, 1413-1416.
[68] Sinquin, A.; Arla, D.; Prioux, C.; Peytavy, J. L.; Glenat, P.; Dicharry, C.Energy Fuels. 2008, 22, 721-728.
[69] Larsen, R.; Lund, A.; Andersson, V.; Hjarbo, K. W. In The SPE AnnualTechnical Conference and Exihibition, New Orleans, Louisiana, Sept. 30 -Oct. 3, 2001; SPE 71550.
[70] Wolden, M.; Lund, A.; Oza, N.; Makogon, T.; Argo, C. B.; Larsen, R. InProceedings of the 5th International Conference on Gas Hydrates, Trond-heim, Norway, June 12-16, 2005.
[71] Larsen, R.; Lund, A.; Argo, C.; Makogon, T. In The 18th International OilField Chemistry Symposium, Geilo, Norway, March 25-28, 2007.
[72] Larsen, R.; Lund, A.; Hjarbo, K. W.; Wolden, M. In The 20th InternationalOil Field Chemistry Symposium, Geilo, Norway, March 22-25, 2009.
[73] Makogon, Y. F. Hydrates of Natural Gas; Penn Well Publishing Company:Tulsa, OK, 1981; p 82.
[74] Sloan, E. D.; Koh, C. A. Clathrate Hydrates of Natural Gases, 3rd ed.;CRC Press/Tayler & Francis: Boca Raton, FL, 2008; p 180.
[75] Sum, A. K.; Koh, C. A.; Sloan, E. D. Ind. Eng. Chem. Res. 2009, 48,7457-7465.
[76] B. Kvamme. In Proceedings of the 2nd International Conference on NaturalGas Hydrates, Toulouse, France, June 2−6, 1996; pp 139−146.
[77] B. Kvamme. Ann. NY Acad. Sci. 2000, 912, 496−501.
[78] Kashchiev, D.; Firoozabadi, A. J. Cryst. Growth. 2002, 243, 476-489.
[79] B. Kvamme. Int. J. Offshore Polar Eng. 2002, 12 (4), 256−263.
[80] Kashchiev, D.; Firoozabadi, A. J. Cryst. Growth. 2002, 241, 220-230.

46 Bibliography
[81] Davies, S. R.; Hester, K. C.; Lachance, J. W.; Koh, C. A.; Sloan, E. D.Chem. Eng. Sci. 2009, 64 , 370-375.
[82] Kashchiev, D.; Borissova, A.; Hammond, R. B.; Roberts, K. J. J. Cryst.Growth. 2010, 312, 698-704.
[83] Villano, L. D.; Kommedal, R.; Fijten, M.W.M.; Schubert, U. S.; Hoogen-boom, R.; Kelland, M. A. Energy Fuels. 2009, 23, 3665-3673.
[84] Vysniauskas, A.; Bishnoi, P. R. Chem. Eng. Sci. 1983, 38, 1061-1072.
[85] Skovborg, P.; Ng, H. J.; Rasmussen, P. Chem. Eng. Sci. 1993, 48 (3), 445.
[86] Hemmingsen, P. V.; Li, X.; Kinnari, K. In Proceedings of the 6th Interna-tional Conference on Gas Hydrates, Vancouver, British Columbia, Canada,July 6-10, 2008.
[87] Yousif, M.; Austvik, T.; Berge, L.; Lysne, D. In Proceedings of the 2ndInternational Conference on Natural Gas Hydrates, Toulouse, France, June2-6, 1996; pp 291-298.
[88] Nakayama, H.; Hashimoto, M. Bull. Chem. Soc. Jpn. 1980, 53 (9), 2427-2433.
[89] Davidson, D. W.; Gough, S. R.; Ripmeester, J. A.; Nakayama, H. Can. J.Chem. 1981, 59, 2587-2590.
[90] Williams, K. D.; Devlin, J. P. J. Molecular Structure. 1997, 416, 277-286.
[91] Berecz, E.; Balla-Achs, M. Studies in Inorganic Chemistry. 4. Gas Hy-drates; Elsevier Science Publishers B. V.: Amesterdam, The Netherlands,1983; pp 95-109.
[92] Svartaas, T. M.; Fadnes, F. H. In Proceedings of the 2nd InternationalOffshore and Polar Engineering Conference, San Francisco, USA, June 14-19, 1992; pp 614-619.
[93] Bobev, S.; Tait, K. T. Am. Mineral. 2004, 89, 1208-1214.
[94] Alavi, S.; Susilo, R.; Ripmeester, J. A. J. Chem. Phys. 2009, 130, 174501-1−174501-9.
[95] Nord, L.; Tucker, E. E.; Christian, S. D. J. Solution Chem. 1984, 13 (12),849-867.

Bibliography 47
[96] Ohtake, M.; Yamamoto, Y.; Kawamura, T.; Wakisaka, A.; Souza, W. F.;Freitas, A. M. V. J. Phys. Chem. B 2005, 109, 16879-16885.
[97] Chang, T. M.; Dang, L. X. J. Phys. Chem. B. 2005, 109 (12), 5759-5765.
[98] Chen, P. C.; Huang, W. L.; Stern, L. A. Energy Fuels. 2010, 24, 2390.
[99] Zeng, H.; Lu, H.; Huva, E.; Walker, V. K.; Ripmeester, J. A. Chem. Eng.Sci. 2008, 63, 4026-4029.
[100] Zhang, J. S.; Lo, C.; Couzis, A.; Somasundaran, P.; Wu, J.; Lee, J. W. J.Phys. Chem. C 2009, 113, 17418-17420.
[101] Kvamme, B.; Kuznetsova, T.; Aasoldsen, K. J. Mol. Graphics and Mod-eling. 2005, 23, 524-536.
[102] Anderson, B. J.; Tester, J. W.; Borghi, G. P.; Trout, B. L. J. Am. Chem.Soc. 2005, 127, 17852-17862.
[103] Lederhos, J. P.; Long, J. P.; Sum, A.; Christiansen, R. L.; Sloan, E. D.Chem. Eng. Sci. 1996, 51, 1221-1229.
[104] Larsen, R.; Knight, C. A.; Sloan, E. D. Fluid Phase Equilibria. 1998,150-151, 353-360.
[105] Moon, C.; Hawtin, R. W.; Rodger, P. M. Faraday Discuss. 2007, 136,367-382.
[106] Buch, V.; Devlin, J. P.; Monreal, I. A.; Cwiklik, B. J.; Aytemiz, N. U.;Cwiklik, L. Phys. Chem. Chem. Phys. 2009, 11, 10245-10265.
[107] Anderson, G. K. J. Chem. Thermodyn. 2004, 36, 1119-1127.
[108] Makogon, Y. F. Hydrates of Hydrocarbons; PennWell Publishing Com-pany: Tulsa, OK, 1997; pp 65−70.
[109] Song, K. Y.; Feneyrou, G.; Fleyfel, F.; Martin, R.; Lievois, J.; Kobayashi,R. Fluid Phase Equilib. 1997, 128, 249-260.
[110] Servio, P.; Englezos, P. Fluid Phase Equilib. 2001, 190, 127-134.
[111] Kashchiev, D. Nucleation: Basic Theory with Applications; Butterworth-Heinemann: Oxford, 2000; p 77.
[112] Volmer, M.; Weber, A. Z. Phys. Chem. 1926, 119, 277-301.
48 Bibliography
[113] Noyes, R. M. J. Phys. Chem. 1990, 94, 4404-4412.
[114] Shneidman, V. A. J. Chem. Phys. 2007, 127, 041102-1-041102-4.
[115] Ma, Q. L.; Chen, G. J.; Guo, T. M. Fluid Phase Equilib. 2003, 205,291-302.
[116] Abay, H. K.; Svartaas, T. M. Energy Fuels. 2011, 25, 41-52.
[117] Subramanian, S.; Kini, R. A.; Dec, S. F.; Sloan Jr., E. D. Chem. Eng.Sci. 2000, 55, 1981-1999.
[118] Subramanian, S.; Ballard, A. L.; Kini, R. A.; Dec, S. F.; Sloan Jr., E. D.Chem. Eng. Sci. 2000, 55, 5763-5771.
[119] Ballard, A. L.; Sloan Jr., E. D. Chem. Eng. Sci. 2000, 55, 5773.
[120] Ballard, A. L.; Sloan Jr., E. D. Chem. Eng. Sci. 2001, 56, 6883.
[121] Englezos, P. In Proceedings of the Fifth International Offshore and PolarEngineering Conference, The Hague, The Netherlands, June 11−16, 1995;pp 289−296.
[122] Ribeiro, C. P.; Lage, P. L. C. Chem. Eng. Sci. 2008, 63, 2007-2034.
[123] Kuji, Y.; Yamasaki, A.; Yanagisawa, Y. Energy Fuels. 2006, 20, 2198-2201.
[124] Daimaru, T.; Kuji, Y.; Yanagisawa, Y.; Yamasaki, A. In Proceedings ofthe Fifth International Conference on Gas Hydrates, Trondheim, Norway,June 12−16, 2005.
[125] Okano, T.; Yanagisawa, Y.; Yamasaki, A. In Proceedings of the Fifth In-ternational Conference on Gas Hydrates, Trondheim, Norway, June 12−16,2005.
[126] Arjmandi, M.; Tohidi, B.; Danesh, A.; Todd, A. C. Chem. Eng. Sci..2005, 60, 1313-1321.
[127] Happel, J.; Hnatow, M. A.; Meyer, H. Ann. NY Acad. Sci. 1994, 715,412-424.
[128] Makogon, Y. F.; Makogon, T. Y.; Holditch, S. A. In Proceedings of theJapan National Oil Conference, Japan, October 20-22, 1998; pp 259-267.
Bibliography 49
[129] Freer, E. M.; Selim, M. S.; Sloan, E. D. Fluid Phase Equilibria, 2001,185, 65-75.
[130] Tayer, C. J.; Miller, K. T.; Koh, C. A.; Sloan, E. D. In Proceedingsof the 6th International Conference on Gas Hydrates, Vancouver, BritishColumbia, July 6-10, 2008.
[131] Peng, B. Z.; Chen, G. J.; Sun, C. Y.; Yang, L. Y.; Luo, H. In Proceedingsof the 6th International Conference on Gas Hydrates, Vancouver, BritishColumbia, July 6-10, 2008.
[132] Turner, D.; Boxall, J.; Yang, S.; Kleehamer, D.; Koh, C.; Miller, K.;Sloan, E. D.; Xu, Z.; Mathews, P.; Tally, L. In Proceedings of the FifthInternational Conference on Gas Hydrates, Trondheim, Norway, June 12-16, 2005.
[133] Varaminian, F. In Proceedings of the Fourth International Conference onGas Hydrates, Yokohama, Japan, May 19-23, 2002; pp 465-468.
[134] Englezos, P.; Kalogerakis, N. E.; Dholabhai, P. D.; Bishnoi, P. R. Chem.Eng. Sci. 1987, 42 (11), 2647-2658.
[135] Skovborg, P.; Rasmussen, P. Chem. Eng. Sci. 1994, 49 (8), 1131-1143.
[136] Lekvam, K.; Ruoff, P. J. Am. Chem. Soc. 1993, 115, 8565-8569.
[137] Herri, J.; Gruy, F.; Cournil, M. In Proceedings of the 2nd InternationalConference on Natural Gas Hydrates, Toulouse, France, June 2−6, 1996;pp 243−250.
[138] Parlaktuna, M.; Gudmundsson, J. In Proceedings of the 2nd InternationalConference on Natural Gas Hydrates, Toulouse, France, June 2-6, 1996; pp439-446.

Appendix A
Paper I
Effects of Ultralow Concentration of Methanol onMethane Hydrate Formation
By:
Hailu K. Abay and Thor M. Svartaas.
Printed in:
Journal of Energy & Fuels, 24, 752-757, (2010).
The paper is reprinted with permission from the American Chemical Society. Copyright
c© 2010.
51


Paper I 53

54 Appendix A
752r 2009 American Chemical Society pubs.acs.org/EF
Energy Fuels 2010, 24, 752–757 : DOI:10.1021/ef9009422
Published on Web 11/09/2009
Effect of Ultralow Concentration of Methanol on Methane Hydrate Formation
Hailu K. Abay and Thor M. Svartaas*
Department of Petroleum Engineering, Faculty of Science and Technology, University of Stavanger, 4036 Stavanger, Norway
Received August 28, 2009. Revised Manuscript Received October 24, 2009
Methane hydrates were produced in an isochoric high pressure cell in the presence of an ultralowconcentration of methanol as an additive. Methanol concentrations examined were in the range 1.5-20 ppm by weight. The real gas equation and the nucleation probability distribution have been used tounderstand the effect of ultralow concentrations ofmethanol on the amount of hydrate formation, the rateof nucleation, and the range of probability distribution function in which random nucleation of methanehydrates occur. Comparisons with the pure water baseline experiment showed that an ultralow concen-tration of methanol exhibits dual effect, both as an inhibitor and as a promoter on structure I methanehydrate formation.
Introduction
Natural gas hydrates are three-dimensional (3D) crystallineice-like materials. The physical conditions required to formgas hydrates are gas molecules (guests) and water molecules
(hosts) with the correct conditions of temperature and pres-sure. The most common gas hydrate crystal structures arestructure I (sI), structure II (sII), and structure H (sH). These
structures are composed of cavities formed from hydrogen-bonded water molecules where the guest molecule is trappedin the host. Methane, the main constituent of natural gas,forms sI hydrate. The ideal cubic unit cell of sI hydrate
consists of two 512 small cavities and six 51262 large cavitieswitha total of 46watermolecules.1Methane can stabilize boththe smaller and the larger cavities, but has a better fit for the
512 than the 51262 cavity. Figure 1 illustrates nucleation ofmethane hydrate in crystallizing the unit cell of sI. During theformation of hydrates, one methane molecule is allocated for
20watermolecules in every smaller cages of the sI unit cell andanother methane molecule for 24 water molecules in every 6larger cavities of the sI unit cell.
Hydrate nucleation and dissociation in oil and gas pipelines
are of great industrial and environmental interest since fromthe first discovery by Hammershmidt that hydrates are cap-able of blocking transport pipelines.2 The industrial hydrate
concerns have been in flow assurance, which is the majortechnical problem in offshore development, production, andtransportation. In general, the well, the pipeline, and the
platform are susceptible portions of the systemwhere hydrateplugs occur.3 Inpreventing hydrate blockage, thermodynamicand low dosage hydrate inhibitors have been successfully
used. From alcohols, methanol (MeOH) is one of the mostwidely used thermodynamic hydrate inhibitor (THI) in the gas
and oil fields due to its effectiveness. The wellhead jumpersand flow lines are parts of the system where methanol is being
added to inhibit the formation of hydrates.4
When used in large amounts, methanol prevents hydratecrystallization by shifting the phase boundary thermodyna-mically to the lower temperature and higher pressure. How-
ever, in small amounts, the literature shows contradictingeffects;both as an inhibitor and as a promoter. With regardto inhibition, methanol has two effects on hydrate crystal-
lization. The hydroxyl grouphas themajor effect by hydrogenbonding with the water molecules, and the methyl group hasthe lesser effect by tending to organize the water molecules in
direct competition for a hydrate guest. Another effect ofmethanol is on the surface tension of a gas-solution interface.Amolecular dynamics study5 showed that the surface tension
of the liquid-vapor interface of methanol-water mixtureswas greatly reduced by adding a small amount of methanol towater.
Experimental studies on the effect of a small amount of
methanol with concentration less than 5 wt % have reportedon the thermodynamic stability, inhibition, and promotionaleffect of hydrates. An initially low concentration of methanol
was assumed to stabilize both sI and sII structures,6 but laterNMR and dielectric studies verified no sign of enclathrationof methanol.7 Some studies8,9 showed that a low concentra-
tion of methanol in aqueous solution increased hydratestabilization. In contrary to this, other experimental studiesindicated that thermodynamic stability did not increase withthe presence of a small amount of methanol, but an inhibiting
effect was observed.10 On the other hand, under-inhibition
*To whom correspondence should be addressed. Telephone: þ4751832285. Fax: þ47 51832050. E-mail: [email protected].(1) Sloan, E. D.; Koh, C. A.Clathrate Hydrates of Natural Gases, 3rd
ed.; CRC Press/Tayler & Francis: Boca Raton, FL, 2008; p 60.(2) Hammershmidt, E. G. Ind. Eng. Chem. 1934, 26, 851.(3) Sloan, E. D. Hydrate Engineering, Monograph 21; Society of
Petroleum Engineers: Richardson, TX, 2000; p 5.(4) Cooley, C.; Wallace, B. K.; Gudimetla, R. In The SPE Annual
Technical Conference and Exhibition, Denver, CO, October 5-8, 2003;SPE 84350.
(5) Chang, T.M.; Dang, L. X. J. Phys. Chem. B. 2005, 109 (12), 5759–5765.
(6) Nakayama, H.; Hashimoto,M.Bull. Chem. Soc. Jpn. 1980, 53 (9),2427–2433.
(7) Davidson, D.W.; Gough, S. R.; Ripmeester, J. A.; Nakayama, H.Can. J. Chem. 1981, 59, 2587–2590.
(8) Makogon, Y. F. Hydrates of Natural Gas; Penn Well PublishingCompany: Tulsa, OK, 1981; pp 133-135.
(9) Berecz, E.; Balla-Achs, M. Studies in Inorganic Chemistry. 4. GasHydrates; Elsevier Science Publishers B. V.: Amesterdam, The Netherlands,1983; pp 95-109.
(10) Svartaas, T. M.; Fadnes, F. H. In Proceedings of the 2nd Inter-national Offshore and Polar Engineering Conference, San Francisco, USA,June 14-19, 1992; pp 614-619.
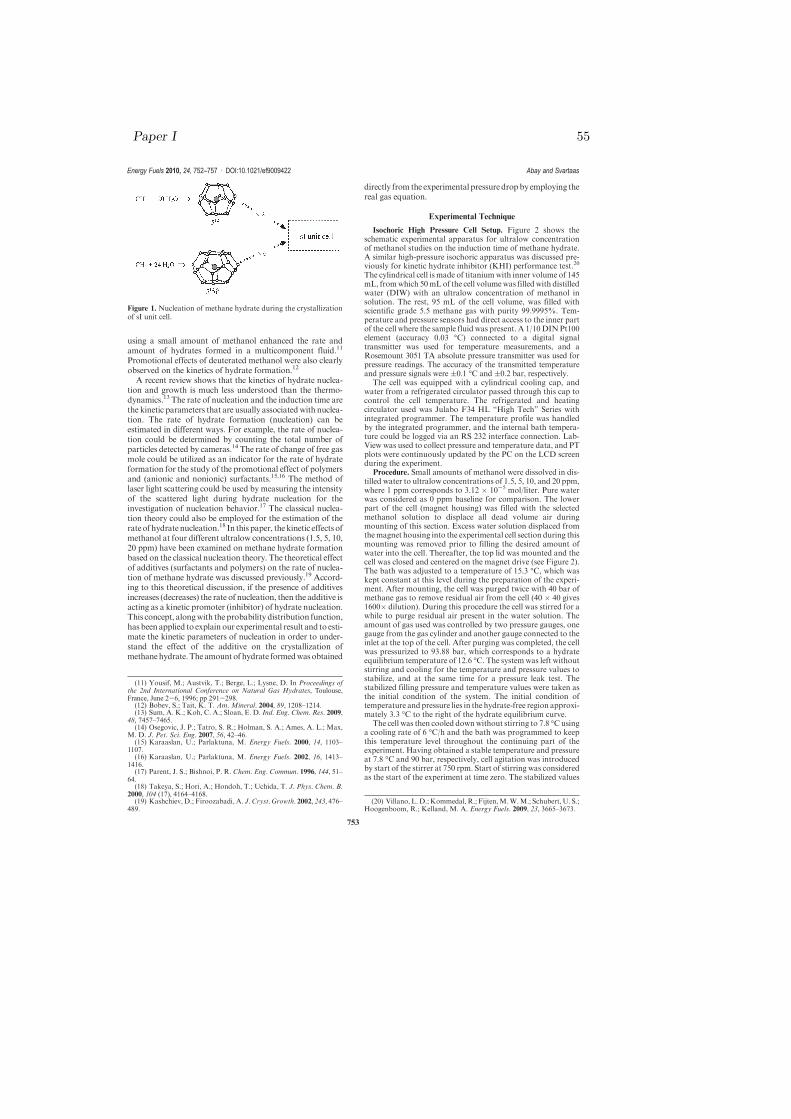
Paper I 55
753
Energy Fuels 2010, 24, 752–757 : DOI:10.1021/ef9009422 Abay and Svartaas
using a small amount of methanol enhanced the rate andamount of hydrates formed in a multicomponent fluid.11
Promotional effects of deuterated methanol were also clearly
observed on the kinetics of hydrate formation.12
A recent review shows that the kinetics of hydrate nuclea-tion and growth is much less understood than the thermo-dynamics.13The rate of nucleation and the induction time are
the kinetic parameters that are usually associated with nuclea-tion. The rate of hydrate formation (nucleation) can beestimated in different ways. For example, the rate of nuclea-
tion could be determined by counting the total number ofparticles detected by cameras.14The rate of change of free gasmole could be utilized as an indicator for the rate of hydrate
formation for the study of the promotional effect of polymersand (anionic and nonionic) surfactants.15,16 The method oflaser light scattering could be used by measuring the intensity
of the scattered light during hydrate nucleation for theinvestigation of nucleation behavior.17 The classical nuclea-tion theory could also be employed for the estimation of therateof hydrate nucleation.18 In this paper, the kinetic effects of
methanol at four different ultralow concentrations (1.5, 5, 10,20 ppm) have been examined on methane hydrate formationbased on the classical nucleation theory. The theoretical effect
of additives (surfactants and polymers) on the rate of nuclea-tion of methane hydrate was discussed previously.19 Accord-ing to this theoretical discussion, if the presence of additives
increases (decreases) the rate of nucleation, then the additive isacting as a kinetic promoter (inhibitor) of hydrate nucleation.This concept, alongwith the probability distribution function,has been applied to explain our experimental result and to esti-
mate the kinetic parameters of nucleation in order to under-stand the effect of the additive on the crystallization ofmethanehydrate.Theamountof hydrate formedwasobtained
directly from the experimental pressuredropby employing thereal gas equation.
Experimental Technique
Isochoric High Pressure Cell Setup. Figure 2 shows theschematic experimental apparatus for ultralow concentrationof methanol studies on the induction time of methane hydrate.A similar high-pressure isochoric apparatus was discussed pre-viously for kinetic hydrate inhibitor (KHI) performance test.20
The cylindrical cell is made of titaniumwith inner volume of 145mL, fromwhich 50mLof the cell volumewas filledwith distilledwater (DIW) with an ultralow concentration of methanol insolution. The rest, 95 mL of the cell volume, was filled withscientific grade 5.5 methane gas with purity 99.9995%. Tem-perature and pressure sensors had direct access to the inner partof the cell where the sample fluid was present. A 1/10DINPt100element (accuracy 0.03 �C) connected to a digital signaltransmitter was used for temperature measurements, and aRosemount 3051 TA absolute pressure transmitter was used forpressure readings. The accuracy of the transmitted temperatureand pressure signals were (0.1 �C and (0.2 bar, respectively.
The cell was equipped with a cylindrical cooling cap, andwater from a refrigerated circulator passed through this cap tocontrol the cell temperature. The refrigerated and heatingcirculator used was Julabo F34 HL “High Tech” Series withintegrated programmer. The temperature profile was handledby the integrated programmer, and the internal bath tempera-ture could be logged via an RS 232 interface connection. Lab-View was used to collect pressure and temperature data, and PTplots were continuously updated by the PC on the LCD screenduring the experiment.
Procedure. Small amounts of methanol were dissolved in dis-tilled water to ultralow concentrations of 1.5, 5, 10, and 20 ppm,where 1 ppm corresponds to 3.12 � 10-5 mol/liter. Pure waterwas considered as 0 ppm baseline for comparison. The lowerpart of the cell (magnet housing) was filled with the selectedmethanol solution to displace all dead volume air duringmounting of this section. Excess water solution displaced fromthemagnet housing into the experimental cell section during thismounting was removed prior to filling the desired amount ofwater into the cell. Thereafter, the top lid was mounted and thecell was closed and centered on the magnet drive (see Figure 2).The bath was adjusted to a temperature of 15.3 �C, which waskept constant at this level during the preparation of the experi-ment. After mounting, the cell was purged twice with 40 bar ofmethane gas to remove residual air from the cell (40 � 40 gives1600� dilution). During this procedure the cell was stirred for awhile to purge residual air present in the water solution. Theamount of gas used was controlled by two pressure gauges, onegauge from the gas cylinder and another gauge connected to theinlet at the top of the cell. After purging was completed, the cellwas pressurized to 93.88 bar, which corresponds to a hydrateequilibrium temperature of 12.6 �C. The systemwas left withoutstirring and cooling for the temperature and pressure values tostabilize, and at the same time for a pressure leak test. Thestabilized filling pressure and temperature values were taken asthe initial condition of the system. The initial condition oftemperature and pressure lies in the hydrate-free region approxi-mately 3.3 �C to the right of the hydrate equilibrium curve.
The cell was then cooled downwithout stirring to 7.8 �Cusinga cooling rate of 6 �C/h and the bath was programmed to keepthis temperature level throughout the continuing part of theexperiment. Having obtained a stable temperature and pressureat 7.8 �C and 90 bar, respectively, cell agitation was introducedby start of the stirrer at 750 rpm. Start of stirring was consideredas the start of the experiment at time zero. The stabilized values
Figure 1. Nucleation of methane hydrate during the crystallizationof sI unit cell.
(11) Yousif, M.; Austvik, T.; Berge, L.; Lysne, D. In Proceedings ofthe 2nd International Conference on Natural Gas Hydrates, Toulouse,France, June 2-6, 1996; pp 291-298.(12) Bobev, S.; Tait, K. T. Am. Mineral. 2004, 89, 1208–1214.(13) Sum, A. K.; Koh, C. A.; Sloan, E. D. Ind. Eng. Chem. Res. 2009,
48, 7457–7465.(14) Osegovic, J. P.; Tatro, S. R.; Holman, S. A.; Ames, A. L.; Max,
M. D. J. Pet. Sci. Eng. 2007, 56, 42–46.(15) Karaaslan, U.; Parlaktuna, M. Energy Fuels. 2000, 14, 1103–
1107.(16) Karaaslan, U.; Parlaktuna, M. Energy Fuels. 2002, 16, 1413–
1416.(17) Parent, J. S.; Bishnoi, P. R. Chem. Eng. Commun. 1996, 144, 51–
64.(18) Takeya, S.; Hori, A.; Hondoh, T.; Uchida, T. J. Phys. Chem. B.
2000, 104 (17), 4164–4168.(19) Kashchiev,D.; Firoozabadi, A. J. Cryst. Growth. 2002, 243, 476–
489.(20) Villano, L.D.;Kommedal, R.; Fijten,M.W.M.; Schubert,U. S.;
Hoogenboom, R.; Kelland, M. A. Energy Fuels. 2009, 23, 3665–3673.

56 Appendix A
754
Energy Fuels 2010, 24, 752–757 : DOI:10.1021/ef9009422 Abay and Svartaas
of temperature and pressure remained constant from time zeroto the onset of hydrate formation as shown in Figure 3.
During the onset of hydrate formation, there was a pressuredrop accompanied by an increase in cell temperature. The pressuredropwas due to the gas consumptionwhenmethane gasmoleculesfills unoccupied water cavities during the process of hydrateformation, and the temperature pulse was due to released heat offormation. As shown in Figure 3, the pressure drop and thetemperature variation, and the gas consumption (in Figure 4)attained a constant value when the system reached its equilibriumstate where the hydrate, the liquid water, and the methane gascoexist. The time elapsed from the start of the experiment at ts tothe onset of hydrate formation at to was taken as the inductiontime, ti, which is the major kinetic parameter we measured. Thepressure drop was calculated for the analysis of the additive on theamount of methane hydrate formation. The high pressure cell wasdisassembled and cleaned twice with tapwater, distilledwater, anddry air prior to the next series of experiments.
Results and Discussion
Amount of Methane Hydrate Formed. Employing the real
gas equation for an isochoric system, we have
Δn ¼V
zRTΔP ð1Þ
where Δn is the amount of gas consumed when hydrates form,
ΔP is the measured experimental pressure drop caused byhydrate formation,V is the gas volume, z is the compressibilityfactor, R is the universal gas constant, and T is the measured
experimental temperature. The amount of gas consumed and
thepressuredroparedirectlyproportional (Δn�ΔP) with eachother since the term V/zRT could be approximated as the
constant of proportionality that does not vary significantly forthe experiments. Thus, eq 1 could be utilized to estimate theamount of hydrates formed in every experiment. Figure 5
shows the pressure versus temperature plot during hydrateformation illustrating a typical pressure drop and the degree ofsubcooling used. As shown in Figure 5, the maximum pressure
dropduring the experimentwasobtainedwhen the cell pressurereached the hydrate equilibrium pressure at the experimentaltemperature.
Another important approximation is the filling of the 512
and 51262 cavities by the guest molecules during the processof hydrate formation. Assuming complete filling of cavities,the hydration number should ideally be 5.75 for sI methane
hydrate. i.e., 5.75 mols of water for each mole of gas con-sumed. Such method is not an exact approximation sincecomplete filling of cavities most probably may not be
achieved. According to CSMHYD, the hydration number formethane hydrate should be around 5.9 at 90 bar. In addition,all methane molecules that were absorbed from the gaseous
phase during hydrate formation may not form hydrates.Somemolecules saturate the liquid water at the experimentaltemperature and pressure, hence the liquid in equilibriumwith hydrate is not pure water.21 In the experiments,
Figure 2. Experimental setup.
Figure 3. Response of pressure and temperature during hydrateformation. Figure 4. Gas consumption versus time during hydrate nucleation
and growth.
(21) Anderson, G. K. J. Chem. Thermodyn. 2004, 36, 1119–1127.
Paper I 57
755
Energy Fuels 2010, 24, 752–757 : DOI:10.1021/ef9009422 Abay and Svartaas
a pressure drop of 0.1-0.2 bar on average was observed insaturating the liquid phase prior to formation of methanehydrates if hydrates were not formed spontaneously at the
start of stirring. Thus, saturation had no significant effect inestimating the amount of hydrates formed from the observedpressure drop. A comparison between the total amount of
hydrates formed in the system with ultralow concentrationsofmethanol and the pure water baseline experiment is shownin Figure 6. Each data point represents the average of 6-10experimental data points with the corresponding error bar
(see Table 1). The figure shows that the total amount of gasconsumed was significantly reduced for all systems withmethanol except the 5 ppm solution (8 data points), where
an overlap with the pure water baseline pressure drop exists.Nucleation Rate and Induction Time Estimation. Nuclea-
tion is a stochastic process as shown in Figure 7 of the
experimental result. Such stochastic process can be describedby the Poisson distribution law, repeating each experimentmtimes under the same experimental conditions. Thus, the
probability distribution of nucleation is
PðtnÞ ¼n
mð2Þ
where tn is the induction time of the nth out of m experi-ments. All experiments were run at the same initial degree ofsubcooling. This was done because induction time and
formation rate are dependent on the degree of subcoolingin both uninhibited and under-inhibited systems.22 The
degree of subcooling, ΔT, at the start of the experimentwas on average 4 �C (see Figure 5). Other factors that couldaffect the induction timewere the thermal history ofwater8,23
and the degree of agitation.24 However, the distilled water
used in all experiments was fresh and initially at roomtemperature with the same thermal history prior to loadingof the cell. Also, the degree of agitation was kept the same
(750 rpm) for all experiments. Experiments that lasted morethan 36 h without hydrate formation were terminated (seeTable 1). If methanol has an inhibitor effect at ultralow
concentrations, the system should be displaced toward long-er induction. Thus, terminated experiments would weakenany conclusion on the promotion effect, but strengthen any
conclusion on the inhibition effect when observed by theprobability function analysis. This is considered in thefollowing discussion of results.
The probability distribution function has been used in
determining the probability of finding a nuclei that hasreached its critical size within a time interval (0,t). Hencefor a given isochoric sample of fluid, the nucleation prob-
ability distribution P(t) is expressed as a function of time as
PðtÞ ¼ 1-e-Jðt-τ0Þ ð3Þ
where J is the rate of nucleation and τ0 is the induction
time.18,25 The induction time is also called nonsteady-state time lag, and it is a measure of the time necessary forthe nucleation rate to attain a steady-state value.26 Theexperimental data has been used to fit the parameters of
eq 3. The results for the four different concentrations ofmethanol are tabulated in Table 1 with 95% confidenceintervals.
Comparisons of the induction time of all the nonzeromethanol concentrations with the pure water baselineexperiment pointed in the direction that the presence of an
ultralow concentration of methanol increased the inductiontime and rate of nucleation of methane hydrate formation.However, within the concentration range examined, the
induction time did not show a uniform increase as a functionof methanol concentration, but rather some oscillationsindicating fluctuation between promotion and inhibitioneffect, especially for the lower concentrations. The 10 ppm
experiment has the least induction time compared to otherunder-inhibited systems. The negative value for the induc-tion time shows that nucleation is probable before the start
of stirring at time zero as shown in Figure 8. Thesystem temperature crossed the hydrate equilibrium curve53 min prior to the start of stirring in all experiments
(i.e., at -53 min with start of stirring defined at zero timefor the induction time measurements). Including a probabilityof nucleation during the sequence of cooling without stirringprior to time zero, the minimum allowed induction time was
restricted to -53 min in fitting the experimental data to theparameters of eq 3. Negative values of the induction time
Figure 5. Pressure vs temperature graph during hydrate formation.
Figure 6. Average pressure drop for ultralow concentration ofmethanol.
(22) Hemmingsen, P. V.; Li, X.; Kinnari, K. In Proceedings of the 6thInternational Conference on Gas Hydrates, Vancouver, British Columbia,Canada, July 6-10, 2008.
(23) Vysniauskas, A.; Bishnoi, P. R. Chem. Eng. Sci. 1983, 38, 1061.(24) Skovborg, P.; Ng, H. J.; Rasmussen, P. Chem. Eng. Sci. 1993, 48
(3), 445.(25) Toschev, S.;Milchev,A.; Stoyanov, S. J. Cryst. Growth. 1972, 13/
14, 123–127.(26) Tsuchiyama, A. Am. Mineral. 1983, 68, 687–698.

58 Appendix A
756
Energy Fuels 2010, 24, 752–757 : DOI:10.1021/ef9009422 Abay and Svartaas
means spontaneous nucleation at the start of stirring or
during the cooling sequence prior to start of stirring.For the 10 ppm concentration, the experimental data and
the probability distribution fit show nonzero probability forvery short induction time. The S-shaped probability distri-
bution function is shifted to the leftmost side compared toother experiments, including the pure water baseline refer-ence. This shift with the nonzero probability for very short
induction time could be an indication that methanol is actingas a promoter at this concentration. Figure 7 also shows that
the range of random nucleation of the 10 ppm experiment isas wide as the range of random nucleation of the pure waterexperiment. However, the rate of nucleation was increasedby a factor of 1.4 as compared to that of the pure water
baseline value.Contrary to the 10 ppm solution experiment, the delay of
the induction time is more pronounced for the 20 ppm
concentration. Unlike the 0 and 10 ppm solutions, theprobability of finding nucleation is zero for low inductiontime, and the range of the probability distribution function is
the narrowest compared to others. This considerable in-crease in induction time and the narrow rightmost prob-ability distribution function could be an indication that the
20 ppm concentration is inhibiting hydrate crystallization.This concentration caused the rate of nucleation to increaseby a factor of 2.9, and it is the largest factor compared toothers. In addition, the five terminated experiments with
measured induction times above 36 h would most probablystrengthen an inhibitory effect if included in the analysis.
As compared to the uninhibited system, the 1.5 and 5 ppm
solutions show nearly similar effect on the rate of nucleation,that is, it is increased by a factor of 1.2 and 1.1, respectively.However, the induction timewas significantly increased. The
tabulated results show that increasing the concentration ofthe additive from1.5 to 5 ppmdid not increase the nucleationrate and the induction time, but rather caused values of J andτ0 to decrease. In fact, increasing concentration did not show
a corresponding increase in nucleation rate and inductiontime for all under-inhibited systems. In otherwords, ultralowconcentrations of methanol showed two opposing effects on
the rate of nucleation of methane hydrate and inductiontime.
Although opposing effects were observed experimentally
on the kinetics of methane hydrates formation, there are stillunanswered questions such as why methanol has dual beha-vior at ultralow concentration and where it is found after
hydrate formation. At room temperature, a moleculardynamics study5 on methanol-water mixtures showed thatmethanol tends to concentrate at the interface between theliquid and the gas phase in such a way that the hydrophobic
(methyl) group is pointing into the vapor phase. On the otherhand, the hydrophilic (hydroxyl) group is able to formhydrogen bonding with the water molecules. The interaction
of hydrophobic and hydrophilic groups with water andmethane molecules may result in deviation from the normalbehavior during the nucleation process depending on the
experimental conditions.In a diluted solution of alcohols, previous studies
showed27 that the pairwise interaction between moleculesof the alcohol is attractive, triple interactions are repulsive,
and higher order interactions are attractive. The magnitudesof these interactions are dependent on the temperature of thesystem. For example, the repulsive interaction decreases its
magnitude when temperature increases. Upon cooling dur-ing the course of the experiment and prior to onset tempera-ture for hydrate formation, the temperature of the system
was continuously decreasing, which could have resulted inan increase in the magnitude of the repulsive interaction.Temperature-dependent interactions between and among
Table 1. Pressure Drop, Nucleation Rate, and Induction Time forUltralow Concentrations of Methanol
number of experiments
concentration
(ppm)
done
(<36 h)
terminated
(>36 h)
ΔP
((std deva)
J
(min-1)
τo
(min)
0 7 0 35.13 ((2:00) 2.28 � 10-3 -53
1.5 10 2 31.26 ((0:44) 2.71 � 10-3 61.18
5 8 1 32.79 ((2:38) 2.43 � 10-3 27.6
10 10 0 31.49 ((0:53) 3.09 � 10-3 -32.26
20 6 5 31.08 ((1:09) 6.54 � 10-3 247.9
aStandard deviation.
Figure 7. Nucleation probabilities vs induction time for ultralowconcentration of methanol.
Figure 8. Temperature vs time graph before onset temperature forhydrate formation.
(27) Nord, L.; Tucker, E. E.; Christian, S. D. J. Solution Chem. 1984,13 (12), 849–867.

Paper I 59
757
Energy Fuels 2010, 24, 752–757 : DOI:10.1021/ef9009422 Abay and Svartaas
methanol molecules in the vicinity of the water and methanemolecules could affect the energy barrier (activation energy)
the system must cross before a stable nuclei is formed. Theactivation energy, a function dependent on temperature andpressure, could be easily affected by the attractive andrepulsive interactions between and among the molecules of
methanol. In fact, the probability of getting twomolecules indirect contact with each other at ultralow concentration iszero. Thus, one may speculate that for a possible long-range
interactions transmitted (and probably intensified) throughthe water and methane molecules, ultralow concentrationof methanol in solutions may significantly affect the beha-
vior and the role it has on the nucleation process. Theseinteractions could possibly affect the activity of the waterand methane molecules in an attempt to rearrange them-
selves so that they could achieve the critical size for onsetof hydrate formation and continued growth. Further inves-tigation using molecular dynamics simulation may revealwhy (and how) methanol behaves dually as an inhibitor
and as a promoter on the kinetics of methane hydrate for-mation.
Conclusion
We have performed a series of experiments to investigate
the effect of ultralow concentrations of methanol on theamount ofmethane hydrate formation, the rate of nucleation,and the range of probability distribution in which random
nucleation of sI methane hydrates occurs. Compared to thepure water baseline experiment, the presence of ultralowconcentrations of methanol in aqueous solution has affectedthe amount of hydrate formation, the rate of nucleation, and
the range of the probability distribution function. The resultsshow that an ultralow concentration of methanol has a dualeffect, both as a promoter and as an inhibitor on methane
hydrate formation for the specific concentrations considered.
Acknowledgment. The authors thank NFR for the financialsupport of this work.

60 Appendix A
Appendix B
Paper II
Multicomponent Gas Hydrate Nucleation: The Effect ofthe Cooling Rate and Composition
By:
Hailu K. Abay and Thor M. Svartaas.
Printed in:
Journal of Energy & Fuels, 25, 42-51, (2011).
This paper is reprinted with permission from the American Chemical Society. Copyright
c© 2011.
61


Paper II 63
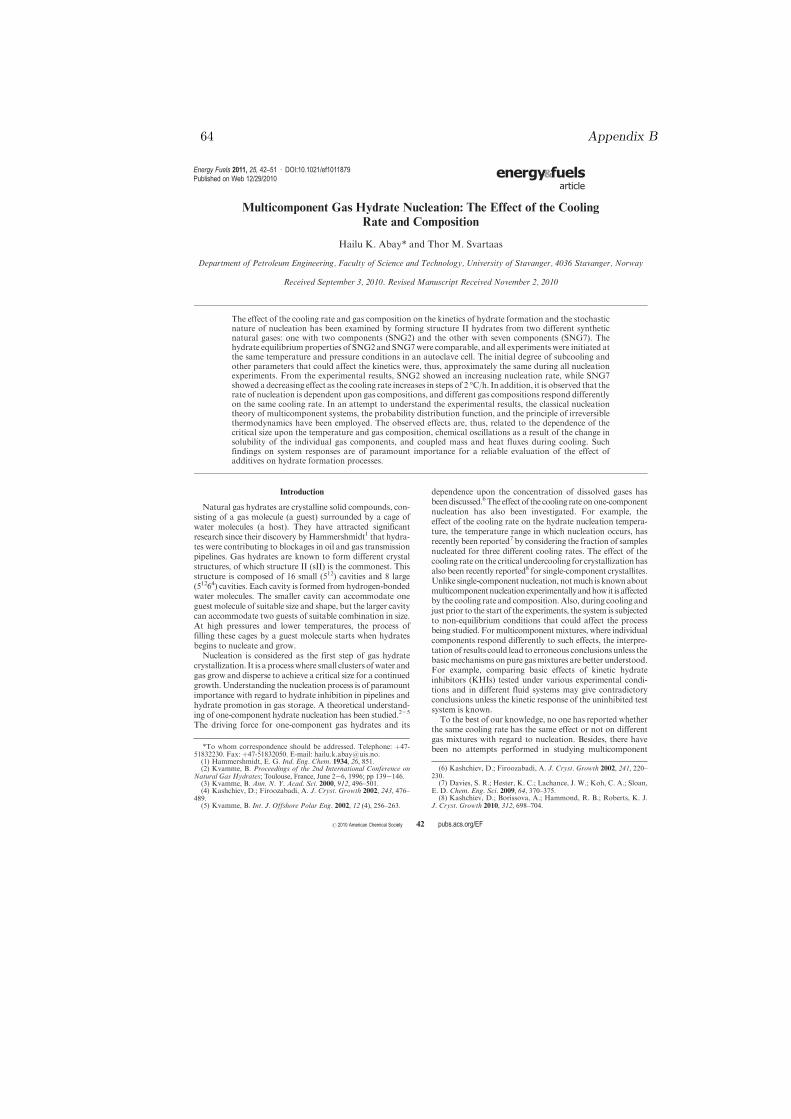
64 Appendix B
42r 2010 American Chemical Society pubs.acs.org/EF
Energy Fuels 2011, 25, 42–51 : DOI:10.1021/ef1011879
Published on Web 12/29/2010
Multicomponent Gas Hydrate Nucleation: The Effect of the Cooling
Rate and Composition
Hailu K. Abay* and Thor M. Svartaas
Department of Petroleum Engineering, Faculty of Science and Technology, University of Stavanger, 4036 Stavanger, Norway
Received September 3, 2010. Revised Manuscript Received November 2, 2010
The effect of the cooling rate and gas composition on the kinetics of hydrate formation and the stochasticnature of nucleation has been examined by forming structure II hydrates from two different syntheticnatural gases: one with two components (SNG2) and the other with seven components (SNG7). Thehydrate equilibrium properties of SNG2 and SNG7were comparable, and all experiments were initiated atthe same temperature and pressure conditions in an autoclave cell. The initial degree of subcooling andother parameters that could affect the kinetics were, thus, approximately the same during all nucleationexperiments. From the experimental results, SNG2 showed an increasing nucleation rate, while SNG7showed a decreasing effect as the cooling rate increases in steps of 2 !C/h. In addition, it is observed that therate of nucleation is dependent upon gas compositions, and different gas compositions respond differentlyon the same cooling rate. In an attempt to understand the experimental results, the classical nucleationtheory of multicomponent systems, the probability distribution function, and the principle of irreversiblethermodynamics have been employed. The observed effects are, thus, related to the dependence of thecritical size upon the temperature and gas composition, chemical oscillations as a result of the change insolubility of the individual gas components, and coupled mass and heat fluxes during cooling. Suchfindings on system responses are of paramount importance for a reliable evaluation of the effect ofadditives on hydrate formation processes.
Introduction
Natural gas hydrates are crystalline solid compounds, con-sisting of a gas molecule (a guest) surrounded by a cage ofwater molecules (a host). They have attracted significant
research since their discovery by Hammershmidt1 that hydra-tes were contributing to blockages in oil and gas transmissionpipelines. Gas hydrates are known to form different crystal
structures, of which structure II (sII) is the commonest. Thisstructure is composed of 16 small (512) cavities and 8 large(51264) cavities. Each cavity is formed from hydrogen-bondedwater molecules. The smaller cavity can accommodate one
guest molecule of suitable size and shape, but the larger cavitycan accommodate two guests of suitable combination in size.At high pressures and lower temperatures, the process of
filling these cages by a guest molecule starts when hydratesbegins to nucleate and grow.
Nucleation is considered as the first step of gas hydrate
crystallization. It is a processwhere small clusters ofwater andgas grow and disperse to achieve a critical size for a continuedgrowth.Understanding the nucleation process is of paramountimportance with regard to hydrate inhibition in pipelines and
hydrate promotion in gas storage. A theoretical understand-ing of one-component hydrate nucleation has been studied.2-5
The driving force for one-component gas hydrates and its
dependence upon the concentration of dissolved gases hasbeendiscussed.6Theeffect of the cooling rateonone-component
nucleation has also been investigated. For example, theeffect of the cooling rate on the hydrate nucleation tempera-ture, the temperature range in which nucleation occurs, hasrecently been reported7 by considering the fraction of samples
nucleated for three different cooling rates. The effect of thecooling rate on the critical undercooling for crystallization hasalso been recently reported8 for single-component crystallites.
Unlike single-component nucleation, notmuch is knownaboutmulticomponentnucleationexperimentallyandhowit is affectedby the cooling rate and composition. Also, during cooling and
just prior to the start of the experiments, the system is subjectedto non-equilibrium conditions that could affect the processbeing studied. Formulticomponent mixtures, where individual
components respond differently to such effects, the interpre-tation of results could lead to erroneous conclusions unless thebasicmechanisms on pure gasmixtures are better understood.For example, comparing basic effects of kinetic hydrate
inhibitors (KHIs) tested under various experimental condi-tions and in different fluid systems may give contradictoryconclusions unless the kinetic response of the uninhibited test
system is known.To the best of our knowledge, no one has reported whether
the same cooling rate has the same effect or not on different
gas mixtures with regard to nucleation. Besides, there havebeen no attempts performed in studying multicomponent*To whom correspondence should be addressed. Telephone: þ47-
51832230. Fax: þ47-51832050. E-mail: [email protected].(1) Hammershmidt, E. G. Ind. Eng. Chem. 1934, 26, 851.(2) Kvamme, B. Proceedings of the 2nd International Conference on
Natural Gas Hydrates; Toulouse, France, June 2-6, 1996; pp 139-146.(3) Kvamme, B. Ann. N. Y. Acad. Sci. 2000, 912, 496–501.(4) Kashchiev, D.; Firoozabadi, A. J. Cryst. Growth 2002, 243, 476–
489.(5) Kvamme, B. Int. J. Offshore Polar Eng. 2002, 12 (4), 256–263.
(6) Kashchiev, D.; Firoozabadi, A. J. Cryst. Growth 2002, 241, 220–230.
(7) Davies, S. R.; Hester, K. C.; Lachance, J. W.; Koh, C. A.; Sloan,E. D. Chem. Eng. Sci. 2009, 64, 370–375.
(8) Kashchiev, D.; Borissova, A.; Hammond, R. B.; Roberts, K. J.J. Cryst. Growth 2010, 312, 698–704.

Paper II 65
43
Energy Fuels 2011, 25, 42–51 : DOI:10.1021/ef1011879 Abay and Svartaas
nucleation experimentally and relating to theoretical deriva-tions. Our aim in this paper is, as a first step toward improved
understanding of the basic processes involved, to examineeffects of the cooling rate and gas composition effects onmulticomponent nucleation kinetics. We employ the classicalnucleation theory of multicomponent systems and the prob-
ability distribution function for the analysis of the experi-mental results. In addition, we have addressed irreversible(non-equilibrium) thermodynamics in an attempt to explain
effects observed in SNG2because systems during the stagnantcooling sequence may be subjected to coupled heat and massfluxes in the system. The following section discusses the
theoretical background of multicomponent nucleation andcoupled heat and mass transfer.
Theoretical Background
Multicomponent Nucleation. For multicomponent nucle-
ation, the general expression for the driving force (per unitcell) in forming a critical hydrate nucleus is given by9
Δg ¼ nw ðvw- vhwÞðP-PeqÞ- kTX
j
vj ln
1-P
k
θkjðT ,P, yÞ
1-P
k
θkjðT ,Peq, yÞ
0
B
@
1
C
A
2
6
4
3
7
5
ð1Þ
where nw is the number of water molecules in a unit cell (136for sII), vw is the molar volume of water molecules insolution, vhw is themolecular volume of water in the hydrate,
P is the pressure, T is the temperature, k is the Boltzmannconstant, vj is the number of type j cavities per water mole-cule, y is the composition in the gas phase, and θkj is the
fractional filling of cavity j by a type kmolecule expressed as
θkj ¼Ckj fgk
1þP
i
Cij fgjð2Þ
where Ckj is the Langmuir constant for species k in cavity
j, fgk is the fugacity of gas component k in the gas phase inequilibrium with the hydrate, and
P
is for all species exceptwater. In eq 1 of the expression for the driving force, it is clear
to see that the driving force depends upon the pressure,temperature, and gas-phase composition. In another recentwork10 on the driving force for nucleation of multicompo-nent gas hydrates, it was also reported that the driving force
depends on hydrate phase composition besides temperature,pressure, and gas-phase composition. In general, there are anumber of theoretical papers11-14 on evaluating the work of
formation (formation energy) of the critical nucleus, the sizeof the nucleus, and the thermodynamics of crystal nucleationin multicomponent systems.
In this work, two different synthetic natural gases, SNG2and SNG7, have been used for the study of the effects ofthe cooling rate and gas composition in multicomponent
kinetics. Table 1 shows the composition of each gas used inmole percentage. Both gases form a sII hydrate. Before sIIhydrate growth, there are two hypotheses for the mechanism
of hydrate nucleation at the molecular level: labile clusterand local structuring.15 Our analysis is based on the clusterapproach, which is considered as an unstable entity that under-goes a continuous change. The dynamics of clusters play a
major role in the kinetics of nucleation.16 From the classicalnucleation theory of multicomponent systems, the dynamicsof a cluster is associated with amonomer that leaves a cluster
and joins an adjacent cluster during an attempt for a criticalsize. This results in a variation in the number of clusters grownper unit time. A conceptual picture is drawn in Figure 1 that
only shows two newly born unstable clusters that undergo acontinuous change and one stable critical nucleus. Duringthe discussion17 on the composition of the critical nucleus in
multicomponent vapor nucleation, it wasmentioned that thecluster of the critical nuclei generally contains a few hundredmolecules. Such a few hundred molecules do not make aspontaneous steady-state distribution. Before a steady-state
regime is attained, the rate of nucleation has a transient regimethat corresponds to the time required to attain a steady-statedistribution of nuclei.18 In fact, nucleation in general is a
complex process especially before reaching a steady-stateregime,19-23 and hence, we focus on the steady-state regime,where a steady-state nucleation occurs. On the basis of the
birth-death equation, which tells us how the concentrationof clusters change with time, the steady-state nucleation ratefor SNG2 could generally be expressed as24
J2 ¼ RNe-Δj$=kT W$ffiffiffiffiffiffiffiffiffiffiffiffiffiffiffiffiffiffi
jdetW$jp ð3Þ
Table 1. Composition of SNGs Used
gas component SNG2 (mol %) SNG7 (mol %)
CH4 methane 92.51 80.40C2H6 ethane 0 10.30C3H8 propane 7.49 5.0iso-C4H10 isobutane 0 1.65n-C4H10 n-butane 0 0.72CO2 carbon dioxide 0 1.82N2 nitrogen 0 0.11
Figure 1. Birth and death of clusters during the formation of acritical nuclei.
(9) Anklam, M. R.; Firoozabadi, A. J. Chem. Phys. 2004, 121 (23),11867–11875.(10) Abbas, I. A.; Mohsen, V. S.; Farshad, V. Iran. J. Chem. Chem.
Eng. 2007, 26 (2), 63–70.(11) Oxtoby, D. W.; Kashchiev, D. J. Chem. Phys. 1994, 100 (10),
7665–7671.(12) Debenedetti, P.G.;Reiss,H. J. Chem.Phys. 1998, 108 (13), 5498–
5505.(13) Laaksonen, A.; McGraw, R.; Vehkamaki, H. J. Chem. Phys.
1999, 111 (5), 2019–2027.(14) Djikaev,Y. S.; Tabazadeh,A.; Reiss,H. J. Chem.Phys. 2003, 118
(14), 6572–6581.
(15) Sloan, E.D.;Koh, C.A.ClathrateHydrates ofNatural Gases, 3rded.; CRC Press/Tayler and Francis Group: Boca Raton, FL, 2008; p 180.
(16) Volmer, M.; Weber, A. Z. Phys. Chem. 1926, 119, 277–301.(17) Wilemski, G. J. Chem. Phys. 1983, 80, 1370–1372.(18) Frade, J. R.; Queiroz, C. M.; Fernandes, M. H. J. Non-Cryst.
Solids 2004, 333, 263–270.(19) Frade, J. R.; Kharton, V. V.; Lopez, D.M.; Nunez, P.; Abrantes,
J. C. C. Thermochim. Acta 2005, 435, 85–91.(20) Kelton,K. F.;Geer,A.L.; Thompson,C.V. J. Chem.Phys. 1983,
79, 6261.(21) Kelton, K. F.; Narayan, K. L.; Levine, L. E.; Cull, T. C.; Ray,
C. S. J. Non-Cryst. Solids 1996, 204, 13–31.(22) Davis, M. J. J. Am. Ceram. Soc. 2001, 84, 492–496.(23) Frade, J. R.; Queiroz, C. M.; Fernandes, M. H. J. Non-Cryst.
Solids 2004, 333, 271–277.(24) Vehkamaki, H. Classical Nucleation Theory in Multicomponent
Systems; Springer: New York, 2006; pp 97-113.

66 Appendix B
44
Energy Fuels 2011, 25, 42–51 : DOI:10.1021/ef1011879 Abay and Svartaas
where R is the average growth rate, N is the normalizationfactor of the cluster size distribution, k is the Boltzmann
constant, T is the temperature, Δj* is the activation energy(free energy barrier) for the formation of the critical sizecluster, and W* is the second derivative of the activationenergy at the critical size. For SNG7, the general expression
for the steady-state nucleation rate could be written as24
J7 ¼jλj
2πkTNe-Δj"=kT 1
ffiffiffiffiffiffiffiffiffiffiffiffiffiffiffiffiffiffiffiffiffiffiffiffiffiffiffiffiffi
!
!
!
!
!
detW"
2πkT
" #
!
!
!
!
!
v
u
u
t
ð4Þ
where λ is an eigenvalue of the product of the growthmatrix.
For the detailed derivation of eqs 3 and 4, the reader isadvised to read the original work24 on multicomponentnucleation kinetics. These equations describe the explicit
temperature dependence of the steady-state rate of nuclea-tion formulticomponent systems. They also relate the rate ofnucleation to the effects of kinetic and thermodynamic
barriers to form the nucleus. An implicit dependence of therate of nucleation upon gas composition is observed fromthese equations through the formation energy. Unfortu-
nately, the formation energy (nucleation work) cannot bemeasured experimentally, but the nucleation rate could bemeasured, in this case, by the help of the data from inductiontime measurements. The rate of nucleation and the nuclea-
tion work are related through a more simplified expression25
J2, 7 ∼ e-Δj
"
2, 7=kTð5Þ
where J2,7 is the rate of nucleation of SNG2 or SNG7 and
Δj2,7* is the corresponding energy barrier. One can, thus,clearly see the dependence of the nucleation rate upon the gascomposition from eq 1, which is the specific expression for a
hydrate. This theoretical concept could be employed forinvestigating the effect of the macroscopic parameters, gascomposition and temperature (cooling rate), on the micro-
scopic phenomenon rate of nucleation, keeping other param-eters, such as the degree of subcooling and stirring rate, thataffect the rate of nucleation the same for both gases.
Although the nucleation step is a microscopic phenome-
non involving many molecules and too difficult to observeexperimentally, the induction time measurement could beemployed to bridge nucleation theory and experimental in-
vestigation.26 This experimentally accessible induction timeis the measure of the ability of a system to remain in the stateofmetastable equilibriumand contains valuable information
about the kinetics of nucleation.27 Because nucleation re-quires transport of gas molecules, coupled heat and masstransfer may affect the process.
Coupled Heat and Mass Transfer. Mass transport by
diffusion in a n-component mixture is described by n(n - 1)/2diffusion coefficients. Therefore, the description of coupledheatandmass transfer inmulticomponent systemsmaybecome
complex. For simplicity, we address the SNG2 system andregard themain, reference frame gas (methane) as the solventand the additional gas (propane) as the solute. Then, mass
transport can be described through transport of “solute” gasthrough “solvent” gas by one single mass transfer (diffusion)
coefficient. The entropy production, σ, in the SNG2 system
subjected to cooling, pointing in the x direction, can beexpressed by28
σ ¼ Jq∂
∂x
1
T
" #
þ J1 -
1
T
∂μ1,T
∂x
!
ð6Þ
where Jq is the heat flux, J1 is the mass flux of component 1(the solute), and μ1,T = μ1
0þ RT ln(c1y1) is the chemical
potential with μ10 as the reference state, c1 as the concentra-
tion, and y1 as the activity coefficient of component 1.Heat istransported in the system by convection (energy transfer
between neighboring molecules) and conduction (i.e., “hot”gas molecules being transported toward the cold surface),and eq 6 tells us that there is a coupled heat and masstransport related to the entropy production in the system.
In our laboratory, we have cylindrical cells (see Figure 2)where the outer part is colder than the inner part because theouter part of the cell has direct contact with the cooling cap.
Thus, if we assume transport of heat and mass in the radialdirection only, then the entropy production can be described by
σ ¼ Jq∂
∂r
1
T
" #
þ J1 -
1
T
∂μ1,T
∂r
!
ð7Þ
The radial flux-force relations for measurable heat flux
and molar flux are
Jq ¼ lqq∂
∂r
1
T
" #
þ lqu -
1
T
∂μ1,T
∂r
!
ð8Þ
J1 ¼ luq∂
∂r
1
T
" #
þ luu -
1
T
∂μ1,T
∂r
!
ð9Þ
where (∂/∂r)(1/T) and (-1/T)(∂μ1,T/∂r) describe the forces.The absolute value of these forces will increase by increas-ing cooling gradients. According to Onsager’s reciprocityrelations29,30 the coefficients (conductivities) lqu= luq. If the
Figure 2.Experimental setup for testing the effect of the cooling rateand gas composition on multicomponent nucleation.
(25) Nishioka, K.; Kusaka, I. J. Chem. Phys. 1992, 96 (7), 5370–5376.(26) Nguyen, T. N. P.; Kim, K.-J. Int. J. Pharm. 2008, 364, 1–8.(27) Kashchiev, D.; Firoozabadi, A. J. Cryst. Growth 2003, 250, 499–
515.
(28) Kjelstrup, S.; Bedeaux, D.; Johannesen, E. Elements of Irrever-sible Thermodynamics for Engineers; Tapir Academic Press: Trondheim,Norway, 2006; p 123.
(29) Onsager, L. Phys. Rev. 1931, 37, 405–426.
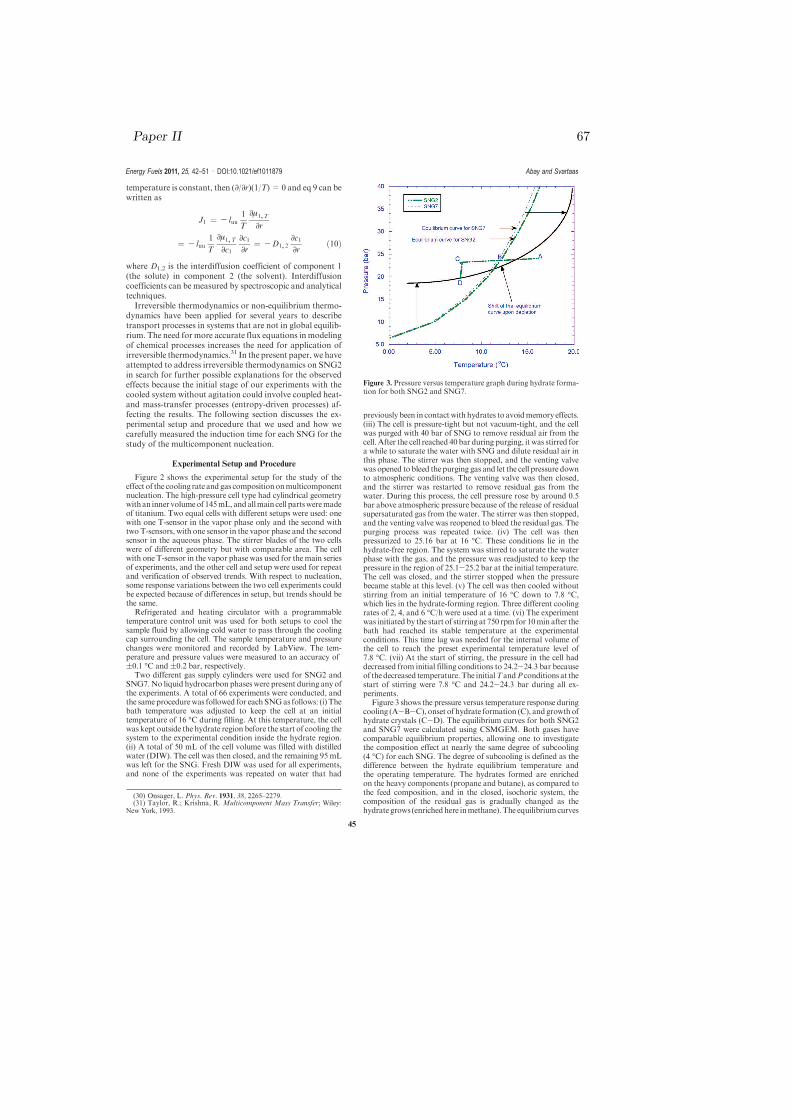
Paper II 67
45
Energy Fuels 2011, 25, 42–51 : DOI:10.1021/ef1011879 Abay and Svartaas
temperature is constant, then (∂/∂r)(1/T)= 0 and eq 9 can bewritten as
J1 ¼ - luu1
T
∂μ1,T
∂r
¼ - luu1
T
∂μ1,T
∂c1
∂c1
∂r¼ -D1, 2
∂c1
∂rð10Þ
where D1,2 is the interdiffusion coefficient of component 1
(the solute) in component 2 (the solvent). Interdiffusioncoefficients can be measured by spectroscopic and analyticaltechniques.
Irreversible thermodynamics or non-equilibrium thermo-dynamics have been applied for several years to describetransport processes in systems that are not in global equilib-
rium. The need for more accurate flux equations inmodelingof chemical processes increases the need for application ofirreversible thermodynamics.31 In the present paper, we haveattempted to address irreversible thermodynamics on SNG2
in search for further possible explanations for the observedeffects because the initial stage of our experiments with thecooled system without agitation could involve coupled heat-
and mass-transfer processes (entropy-driven processes) af-fecting the results. The following section discusses the ex-perimental setup and procedure that we used and how we
carefully measured the induction time for each SNG for thestudy of the multicomponent nucleation.
Experimental Setup and Procedure
Figure 2 shows the experimental setup for the study of theeffect of the cooling rate and gas compositiononmulticomponentnucleation. The high-pressure cell type had cylindrical geometrywithan inner volumeof 145mL, andallmain cell partsweremadeof titanium. Two equal cells with different setups were used: onewith one T-sensor in the vapor phase only and the second withtwo T-sensors, with one sensor in the vapor phase and the secondsensor in the aqueous phase. The stirrer blades of the two cellswere of different geometry but with comparable area. The cellwith one T-sensor in the vapor phase was used for themain seriesof experiments, and the other cell and setup were used for repeatand verification of observed trends. With respect to nucleation,some response variations between the two cell experiments couldbe expected because of differences in setup, but trends should bethe same.
Refrigerated and heating circulator with a programmabletemperature control unit was used for both setups to cool thesample fluid by allowing cold water to pass through the coolingcap surrounding the cell. The sample temperature and pressurechanges were monitored and recorded by LabView. The tem-perature and pressure values were measured to an accuracy of(0.1 �C and (0.2 bar, respectively.
Two different gas supply cylinders were used for SNG2 andSNG7.No liquid hydrocarbon phases were present during any ofthe experiments. A total of 66 experiments were conducted, andthe sameprocedurewas followed for each SNGas follows: (i) Thebath temperature was adjusted to keep the cell at an initialtemperature of 16 �C during filling. At this temperature, the cellwas kept outside the hydrate region before the start of cooling thesystem to the experimental condition inside the hydrate region.(ii) A total of 50 mL of the cell volume was filled with distilledwater (DIW). The cell was then closed, and the remaining 95 mLwas left for the SNG. Fresh DIW was used for all experiments,and none of the experiments was repeated on water that had
previously been in contact with hydrates to avoidmemory effects.(iii) The cell is pressure-tight but not vacuum-tight, and the cellwas purged with 40 bar of SNG to remove residual air from thecell. After the cell reached 40 bar during purging, it was stirred fora while to saturate the water with SNG and dilute residual air inthis phase. The stirrer was then stopped, and the venting valvewas opened tobleed the purging gas and let the cell pressure downto atmospheric conditions. The venting valve was then closed,and the stirrer was restarted to remove residual gas from thewater. During this process, the cell pressure rose by around 0.5bar above atmospheric pressure because of the release of residualsupersaturated gas from the water. The stirrer was then stopped,and the venting valve was reopened to bleed the residual gas. Thepurging process was repeated twice. (iv) The cell was thenpressurized to 25.16 bar at 16 �C. These conditions lie in thehydrate-free region. The system was stirred to saturate the waterphase with the gas, and the pressure was readjusted to keep thepressure in the region of 25.1-25.2 bar at the initial temperature.The cell was closed, and the stirrer stopped when the pressurebecame stable at this level. (v) The cell was then cooled withoutstirring from an initial temperature of 16 �C down to 7.8 �C,which lies in the hydrate-forming region. Three different coolingrates of 2, 4, and 6 �C/h were used at a time. (vi) The experimentwas initiated by the start of stirring at 750 rpm for 10min after thebath had reached its stable temperature at the experimentalconditions. This time lag was needed for the internal volume ofthe cell to reach the preset experimental temperature level of7.8 �C. (vii) At the start of stirring, the pressure in the cell haddecreased from initial filling conditions to 24.2-24.3 bar becauseof thedecreased temperature. The initialTandP conditions at thestart of stirring were 7.8 �C and 24.2-24.3 bar during all ex-periments.
Figure 3 shows the pressure versus temperature response duringcooling (A-B-C), onset of hydrate formation (C), andgrowthofhydrate crystals (C-D). The equilibrium curves for both SNG2and SNG7 were calculated using CSMGEM. Both gases havecomparable equilibrium properties, allowing one to investigatethe composition effect at nearly the same degree of subcooling(4 �C) for each SNG. The degree of subcooling is defined as thedifference between the hydrate equilibrium temperature andthe operating temperature. The hydrates formed are enrichedon the heavy components (propane and butane), as compared tothe feed composition, and in the closed, isochoric system, thecomposition of the residual gas is gradually changed as thehydrate grows (enrichedhere inmethane). The equilibriumcurves
Figure 3. Pressure versus temperature graph during hydrate forma-tion for both SNG2 and SNG7.
(30) Onsager, L. Phys. Rev. 1931, 38, 2265–2279.(31) Taylor, R.; Krishna, R. Multicomponent Mass Transfer; Wiley:
New York, 1993.

68 Appendix B
46
Energy Fuels 2011, 25, 42–51 : DOI:10.1021/ef1011879 Abay and Svartaas
for both SNG2 and SNG7 stay in their positions only before theonset, from point A to point C. At point B, the system tempera-ture crosses the equilibrium curve and enters into the labile regionwhere clusteringand rearranging ofwatermolecules begins. PointC is the onset point for hydrate formation, and thereafter, thehydrates start growing fast until the growth stops at point D.During this growth period, the composition of each SNG isdepleted on the heavier components because of the “incomplete”filling of the smaller 512 cavities (∼65% C1) and the nearlycomplete filling of the larger 51264 cavities (∼96.5% C3 forSNG2 or ∼96% C2 þ C3 þ C4 for SNG7) of the sII hydrate inaccordance with eq 2 and the CSMGEM hydrate program. Thisdepletion results in a shift of the equilibrium curve from its initialposition toward higher pressures, as illustrated in Figure 3. Ouranalysis of the effect of the composition and cooling rate onmulticomponent nucleation is mainly in the region betweenpoints B and C, where any effect on composition because of thegrowth process was assumed negligible.
Figure 4 shows the gas consumption and temperature versustime from the start of the experiment to the end. At the onset ofhydrate formation at time zero, the temperature of the systemincreases because hydrate formation is an exothermic reaction.The onset time is determined by the increase in gas consumptionaccompanied by the temperature pulse, as shown in the inset ofthe figure. The time taken by the system from the start of theexperiment at time zero to the onset of hydrate formation isdefined as the induction time. This induction time is the keyparameter that we carefully measured for the investigation of theeffect of the cooling rate and gas composition during multi-component hydrate nucleation.
The induction time and formation rate are affected by thedegree of subcooling in uninhibited systems.32 In fact, the degreeof subcooling cannot be considered as the driving force for theinvestigation of the effect of the composition on the nucleationrate in such systems because of the composition differencebetween each SNG. The induction time could also be affectedby the thermal history of water33 and the stirring rate.34 BothSNGs stayed at the same distance and time from the equilibriumcurve as described in the procedure.We also kept the same degreeof agitation for both SNGs. Thus, for the analysis of the effect ofthe cooling rate and gas composition on multicomponent nucle-ation, we used the same degree of subcooling, thermal history,
and degree of agitation for both SNG2 and SNG7, enabling us toexamine the effect as accurately as possible.
Results and Discussion
Nucleation Rate and Induction Time. Nucleation is a sto-chastic process35 requiringmany experiments to be performed
ona single sample. In fact, attempts36have beenmade recentlyto limit the stochastic nature of gas hydrate crystallizationand increase data repeatability using the persistence of pre-
cursory hydrate structures that has previously experiencedhydrate formation. However, upon “fresh water” experiments,nucleation of gas hydrate crystallization is a stochastic processin nature that could only be explained in terms of the prob-
ability distribution function. The nucleation probabilitydistribution function, P2,7(t), of SNG2 and SNG7 is givenby37-40
P2, 7ðtÞ ¼ 1- e- J2, 7ðt- τ2, 7Þ ð11Þ
where J2,7 is the rate of nucleation of SNG2or SNG7 and τ2,7
is the corresponding lag time, which is the measure of thetime necessary for the nucleation rate to attain a steady-state
value. Figures 5 and 6 show the nucleation probabilitiesversus induction time for three different cooling rates of 2, 4,and 6 �C/h for both SNG2andSNG7, respectively. Equation
11 has been used to fit the major parameters of the kinetics,and the results are tabulated in Table 2 with 95% confidencebounds.
Effect of theCoolingRate andGasComposition.Tabulatedresults of Table 2 have been analyzed to examine the effect ofthe cooling rate and gas composition on the rate of nucle-
ation and induction time for each SNG. Each data set con-tained a total number of seven experiments for the main setand six experiments for the repeat. The repeated values forthe slow and fast cooling rates are values using a different
experimental setup. For SNG2, increasing the cooling ratefrom slow (2 �C/h) to fast (6 �C/h) caused the rate of nucle-ation to increase from 7.2 $ 10-2 to 2.8 min-1, respectively,
for the first set of experiments and from 4.4 $ 10-2 to 2.6min-1, respectively, for the repeat. The range of the S-shapedprobability of nucleation is reduced and shifted from right
(higher induction times) to left (lower induction times), asshown in Figure 5 for the main set of experiments. Thetabulated values of the induction time for SNG2 indicate
that nucleation could have been initiated slightly before orclose to the start of stirring. During cooling at 2 �C/h, the Pand T conditions of the system cross the hydrate equilibriumcurve approximately 2 h prior to the start of stirring; there-
fore, induction prior to the start of stirring and in the vicinityof the start point is assumed probable. For the faster coolingrates (4 and 6 �C/h), nucleation started at the start of stirring
or within the first minute after the start. The results give astrong indication that a 2 �C/h change in the cooling rate hasa significant effect on the rate of nucleation for SNG2 and
the range of the probability distribution function.
Figure 4. Gas consumption and temperature versus time duringmulticomponent hydrate formation.
(32) Hemmingsen, P. V.; Li, X.; Kinnari, K. Proceedings of the 6thInternational Conference on Gas Hydrates; Vancouver, British Columbia,Canada, July 6-10, 2008.(33) Vysniauskas, A.; Bishnoi, P. R. Chem. Eng. Sci. 1983, 38, 1061.(34) Skovborg, P.; Ng, H. J.; Rasmussen, P. Chem. Eng. Sci. 1993,
48 (3), 445.
(35) Wilson, P.W.; Lester,D.;Haymet, A.D. J.Chem. Eng. Sci. 2005,60, 2937–2941.
(36) Duchateau, C.; Peytavy, J. L.; Glenat, P.; Pou, T. E.; Hidalgo,M.; Dicharry, C. Energy Fuels 2009, 23, 962–966.
(37) Toschev, S.;Milchev, A.; Stoyanov, S. J. Cryst. Growth 1972, 13/14, 123–127.
(38) Tsuchiyama, A. Am. Mineral. 1983, 68, 687–698.(39) Takeya, S.; Hori, A.; Hondoh, T.; Uchida, T. J. Phys. Chem. B
2000, 104 (17), 4164–4168.(40) Abay, H. K.; Svartaas, T. M. Energy Fuels 2010, 24, 752–757.

Paper II 69
47
Energy Fuels 2011, 25, 42–51 : DOI:10.1021/ef1011879 Abay and Svartaas
Contrary to SNG2, the nucleation rate of SNG7 is gen-
erally reduced as the cooling rate increases from slow to fast,as shown in Table 2. The induction time showed a differenttrend, as compared to the SNG2 mixture; i.e., as the coolingrate decreases, the SNG2 nucleates more easily but SNG7
oscillates, indicating that the system has difficulties in attaining
a constant rate of nucleation. Figure 7 shows the comparison
of the stochastic nature of nucleation for SNG2 and SNG7when the cooling rate is changed in steps of 2 �C/h from 2 to6 �C/h during the main set of experiments. For the slowcooling rate, both gases have comparable probability dis-
tribution, which could be an indication that, when both of
Figure 5. Nucleation probabilities versus induction time for SNG2.
Figure 6. Nucleation probabilities versus induction time for SNG7.
Table 2. Estimated Nucleation Rate and Induction Time for Multicomponent Hydrate Formation
cooling rate (�C/h)total number of
experiments performed J2 (min-1) τ2 (min) J7 (min-1) τ7 (min)percent difference in thenucleation rate (%)
2 14 7.2 10-2 -3.6 4.5 10-2 1.0 37.54 14 6.3 10-1 0.1 2.3 10-2 65.7 96.36 14 2.8 10-0 0.2 4.5 10-3 -40.1 99.82a 12 4.4 10-2 -12.6 2.6 10-2 -5.1 416a 12 2.6 10-0 0.8 4.9 10-3 -1.4 99.1
aRepeat in the other, similar cell, with two T-sensors and a different dimension of stirrer blade.

70 Appendix B
48
Energy Fuels 2011, 25, 42–51 : DOI:10.1021/ef1011879 Abay and Svartaas
these two sII forming systems are given enough time, thestochastic nature of nucleation is comparable, irrespective of
the composition difference. Both gas mixtures containedsimilar amounts of sII “nucleators” (7.49 mol % C3 forSNG2 and 7.37 mol % C3 þ C4 mixture for SNG7; see
Table 1), which could increase the probability of a similarresponse at low cooling rates. However, for a fast coolingrate, both systems showed opposing behavior: SNG2 has aprobability distribution function shifted toward a shorter
induction time, whereas SNG7 has a probability distributionfunction shifted toward a longer induction time, implyingthat increasing the number of components in a gas does not
reduce the induction time. The observed effect of the reducednucleation rate by the increased cooling rate for SNG2 couldprobably be explained by coupled heat and mass fluxes
(thermodiffusion) as described by irreversible thermody-namics. In our system, a temperature gradient, ΔT = Tc -
Tw, pointing from the center of the cell (Tc) toward the cell
wall (Tw) was setup during cooling. The temperature gradi-ent increases by increasing the cooling rate. During 2, 4, and6 �C/h cooling sequences, the temperature measured in thegas phase close to the cell wall remained stable at a level of
0.17, 0.39, and 0.61 �C above the temperature outside thecell, respectively. For SNG2 stationary systems subjected toa temperature gradient, principles of irreversible thermody-
namics suggest that the heavier component will move towardthe colder surface to setup a concentration gradient as heatand mass fluxes are coupled through entropy production
(change) in the system, as shown in eq 7. Coupled heat andmass fluxes in the SNG2 system are only dependent upononesingle interdiffusion coefficient (that of propane inmethane),and the apparent correlations between observed effects and
mass and heat fluxes can be proposed. If ΔT is sufficientlyhigh, the propane concentration may be sufficiently elevatedat the cell wall, thereby affecting the process in the study.
Then, if the heterogeneous nucleation in the cell preferen-tially occurs at the wall-water vapor interface, then anelevated concentration of propane at the cell wall could
explain the increased nucleation rate at the highest coolingrate. The SNG7 system is more complex because 21 inter-diffusion coefficients are needed to describe mass fluxes in
the system. In addition, SNG7 contains CO2, which is moresoluble in water than the hydrocarbon (HC) components.
It is also possible that the cooling rate as well as theindividual concentration of components at the site of nucle-ation affect the critical size during nucleation. In a study41 of
heating rate effects on transient nucleation problems, thesurvival size dependence upon the heating rate has beendiscussed. In the discussion, it is pointed out that a criticalsize depends upon the temperature. The temperature in our
case was continuously being changed during cooling thatcould affect the critical size and, hence, the nucleationprocess. However, this effect cannot explain the opposite
behavior of SNG2 and SNG7 with respect to the nucleationrate. If CO2, which is easily soluble in water or other sI“preferring” HC components in the mixture, makes the
system flicker between sI and sII nucleation during coolingwhen the system is far from the equilibrium saturation level,thismay give a possible explanation of the observed effect for
the cooling rate on SNG7. We have to admit that the SNG7system is complex and that several simpler mixtures betweenmethane and the other components must probably be in-vestigated independently before a reliable explanation of the
effect of this mixture can be stated. Ternary mixtures willinvolve three diffusion coefficients, and quaternary mixtureswill involve six coefficients. Thus, gas mixtures containing
more than three different gasesmay probably be too complexif basic mechanisms are going to be revealed by simpleexperimental investigations.
The rate of nucleation, J2,7, versus cooling rate is plotted inFigure 8 for both SNG2 and SNG7. The circle and squaresymbols represent estimated values of the rate of nucleationfor themain set of the experiment. The triangle and diamond
symbols represent values of the repeat experiment for theslow and fast cooling rates. All estimated values for allexperiments show that the rate of nucleation for SNG7 is
lower for all cooling rates used, as compared to results forSNG2. The percentage difference in nucleation rates ofSNG2 versus SNG7 at the various cooling rates is listed in
Table 2. At the slow cooling rate, the percentage difference is
Figure 7. Comparison of the stochastic nature of nucleation for SNG2 (open symbols, dashed lines) and SNG7 (filled symbols, solid lines).
(41) Shneidman, V. A. J. Chem. Phys. 2007, 127, 041102-1–041102-4.
Paper II 71
49
Energy Fuels 2011, 25, 42–51 : DOI:10.1021/ef1011879 Abay and Svartaas
comparable, but at the fast cooling rate, the difference becomespronounced.
According to the classical nucleation theory of multi-
component systems, the effects of the rate of nucleation ofSNG2 and SNG7 could be described by eq 5. From theequation, we see that the rate of nucleation is dependent
upon the activation energy for the critical size nuclei in bothcases. The activation energy, in turn, is dependent uponmany parameters, of which the composition in the aqueousphase is the most influential according to the specific expres-
sion (eq 1) of the activation energy for a multicomponentcritical hydrate nucleus. During cooling, the system is sta-tionary without stirring and gas components dissolve in the
aqueous phase by diffusion through the gas-water interface.During this period, there is also a temperature gradientbetween the “high heat capacity” water phase and the “lower
heat capacity” vapor phase that could affect the exchange ofcomponents between these phases during this “pre-period”of the experiment that makes the system evenmore complex.
The solubility of gas components increases as the tempera-ture decreases, and the abilities of the various gas types toenter the water phase are dependent upon various parameters,such as solubility, diffusivity, concentration (i.e., partial
pressure/fugacity), etc. Thus, fluctuations in the concentra-tion may be expected during the non-stirred cooling se-quence. In addition, CO2 is more soluble in water than the
HC components andN2, so that CO2may play an importantrole in the nucleation process prior to obtaining equilibriumconcentrations (supersaturation) of the various gas compo-
nents in the aqueous phase after the start of stirring.For SNG7, the relatively high solubility of CO2 in water
may be of more importance for effects on nucleation thancoupled mass and heat fluxes toward the cold wall surface.
Possible additional effects of coupled heat and mass fluxestoward the cold cell wall during cooling are difficult to evalu-ate for the more complex SNG7 mixture because 21 inter-
diffusion coefficients are required. In this mixture, ethane,propane, and butane have the highest molecular weights andheat capacities andwould probably all be themajor components
if coupled heat and mass flux processes toward the coldsurface are important factors for the effect on nucleation.Ethane, having a heat capacity comparable to propane and
the lowest molecular weight and, thus, the highest diffusivityof these three gas components and also because of itsconcentration level in SNG7, may balance mass fluxes and
any concentration buildup of the sII, forming componentspropane and butane at the cell wall. All of these factors maygive some additional contribution to increased activationenergy for sII hydrate nucleation in the SNG7 system
together with the far more water-soluble CO2 gas. On theother hand, an increased concentration of propane at the cellwall for the SNG2 system through coupled heat and mass
fluxes may give reduced activation energy through the metalsurface, acting as a kind of catalyst for the process. Otherparameters, such as the temperature, pressure, stirring rate
(after the start of experiments), apparatus, and degree ofsubcooling used, could be considered the same for bothmulticomponent gases, contributing no or negligible effect
on the rate of nucleation.According to Makogon,42 methane hydrate nucleation
preferentially took place at the gas-water interface awayfrom the wall because of capillary forces from the meniscus
existing at the gas-water-cell wall interface. However, atcooling rates higher than 1-3 K/h, he observed an increasedtendency of nucleation at the gas-water-metal boundary
(i.e., at the cell wall). He assumed this because of a lowertemperature at themeniscus than at the interface closer to thecell center. Such an effect could not help explain the observed
difference between our SNG2 and SNG7 mixtures, buttemperature effects and an increased propane concentrationat the gas-water-cell wall (meniscus) interface may both befactors responsible for the increased nucleation rate at a high
cooling rate during our SNG2 nucleation experiments. An-other factor could be the extramolecules present in SNG7. Incomparison to SNG2, SNG7 has extra molecules (ethane,
Figure 8. Rate of nucleation versus cooling rate for SNG2 and SNG7.
(42) Makogon, Y. F.Hydrates of Hydrocarbons; PennWell PublishingCompany: Tulsa, OK, 1997; pp 65-70.

72 Appendix B
50
Energy Fuels 2011, 25, 42–51 : DOI:10.1021/ef1011879 Abay and Svartaas
isobutane, n-butane, and carbon dioxide), which are compet-itors for the larger 51264 cavity during the formation of sIIhydrates. However, the competition for this cavity is affected
by the solubility of each gas, which, in turn, is affected by thecooling rate and the changing temperature that alters thesolubility of every gas molecule during the course of nucle-
ation upon cooling.Table 3 shows the molar composition of phases present
after nucleation, which is calculated using CSMGEM. Three
phases (aqueous, vapor, and hydrate) are available in thesystem. A total of 87% of the sII hydrate is composed ofwater in both SNG2 and SNG7. The molar composition of
the vapor phase could be used to indirectly estimate compo-nents that are involved during the process of sII formation.The components in the aqueous and hydrate phases couldinform which molecules are key factors for the process. As
shown in the table, methane and propane are the keyelements in the structure formation for both SNG2 andSNG7. In SNG7, almost all components contributed for
the formation of sII hydrate, except nitrogen. Nitrogen is asimple sII hydrate former that can stabilize both the small 512
and the large 51264 cavities of the sII structure. Propane and
isobutane are sII hydrate formers, stabilizing only the larger51264 cavity. For SNG7, Table 3 shows that the gas composi-tion in the aqueous phase is dominated by methane and CO2
despite a relatively low CO2 concentration in the vapor
phase, as compared to methane, ethane, and propane. CO2
is primarily a sI hydrate former, and the high concentrationof CO2 in the water phase may affect the activation energy
for the formation of the given sII hydrate, although CO2 fitsinto the sII cavities and gives contribution to its stability.Such factors may delay the nucleation rate of SNG7, as
compared to SNG2, which has only two gases that could fitinto two different cavities without any competition.
Natural gases actively dissolve in water even at low
pressures. Generally, the solubility of natural gases decreaseswith an increasing molecular weight of hydrocarbons, andthe presence of inorganic gases, such as carbon dioxide andnitrogen, could affect the solubility of the natural gas in
water.42 The presence of the acid gas CO2 in SNG7 increasesthe solubility of the hydrocarbon gases in water, whereas thepresence of the other inorganic gas N2 decreases the gas
solubility in water. However, the amount of N2 is low andcould be assumed negligible. Besides, upon cooling to attainthe desired temperature for the operating condition using the
three different cooling rates, the system temperature changeswith time. The system pressure also changes in accordancewith the real gas equation. The change in the temperatureand pressure of the system induces a change in the solubility
of the components in both SNG2 and SNG7. The mainreason is that the solubility of gas in water depends upon the
temperature, the partial pressure of the gas over the liquidwater, the nature of the solvent (in this work, DIW), and thenature of the gas from Henry’s solubility law. The hydrate
formation process could change the solubility of the organicgases andmay showdivergence from the normalHenry’s lawof solubility.43 Inorganic gases may also change solubility.
For example, the solubility of CO2 increases with a decreas-ing temperature in the absence of gas hydrate, but this trendbecomes reversed in the presence of gas hydrate; i.e., the
solubility of CO2 decreases with a decreasing temperature inthe hydrate formation region.44 The solubility change inSNG7 is assumed more complex than the process for
SNG2 because of the extra molecules that are subjected tochange their solubility of the individual gas componentscontinuously upon cooling. In addition, the relatively highconcentration of CO2 in the water phase, as compared to the
other gas components, may affect sII nucleation, as men-tioned above.
The chemical potential of each molecule in the cluster will
also affect the solute concentration at which the n-sizedcluster can coexist with the solution, cluster solubility.45
All of these conditions make SNG7 difficult to equilibrate
the system easily, as compared to SNG2, where only twohydrocarbon molecules are present. Because hydrate forma-tion in the bulk water is like “vacuuming” dissolved gas fromthe water phase to the region of the growing cluster in the
water phase, solubilities of SNG2 and SNG7 play the majorrole for the rate of nucleation. Besides, the hydrate nucle-ation rate in the water phase is determinedmainly by the flux
of dissolved gas to the surface of a growing cluster in thewater phase. These dissolved gases may show an oscillatingreaction during nucleation. Chemical oscillations involving
nucleation and growth of bubbles from a solution in othersystems were reported,46 and their mechanisms were dis-cussed. Chemical oscillations because of the solubility of
components in SNG7 could possibly result in a reducednucleation rate, as compared to SNG2.
Knowing the effect of the gas component on the rate ofnucleation without any additive is of paramount importance
in laying the foundation for testing the effect of additives onthe rate of nucleation. The effect of the cooling may bedifferent in a continuously stirred system during cooling;
therefore, the choice of the test method and the effect of thetestmethod are also important for the evaluation of the effectof additives. One has to take into consideration the effect of
Table 3. Molar Composition of Phases Present after Nucleation
SNG2 SNG7
component aqueous vapor sII hydrate aqueous vapor sII hydrate
methane 0.000653 0.923944 0.0810 0.000585 0.808215 0.078435ethane 0 0 0 0.000087 0.103250 0.005838propane 0.000064 0.075369 0.0494 0.000043 0.050140 0.030863isobutane 0 0 0 0.000002 0.007535 0.010852n-butane 0 0 0 0.000011 0.016537 0.002240carbon dioxide 0 0 0 0.000224 0.012604 0.001096nitrogen 0 0 0 0 0.001075 0.000025water 0.999283 0.000687 0.8696 0.999048 0.000645 0.870653phase fraction 0.963666 0.036334 0 0.963133 0.036867 0
(43) Song, K. Y.; Feneyrou, G.; Fleyfel, F.; Martin, R.; Lievois, J.;Kobayashi, R. Fluid Phase Equilib. 1997, 128, 249–260.
(44) Servio, P.; Englezos, P. Fluid Phase Equilib. 2001, 190, 127–134.(45) Kashchiev,D.Nucleation:Basic TheorywithApplications; Butter-
worth-Heinemann: Oxford, U.K., 2000; p 77.(46) Noyes, R. M. J. Phys. Chem. 1990, 94, 4404–4412.

Paper II 73
51
Energy Fuels 2011, 25, 42–51 : DOI:10.1021/ef1011879 Abay and Svartaas
the gas composition as well as the test method before testingthe effect of additives, such as KHIs, on different multi-
component gas hydrate nucleations. In a non-stirred systemduring cooling, the effect of the same additive on nucleationof two different multicomponent gas mixtures could bedifferent because the component itself plays its own role
during the nucleation process. Besides cooling, the presenceof an additive could also change the solubility of gasspecies,47 which, in turn, may affect the rate of nucleation
in the region of the growing cluster, leading to even morecomplex processes that are challenging to describe.
Conclusion
Twodifferent gasmixtures, SNG2 and SNG7, have been used
in studying the effect of the gas composition and cooling rate onthe kinetics of sII hydrate formation and the stochastic nature ofnucleation. The systems were cooled without stirring at three
different cooling rates of 2, 4, and 6 �C/h, keeping other param-eters that could affect the kinetics the same for both SNG2 and
SNG7. The experimental results showed that the rate of nucle-ation is dependent upon gas composition and different gas com-
positions respond differently on the same cooling rate. For theslower cooling rate of 2 �C/h, the rates of nucleation in bothsystems were of comparable magnitude at the selected P and T
conditions. However, for the faster cooling rate of 6 �C/h, SNG2
gave an increased nucleation rate by a factor of 38.9, while thenucleation rate was reduced by a factor of 10 for SNG7.
The classical theory of nucleation in multicomponent sys-
tems, the probability distribution function, and the principleof irreversible thermodynamics have been employed in anattempt to understand the experimental results. The depen-
dence of the critical size upon the temperature and gascomposition, chemical oscillations because of the solubilitychange of individual gas components, and coupled mass and
heat fluxes during cooling were the possible explanations forthe observed effects. Such information on system responses isof paramount importance for reliable evaluation of effects oflow-dosage hydrate inhibitors, such as KHIs.
Acknowledgment. The authors thank NFR for the financialsupport of this work.
(47) Ma,Q. L.; Chen,G. J.;Guo, T.M.Fluid PhaseEquilib. 2003, 205,291–302.

74 Appendix B
Appendix C
Paper III
Effect of Gas Composition on sII Hydrate GrowthKinetics
By:
Hailu K. Abay, Thor M. Svartaas and Ke Wei.
Printed in:
Journal of Energy & Fuels, 25, 1335-1341, (2011).
The paper is reprinted with permission from the American Chemical Society. Copyright
c© 2011.
75


Paper III 77
Published: March 10, 2011
r 2011 American Chemical Society 1335 dx.doi.org/10.1021/ef101698g | Energy Fuels 2011, 25, 1335–1341
ARTICLE
pubs.acs.org/EF
Effect of Gas Composition on sII Hydrate Growth Kinetics
Hailu K. Abay,* Thor M. Svartaas, and Wei Ke
Department of Petroleum Engineering, Faculty of Science and Technology, University of Stavanger, 4036 Stavanger, Norway
ABSTRACT: Kinetics of hydrate formation is of paramount importance for hydrate prevention in pipelines and gas storage in ahydrate state. The effect of gas composition on the kinetics of structure II (sII) hydrate growth has been examined by using twodifferent synthetic natural gases, one with two components (SNG2) and the other with seven components (SNG7). The hydrateequilibrium properties of SNG2 and SNG7 were comparable and the initial degree of subcooling was thus approximately the sameduring all growth experiments. The same PT conditions and stirring rate were also set for both SNGs enabling us to examinethe effect of gas composition on the growth behavior of the same crystal structure. The amount of gas consumed and the structure ofthe growth curves have been investigated to understand the effect of gas composition on the kinetics of sII hydrate formation. Inaddition, several chemicals (MeOH, PVP, PVCap) have been tested for their effects on the amount of hydrate formation andstructure of the growth curves. The results showed that the amount of sII hydrate formed from SNG7 was doubled as compared toSNG2 with and without the additives. This could be explained by the higher amount of large cavity preferring gas components inSNG7 as compared to SNG2. On the other hand, the growth rate of sII hydrate made from SNG7 first increased toward a maximumvalue after hydrate onset, and then decreased toward zero at the end of experiment. This growth behavior was not observed for sIIhydrate structure produced from SNG2. The SNG2 growth rate showed a maximum at onset and then decreased toward zeroeventually. The addition of the chemicals did not change the characteristic growth behavior produced by the individual gas mixtures.The chemicals had an effect in shifting the initial growth rates either up or down based on concentration and type of the chemicalsused while the structure of growth rate versus time was kept the same. This study confirmed that gas composition alone is animportant parameter for sII hydrate growth kinetics, and the same hydrate structure produced from different gas compositions doesnot necessarily show the same growth behavior.
’ INTRODUCTION
Gas hydrates are nonstoichiometric crystalline compoundsthat are composed of water molecules as hosts with encaged gasmolecules as guests. The process of encaging a guest into a hoststarts under suitable low temperature and high pressure condi-tions. Such process of hydrate formation has two major stages,nucleation and growth, that has drawn considerable attention inthe petroleum industry since the discovery1 that gas hydratesplug pipelines and cause costly operations. On the other hand,studying gas hydrate nucleation and growth is of great impor-tance in relation to various aspects of hydrate production such asgas storage and transportation. Thus, knowledge of the dynamicsof gas hydrate formation could be important in determining theparameters for production of gas hydrates and in understandingplug conditions in pipelines.2 Despite many attempts to under-stand nucleation and growth kinetics, still little is known aboutthe process as compared to hydrate thermodynamics becausetime-dependent processes of hydrate nucleation and growth arechallenging with regard to measurement and modeling.3
In studying the effect of gas composition on the kinetics ofhydrate growth, SNG2 and SNG7 multicomponent gases wereselected. Both gases form sII hydrates which is the most commonstructure formed in oil and gas pipelines. A sII unit cell consists ofsixteen small (512) cages and eight large (51264) cages. The cagesare formed from hydrogen-bonded water molecules in which onesingle guest molecule is located at or near the center of the host.The smaller cage accommodates only the smaller guest moleculesuch as, e.g., methane and nitrogen. The larger cage accommodates
all gas components in the mixture, but is preferentially occupiedby propane, butane, and ethane.
The effects of three different chemicals on the growth kineticsof sII hydrates formed from SNG2 and SNG7 were also tested.Methanol (MeOH), polyvinylpyrrolidone (PVP), and polyvi-nylcaprolactum (PVCap) were selected for the study of theireffects on sII hydrate growth rate curves. The chemicals repre-sent two classes of inhibitors: thermodynamic hydrate inhibitors(THIs) and kinetic hydrate inhibitors (KHIs). As a THI,methanol shifts the phase boundary thermodynamically to thelower temperature and/or higher pressure when used at highconcentrations. At low concentrations, MeOH shows inhibition,promotion, or dual effects on hydrate formation process.4-7
Unlike the conventional THIs, a recent method of retardingcrystal growth was achieved by using water-soluble polymers likePVP and PVCap. These polymers are well-known KHIs thatbelong to the class of low dosage hydrate inhibitors (LDHIs).8
Experimental9,10 and simulation11,12 studies showed that, com-pared to PVP, PVCap is a more effective kinetic inhibitor. It has abetter attachment to the surface of a growing crystal resulting inretardation of hydrate formation. The optimal performancedepends on a certain concentration at a given pressure,13 i.e.,increasing concentration of KHIs does not always increaseinhibition performance. Such effects of THIs and KHIs on thekinetics of hydrate formation have been a focus, whereas gas
Received: December 14, 2010Revised: February 15, 2011

78 Appendix C
1336 dx.doi.org/10.1021/ef101698g |Energy Fuels 2011, 25, 1335–1341
Energy & Fuels ARTICLE
composition itself as a kinetic parameter has never been inves-tigated with and without additives. In this paper, the main focus isinvestigating the effect of gas composition on sII hydrate growthkinetics in addition to studying the effects of low concentrationsof MeOH, PVP, and PVCap on the kinetics.
Table 1 shows the compositions in mol percentage of SNG2and SNG7 gases used in the investigation of the effect of gascomposition on sII hydrate growth kinetics. SNG2 and SNG7experiments were done at the same PT conditions. Moreover, theequilibrium curves of each SNG based on predictions usingCSMGem were comparable as shown in Figure 1 enabling us tokeep approximately the same degree of subcooling. The degreesof subcooling for both gases are more comparable during the firststages of hydrate growth than the later stages. Investigating theeffect of gas composition requires operation at similar degree ofsubcooling, as studies14-22 on formation rates indicated thatgrowth kinetics are dependent on the degree of subcooling used.Besides, the degree of agitation has an effect14,16,23 on the rate ofhydrate crystallization, and hence the experiments were per-formed for a constant stirring rate of 750 rpm for both SNGs.Thus, by keeping these parameters that could affect the kineticsapproximately the same, we investigated the effect of gascomposition on sII hydrate growth kinetics with and withoutthe additives. Growth kinetics could be determined by using therate of change in moles of free gas,24-26 or equivalently, directlyfrom the gas consumption plots by applying the principle of massconservation as mass is conserved in an isochoric cell system.
’EXPERIMENTAL SETUP AND PROCEDURE
The effect of gas composition on sII hydrate growth kinetics wasinvestigated in the high pressure cell apparatus shown in Figure 2. Theautoclave cell is cylindrical with an inner volume of 145 mL, of which50mLwas filled with distilled water (DIW)with or without the additivesand 95mLwas filled with SNG2/SNG7. The temperature of the cell wascontrolled by the refrigerated and heating circulator with programmabletemperature control unit. Two temperature sensors were used, one inthe vapor phase and the other in the aqueous phase. This enabled us totrack the temperature pulse in the vapor phase and aqueous phase duringgas consumption and hydrate growth as shown in Figure 3. Eachtemperature sensor had an accuracy of (0.03 �C (Pt-100 1/10 DINelements) and the temperature was measured within an accuracy of(0.1 �C. The pressure was measured with an accuracy of(0.2 bar. Thesystem temperature and pressure changes were monitored and recordedusing LabView.
Two different gas supply cylinders with two different synthetic naturalgases of SNG2 and SNG7 (see Table 1) were used for the study of theeffect of gas composition on sII hydrate growth kinetics. Both gases formsII hydrates with no liquid hydrocarbon phases. A total of 32 experi-ments were run for both SNG2 and SNG7 with and without theadditives MeOH, PVP, and PVCap. MeOH (liquid), PVP (dry powder,Mw≈ 15,000) and PVCap (dry powder,Mw≈ 6,000) were prepared indistilled water in the range 0-100 ppm by weight. The pure water wasconsidered as 0 ppm baseline for comparison. The system was thencooled from an initial temperature of 20 �C to an experimentaltemperature of 11 �C using a cooling gradient of 2 �C/h. The systempressure was 60 bar at the end of the cooling sequence and the start ofthe experiments. After attaining a stable temperature and pressure at theexperimental conditions, cell agitation was introduced. The start of cellagitation was considered as the start of the experiment for studying thegrowth kinetics of sII hydrates.
’RESULTS AND DISCUSSION
Amount of sII Hydrate Formation. Figure 1 shows thepressure drop for both SNG2 and SNG7. Such pressure dropgives an estimation of the amount of sII hydrates formed fromeach SNG by employing the real gas equation for the isochoricsystem as
Δn ¼V
zRTΔP ð1Þ
where Δn is the amount of gas consumed during sII hydrateformation, V is SNG2/SNG7 volume, z is the compressibilityfactor which is slightly different for both SNGs but withcomparable value, R is the universal gas constant, T is themeasured experimental temperature, and ΔP is the measuredexperimental pressure drop caused by sII hydrate formation.Approximating the term V/zRT as the constant of proportion-ality which does not change significantly for all the experimentsof each SNG, we have
Δn ΔP
indicating that the amount of gas consumed and the pressuredrop are directly proportional with each other. Alternatively,employing the gas consumption vs time plot of both SNG2 andSNG7, one can estimate the amount of hydrate formation.Figure 4 shows the gas consumption vs time for the baselineand the 50 ppm experiments for both SNG2 and SNG7. Theinduction time, the time taken by the system from the start ofstirring (cell agitation) to onset of hydrate formation, was reset to
Table 1. Composition of SNGs Used
component SNG2 (mol %) SNG7 (mol %)
CH4 methane 92.50 80.40
C2H6 ethane 0 10.30
C3H8 propane 7.50 5.0
i-C4H10 i-butane 0 1.65
n-C4H10 n-butane 0 0.72
CO2 carbon dioxide 0 1.82
N2 nitrogen 0 0.11
Figure 1. Pressure vs temperature graph during sII crystal growth forboth SNG2 and SNG7.
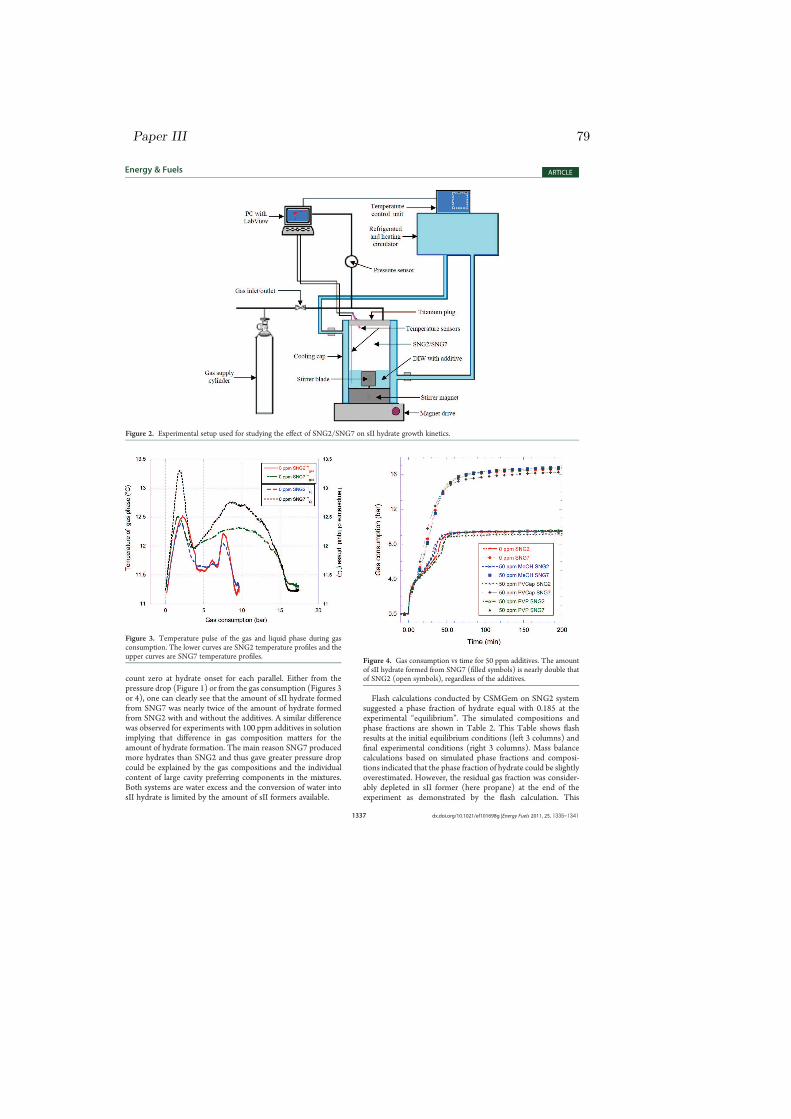
Paper III 79
1337 dx.doi.org/10.1021/ef101698g |Energy Fuels 2011, 25, 1335–1341
Energy & Fuels ARTICLE
count zero at hydrate onset for each parallel. Either from thepressure drop (Figure 1) or from the gas consumption (Figures 3or 4), one can clearly see that the amount of sII hydrate formedfrom SNG7 was nearly twice of the amount of hydrate formedfrom SNG2 with and without the additives. A similar differencewas observed for experiments with 100 ppm additives in solutionimplying that difference in gas composition matters for theamount of hydrate formation. The main reason SNG7 producedmore hydrates than SNG2 and thus gave greater pressure dropcould be explained by the gas compositions and the individualcontent of large cavity preferring components in the mixtures.Both systems are water excess and the conversion of water intosII hydrate is limited by the amount of sII formers available.
Flash calculations conducted by CSMGem on SNG2 systemsuggested a phase fraction of hydrate equal with 0.185 at theexperimental “equilibrium”. The simulated compositions andphase fractions are shown in Table 2. This Table shows flashresults at the initial equilibrium conditions (left 3 columns) andfinal experimental conditions (right 3 columns). Mass balancecalculations based on simulated phase fractions and composi-tions indicated that the phase fraction of hydrate could be slightlyoverestimated. However, the residual gas fraction was consider-ably depleted in sII former (here propane) at the end of theexperiment as demonstrated by the flash calculation. This
Figure 2. Experimental setup used for studying the effect of SNG2/SNG7 on sII hydrate growth kinetics.
Figure 3. Temperature pulse of the gas and liquid phase during gasconsumption. The lower curves are SNG2 temperature profiles and theupper curves are SNG7 temperature profiles.
Figure 4. Gas consumption vs time for 50 ppm additives. The amountof sII hydrate formed from SNG7 (filled symbols) is nearly double thatof SNG2 (open symbols), regardless of the additives.
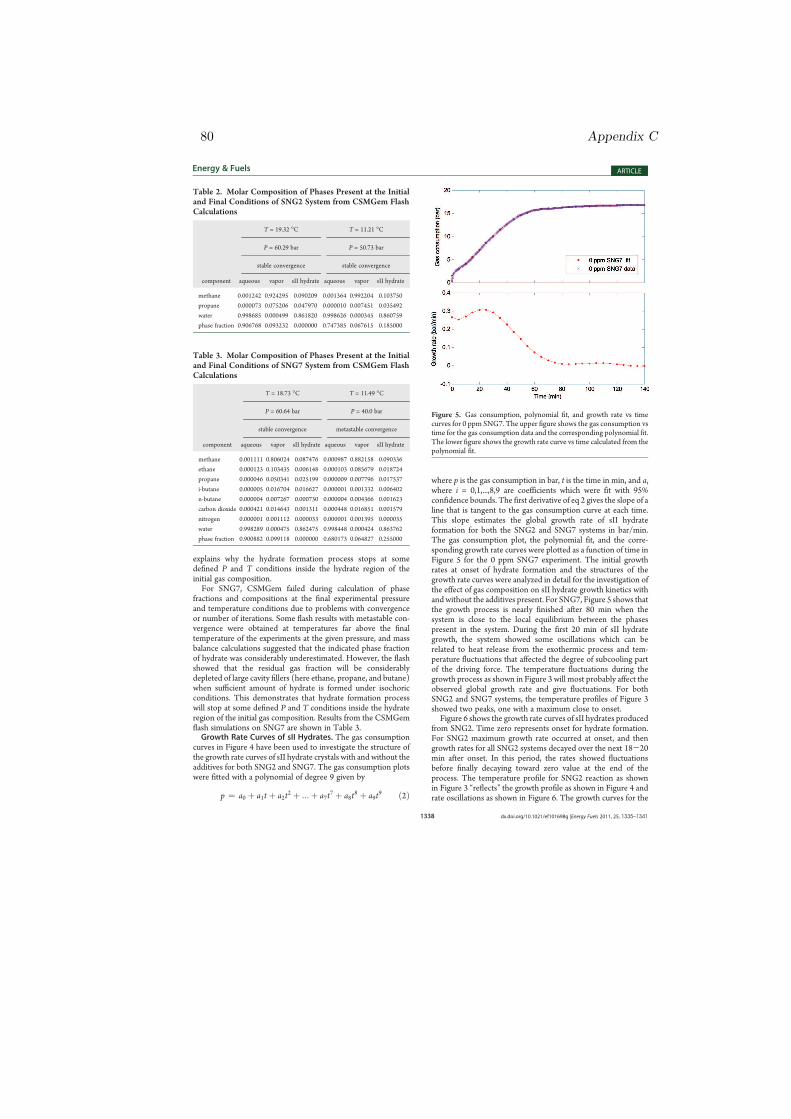
80 Appendix C
1338 dx.doi.org/10.1021/ef101698g |Energy Fuels 2011, 25, 1335–1341
Energy & Fuels ARTICLE
explains why the hydrate formation process stops at somedefined P and T conditions inside the hydrate region of theinitial gas composition.For SNG7, CSMGem failed during calculation of phase
fractions and compositions at the final experimental pressureand temperature conditions due to problems with convergenceor number of iterations. Some flash results with metastable con-vergence were obtained at temperatures far above the finaltemperature of the experiments at the given pressure, and massbalance calculations suggested that the indicated phase fractionof hydrate was considerably underestimated. However, the flashshowed that the residual gas fraction will be considerablydepleted of large cavity fillers (here ethane, propane, and butane)when sufficient amount of hydrate is formed under isochoricconditions. This demonstrates that hydrate formation processwill stop at some defined P and T conditions inside the hydrateregion of the initial gas composition. Results from the CSMGemflash simulations on SNG7 are shown in Table 3.Growth Rate Curves of sII Hydrates. The gas consumption
curves in Figure 4 have been used to investigate the structure ofthe growth rate curves of sII hydrate crystals with and without theadditives for both SNG2 and SNG7. The gas consumption plotswere fitted with a polynomial of degree 9 given by
p ¼ a0 þ a1t þ a2t2 þ :::þ a7t
7 þ a8t8 þ a9t
9 ð2Þ
where p is the gas consumption in bar, t is the time in min, and aiwhere i = 0,1,...,8,9 are coefficients which were fit with 95%confidence bounds. The first derivative of eq 2 gives the slope of aline that is tangent to the gas consumption curve at each time.This slope estimates the global growth rate of sII hydrateformation for both the SNG2 and SNG7 systems in bar/min.The gas consumption plot, the polynomial fit, and the corre-sponding growth rate curves were plotted as a function of time inFigure 5 for the 0 ppm SNG7 experiment. The initial growthrates at onset of hydrate formation and the structures of thegrowth rate curves were analyzed in detail for the investigation ofthe effect of gas composition on sII hydrate growth kinetics withand without the additives present. For SNG7, Figure 5 shows thatthe growth process is nearly finished after 80 min when thesystem is close to the local equilibrium between the phasespresent in the system. During the first 20 min of sII hydrategrowth, the system showed some oscillations which can berelated to heat release from the exothermic process and tem-perature fluctuations that affected the degree of subcooling partof the driving force. The temperature fluctuations during thegrowth process as shown in Figure 3 will most probably affect theobserved global growth rate and give fluctuations. For bothSNG2 and SNG7 systems, the temperature profiles of Figure 3showed two peaks, one with a maximum close to onset.Figure 6 shows the growth rate curves of sII hydrates produced
from SNG2. Time zero represents onset for hydrate formation.For SNG2 maximum growth rate occurred at onset, and thengrowth rates for all SNG2 systems decayed over the next 18-20min after onset. In this period, the rates showed fluctuationsbefore finally decaying toward zero value at the end of theprocess. The temperature profile for SNG2 reaction as shownin Figure 3 “reflects” the growth profile as shown in Figure 4 andrate oscillations as shown in Figure 6. The growth curves for the
Table 2. Molar Composition of Phases Present at the Initialand Final Conditions of SNG2 System from CSMGem FlashCalculations
T = 19.32 �C T = 11.21 �C
P = 60.29 bar P = 50.73 bar
stable convergence stable convergence
component aqueous vapor sII hydrate aqueous vapor sII hydrate
methane 0.001242 0.924295 0.090209 0.001364 0.992204 0.103750
propane 0.000073 0.075206 0.047970 0.000010 0.007451 0.035492
water 0.998685 0.000499 0.861820 0.998626 0.000345 0.860759
phase fraction 0.906768 0.093232 0.000000 0.747385 0.067615 0.185000
Table 3. Molar Composition of Phases Present at the Initialand Final Conditions of SNG7 System from CSMGem FlashCalculations
T = 18.73 �C T = 11.49 �C
P = 60.64 bar P = 40.0 bar
stable convergence metastable convergence
component aqueous vapor sII hydrate aqueous vapor sII hydrate
methane 0.001111 0.806024 0.087476 0.000987 0.882158 0.090336
ethane 0.000123 0.103435 0.006148 0.000103 0.085679 0.018724
propane 0.000046 0.050341 0.025199 0.000009 0.007796 0.017537
i-butane 0.000005 0.016704 0.016627 0.000001 0.001332 0.006402
n-butane 0.000004 0.007267 0.000730 0.000004 0.004366 0.001623
carbon dioxide 0.000421 0.014643 0.001311 0.000448 0.016851 0.001579
nitrogen 0.000001 0.001112 0.000033 0.000001 0.001395 0.000035
water 0.998289 0.000475 0.862475 0.998448 0.000424 0.863762
phase fraction 0.900882 0.099118 0.000000 0.680173 0.064827 0.255000
Figure 5. Gas consumption, polynomial fit, and growth rate vs timecurves for 0 ppm SNG7. The upper figure shows the gas consumption vstime for the gas consumption data and the corresponding polynomial fit.The lower figure shows the growth rate curve vs time calculated from thepolynomial fit.

Paper III 81
1339 dx.doi.org/10.1021/ef101698g |Energy Fuels 2011, 25, 1335–1341
Energy & Fuels ARTICLE
PVP experiments showed higher initial rates and strongerfluctuations than the pure water, MeOH, and PVCap systems.It has a minimum growth rate near 19 min after onset. After thisminimum value, the growth rates increased and then decayed tozero. The initial growth rate of sII hydrate formed from SNG2was in the range between 0.2-0.7 bar/min for all the aqueoussolutions examined. The maximum initial growth rate for SNG2system was more than twice the maximum initial growth rateobserved for the SNG7 system as shown in Figure 7. The range ofthe initial growth rate of sII hydrate formed from SNG7 wasbetween 0.1 and 0.3 bar/min. The increased initial growth rate ofsII hydrate produced from SNG2 as compared to the hydrateproduced from SNG7 could be due to the large number of criticalnuclei in SNG2 as compared to SNG7. In a multicomponent gashydrate nucleation study27 of sII hydrates from both SNG2 andSNG7, it was shown that SNG2 system nucleates more easily thanSNG7 system. Moreover, as discussed before on the difference ofthe total amount of hydrate formation from SNG2/SNG7, moreoptions of guest molecules for 51264 cage fillings may contribute toan increased overall hydrate formation. Despite its promotion onhydrate formation, more options of guest molecules available inSNG7, however, may reduce the growth rate, especially during thestarting period of the growth process. With abundant guestmolecules in both SNGs for 51264 cage fillings, 51264 cage fillingsmay become the rate-limiting step in hydrate formation. Themultiple 51264 cage filling molecules (ethane, propane, i-butane,n-butane, carbondioxide, andnitrogen) in SNG7may competewitheach other in occupying 51264 cages and thus reduce the initialgrowth rate in an observable manner.The structure of the growth curves of SNG7 was also different
as compared to the structure of the growth curves of SNG2. Asshown in Figure 7, the growth rates of sII hydrate produced fromSNG7 initially increased to attain a maximum value, and thendecreased to zero. Such differences in growth patterns for thesame hydrate structure could be considered as a fingerprint ofthe effect of gas composition on growth kinetics. These sIIhydrate growth curve structures were unique for each SNG, andthe effects of the additives on these growth curves were shiftingthe curves up or down based on the concentration and type of thechemicals used while the unique structure remained the same.
The additives used play different roles for the growth kineticsof the system. MeOH may act on the surface tension. During amolecular dynamics study28 on methanol-water mixtures it wasobserved that the surface tension of the solution was greatlyreduced by adding a small amount of methanol to water. Ashydrate formation requires transporting of guest molecules fromthe gas phase to the growing cluster in the liquid phase, thereduction in surface tension may have an effect on the growthprocess. Experimental work on methanol shows contradictingresults with regard to hydrate cavity stabilization. FTIR spectrastudy29 on thin-film vapor deposits of methanol with water showedthat methanol can readily form sII mixed clathrate hydrates within acertain temperature range. Another experimental study30 alsoshowed that methanol has the potential to form and stabilize sIIhydrate at low concentrations. On the other hand, further investiga-tions using NMR and dielectrics proved that methanol cannotstabilize sII structure.31 Despite such contradicting reports ofmethanol on forming and stabilizing hydrate cages, its presence inhydrate forming systems has some effects on hydrate formation.The hydroxyl group of methanol has an effect by hydrogen bondingwith the water molecules, whereas the methyl group tends toorganize the water molecules in direct competition for a hydrateguest. This may cause a lattice defect as lattice defects caused byguest-water hydrogen bonding in other systems have beenreported32 and a distorted lattice structure may enhance diffusionthat could possibly affect the growth.Another possible explanation of methanol effect on the
kinetics could be through the temperature-dependent attractiveand repulsive forces that could disturb the system’s behavior. In adilute aqueous solution of alcohols, a study33 showed that alcoholmolecules have temperature-dependent attractive and repulsiveforces that affect the activity coefficient of alcohol and water. Thismay have an effect on the kinetics of sII hydrate formation sincethe kinetic rate is dependent on the temperature of the systemdescribed by the Arrhenius equation. In an investigation34 on theinfluence of ethanol in optimizing formation rates, trace amountsof ethanol dramatically enhanced the formation of methanehydrate aggregates. Although the formation process and thehydrate structure was different from ours, it is an indication thattrace amounts of alcohols in general can play a role in the kineticsof hydrate formation.
Figure 7. Growth rate vs time curves of SNG7 experiments for 50 and100 ppm concentrations of MeOH, PVP, and PVCap including thereference curve.Figure 6. Growth rate vs time curves of SNG2 experiments for 50 and
100 ppm concentrations ofMeOH, PVP, and PVCap. 0 ppm curve is thepure water baseline experiment.
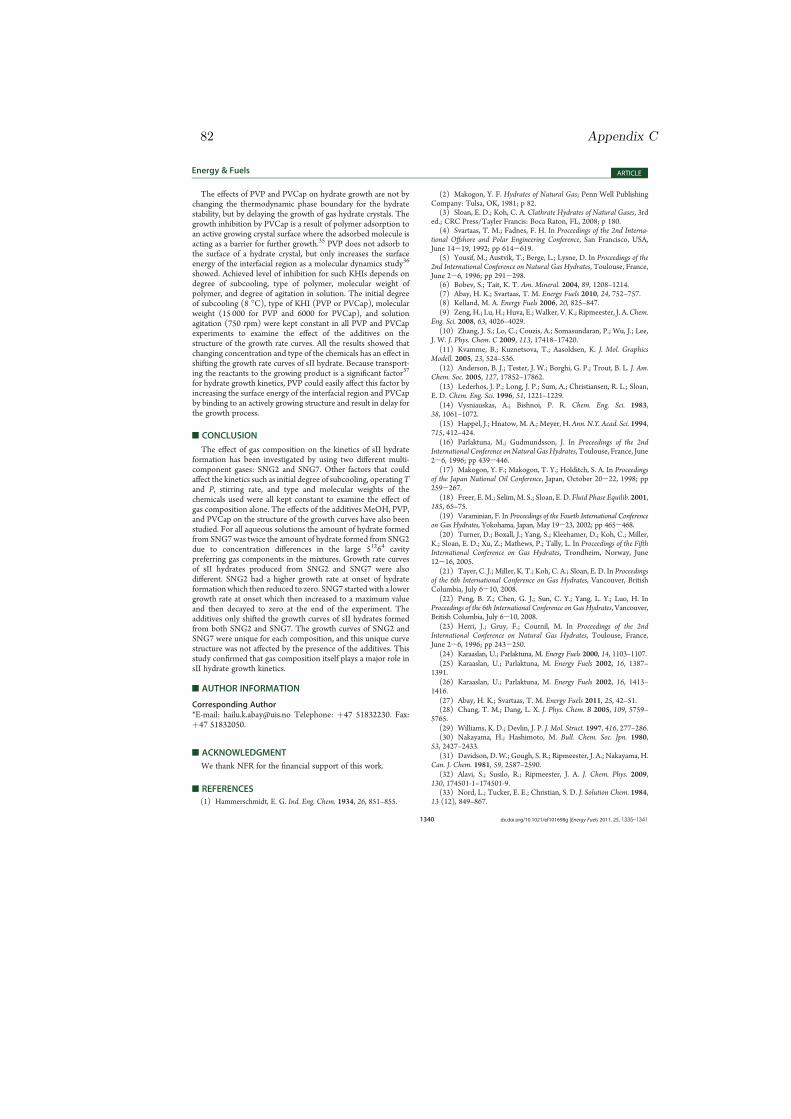
82 Appendix C
1340 dx.doi.org/10.1021/ef101698g |Energy Fuels 2011, 25, 1335–1341
Energy & Fuels ARTICLE
The effects of PVP and PVCap on hydrate growth are not bychanging the thermodynamic phase boundary for the hydratestability, but by delaying the growth of gas hydrate crystals. Thegrowth inhibition by PVCap is a result of polymer adsorption toan active growing crystal surface where the adsorbed molecule isacting as a barrier for further growth.35 PVP does not adsorb tothe surface of a hydrate crystal, but only increases the surfaceenergy of the interfacial region as a molecular dynamics study36
showed. Achieved level of inhibition for such KHIs depends ondegree of subcooling, type of polymer, molecular weight ofpolymer, and degree of agitation in solution. The initial degreeof subcooling (8 �C), type of KHI (PVP or PVCap), molecularweight (15 000 for PVP and 6000 for PVCap), and solutionagitation (750 rpm) were kept constant in all PVP and PVCapexperiments to examine the effect of the additives on thestructure of the growth rate curves. All the results showed thatchanging concentration and type of the chemicals has an effect inshifting the growth rate curves of sII hydrate. Because transport-ing the reactants to the growing product is a significant factor37
for hydrate growth kinetics, PVP could easily affect this factor byincreasing the surface energy of the interfacial region and PVCapby binding to an actively growing structure and result in delay forthe growth process.
’CONCLUSION
The effect of gas composition on the kinetics of sII hydrateformation has been investigated by using two different multi-component gases: SNG2 and SNG7. Other factors that couldaffect the kinetics such as initial degree of subcooling, operatingTand P, stirring rate, and type and molecular weights of thechemicals used were all kept constant to examine the effect ofgas composition alone. The effects of the additives MeOH, PVP,and PVCap on the structure of the growth curves have also beenstudied. For all aqueous solutions the amount of hydrate formedfrom SNG7 was twice the amount of hydrate formed from SNG2due to concentration differences in the large 51264 cavitypreferring gas components in the mixtures. Growth rate curvesof sII hydrates produced from SNG2 and SNG7 were alsodifferent. SNG2 had a higher growth rate at onset of hydrateformation which then reduced to zero. SNG7 started with a lowergrowth rate at onset which then increased to a maximum valueand then decayed to zero at the end of the experiment. Theadditives only shifted the growth curves of sII hydrates formedfrom both SNG2 and SNG7. The growth curves of SNG2 andSNG7 were unique for each composition, and this unique curvestructure was not affected by the presence of the additives. Thisstudy confirmed that gas composition itself plays a major role insII hydrate growth kinetics.
’AUTHOR INFORMATION
Corresponding Author*E-mail: [email protected] Telephone: þ47 51832230. Fax:þ47 51832050.
’ACKNOWLEDGMENT
We thank NFR for the financial support of this work.
’REFERENCES
(1) Hammerschmidt, E. G. Ind. Eng. Chem. 1934, 26, 851–855.
(2) Makogon, Y. F. Hydrates of Natural Gas; Penn Well PublishingCompany: Tulsa, OK, 1981; p 82.
(3) Sloan, E. D.; Koh, C. A. Clathrate Hydrates of Natural Gases, 3rded.; CRC Press/Tayler Francis: Boca Raton, FL, 2008; p 180.
(4) Svartaas, T. M.; Fadnes, F. H. In Proceedings of the 2nd Interna-tional Offshore and Polar Engineering Conference, San Francisco, USA,June 14-19, 1992; pp 614-619.
(5) Yousif, M.; Austvik, T.; Berge, L.; Lysne, D. In Proceedings of the2nd International Conference on Natural Gas Hydrates, Toulouse, France,June 2-6, 1996; pp 291-298.
(6) Bobev, S.; Tait, K. T. Am. Mineral. 2004, 89, 1208–1214.(7) Abay, H. K.; Svartaas, T. M. Energy Fuels 2010, 24, 752–757.(8) Kelland, M. A. Energy Fuels 2006, 20, 825–847.(9) Zeng, H.; Lu, H.; Huva, E.;Walker, V. K.; Ripmeester, J. A.Chem.
Eng. Sci. 2008, 63, 4026–4029.(10) Zhang, J. S.; Lo, C.; Couzis, A.; Somasundaran, P.; Wu, J.; Lee,
J. W. J. Phys. Chem. C 2009, 113, 17418–17420.(11) Kvamme, B.; Kuznetsova, T.; Aasoldsen, K. J. Mol. Graphics
Modell. 2005, 23, 524–536.(12) Anderson, B. J.; Tester, J. W.; Borghi, G. P.; Trout, B. L. J. Am.
Chem. Soc. 2005, 127, 17852–17862.(13) Lederhos, J. P.; Long, J. P.; Sum, A.; Christiansen, R. L.; Sloan,
E. D. Chem. Eng. Sci. 1996, 51, 1221–1229.(14) Vysniauskas, A.; Bishnoi, P. R. Chem. Eng. Sci. 1983,
38, 1061–1072.(15) Happel, J.; Hnatow, M. A.; Meyer, H. Ann. N.Y. Acad. Sci. 1994,
715, 412–424.(16) Parlaktuna, M.; Gudmundsson, J. In Proceedings of the 2nd
International Conference onNatural Gas Hydrates, Toulouse, France, June2-6, 1996; pp 439-446.
(17) Makogon, Y. F.; Makogon, T. Y.; Holditch, S. A. In Proceedingsof the Japan National Oil Conference, Japan, October 20-22, 1998; pp259-267.
(18) Freer, E.M.; Selim,M. S.; Sloan, E. D. Fluid Phase Equilib. 2001,185, 65–75.
(19) Varaminian, F. In Proceedings of the Fourth International Conferenceon Gas Hydrates, Yokohama, Japan, May 19-23, 2002; pp 465-468.
(20) Turner, D.; Boxall, J.; Yang, S.; Kleehamer, D.; Koh, C.; Miller,K.; Sloan, E. D.; Xu, Z.; Mathews, P.; Tally, L. In Proceedings of the FifthInternational Conference on Gas Hydrates, Trondheim, Norway, June12-16, 2005.
(21) Tayer, C. J.; Miller, K. T.; Koh, C. A.; Sloan, E. D. In Proceedingsof the 6th International Conference on Gas Hydrates, Vancouver, BritishColumbia, July 6-10, 2008.
(22) Peng, B. Z.; Chen, G. J.; Sun, C. Y.; Yang, L. Y.; Luo, H. InProceedings of the 6th International Conference on Gas Hydrates, Vancouver,British Columbia, July 6-10, 2008.
(23) Herri, J.; Gruy, F.; Cournil, M. In Proceedings of the 2ndInternational Conference on Natural Gas Hydrates, Toulouse, France,June 2-6, 1996; pp 243-250.
(24) Karaaslan, U.; Parlaktuna, M. Energy Fuels 2000, 14, 1103–1107.(25) Karaaslan, U.; Parlaktuna, M. Energy Fuels 2002, 16, 1387–
1391.(26) Karaaslan, U.; Parlaktuna, M. Energy Fuels 2002, 16, 1413–
1416.(27) Abay, H. K.; Svartaas, T. M. Energy Fuels 2011, 25, 42–51.(28) Chang, T. M.; Dang, L. X. J. Phys. Chem. B 2005, 109, 5759–
5765.(29) Williams, K. D.; Devlin, J. P. J. Mol. Struct. 1997, 416, 277–286.(30) Nakayama, H.; Hashimoto, M. Bull. Chem. Soc. Jpn. 1980,
53, 2427–2433.(31) Davidson, D.W.; Gough, S. R.; Ripmeester, J. A.; Nakayama, H.
Can. J. Chem. 1981, 59, 2587–2590.(32) Alavi, S.; Susilo, R.; Ripmeester, J. A. J. Chem. Phys. 2009,
130, 174501-1–174501-9.(33) Nord, L.; Tucker, E. E.; Christian, S. D. J. Solution Chem. 1984,
13 (12), 849–867.

Paper III 83
1341 dx.doi.org/10.1021/ef101698g |Energy Fuels 2011, 25, 1335–1341
Energy & Fuels ARTICLE
(34) Chen, P. C.; Huang, W. L.; Stern, L. A. Energy Fuels 2010,24, 2390.(35) Larsen, R.; Knight, C. A.; Sloan, E. D. Fluid Phase Equilib. 1998,
150-151, 353–360.(36) Moon, C.; Hawtin, R. W.; Rodger, P. M. Faraday Discuss. 2007,
136, 367–382.(37) Buch, V.; Devlin, J. P.; Monreal, I. A.; Cwiklik, B. J.; Aytemiz,
N. U.; Cwiklik, L. Phys. Chem. Chem. Phys. 2009, 11, 10245–10265.


Appendix D
Paper IV
On the Kinetics of Methane Hydrate Formation: ATime-dependent Kinetic Rate Model
By:
Hailu K. Abay and Thor M. Svartaas.
Printed in:
Proceedings of the 7th International Conference on Gas Hydrates, Edinburgh,United Kingdom, July 17-21, 2011.
85


Paper IV 87
ON THE KINETICS OF METHANE HYDRATE FORMATION: A TIME-DEPENDENT KINETIC RATE MODEL
Hailu K. Abay1� and Thor M. Svartaas1
Department of Petroleum Engineering1
Faculty of Science and Technology University of Stavanger
4036, Stavanger NORWAY
ABSTRACT The kinetics of hydrate formation is of paramount importance for hydrate prevention and gas storage in a hydrate state. Methane hydrates were produced in a high pressure autoclave cell and kinetic rates were investigated in the presence of low concentrations of methanol (MeOH) and polyvinylcaprolactam (PVCap). The degree of subcooling has been used as the driving force for hydrate formation. A detailed analysis of the dynamics of the free gas content and the principle of mass conservation have been employed to understand the growth behavior in the liquid phase by considering a constant kinetic rate, and its limitations are discussed. The results show that kinetic rates in an isochoric cell system are not generally constant during the whole growth period of hydrate formation, and a time-dependent model is proposed. The model could also be utilized for testing the effect of other additives on the rate of growth of methane hydrates.
Keywords: crystallization, diffusion, heat transfer, kinetics, mass transfer, nucleation
� Corresponding author: Phone: +47 51 83 22 30 Fax +47 51 83 20 50 E-mail: [email protected]
NOMENCLATURE k kinetic rate constant [mol/min, bar/min] Mw molecular weight n number of moles of free gas P pressure [bar] r growth rate [mol/min, bar/min] T temperature [oC] �T degree of subcooling [oC] V gas volume [mL] z compressibility factor INTRODUCTIONHydrate formation has two major steps, nucleation and growth. Contrary to hydrate thermodynamics, the time-dependent processes of hydrate nucleation and growth are challenging with regard to measurement and modelling [1]. The knowledge of the dynamics of hydrate formation and build-up of gas hydrates may be important in determining the parameters for production of gas hydrates, and
in understanding plug conditions in the gas pipeline and/or the equipment [2]. The former has an advantage for gas storage in a hydrate state and the later has an advantage for the prevention of hydrate blockage in offshore processing, production, and transportation of natural gas and oil. Two additives, methanol (MeOH) and polyvinylcaprolactum (PVCap), were selected for the study of methane hydrate formation. The two chemicals were selected to represent the two classes of inhibitors, thermodynamic and kinetic. Methanol is a thermodynamic hydrate inhibitor when used in large amounts. The method of prevention is by shifting the phase boundary thermodynamically to the lower temperature and/or higher pressure. In small amounts, methanol shows both inhibition and promotion effect. During hydrate crystallization process, an
Proceedings of the 7th International Conference on Gas Hydrates (ICGH 2011), Edinburgh, Scotland, United Kingdom, July 17-21, 2011.

88 Appendix D
experimental study [3] showed that methanol has an inhibition effect, whereas other experimental studies [4, 5] showed that it has promotional effect. Even at ultralow concentrations, methanol has a dual effect on the nucleation of methane hydrate formation [6]. PVCap is water-soluble polymer capable of delaying the growth of gas hydrate crystals. It is a kinetic hydrate inhibitor (KHI) that belongs to the class of low dosage hydrate inhibitors (LDHIs). A comprehensive review [7] on the history of LDHIs was given previously. PVCap has a higher free energy of binding (or more attractive interaction) with the hydrate indicating that it has a better attachment than other inhibitors. Such binding of an inhibitor to the surface of a growing crystal slows down hydrate formation. In addition to investigating the effect of low concentrations of PVCap and MeOH on the growth of methane hydrate formation, the main aim of this work is proposing a time-dependent kinetic rate model that could be employed for testing the effect of other additives on methane hydrate formation.
Figure 1. High pressure autoclave cell experimental setup.
Experimentally, the rate of hydrate formation could be determined by the thermodynamic conditions during the course of the experiment and the gas composition used. The change in the rate of moles of free gas has been used as an indicator of the rate of hydrate formation in an isochoric cell system during the study of promotional effect of polymers and surfactants [8-10]. These papers and
another work [11] considered the rate constants and rates as a constant parameter for the analysis of the effect of additives on hydrate formation kinetics. On the other hand, studies [12-14] on methane hydrate formation indicated that formation rates are dependent on the degree of subcooling besides other factors such as stirring rate. Methane hydrate film growth studies [15-18] on the rate of formation also showed the dependence of the rate of hydrate growth on the degree of subcooling used. A flow loop experiment study [19] also used the degree of subcooling as the driving force for hydrate formation, and the formation rate was found proportional to the driving force. In addition to these studies, a heat transfer modelling study [20] showed an explicit dependence of the rate of methane hydrate formation on the degree of subcooling. In this work, the variation of the degree of subcooling during hydrate formation is investigated in detail within every single experiment. The rate of change of the free gas mole and the principle of mass conservation are used for the analysis of the effect of MeOH and PVCap on the kinetics of methane hydrate formation. The usual trend of applying a constant kinetic rate parameter is used, and its limitations are discussed. In subcooled systems, energy is suddenly released when hydrates form, giving temperature increase which affects the degree of subcooling over a period of time until the experimental preset temperature is reestablished. In addition, in an isochoric cell system a pressure drop during hydrate formation also affects the driving force. Since the degree of subcooling varies with time during the build-up of methane molecules into the hydrate surface, a time-dependent model is proposed for the kinetic rate during the growth of methane hydrate formation.
EXPERIMENAL SETUP AND PROCEDURE Growth kinetics were investigated in the high pressure autoclave cell apparatus shown in Fig. 1. A cylindrical high pressure autoclave cell of inner volume 145 mL was used as a reactor. The reactor had a magnetic stirring plate rotating at 750 rpm. The temperature of the cell was controlled by the refrigerated and heating circulator with programmable temperature control unit. The temperature was measured to an accuracy of ±0.1 oC, and the pressure was measured to an accuracy
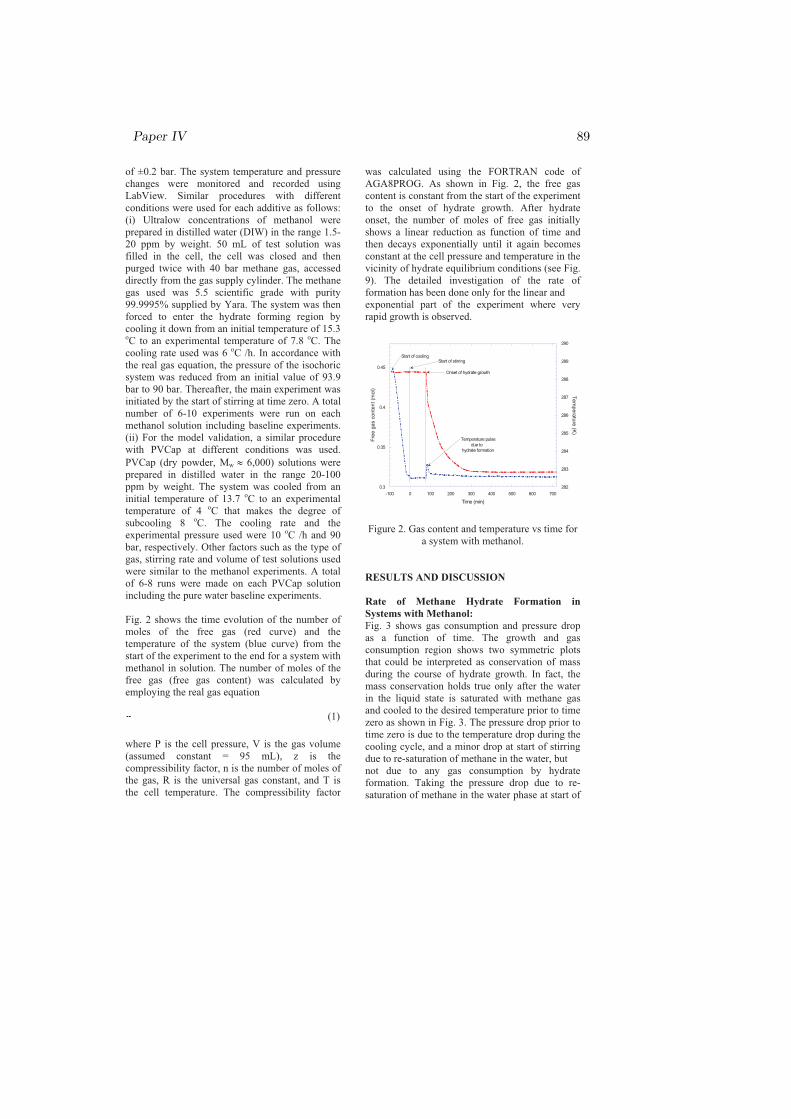
Paper IV 89
of ±0.2 bar. The system temperature and pressure changes were monitored and recorded using LabView. Similar procedures with different conditions were used for each additive as follows: (i) Ultralow concentrations of methanol were prepared in distilled water (DIW) in the range 1.5-20 ppm by weight. 50 mL of test solution was filled in the cell, the cell was closed and then purged twice with 40 bar methane gas, accessed directly from the gas supply cylinder. The methane gas used was 5.5 scientific grade with purity 99.9995% supplied by Yara. The system was then forced to enter the hydrate forming region by cooling it down from an initial temperature of 15.3 oC to an experimental temperature of 7.8 oC. The cooling rate used was 6 oC /h. In accordance with the real gas equation, the pressure of the isochoric system was reduced from an initial value of 93.9 bar to 90 bar. Thereafter, the main experiment was initiated by the start of stirring at time zero. A total number of 6-10 experiments were run on each methanol solution including baseline experiments. (ii) For the model validation, a similar procedure with PVCap at different conditions was used. PVCap (dry powder, Mw � 6,000) solutions were prepared in distilled water in the range 20-100 ppm by weight. The system was cooled from an initial temperature of 13.7 oC to an experimental temperature of 4 oC that makes the degree of subcooling 8 oC. The cooling rate and the experimental pressure used were 10 oC /h and 90 bar, respectively. Other factors such as the type of gas, stirring rate and volume of test solutions used were similar to the methanol experiments. A total of 6-8 runs were made on each PVCap solution including the pure water baseline experiments. Fig. 2 shows the time evolution of the number of moles of the free gas (red curve) and the temperature of the system (blue curve) from the start of the experiment to the end for a system with methanol in solution. The number of moles of the free gas (free gas content) was calculated by employing the real gas equation
(1) where P is the cell pressure, V is the gas volume (assumed constant = 95 mL), z is the compressibility factor, n is the number of moles of the gas, R is the universal gas constant, and T is the cell temperature. The compressibility factor
was calculated using the FORTRAN code of AGA8PROG. As shown in Fig. 2, the free gas content is constant from the start of the experiment to the onset of hydrate growth. After hydrate onset, the number of moles of free gas initially shows a linear reduction as function of time and then decays exponentially until it again becomes constant at the cell pressure and temperature in the vicinity of hydrate equilibrium conditions (see Fig. 9). The detailed investigation of the rate of formation has been done only for the linear and exponential part of the experiment where very rapid growth is observed.
0.3
0.35
0.4
0.45
282
283
284
285
286
287
288
289
290
-100 0 100 200 300 400 500 600 700
Free
gas
con
tent
(mol
)
Temperature (K
)
Time (min)
Start of coolingStart of stirring
Onset of hydrate growth
Temperature pulse due to hydrate formation
Figure 2. Gas content and temperature vs time for a system with methanol.
RESULTS AND DISCUSSION
Rate of Methane Hydrate Formation in Systems with Methanol: Fig. 3 shows gas consumption and pressure drop as a function of time. The growth and gas consumption region shows two symmetric plots that could be interpreted as conservation of mass during the course of hydrate growth. In fact, the mass conservation holds true only after the water in the liquid state is saturated with methane gas and cooled to the desired temperature prior to time zero as shown in Fig. 3. The pressure drop prior to time zero is due to the temperature drop during the cooling cycle, and a minor drop at start of stirring due to re-saturation of methane in the water, but not due to any gas consumption by hydrate formation. Taking the pressure drop due to re-saturation of methane in the water phase at start of

90 Appendix D
stirring into consideration, the mass conservation holds true throughout the whole experiment.
-0.5
0
0.5
1
1.5
2
2.5
6.5
7
7.5
8
8.5
9
9.5
-200 0 200 400 600 800
Gas
con
sum
ptio
n (M
Pa)
Pressure (M
Pa)
Time (min)
Catastrophic gas consumption and
growth region
Figure 3. Gas consumption (red curve) and cell pressure (blue curve) vs time for a system with
methanol Focusing only on the growth and consumption region, and assuming that gas accumulation in the liquid water saturated with methane gas is unlikely, the number of methane molecules leaving the gas phase are represented by the pressure drop, whereas the number of methane molecules entering in the hydrate cages are represented by the gas consumption plot. Since mass must be conserved in an isochoric system, the two plots shows symmetry about an axis passing through the intersection of the two plots and parallel to the time axis. Thus, the dynamics of the number of moles of methane in the gas phase could give information on the rate of hydrate formation in the liquid phase. With the dynamics of the number of moles of the free gas content as an indicator of the growth rate in the liquid phase, we closely investigate the structure of the gas consumption curves during the growth period. As shown in the dynamics of the free gas content of Fig. 2, at the onset of hydrate formation, there is a strong exothermic reaction leading to a sudden temperature increase. In this experiment, a peak temperature value is obtained approximately 4 min after onset. During this period the free gas content shows a sudden drop indicating a high hydrate formation rate. When the initial exothermic reaction decreased, the hydrate formation rate appeared to obtain a reduced, but constant level during the next 38 min of the experiment. Thereafter the formation rate appeared
to fall exponentially towards completion of the cell reaction. This suggested 3 different regions where growth kinetics are controlled or dominated by different proportions of heat and mass transfer, and decreasing driving force as the cell PT conditions approached hydrate equilibrium. Fig. 4 shows the structure of the growth in 3 different regions for representative plots of ultralow concentrations of methanol with different onset time. All the representative plots show distinct features i.e., the slope of the curve change after some time, which is marked by the boundary lines of region 1, 2 and 3. For comparison, the time axis of Fig. 4 is reset to count zero at hydrate onset for all systems as shown in Fig. 5. This figure clearly shows that all systems have very steep slope during the very early stage of the hydrate growth that changes to another slope after a certain turning point. During the first part of the reaction (region 1), there is a sudden temperature increase due to released dissociation energy from hydrates formed in subcooled, non-equilibrium system. Removing the first non-equilibrium excess heat of reaction by the cooling, local equilibria will be reestablished throughout the system, and growth rate is determined by subcooling, pressure (i.e., concentration), temperature and heat transfer (region 2). In region 3, the main effect on growth rate is dominated by decreasing concentration of reacting species i.e., pressure approaching equilibrium conditions.
-0.5
0
0.5
1
1.5
2
2.5
3
3.5
0 200 400 600 800 1000 1200 1400 1600
0 ppm MeOH
1.5 ppm MeOH
5 ppm MeOH
10 ppm MeOH
20 ppm MeOH
Gas
con
sum
ptio
n (M
Pa)
Time (min)
Region 1
Region 2
Region 3
Figure 4. Representative plots of gas consumption
vs time.

Paper IV 91
-0.5
0
0.5
1
1.5
2
2.5
3
3.5
-50 0 50 100 150 200
Gas
con
sum
ptio
n (M
Pa)
Time (min)
Reg
ion
1R
egio
n 2
Reg
ion
3
0
0.2
0.4
0.6
0.8
-2 0 2 4 6 8
Delayed onset for 0 ppm
Figure 5. Representative plots of gas consumption
vs time (tonset=0) for a system with methanol.
-0.50
0.0
0.50
1.0
1.5
2.0
2.5
3.0
3.5
-200 0.00 200 400 600 800 1.00E+3 1.20E+3
115 min induction
174 min induction
192 min induction
218 min induction
274 min induction
342 min induction
635 min induction
820 min induction
946 min induction
1118 min induction
Gas
con
sum
ptio
n (M
Pa)
Time (min)
0.0
0.20
0.40
0.60
0.80
0.00 5.00 10.0
Figure 6. Gas consumption vs time (tonset=0) for
1.5 ppm methanol experiment. Except the pure water experiment which has an apparently slow initial growth period of short duration prior to onset of catastrophic growth, all under-inhibited experiments have spontaneous and fast growth at onset as shown in the inset of Fig. 5. This could be an indicator that an ultralow concentration of methanol may affect (trigger) the onset of methane hydrate formation. Similar structure was observed in every experiment of ultralow concentrations of methanol including the pure water reference. For example, Fig. 6 shows the structure of gas consumption vs time plots for 10 parallel experiments with 1.5 ppm methanol in solution. The inset of the figure shows the slope change going from region 1 to region 2.
0.25
0.3
0.35
0.4
0.45
0 40 80 120 160
0 ppm MeOH
1.5 ppm MeOH
5 ppm MeOH
10 ppm MeOH
20 ppm MeOH
Free
gas
con
tent
(mol
)
Time (min)
Region 1
Region 2
Region 3
Figure 7. The dynamics of free gas content during
the hydrate growth period. The dynamics of the number of moles of the free gas in the cell is shown in Fig. 7 for the whole period of the reaction. One could notice the structural similarity of this figure with Fig. 5, which is the result of mass conservation. This suggests that one may use either the gas consumption plots, or equivalently, the free gas content plots for studying and understanding growth behaviours in isochoric cell experiments. Region 1 of Fig. 7 represents the very early stage of rapid hydrate growth. Regions 2 and 3 represent the early and late growth periods, respectively. Regions 1 and 2 show apparently linear behavior from which zero-order reactions could be assumed. The zero-order reaction is defined by
(2) where no is the initial amount of free gas (mol), ki is a kinetic rate constant (mol/min), t is the time (min), and i=1, 2. The time derivative of the zero-order reaction is
(3) which gives a growth rate equal with the kinetic rate constant. Methane hydrate growth rate in regions 1 and 2 could be estimated using Eq. (3), where each region has different initial number of moles and growth rates. For region 1, the initial number of moles of the free gas content, no1, is the free gas content at time zero (t=0). For region 2, the initial content of the free gas, no2, is taken as the final content of the free gas when the system
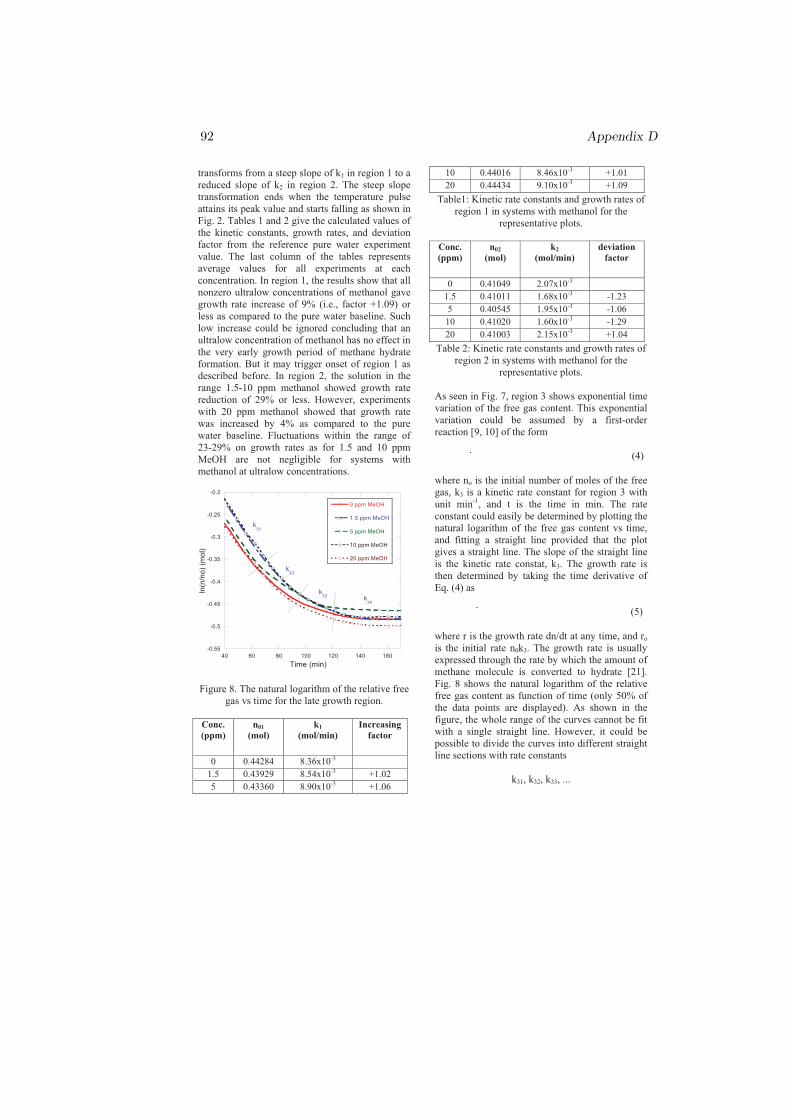
92 Appendix D
transforms from a steep slope of k1 in region 1 to a reduced slope of k2 in region 2. The steep slope transformation ends when the temperature pulse attains its peak value and starts falling as shown in Fig. 2. Tables 1 and 2 give the calculated values of the kinetic constants, growth rates, and deviation factor from the reference pure water experiment value. The last column of the tables represents average values for all experiments at each concentration. In region 1, the results show that all nonzero ultralow concentrations of methanol gave growth rate increase of 9% (i.e., factor +1.09) or less as compared to the pure water baseline. Such low increase could be ignored concluding that an ultralow concentration of methanol has no effect in the very early growth period of methane hydrate formation. But it may trigger onset of region 1 as described before. In region 2, the solution in the range 1.5-10 ppm methanol showed growth rate reduction of 29% or less. However, experiments with 20 ppm methanol showed that growth rate was increased by 4% as compared to the pure water baseline. Fluctuations within the range of 23-29% on growth rates as for 1.5 and 10 ppm MeOH are not negligible for systems with methanol at ultralow concentrations.
-0.55
-0.5
-0.45
-0.4
-0.35
-0.3
-0.25
-0.2
40 60 80 100 120 140 160
0 ppm MeOH
1.5 ppm MeOH
5 ppm MeOH
10 ppm MeOH
20 ppm MeOH
ln(n
/no)
(mol
)
Time (min)
k31
k32
k33 k
34
Figure 8. The natural logarithm of the relative free gas vs time for the late growth region.
Conc. (ppm)
n01(mol)
k1(mol/min)
Increasing factor
0 0.44284 8.36x10⁻³ 1.5 0.43929 8.54x10⁻³ +1.02 5 0.43360 8.90x10⁻³ +1.06
10 0.44016 8.46x10⁻³ +1.01 20 0.44434 9.10x10⁻³ +1.09
Table1: Kinetic rate constants and growth rates of region 1 in systems with methanol for the
representative plots.
Conc. (ppm)
n02(mol)
k2(mol/min)
deviation factor
0 0.41049 2.07x10⁻³ 1.5 0.41011 1.68x10⁻³ -1.23 5 0.40545 1.95x10⁻³ -1.06 10 0.41020 1.60x10⁻³ -1.29 20 0.41003 2.15x10⁻³ +1.04
Table 2: Kinetic rate constants and growth rates of region 2 in systems with methanol for the
representative plots. As seen in Fig. 7, region 3 shows exponential time variation of the free gas content. This exponential variation could be assumed by a first-order reaction [9, 10] of the form
(4) where no is the initial number of moles of the free gas, k3 is a kinetic rate constant for region 3 with unit min-1, and t is the time in min. The rate constant could easily be determined by plotting the natural logarithm of the free gas content vs time, and fitting a straight line provided that the plot gives a straight line. The slope of the straight line is the kinetic rate constat, k3. The growth rate is then determined by taking the time derivative of Eq. (4) as
(5) where r is the growth rate dn/dt at any time, and ro is the initial rate n0k3. The growth rate is usually expressed through the rate by which the amount of methane molecule is converted to hydrate [21]. Fig. 8 shows the natural logarithm of the relative free gas content as function of time (only 50% of the data points are displayed). As shown in the figure, the whole range of the curves cannot be fit with a single straight line. However, it could be possible to divide the curves into different straight line sections with rate constants
k31, k32, k33, ...

Paper IV 93
where the final segment depends on the number of straight lines available for each plot. Each value of k3 represents the kinetic rate constant during different regions of the growth period implying that k3 in the whole range of region 3 is not a constant, but a function of time.
Figure 9. Graph showing variation of �T during hydrate growth for a system with methanol.
Kinetic Rate Model for Hydrate Formation: A comprehensive review [22] on modelling of hydrate formation kinetics shows that growth models considered a constant kinetic rate parameter for many reasons. The straight line fit method works well, and it gives a fair estimation of the kinetic rate constants. However, the visual inspection of Fig. 8 shows that the late growth section cannot be fit by a straight line to represent all data in this region. Thus, this method may not be the best way to determine the kinetic rate constant. Hence, calculating k at any instantaneous time during the growth period would be a much better approach. This leads one to consider a time-dependent kinetic rate based on the experimental conditions. The reason for having time-dependent kinetic rate could be explained in terms of the driving force of the system, which is the degree of subcooling in this case. Some studies [11, 23, 24] used the difference in the chemical potential (or fugacity) of the guest gas between in the gas phase and in the hydrate phase to calculate formation rates and
the kinetic rate constants. In fact, the degree of subcooling does not represent the real driving force in all systems, but in systems with one type of guest molecule like the methane gas under consideration, the driving force for hydrate formation is proportional to the degree of subcooling over a wide pressure range [25]. Thus, the degree of subcooling can be a good representative of the driving force, but it is not constant during the growth period of hydrates, and the rate of growth is a function of the degree of subcooling.
5.5
6
6.5
7
7.5
8
8.5
9
9.5
280 282 284 286 288 290
0 ppm
1.5 ppm
5 ppm
10 ppm
20 ppm
P (M
Pa)
T (K) Figure 10a. Graph showing PT path for systems
with MeOH in solution. Fig. 9 shows the PT path from onset of hydrate growth at a subcooling of 4 oC (�Tinitial), to the end of the growth process in the vicinity of the hydrate equilibrium curve at �Tfinal = 0 oC. The temperature is measured in the gas phase for practical reasons while the hydrate formation process takes place in the liquid phase at a temperature closer to equilibrium. Thus, quantification of the exact subcooling along the PT path from the start to the end of growth is difficult. However, all experiments did follow comparable PT paths from start to end as shown in Fig. 10a. Fig. 10b shows similar plots for systems with PVCap which has a stronger effect on the conversion of water into hydrates resulting in reduced gas consumption and hydrate growth. The reduced conversion of water into hydrates and the effect on growth could easily be seen from the pressure drop reading of each concentration in Figure 10b. Both chemicals (MeOH and PVCap) have shown their own distinct PT structure. Thus, it is assumed that the driving force followed the same decaying
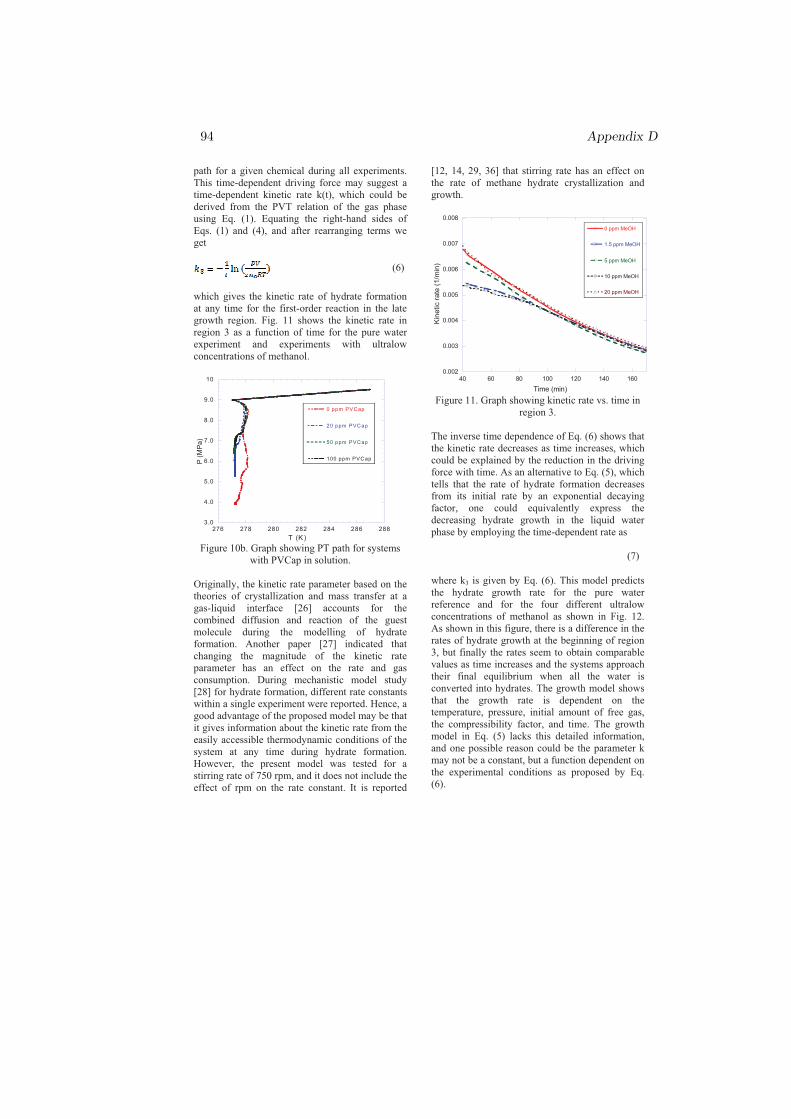
94 Appendix D
path for a given chemical during all experiments. This time-dependent driving force may suggest a time-dependent kinetic rate k(t), which could be derived from the PVT relation of the gas phase using Eq. (1). Equating the right-hand sides of Eqs. (1) and (4), and after rearranging terms we get
(6) which gives the kinetic rate of hydrate formation at any time for the first-order reaction in the late growth region. Fig. 11 shows the kinetic rate in region 3 as a function of time for the pure water experiment and experiments with ultralow concentrations of methanol.
3.0
4.0
5.0
6.0
7.0
8.0
9.0
10
276 278 280 282 284 286 288
0 ppm PVCap
20 ppm PVCap
50 ppm PVCap
100 ppm PVCap
T (K )
P (M
Pa)
Figure 10b. Graph showing PT path for systems
with PVCap in solution. Originally, the kinetic rate parameter based on the theories of crystallization and mass transfer at a gas-liquid interface [26] accounts for the combined diffusion and reaction of the guest molecule during the modelling of hydrate formation. Another paper [27] indicated that changing the magnitude of the kinetic rate parameter has an effect on the rate and gas consumption. During mechanistic model study [28] for hydrate formation, different rate constants within a single experiment were reported. Hence, a good advantage of the proposed model may be that it gives information about the kinetic rate from the easily accessible thermodynamic conditions of the system at any time during hydrate formation. However, the present model was tested for a stirring rate of 750 rpm, and it does not include the effect of rpm on the rate constant. It is reported
[12, 14, 29, 36] that stirring rate has an effect on the rate of methane hydrate crystallization and growth.
0.002
0.003
0.004
0.005
0.006
0.007
0.008
40 60 80 100 120 140 160
0 ppm MeOH
1.5 ppm MeOH
5 ppm MeOH
10 ppm MeOH
20 ppm MeOH
Kin
etic
rate
(1/m
in)
Time (min)
Figure 11. Graph showing kinetic rate vs. time in region 3.
The inverse time dependence of Eq. (6) shows that the kinetic rate decreases as time increases, which could be explained by the reduction in the driving force with time. As an alternative to Eq. (5), which tells that the rate of hydrate formation decreases from its initial rate by an exponential decaying factor, one could equivalently express the decreasing hydrate growth in the liquid water phase by employing the time-dependent rate as
(7) where k3 is given by Eq. (6). This model predicts the hydrate growth rate for the pure water reference and for the four different ultralow concentrations of methanol as shown in Fig. 12. As shown in this figure, there is a difference in the rates of hydrate growth at the beginning of region 3, but finally the rates seem to obtain comparable values as time increases and the systems approach their final equilibrium when all the water is converted into hydrates. The growth model shows that the growth rate is dependent on the temperature, pressure, initial amount of free gas, the compressibility factor, and time. The growth model in Eq. (5) lacks this detailed information, and one possible reason could be the parameter k may not be a constant, but a function dependent on the experimental conditions as proposed by Eq. (6).
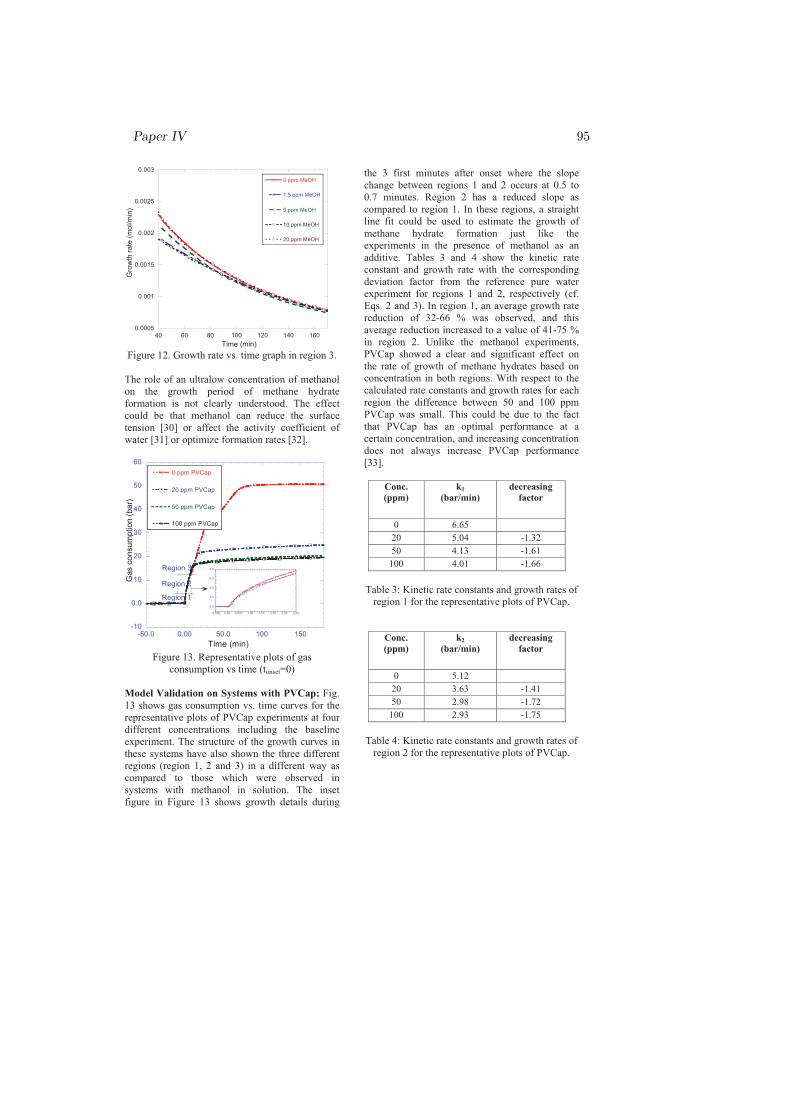
Paper IV 95
0.0005
0.001
0.0015
0.002
0.0025
0.003
40 60 80 100 120 140 160
0 ppm MeOH
1.5 ppm MeOH
5 ppm MeOH
10 ppm MeOH
20 ppm MeOH
Gro
wth
rate
(mol
/min
)
Time (min) Figure 12. Growth rate vs. time graph in region 3.
The role of an ultralow concentration of methanol on the growth period of methane hydrate formation is not clearly understood. The effect could be that methanol can reduce the surface tension [30] or affect the activity coefficient of water [31] or optimize formation rates [32].
-10
0.0
10
20
30
40
50
60
-50.0 0.00 50.0 100 150
0 ppm PVCap
20 ppm PVCap
50 ppm PVCap
100 ppm PVCap
Region 1
Region 2
Region 3
Time (min)
Gas
con
sum
ptio
n (b
ar)
0.0
2.0
4.0
6.0
8.0
-0.500 0.00 0.500 1.00 1.50 2.00 2.50 3.00
Figure 13. Representative plots of gas
consumption vs time (tonset=0)
Model Validation on Systems with PVCap: Fig. 13 shows gas consumption vs. time curves for the representative plots of PVCap experiments at four different concentrations including the baseline experiment. The structure of the growth curves in these systems have also shown the three different regions (region 1, 2 and 3) in a different way as compared to those which were observed in systems with methanol in solution. The inset figure in Figure 13 shows growth details during
the 3 first minutes after onset where the slope change between regions 1 and 2 occurs at 0.5 to 0.7 minutes. Region 2 has a reduced slope as compared to region 1. In these regions, a straight line fit could be used to estimate the growth of methane hydrate formation just like the experiments in the presence of methanol as an additive. Tables 3 and 4 show the kinetic rate constant and growth rate with the corresponding deviation factor from the reference pure water experiment for regions 1 and 2, respectively (cf. Eqs. 2 and 3). In region 1, an average growth rate reduction of 32-66 % was observed, and this average reduction increased to a value of 41-75 % in region 2. Unlike the methanol experiments, PVCap showed a clear and significant effect on the rate of growth of methane hydrates based on concentration in both regions. With respect to the calculated rate constants and growth rates for each region the difference between 50 and 100 ppm PVCap was small. This could be due to the fact that PVCap has an optimal performance at a certain concentration, and increasing concentration does not always increase PVCap performance [33].
Conc. (ppm)
k1(bar/min)
decreasing factor
0 6.65 20 5.04 -1.32 50 4.13 -1.61
100 4.01 -1.66
Table 3: Kinetic rate constants and growth rates of region 1 for the representative plots of PVCap.
Conc. (ppm)
k2(bar/min)
decreasing factor
0 5.12 20 3.63 -1.41 50 2.98 -1.72
100 2.93 -1.75 Table 4: Kinetic rate constants and growth rates of
region 2 for the representative plots of PVCap.
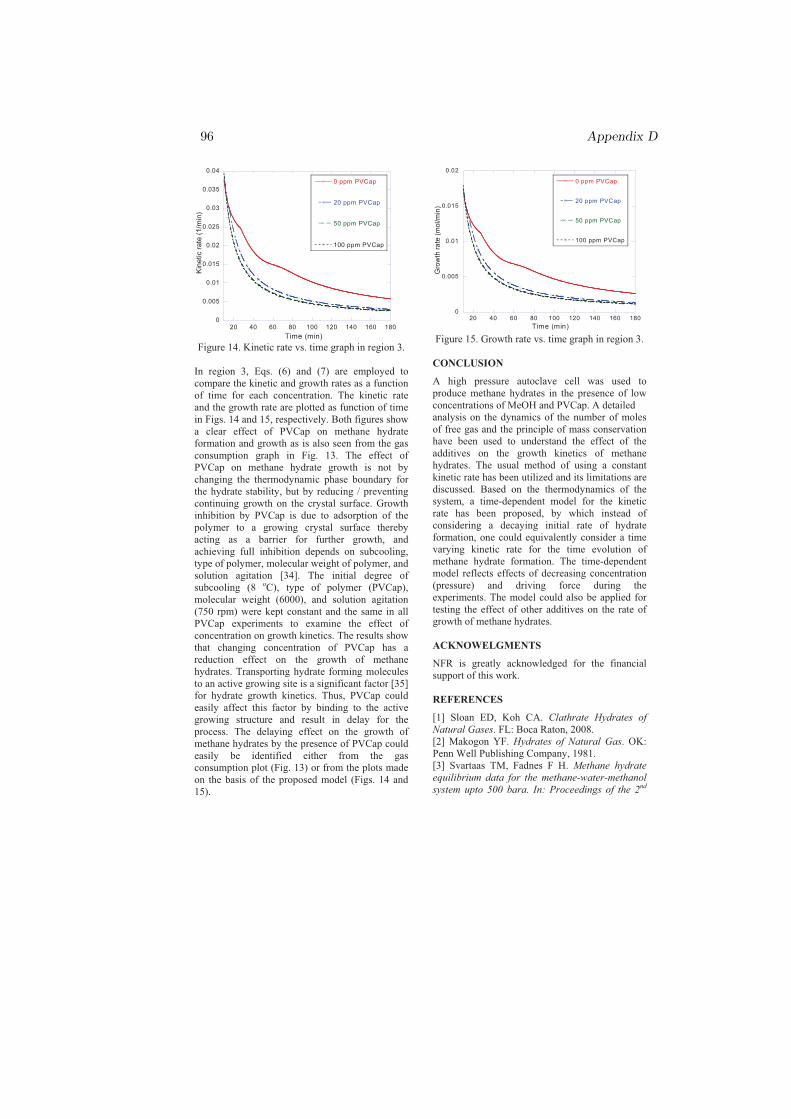
96 Appendix D
0
0.005
0.01
0.015
0.02
0.025
0.03
0.035
0.04
20 40 60 80 100 120 140 160 180
0 ppm PVCap
20 ppm PVCap
50 ppm PVCap
100 ppm PVCap
Kin
etic
rate
(1/m
in)
Time (min) Figure 14. Kinetic rate vs. time graph in region 3.
In region 3, Eqs. (6) and (7) are employed to compare the kinetic and growth rates as a function of time for each concentration. The kinetic rate and the growth rate are plotted as function of time in Figs. 14 and 15, respectively. Both figures show a clear effect of PVCap on methane hydrate formation and growth as is also seen from the gas consumption graph in Fig. 13. The effect of PVCap on methane hydrate growth is not by changing the thermodynamic phase boundary for the hydrate stability, but by reducing / preventing continuing growth on the crystal surface. Growth inhibition by PVCap is due to adsorption of the polymer to a growing crystal surface thereby acting as a barrier for further growth, and achieving full inhibition depends on subcooling, type of polymer, molecular weight of polymer, and solution agitation [34]. The initial degree of subcooling (8 oC), type of polymer (PVCap), molecular weight (6000), and solution agitation (750 rpm) were kept constant and the same in all PVCap experiments to examine the effect of concentration on growth kinetics. The results show that changing concentration of PVCap has a reduction effect on the growth of methane hydrates. Transporting hydrate forming molecules to an active growing site is a significant factor [35] for hydrate growth kinetics. Thus, PVCap could easily affect this factor by binding to the active growing structure and result in delay for the process. The delaying effect on the growth of methane hydrates by the presence of PVCap could easily be identified either from the gas consumption plot (Fig. 13) or from the plots made on the basis of the proposed model (Figs. 14 and 15).
0
0.005
0.01
0.015
0.02
20 40 60 80 100 120 140 160 180
0 ppm PVCap
20 ppm PVCap
50 ppm PVCap
100 ppm PVCap
Gro
wth
rate
(mol
/min
)
Time (min) Figure 15. Growth rate vs. time graph in region 3.
CONCLUSION
A high pressure autoclave cell was used to produce methane hydrates in the presence of low concentrations of MeOH and PVCap. A detailed analysis on the dynamics of the number of moles of free gas and the principle of mass conservation have been used to understand the effect of the additives on the growth kinetics of methane hydrates. The usual method of using a constant kinetic rate has been utilized and its limitations are discussed. Based on the thermodynamics of the system, a time-dependent model for the kinetic rate has been proposed, by which instead of considering a decaying initial rate of hydrate formation, one could equivalently consider a time varying kinetic rate for the time evolution of methane hydrate formation. The time-dependent model reflects effects of decreasing concentration (pressure) and driving force during the experiments. The model could also be applied for testing the effect of other additives on the rate of growth of methane hydrates.
ACKNOWELGMENTS
NFR is greatly acknowledged for the financial support of this work.
REFERENCES
[1] Sloan ED, Koh CA. Clathrate Hydrates of Natural Gases. FL: Boca Raton, 2008. [2] Makogon YF. Hydrates of Natural Gas. OK: Penn Well Publishing Company, 1981. [3] Svartaas TM, Fadnes F H. Methane hydrate equilibrium data for the methane-water-methanol system upto 500 bara. In: Proceedings of the 2nd
Paper IV 97
International Offshore and Polar Engineering Conference, San Francisco, 1992. [4] Yousif M, Austvik T, Berge L, Lysne D. The effects of low concentration methanol on hydrate formation. In: Proceedings of the 2nd International Conference on Natural Gas Hydrates, Toulouse, 1996. [5] Bobev S, Tait KT. Methanol-inhibitor or promoter of the formation of gas hydrates from deuterated ice? Am. Mineral 2004; 89: 1208-1214. [6] Abay HK, Svartaas TM. Effect of ultralow concentration of methanol on methane hydrate formation. Energy Fuels 2010; 24: 752-757. [7] Kelland MA. History of the development of low dosage hydrate inhibirors. Energy Fuels 2006; 20: 825-847. [8] Karaaslan U, Parlaktuna M. Surfactants as hydrate promoters? Energy Fuels 2000; 14: 1103-1107. [9] Karaaslan U, Parlaktuna M. PEO-a new hydrate inhibitor polymer. Energy Fuels 2002; 16: 1387-1391. [10] Karaaslan U, Parlaktuna M. Promotion effect of polymers and surfactants on hydrate formation rate. Energy Fuels 2002; 16: 1413-1416. [11] Kuji Y, Yamasaki A, Yanagisawa Y. Effect of cyclodextrins on hydrate formation rates. Energy Fuels 2006; 20: 2198-2201. [12] Vysniauskas A, Bishnoi PR. A kinetic study of methane hydrate formation. Chem. Eng. Sci. 1983; 38: 1061-1072. [13] Happel J, Hnatow MA, Meyer H. The study of separation of nitrogen from methane by hydrate formation using a novel apparatus. Ann. N.Y. Acad. Sci. 1994; 715: 412-424. [14] Parlaktuna M, Gudmundsson J. Formation rate of methane and mixture hydrate. In: Proceedings of the 2nd International Conference on Natural Gas Hydrates, Toulouse, 1996. [15] Makogon YF, Makogon TY, Holditch SA. Several aspects of the kinetics and morphology of gas hydrates. In: Proceedings of the Japan National Oil Conference, Japan, 1998. [16] Freer EM, Selim MS, Sloan ED. Methane hydrate film growth kinetics. Fluid Phase Equilibria 2001; 185: 65-75. [17] Tayer CJ, Miller KT, Koh CA, Sloan ED. Macroscopic investigation of hydrate film growth at the hydrocarbon/water interface. In:Proceedings of the 6th International Conference on Gas Hydrates, Vancouver, 2008.
[18] Peng BZ, Chen GJ, Sun CY, Yang LY, Luo H. Is the gas hydrate film growth controlled by intrinsic kinetic or heat transfer? In: Proceedings of the 6th International Conference on Gas Hydrates, Vancouver, 2008. [19] Turner D, Boxall J, Yang S, Kleehamer D, Koh C, Miller K, Sloan ED, Xu Z, Mathews P, Tally L. Development of a hydrate kinetic model and its incorporation into the OLGA2000 transient multiphase flow simulator. In: Proceedings of the Fifth International Conference on Gas Hydrates, Trondheim, 2005. [20] Varaminian F. The role of heat transfer in kinetics of hydrate formation. In: Proceedings of the Fourth International Conference on Gas Hydrates, Yokohama, 2002. [21] Englezos P. Kinetics of gas hydrate formation and kinetic inhibition in offshore oil and gas operations. In: Proceedings of the Fifth International Offshore and Polar Engineering Conference, the Hague, 1995. [22] Ribeiro CP, Lage PLC. Modelling of hydrate formation kinetics: State-of-the-art and future directions. Chem. Eng. Sci. 2008; 63: 2007-2034. [23] Daimaru T, Kuji Y, Yanagisawa Y, Yamasaki A. Effect of the structure of surfactants on the hydrate formation kinetics of methane and xenon - effect of the carbon chain length. In: Proceedings of the Fifth International Conference on Gas Hydrates, Trondheim, 2005. [24] Okano T, Yanagisawa Y, Yamasaki A. Development of a new method for hydrate formation kinetics measurements – a breakthrough method. In: Proceedings of the Fifth International Conference on Gas Hydrates, Trondheim, 2005. [25] Arjmandi M, Tohidi B, Danesh A, Todd AC. Is subcooling the right driving force for testing low-dosage hydrate inhibitors? Chem. Eng. Sci. 2005; 60: 1313-1321. [26] Englezos P, Kalogerakis NE, Dholabhai PD, Bishnoi PR. Kinetics of formation of methane and ethane gas hydrates. Chem. Eng. Sci. 1987; 42: 2647-2658. [27] Skovborg P, Rasmussen P. A mass transport limited model for the growth of methane and ethane gas hydrates. Chem. Eng. Sci. 1994; 49 (8): 1131-1143. [28] Lekvam K, Ruoff P. A reaction kinetic mechanism for methane hydrate formation in liquid water. J. Am. Chem. Soc. 1993; 115: 8565-8569. [29] Herri J, Gruy F, Cournil M. Kinetics of methane hydrate formation. In: Proceedings of the

98 Appendix D
2nd International Conference on Natural Gas Hydrates, Toulouse, 1996. [30] Chang TM, Dang LX. Liquid-vapor interface of methanol-water mixtures: A molecular dynamics study. J. Phys. Chem. B 2005; 109: 5759-5765. [31] Nord L, Tucker EE, Christian SD. Liquid-vapor equilibrium of dilute aqueous solutions of ethanol and 2-propanol. J. Solution Chem. 1984; 13: 849-867. [32] Chen PC, Huang WL, Stern LA. Methane hydrate synthesis from ice: Influence of pressurization and ethanol on optimizing formation rates and hydrate yield. Energy Fuels 2010; 24: 2390-2403. [33] Lederhos JP, Long JP, Sum A, Christiansen RL, Sloan ED. Effective kinetic inhibitors for natural gas hydrates. Chem. Eng. Sci. 1996; 51: 1221-1229. [34] Larsen R, Knight CA, Sloan ED. Clathrate hydrate growth and inhibition. Fluid Phase Equilibria 1998; 150-151: 353-360. [35] Buch V, Devlin JP, Monreal IA, Cwiklik BJ, Aytemiz NU, Cwiklik L. Clathrate hydrates with hydrogen-bonding guests. Phys. Chem. Chem. Phys. 2009; 11: 10245-10265. [36] Wei Ke, Svartaas TM. Effects of Stirring and Cooling on Methane Hydrate Formation in High-Pressure Isochoric Cell. In: Proceedings of the 7th
International Conference on Gas Hydrates, Edinburgh, 2011.
Appendix E
Paper V
Does PVCap Promote Nucleation of Structure IIHydrate?
By:
Hailu K. Abay, Eirik Hovring and Thor M. Svartaas.
Printed in:
Proceedings of the 7th International Conference on Gas Hydrates, Edinburgh,United Kingdom, July 17-21, 2011.
99

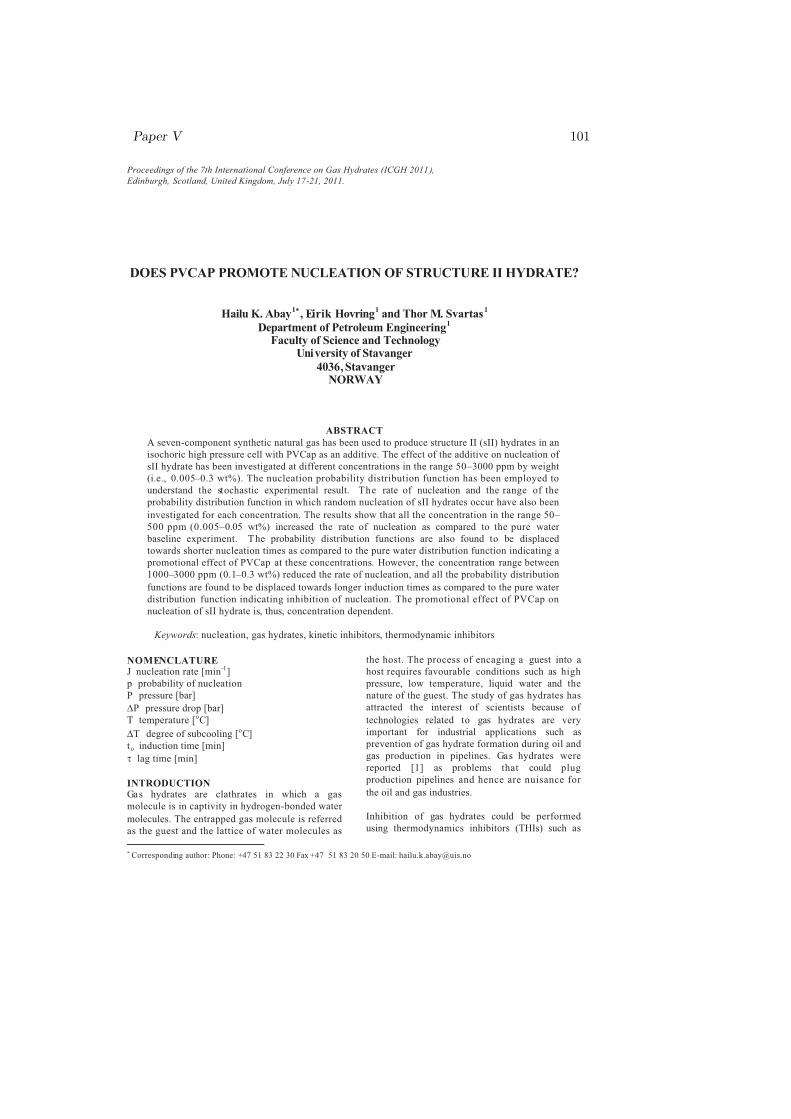
Paper V 101
DOES PVCAP PROMOTE NUCLEATION OF STRUCTURE II HYDRATE?
Hailu K. Abay1!
, Eirik Hovring1
and Thor M. Svartas1
Department of Petroleum Engineering1
Faculty of Science and Technology University of Stavanger
4036, StavangerNORWAY
ABSTRACT
A seven-component synthetic natural gas has been used to produce structure II (sII) hydrates in an
isochoric high pressure cell with PVCap as an additive. The effect of the additive on nucleation of
sII hydrate has been investigated at different concentrations in the range 50–3000 ppm by weight
(i.e., 0.005–0.3 wt%). The nucleation probability distribution function has been employed to
understand the stochastic experimental result. The rate of nucleation and the range of the
probability distribution function in which random nucleation of sII hydrates occur have also been
investigated for each concentration. The results show that all the concentration in the range 50–
500 ppm (0.005–0.05 wt%) increased the rate of nucleation as compared to the pure water
baseline experiment. The probability distribution functions are also found to be displaced
towards shorter nucleation times as compared to the pure water distribution function indicating a
promotional effect of PVCap at these concentrations. However, the concentration range between
1000–3000 ppm (0.1–0.3 wt%) reduced the rate of nucleation, and all the probability distribution
functions are found to be displaced towards longer induction times as compared to the pure water
distribution function indicating inhibition of nucleation. The promotional effect of PVCap on
nucleation of sII hydrate is, thus, concentration dependent.
Keywords: nucleation, gas hydrates, kinetic inhibitors, thermodynamic inhibitors
! Corresponding author: Phone: +47 51 83 22 30 Fax +47 51 83 20 50 E-mail: [email protected]
NOMENCLATUREJ nucleation rate [min-1]
p probability of nucleation
P pressure [bar]
∀P pressure drop [bar]
T temperature [oC]
∀T degree of subcooling [oC]
to induction time [min]
# lag time [min]
INTRODUCTIONGas hydrates are clathrates in which a gas
molecule is in captivity in hydrogen-bonded water
molecules. The entrapped gas molecule is referred
as the guest and the lattice of water molecules as
the host. The process of encaging a guest into a
host requires favourable conditions such as high
pressure, low temperature, liquid water and the
nature of the guest. The study of gas hydrates has
attracted the interest of scientists because of
technologies related to gas hydrates are very
important for industrial applications such as
prevention of gas hydrate formation during oil and
gas production in pipelines. Gas hydrates were
reported [1] as problems that could plug
production pipelines and hence are nuisance for
the oil and gas industries.
Inhibition of gas hydrates could be performed
using thermodynamics inhibitors (THIs) such as
Proceedings of the 7th International Conference on Gas Hydrates (ICGH 2011),
Edinburgh, Scotland, United Kingdom, July 17-21, 2011.

102 Appendix E
methanol or kinetic hydrate inhibitors (KHIs) such
as polyvinylcaprolactum (PVCap). PVCap belongs
to the class of low dosage hydrate inhibitors
(LDHIs). A comprehensive review [2] on the
history of LDHIs was given previously. THIs
inhibit hydrate formation by shifting the
equilibrium curve from right to left allowing a
narrow region for hydrate formation, whereas,
KHIs like PVCap inhibit hydrate formation by
slowing down the growth of hydrate crystal by
attaching to an active growing site [3, 4]. In this
paper, we investigate the effect of PVCap on the
nucleation of structure II (sII) hydrates produced
from a seven-component synthetic natural gas
(SNG7). The molar composition of SNG7 is
shown in Table 1. The concentration of the PVCap
was varied at the same experimental conditions,
and the rate of nucleation was calculated for each
concentration by employing the probability
distribution function.
Component of
SNG7
Composition
in mol%
CH4 Methane 80.40
C2H6 Ethane 10.30
C3H8 Propane 5.0
i-C4H10 i-butane 1.65
n-C4H10 n-butane 0.72
CO2 Carbon
dioxide
1.82
N2 Nitrogen 0.11
Table 1. Composition of SNG7 used for studying
the effect of PVCap on the nucleation of sII
hydrates.
The nucleation probability distribution function is
given by [5-10]
)( 01)(#∃∃
∃%tJ
etp (1)
where p(t) is the probability to measure an
induction time, to, between zero and time t, J is the
rate of nucleation per unit volume, and # is the lag
time. The measured induction times are stochastic
and such nondeterministic problems of nucleation
kinetics could only be approached using
probability distribution functions. The following
section discusses the experimental section used
and how the induction time was measured.
EXPERIMENAL METHODSEx perimental setup: Figure 1 illustrates the high-
pressure experimental setup we used for the
investigation of the effect of PVCap on the
nucleation of sII hydrate kinetics. The cylindrical
cell was made of titanium with inner volume of
145 mL. 50 mL of the cell volume was filled with
distilled water (DIW) with PVCap in solution. The
rest 95 mL of the cell volume was filled with
SNG7. The system (DIW with PVCap and SNG7)
had a direct contact with a cooling cap by which
the system is allowed to cool to a desired
experimental temperature. The temperature profile
was controlled by the refrigerated and heating
circulator with interfaced temperature control unit.
The cell was equipped with a stirrer blade that is
connected to a magnet house in the bottom end
piece via an axle. A stirring rate of 750 rpm was
used for all experiments of PVCap including the
pure water base line experiments.
Figure 1. High-pressure experimental setup.
Ex perimental procedure : Dry powder PVCap of
molecular weight 6000 (Mw, weight average) was
dissolved in DIW at concentrations of 50, 100,
500, 1000, 2000, and 3000 ppm. 0 ppm DIW
experiments were considered as the baseline for
comparison. The lower part of the cell was filled
with PVCap in solution and the upper part of the
cell with 99 bar of SNG7. The system temperature
was then cooled from an initial temperature of 22 oC down to 9 oC. At a temperature of 9 oC, a

Paper V 103
corresponding pressure of 90 bars was attained as
the operating pressure before onset of hydrate
formation. The corresponding sub-cooling at the
experimental conditions was approx. 12 °C. The
cooling rate used was 8.3 oC/h. The path from
point A to point C of Figure 2 shows this cooling
sequence. After attaining a stable temperature and
pressure at point C, cell agitation is introduced by
start of stirring. From point C to E the figure
shows the PT path during hydrate formation. A
pressure drop of 28.5 bar was observed in this
specific experiment which could estimate the
amount of hydrate formation as pressure drop is
directly proportional to the amount of gas
consumed from the real gas equation.
Figure 2. Pressure versus temperature graph
during nucleation and growth of sII hydrate.
At point C, the system takes some time before
onset of hydrate growth. The time taken by the
system from the start of stirring to the onset of
hydrate formation is called the induction time.
This induction time has been measured by plotting
the gas consumption and temperature as a function
of time from the start of the experiment to the end.
Figure 3 shows the gas consumption and
temperature plots as a function of time. The inset
of the figure shows how the induction time is
determined from the temperature pulse of the
system during onset of hydrate formation. The
temperature pulse confirms that hydrate formation
is an exothermic reaction releasing energy as a
form of heat during hydrate formation. This
released energy is measured by the temperature
sensor in the gas phase. The gas consumption plot
in the figure also shows some gas release by a
negative peak on the gas consumption curve right
after onset. This phenomenon was observed for all
experiments and we do not have a clear
explanation for why the system releases gas
immediately after onset.
Figure 3. Gas consumption and temperature
response plots during onset of sII hydrate
formation.
RESULTS AND DISCUSSION
The experimental data points have been fitted with
the theoretical probability distribution function
given by Eq. (1). The results are plotted in two
figures, Figures 4 and 5. Figure 4 shows the
probability distribution versus induction time for
the PVCap concentration in the range 0 – 500 ppm
And Figure 5 shows results for experiments with
PVCap in the range 1000 to 3000 ppm. The 0 ppm
is the base line for comparison and the same
baseline curve has been used in Figures 4 and 5.
As shown in Fig. 4, all the PVCap concentrations
less than 500 ppm are found to the left of the pure
water base line curve. Such shift to the left of the
reference experiment shows that all the induction
times are found in the shorter induction time
region. Table 2 shows the estimated nucleation
rate and lag time from the theoretical probability
distribution function. From the Table, it is shown
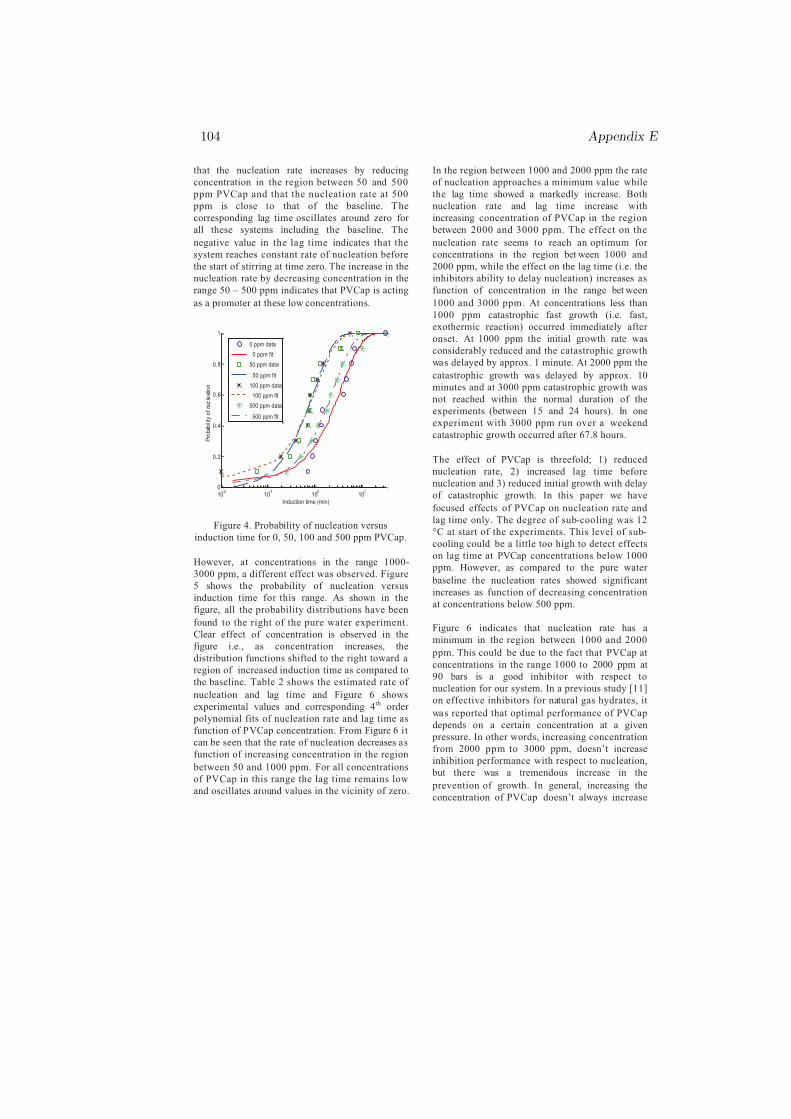
104 Appendix E
that the nucleation rate increases by reducing
concentration in the region between 50 and 500
ppm PVCap and that the nucleation rate at 500
ppm is close to that of the baseline. The
corresponding lag time oscillates around zero for
all these systems including the baseline. The
negative value in the lag time indicates that the
system reaches constant rate of nucleation before
the start of stirring at time zero. The increase in the
nucleation rate by decreasing concentration in the
range 50 – 500 ppm indicates that PVCap is acting
as a promoter at these low concentrations.
10-2
10-1
100
101
0
0.2
0.4
0.6
0.8
1
Induction time (min)
Pro
bab
ility
of
nuc
leat
ion
0 ppm data
0 ppm fit
50 ppm data
50 ppm fit
100 ppm data
100 ppm fit
500 ppm data
500 ppm fit
Figure 4. Probability of nucleation versus
induction time for 0, 50, 100 and 500 ppm PVCap.
However, at concentrations in the range 1000-
3000 ppm, a different effect was observed. Figure
5 shows the probability of nucleation versus
induction time for this range. As shown in the
figure, all the probability distributions have been
found to the right of the pure water experiment.
Clear effect of concentration is observed in the
figure i.e., as concentration increases, the
distribution functions shifted to the right toward a
region of increased induction time as compared to
the baseline. Table 2 shows the estimated rate of
nucleation and lag time and Figure 6 shows
experimental values and corresponding 4th order
polynomial fits of nucleation rate and lag time as
function of PVCap concentration. From Figure 6 it
can be seen that the rate of nucleation decreases as
function of increasing concentration in the region
between 50 and 1000 ppm. For all concentrations
of PVCap in this range the lag time remains low
and oscillates around values in the vicinity of zero.
In the region between 1000 and 2000 ppm the rate
of nucleation approaches a minimum value while
the lag time showed a markedly increase. Both
nucleation rate and lag time increase with
increasing concentration of PVCap in the region
between 2000 and 3000 ppm. The effect on the
nucleation rate seems to reach an optimum for
concentrations in the region bet ween 1000 and
2000 ppm, while the effect on the lag time (i.e. the
inhibitors ability to delay nucleation) increases as
function of concentration in the range bet ween
1000 and 3000 ppm. At concentrations less than
1000 ppm catastrophic fast growth (i.e. fast,
exothermic reaction) occurred immediately after
onset. At 1000 ppm the initial growth rate was
considerably reduced and the catastrophic growth
was delayed by approx. 1 minute. At 2000 ppm the
catastrophic growth was delayed by approx. 10
minutes and at 3000 ppm catastrophic growth was
not reached within the normal duration of the
experiments (between 15 and 24 hours). In one
experiment with 3000 ppm run over a weekend
catastrophic growth occurred after 67.8 hours.
The effect of PVCap is threefold; 1) reduced
nucleation rate, 2) increased lag time before
nucleation and 3) reduced initial growth with delay
of catastrophic growth. In this paper we have
focused effects of PVCap on nucleation rate and
lag time only. The degree of sub-cooling was 12
°C at start of the experiments. This level of sub-
cooling could be a little too high to detect effects
on lag time at PVCap concentrations below 1000
ppm. However, as compared to the pure water
baseline the nucleation rates showed significant
increases as function of decreasing concentration
at concentrations below 500 ppm.
Figure 6 indicates that nucleation rate has a
minimum in the region between 1000 and 2000
ppm. This could be due to the fact that PVCap at
concentrations in the range 1000 to 2000 ppm at
90 bars is a good inhibitor with respect to
nucleation for our system. In a previous study [11]
on effective inhibitors for natural gas hydrates, it
was reported that optimal performance of PVCap
depends on a certain concentration at a given
pressure. In other words, increasing concentration
from 2000 ppm to 3000 ppm, doesn’t increase
inhibition performance with respect to nucleation,
but there was a tremendous increase in the
prevention of growth. In general, increasing the
concentration of PVCap doesn’t always increase
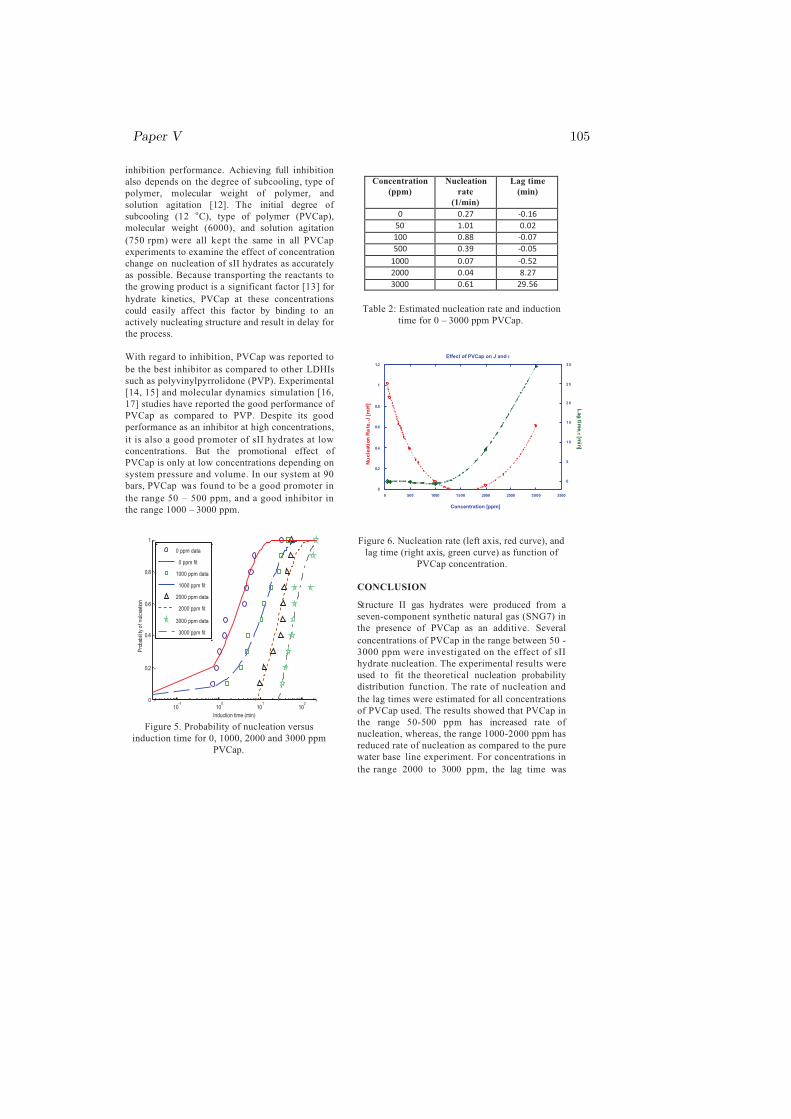
Paper V 105
inhibition performance. Achieving full inhibition
also depends on the degree of subcooling, type of
polymer, molecular weight of polymer, and
solution agitation [12]. The initial degree of
subcooling (12 oC), type of polymer (PVCap),
molecular weight (6000), and solution agitation
(750 rpm) were all kept the same in all PVCap
experiments to examine the effect of concentration
change on nucleation of sII hydrates as accurately
as possible. Because transporting the reactants to
the growing product is a significant factor [13] for
hydrate kinetics, PVCap at these concentrations
could easily affect this factor by binding to an
actively nucleating structure and result in delay for
the process.
With regard to inhibition, PVCap was reported to
be the best inhibitor as compared to other LDHIs
such as polyvinylpyrrolidone (PVP). Experimental
[14, 15] and molecular dynamics simulation [16,
17] studies have reported the good performance of
PVCap as compared to PVP. Despite its good
performance as an inhibitor at high concentrations,
it is also a good promoter of sII hydrates at low
concentrations. But the promotional effect of
PVCap is only at low concentrations depending on
system pressure and volume. In our system at 90
bars, PVCap was found to be a good promoter in
the range 50 – 500 ppm, and a good inhibitor in
the range 1000 – 3000 ppm.
10-1
100
101
102
0
0.2
0.4
0.6
0.8
1
Induction time (min)
Pro
bab
ility
of
nul
cea
tion
0 ppm data
0 ppm fit
1000 ppm data
1000 ppm fit
2000 ppm data
2000 ppm fit
3000 ppm data
3000 ppm fit
Figure 5. Probability of nucleation versus
induction time for 0, 1000, 2000 and 3000 ppm
PVCap.
Concentration
(ppm)
Nucleation
rate
(1/min)
Lag time
(min)
0 0.27 -0.16
50 1.01 0.02
100 0.88 -0.07
500 0.39 -0.05
1000 0.07 -0.52
2000 0.04 8.27
3000 0.61 29.56
Table 2: Estimated nucleation rate and induction
time for 0 – 3000 ppm PVCap.
0
0.2
0.4
0.6
0.8
1
1.2
0
5
10
15
20
25
30
0 500 1000 1500 2000 2500 3000 3500
Effect of PVCap on J and #
Nu
cle
ati
on
Ra
te, J [
min-1
]
Lag tim
e, #
[min
]
Concentration [ppm]
Figure 6. Nucleation rate (left axis, red curve), and
lag time (right axis, green curve) as function of
PVCap concentration.
CONCLUSION
Structure II gas hydrates were produced from a
seven-component synthetic natural gas (SNG7) in
the presence of PVCap as an additive. Several
concentrations of PVCap in the range between 50 -
3000 ppm were investigated on the effect of sII
hydrate nucleation. The experimental results were
used to fit the theoretical nucleation probability
distribution function. The rate of nucleation and
the lag times were estimated for all concentrations
of PVCap used. The results showed that PVCap in
the range 50-500 ppm has increased rate of
nucleation, whereas, the range 1000-2000 ppm has
reduced rate of nucleation as compared to the pure
water base line experiment. For concentrations in
the range 2000 to 3000 ppm, the lag time was

106 Appendix E
considerably increased as compared to the DIW
base and all lower concentrations of PVCap. This
leads to the conclusion that PVCap at low
concentration promotes sII hydrate nucleation but
at higher concentrations it inhibits. Thus, the
promotional effect of PVCap on sII hydrate
nucleation is concentration dependent.
ACKNOWELGMENTS
NFR is greatly acknowledged for the financial
support of this work.
REFERENCES
[1] Hammershmidt EG. Formation of Gas
Hydrates in Natural Gas Transmission Lines. Ind.
Eng. Chem. 1934; 26: 851-855.
[2] Kelland MA. History of the development of low
dosage hydrate inhibirors. Energy Fuels 2006; 20:
825-847.
[3] Sloan E D, Koh CA. Clathrate Hydrates of
Natural Gases. FL: Boca Raton, 2008.
[4] Larsen R, Knight CA, Sloan ED. Clathrate
Hydrate Growth and Inhibition. Fluid Phase
Equilibria 1998; 150-151: 353-360.
[5] Toschev S, Milchev A, Stoyanov SJ. On Some
Probabilistic Aspects of the Nucleation Process.
Cryst. Growth 1972; 13/14: 123-127.
[6] Tsuchiyama A. Crystallization Kinetics in the
System CaMgSi2O6-CaAl2Si2O8: the delay in
nucleation of diopside and anorthite. Am. Mineral
1983; 68: 687-698.
[7] Takeya S, Hori A, Hondoh T , Uchida T.
Freezing-Memory Effect of Water on Nulceation of
CO2 Hydrate Crystals. J. Phys. Chem. B. 2000;
104 (17): 4164-4168.
[8] Abay HK, Svartaas TM. Effect of Ultralow
Concentration of Methanol on Methane Hydrate
Formation. Energy Fuels 2010; 24: 752-757.
[9] Jiang S, Ter Host JH. Crystal Nucleation Rates
from Probability Distributions of Induction Times.
J. Cryst. Gro wth Des. 2011; 11: 256-261.
[10] Abay HK, Svartaas TM. Multicomponent Gas
Hydrate Nucleation: The Effect of the Cooling
Rate and Composition. Energy Fuels 2011; 25: 42-
51.
[11] Lederhos JP, Long JP, Sum A, Christiansen
RL, Sloan ED. Effective kinetic inhibitors for
natural gas hydrates. Chem. Eng. Sci. 1996; 51:
1221-1229.
[12] Larsen R, Knight CA, Sloan ED. Clathrate
hydrate growth and inhibition. Fluid Phase
Equilibria 1998; 150-151: 353-360.
[13] Buch V, Devlin JP, Monreal IA, Cwiklik BJ,
Aytemiz NU, Cwiklik L. Clathrate hydrates with
hydrogen-bonding guests. Phys. Chem. Chem.
Phys. 2009; 11: 10245-10265.
[14] Zeng H, Lu H, Huva E, Walker VK,
Ripmeester JA. Differences in nucleator
adsorption may explain distinct inhibition
activities of two gas hydrate kinetic inhibitors.
Chem. Eng. Sci. 2008; 63: 4026-4029.
[15] Zhang JS, Lo C, Couzis A, Somasundaran P,
Wu J, Lee JW. Adsorption of kinetic inhibitors on
clathrate hydrates. J. Phys. Chem. C 2009; 113:
17418-17420.
[16] Kvamme B, Kuznetsova T, Aasoldsen K.
Molecular dynamics simulations for selection of
kinetic hydrate inhibitors. J. Mol. Graphics and
Modeling 2005; 23: 524-536.
[17] Anderson BJ, Tester JW, Borghi GP, Trout
BL. Properties of inhibitors of methane hydrate
formation via molecular dynamics simulations. J.
Am. Chem. Soc. 2005; 127: 17852-17862.

Appendix F
Paper VI
The Effect of PVCap on Methane Hydrate Nucleationand Growth
By:
Hailu K. Abay, Jonas Hovland and Thor M. Svartaas.
Printed in:
Proceedings of the 7th International Conference on Gas Hydrates, Edinburgh,United Kingdom, July 17-21, 2011.
107


Paper VI 109
THE EFFECT OF PVCAP ON METHANE HYDRATE NUCLEATION AND GROWTH
Hailu K. Abay1!, Jonas Hovland 1 and Thor M. Svartas1
Department of Petroleum Engineering1
Faculty of Science and Technology University of Stavanger
4036, Stavanger NORWAY
ABSTRACT PVCap is a kinetic hydrate inhibitor which has recently attracted many researchers as it is an alternative
method to the conventional thermodynamic inhibitors such as MeOH and MEG. Six different
concentrations of PVCap in the range 20 to 2000 ppm (i.e. 0.002 to 0.2 wt %) were used to investigate the
effect on both nucleation and growth of sI hydrate. The hydrates were formed at 90 bars from a pure
methane gas (99.9995 %) and distilled water in an isochoric high pressure cell. The probability distribution
function and the real gas equation have been used to investigate the effect on nucleation and growth during
hydrate formation, respectively. The results show that PVCap has a clear effect on growth based on
concentration. However, its effect on the nucleation was not found to be concentration dependent as
promotional and inhibition effects were observed which were not as a function of concentration. This could
possibly be due to the random phenomenon of newly born critical nuclei in the aqueous phase that could
easily attract the PVCap during the nucleation process.
Keywords: gas hydrates, nucleation, growth, kinetic inhibitors, thermodynamic inhibitors
! Corresponding author: Phone: +47 51 83 22 30 Fax +47 51 83 20 50 E-mail: [email protected]
NOMENCLATURE J nucleation rate [min-1]
"n amount of hydrates formed [mol]
p probability of nucleation
P pressure [bar]
"P pressure drop [bar]
T temperature [oC]
"T degree of subcooling [oC]
to induction time [min]
# lag time [min]
INTRODUCTIONPolyvinylcaprolactum (PVCap) is a water-soluble
polymer which has been used as a kinetic hydrate
inhibitor (KHI). KHIs belong to the class of low-
dosage hydrate inhibitors (LDHIs) that have been
in commercial use in the oil and gas industry for
more than a decade [1]. KHIs work by delaying
hydrate nucleation and crystal growth so that there
will be plenty of time to transport the hydrate
forming fluid to the process facilities before
hydrates nucleate, grow and plug the pipeline.
PVCap, as one of the most effective KHI, prevents
hydrate growth by attaching to a growing crystal
surface and preventing further growth. The
pendant group of PVCap is very important in
achieving strong adsorption [2]. Molecular
dynamics simulation studies [3] on selection of
kinetic hydrate inhibitors also indicated that the
active inhibitor molecules of PVCap that attaches
themselves to the hydrate surface are the double-
bonded oxygens, the hydroxyle groups, and the
nitrogen. Figure 1 shows the chemical structure of
PVCap possessing all the inhibitor molecules. A
Proceedings of the 7th International Conference on Gas Hydrates (ICGH 2011),
Edinburgh, Scotland, United Kingdom, July 17-21, 2011.

110 Appendix F
seven-member lactam ring is attached to a carbon
backbone. The lactam ring is characterized by an
amide group (-N-C=O) which protrudes from the
polymeric backbone. In another study [4] on the
adsorption of KHIs on clathrate hydrates, PVCap
was also reported as a more effective inhibitor by
reducing the diffusion of hydrate formers (gases)
from the bulk phase to the hydrate surface where
the hydrate growth prefers to proceed.
Figure 1. Chemical structure of PVCap.
The inhibition effect of PVCap on hydrate growth
has been reported extensively as discussed above,
whereas the effect on nucleation was not addressed
adequately. In this paper we address the effect of
PVCap on the nucleation of methane hydrate. In
addition to the major focus on nucleation, the
effect of PVCap on the total growth of methane
hydrates has been also investigated. The data on
the effect of PVCap on the total growth of
methane hydrate has been analysed by employing
the real gas equation. From the real gas equation,
one can easily derive the direct relationship
between the amount of hydrates formed and the
pressure drop in the system as
(1)
where n is the amount of gas consumed when
hydrates form, V is the gas volume, z is the
compressibility factor, R is the universal gas
constant, T is the experimental temperature, and
P is the measured experimental pressure drop
caused by hydrate formation. Equation (1) could
be used to estimate the amount of hydrates formed
in an isochoric system [5] by assuming that V/zRT
is a constant of proportionality that does not vary
much for all PVCap experiments. For the analysis
of the data to investigate the effect of PVCap on
the nucleation of sI hydrates, the classical theory
of nucleation has been employed. According to
this theory, the nucleation probability distribution
function is given by [5-10]
(2)
where p(t) is the probability to obtain an induction
time equal with or less than the measured time, to,
between time zero and time t. J is nucleation rate
per unit volume, and ! is the lag time. For the
nucleation stage of the process induction time was
the major parameter, and for the growth the
amount of gas consumed, measured from the
pressure drop reading, was the main parameter
studied. The following section discusses the
experimental setup and procedure for measuring
induction time and pressure drop in systems in the
presence of PVCap as an additive.
Figure 2. Autoclave cell experimental setup.
EXPERIMENAL METHODS Experimental setup and procedure: The
experimental setup we used for the investigation of
PVCap on the nucleation and growth of sI
hydrates is illustrated in Figure 2. The major
components are the cylindrical cell, the cooling
bath, PC, and gas supply cylinder. The cylindrical
cell, with inner volume of 145 mL, was used in
holding the hydrate forming fluid - distilled water
(DIW) and PVCap. PVCap, dry powder with
molecular weight 6000, was dissolved in DIW at
concentrations of 0, 20, 50, 100, 500, 1000, and
2000 ppm. Pure DIW system without PVCap in
solution was considered as the baseline for

Paper VI 111
comparison. In each experiment 50 mL of the cell
volume was filled with the actual aqueous solution
leaving 95 mL of the cell volume for pressurized
methane gas (~90 bars).
The methane gas was accessed directly from the
gas supply cylinder whose pressure was controlled
by the pressure gauge on the gas cylinder and by
another external pressure sensor. After mounting
the cell as shown in Figure 2, the cell was charged
with test solution and methane to the desired
pressure and the system was cooled from an initial
temperature of 13.7 °C down to 4 °C with a
cooling rate of 10 °C/h. At 4 °C and 90 bar the
sub-cooling, T, with reference to hydrate
equilibrium is approximately 8 °C. All
experiments were initiated at this degree of sub-
cooling. The temperature profile was controlled by
the refrigerated and heating circulator with
interfaced temperature control unit. Figure 3
shows the pressure versus temperature plot of the
system during the cooling sequence. Point 1 of the
figure represents the initial condition of the
system. This initial temperature was about 1.7 °C
outside the hydrate equilibrium region of the
system at the experimental pressure. The system
crosses hydrate equilibrium at point 2, and from
point 2 to point 3, the system temperature is inside
the hydrate forming region. Once the desired
operating temperature at point 3 was attained by
cooling, cell agitation was introduced by the start
of stirring. The start of stirring was considered as
the start of the experiment. A stirring rate of 750
rpm was used for all experiments of PVCap
including the pure water base line experiments.
40
50
60
70
80
90
1.0E+2
2.00 4.00 6.00 8.00 10.0 12.0 14.0
Pre
ssur
e (b
ar)
Temperature (°C)
P3-P
5 = 49.20 bar
12
3
4
5
Figure 3. Pressure versus temperature curve
during nucleation and growth of sI hydrate.
At point 3, the system may take some time before
onset for hydrate formation occurred. Path 3-4-5
shows the hydrate growth region after onset and
between points 3 and 4 along this path, the system
couldn’t restore the operating temperature of the
cooling bath because hydrate formation is a fast
exothermic reaction releasing heat energy in this
section of the experiment. But the system recovers
its operating temperature after a while as indicated
by path 4-5. The pressure drop from point 3 to
point 5 (49.2 bar in this specific graph) has been
used to estimate the amount of hydrates formed in
the presence of different concentrations of PVCap
in accordance with Equation (1). The effect of the
additive on the nucleation time was measured at
point 3 prior to hydrate formation and growth.
Figure 4 shows the gas consumption and
temperature as a function of time from the start of
the experiment to the end. During the first step, the
gas consumption plot shows a very fast gas intake
because of methane gas molecules leaving the gas
phase and entering into the liquid phase and filling
sI hydrate cavities. This fast growth period is
followed by a slow growth period where the
system continues to build up gas hydrates slowly.
0.0
10
20
30
40
50
4
6
8
10
12
14
0.00 1.00E+3 2.00E+3 3.00E+3 4.00E+3
Temperature (°C
)
Time (min)
Gas
con
sum
ptio
n (b
ar)
Figure 4. Gas consumption and temperature plots
from the start of the experiment to the end
illustrating onset and growth of sI hydrates.
The gas consumption onset, or equivalently
hydrate formation onset, is accompanied by a
temperature pulse. Figure 5 shows the magnified
section of Figure 4 during onset. The induction
time, the time from the start of stirring at time zero
to the onset of hydrate formation (28.12 min in
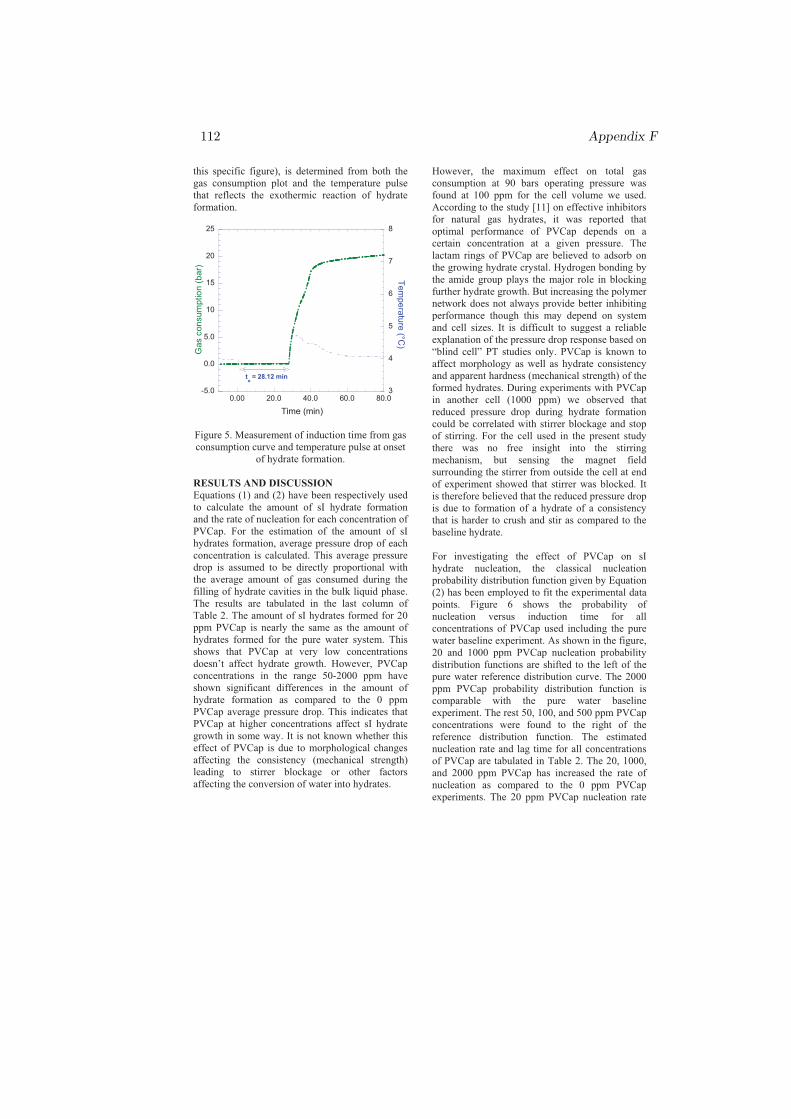
112 Appendix F
this specific figure), is determined from both the
gas consumption plot and the temperature pulse
that reflects the exothermic reaction of hydrate
formation.
-5.0
0.0
5.0
10
15
20
25
3
4
5
6
7
8
0.00 20.0 40.0 60.0 80.0
Gas
con
sum
ptio
n (b
ar)
Temperature (°C
)
Time (min)
to
= 28.12 min
Figure 5. Measurement of induction time from gas
consumption curve and temperature pulse at onset
of hydrate formation.
RESULTS AND DISCUSSION
Equations (1) and (2) have been respectively used
to calculate the amount of sI hydrate formation
and the rate of nucleation for each concentration of
PVCap. For the estimation of the amount of sI
hydrates formation, average pressure drop of each
concentration is calculated. This average pressure
drop is assumed to be directly proportional with
the average amount of gas consumed during the
filling of hydrate cavities in the bulk liquid phase.
The results are tabulated in the last column of
Table 2. The amount of sI hydrates formed for 20
ppm PVCap is nearly the same as the amount of
hydrates formed for the pure water system. This
shows that PVCap at very low concentrations
doesn’t affect hydrate growth. However, PVCap
concentrations in the range 50-2000 ppm have
shown significant differences in the amount of
hydrate formation as compared to the 0 ppm
PVCap average pressure drop. This indicates that
PVCap at higher concentrations affect sI hydrate
growth in some way. It is not known whether this
effect of PVCap is due to morphological changes
affecting the consistency (mechanical strength)
leading to stirrer blockage or other factors
affecting the conversion of water into hydrates.
However, the maximum effect on total gas
consumption at 90 bars operating pressure was
found at 100 ppm for the cell volume we used.
According to the study [11] on effective inhibitors
for natural gas hydrates, it was reported that
optimal performance of PVCap depends on a
certain concentration at a given pressure. The
lactam rings of PVCap are believed to adsorb on
the growing hydrate crystal. Hydrogen bonding by
the amide group plays the major role in blocking
further hydrate growth. But increasing the polymer
network does not always provide better inhibiting
performance though this may depend on system
and cell sizes. It is difficult to suggest a reliable
explanation of the pressure drop response based on
“blind cell” PT studies only. PVCap is known to
affect morphology as well as hydrate consistency
and apparent hardness (mechanical strength) of the
formed hydrates. During experiments with PVCap
in another cell (1000 ppm) we observed that
reduced pressure drop during hydrate formation
could be correlated with stirrer blockage and stop
of stirring. For the cell used in the present study
there was no free insight into the stirring
mechanism, but sensing the magnet field
surrounding the stirrer from outside the cell at end
of experiment showed that stirrer was blocked. It
is therefore believed that the reduced pressure drop
is due to formation of a hydrate of a consistency
that is harder to crush and stir as compared to the
baseline hydrate.
For investigating the effect of PVCap on sI
hydrate nucleation, the classical nucleation
probability distribution function given by Equation
(2) has been employed to fit the experimental data
points. Figure 6 shows the probability of
nucleation versus induction time for all
concentrations of PVCap used including the pure
water baseline experiment. As shown in the figure,
20 and 1000 ppm PVCap nucleation probability
distribution functions are shifted to the left of the
pure water reference distribution curve. The 2000
ppm PVCap probability distribution function is
comparable with the pure water baseline
experiment. The rest 50, 100, and 500 ppm PVCap
concentrations were found to the right of the
reference distribution function. The estimated
nucleation rate and lag time for all concentrations
of PVCap are tabulated in Table 2. The 20, 1000,
and 2000 ppm PVCap has increased the rate of
nucleation as compared to the 0 ppm PVCap
experiments. The 20 ppm PVCap nucleation rate

Paper VI 113
has shown a significant difference from the pure
water base line nucleation rate unlike the 1000 and
2000 ppm PVCap experiments. The 50, 100, and
500 PVCap experiments have reduced the rate of
nucleation from which the 500 PVCap experiment
has shown the significant reduction.
100
101
102
0
0.25
0.5
0.75
1
Induction time (min)
Pro
ba
bili
ty o
f n
uc
lea
tio
n
0 ppm
0 ppm fit
20 ppm PVCap
20 ppm fit
50 ppm PVCap
50 ppm fit
100 ppm PVCap
100 ppm fit
500 ppm PVCap
500 ppm fit
1000 ppm PVCap
1000 ppm fit
2000 ppm PVCap
2000 ppm fit
Figure 6. Probability of nucleation versus
induction time for all concentrations of PVCap.
The time the system takes to attain a constant rate
of nucleation is called the lag time. This lag time is
tabulated in Table 2 for all concentrations of
PVCap used. For the 50 and 500 ppm solutions a
negative lag time as suggested by the analysis
means that nucleation has occurred and a constant
rate of nucleation is reached before start of
stirring. During all experiments the system crosses
the hydrate equilibrium curve approx. 82.5
minutes prior to start of stirring and at -44.1
minutes (i.e., lag time of 500 ppm experiments)
the system is 6 °C inside the hydrate region. A
negative lag time and a low nucleation rate as for
the 50 and 500 ppm experiments means that the
nucleation process may take place over a broad
time span as indicated by the corresponding
graphs.
Concentration(ppm)
Nucleation rate
(1/min)
Lag time (min)
Average P drop (bar)
0 0.11 0. 60 51.43
20 0.94 0.21 51.15
50 0.04 !4.16 42.05
100 0.07 7.80 25.30
500 0.01 !44.1 29.20
1000 0.29 0.28 29.50
2000 0.19 2.74 28.06
Table 2: Estimated nucleation rate, induction time,
and pressure drop for 0 – 2000 ppm PVCap.
The 100 ppm experiments have taken the longest
time to attain a constant rate of nucleation. Both
the lag time and the rate of nucleation have shown
concentration independent effect of PVCap on the
nucleation of the system. This could be due to the
random nucleation phenomenon occurring in the
liquid phase that could easily get the attention of
PVCap upon molecule rearrangement for a cavity.
Hawtin et. al. [12] observed from MD simulation
that long-lived 512-like cage structure did not exist
before the first 51262 cavity was formed. Thus, it
appears that formation of the 51262 cavity is
essential for the methane nucleation process.
Increase in the rate of nucleation in the presence of
additives has also been reported [13] from
molecular dynamics simulation studies on methane
hydrate systems. This study shows that LDHIs
increase the rate of nucleation when crystals are
observed. Once the crystal structures are observed
in the bulk volume, they could easily get the
attention of the additive and the additive starts
promoting the nucleation process. Thus, the
promotional effect of PVCap on the nucleation
phase is primarily dependent on the random
phenomenon of restructuring of water molecules
for a crystal. When stable nuclei are formed, the
inhibitor can block hydrate growth by adsorbing
onto the surface. Thus, the effect on nucleation
and growth is part of different mechanisms.
During our experiments no effect on growth rates
were observed for PVCap concentrations of 100
ppm or below. At 500 ppm the initial growth rate
was considerably reduced over the first 30 seconds
from start of growth. At 1000 ppm the exothermic
fast growth was delayed by 1 minute and at 2000
ppm the catastrophic growth process was delayed

114 Appendix F
by 2 minutes. Thus the effect on the growth of sI
hydrate was found to be concentration dependent.
Unlike the nucleation phase, the growth phase of
methane hydrates require fast transporting of
methane molecules in the active site of the
growing crystal. Such transporting of methane
molecules to the growing crystal is a major
parameter for hydrate kinetics [14]. This major
factor could easily be affected by the presence of
PVCap in the crystal forming region. Subramanian
and Sloan [15] showed the formation of the large
51262 cavity of sI methane hydrate during the post
nucleation growth stage is the time limiting step
and that 200 ppm (i.e., 0.02 wt%) PVCap
significantly reduced the formation of hydrate
cavities, especially the large 51262 cavity. So, on
one hand PVCap may promote methane hydrate
nucleation and on the other hand reduce growth
probably blocking growth sites involved in the
formation of the large 51262 cavity.
CONCLUSION
Methane hydrates were produced in a stirred high
pressure cell apparatus. Polyvinylcaprolactam
(PVCap) has been used to study its effect on both
nucleation and growth of sI hydrates. The real gas
equation and the classical probability distribution
functions have been employed to analyze the
experimental data. The analysis showed that
PVCap has a clear effect on the growth part of
methane hydrate formation depending on
concentration. However, on the nucleation phase
of methane hydrate formation, the promotion or
inhibition effects of PVCap were primarily
dependent on the random nature of newly born
critical nuclei that could make the PVCap start
acting on the system. The latter result was also
supported by molecular dynamics simulation
studies.
ACKNOWELGMENTS
We are thankful to NFR for the financial support
of this work.
REFERENCES
[1] Kelland MA. History of the development of low
dosage hydrate inhibitors. Energy Fuels 2006; 20:
825-847.
[2] Larsen R, Knight CA, Sloan ED. Clathrate
Hydrate Growth and Inhibition. Fluid Phase
Equilibria 1998; 150-151: 353-360.
[3] Kvamme B, Kuznetsova T, Aasoldsen K.
Molecular dynamics simulations for selection of
kinetic hydrate inhibitors. J. Mol. Graphics and
Modeling 2005; 23: 524-536.
[4] Zhang JS, Lo C, Couzis A, Somasundaran P,
Wu J, Lee JW. Adsorption of kinetic inhibitors on
clathrate hydrates. J. Phys. Chem. C 2009; 113:
17418-17420.
[5] Abay HK, Svartaas TM. Effect of Ultralow
Concentration of Methanol on Methane Hydrate
Formation. Energy Fuels 2010; 24: 752-757.
[6] Toschev S, Milchev A, Stoyanov SJ. On Some
Probabilistic Aspects of the Nucleation Process.
Cryst. Growth 1972; 13/14: 123-127.
[7] Tsuchiyama A. Crystallization Kinetics in the
System CaMgSi2O6-CaAl2Si2O8: the delay in
nucleation of diopside and anorthite. Am. Mineral
1983; 68: 687-698.
[8] Takeya S, Hori A, Hondoh T, Uchida T.
Freezing-Memory Effect of Water on Nucleation of
CO2 Hydrate Crystals. J. Phys. Chem. B. 2000;
104 (17): 4164-4168.
[9] Shanfeng J, Joop HTH. Crystal Nucleation
Rates from Probability Distributions of Induction
Times. Cryst. Growth & Design. 2010; Inpress.
[10] Abay HK, Svartaas TM. Multicomponent Gas
Hydrate Nucleation: The Effect of the Cooling
Rate and Composition. Energy Fuels 2011; 25: 42-
51.
[11] Lederhos JP, Long JP, Sum A, Christiansen
RL, Sloan ED. Effective kinetic inhibitors for
natural gas hydrates. Chem. Eng. Sci. 1996; 51:
1221-1229.
[12] Hawtin RW, Quigley D, Rodger PM, Gas
hydrate nucleation and cage formation at a water/methane interface. Phys. Chem. Chem.
Phys. 2008; 10: 4853-4864.
[13] Hawtin JM, Rodger PM. Polydispersity in
Oligomeric Low Dosage Gas Hydrate Inhibitors.
J. Mater. Chem. 2006; 16:1934-1942.
[14] Buch V, Devlin JP, Monreal IA, Cwiklik BJ,
Aytemiz NU, Cwiklik L. Clathrate hydrates with
hydrogen-bonding guests. Phys. Chem. Chem.
Phys. 2009; 11: 10245-10265.
[15] Subramanian S, Sloan ED. Molecular
measurements of methane hydrate formation.
Fluid Phase Equilibria. 1999; 158-160: 813- 820.